1. Introduction
The research on skeletal muscle force is crucial as it can be widely applied in biomechanics, kinesiology and neurophysiology [
1,
2,
3,
4]. The muscle force is produced by muscle fiber contraction as a result of motor unit discharge, and drives to formulate motor functions of body eventually. Electrical activities can be detected simultaneously around the corresponding muscle during muscle force production. Such recorded electrical signal is termed electromyogram (EMG), while surface EMG (sEMG) always specifies the signal recorded via a noninvasive manner using electrodes placed on the skin surface [
4]. In this regard, the muscle force and EMG are regarded as both electrical and mechanical outcomes of muscular activities. Therefore, the relation between EMG and muscle contraction level (described as force or torque alternatively) offers a useful tool for examining muscle functions and deficits, with wide biomedical and biomechanical applications [
3,
5,
6,
7]. Among them, the EMG signals were usually analyzed with time-domain amplitude-associated and frequency-domain parameters including root mean square (RMS), averaged rectified value (ARV), median frequency (MDF) and mean power frequency (MPF) of EMG signal [
8,
9,
10,
11,
12,
13,
14,
15,
16,
17]. Sbriccoli et al. [
8] reported that the RMS of the EMG from biceps muscles showed a curvilinear fashion following the torque increment at different contraction speeds. By contrast, the MDF of signal was found to increase linearly with force, and then it reached a plateau and gradually decreased at large force levels. Karlsson et al. [
9] showed a positive significant linear correlation between the RMS of EMG and the force for three thigh muscles, with very high R-square values ranging from 0.91 to 0.93. In addition, the study by Onishi et al. [
10] suggested a linear correlation between the integrated amplitude of the EMG and the vastus laterals muscle force, but such correlation became very weak when MPF of EMG was used. Bilodeau et al. [
11] found that the RMS amplitude of EMG increased progressively with force in vastus lateralis, rectus femoris and vastus medialis muscles, and the increases in MPF and MDF were also observed.
Investigations into the EMG–force relation reported complex and even contradictory findings. For example, some studies suggested a linear relation between the amplitude of EMG and the force in biceps brachii muscle [
12]. However, more researchers considered that the EMG–force relation was more likely to be nonlinear [
8,
11]. Furthermore, the research findings were significantly different for different muscles. Some researchers considered that a linear relation appeared mainly in small muscles, such as first dorsal interosseous muscle [
13,
14], and a nonlinear relation emerged in large muscles like quadriceps femoris muscle group [
11,
15]. Such the variance might be also caused by underlying motor control mechanisms. Watanabe and Akima [
15] revealed that the neuromuscular activation pattern of individual muscle was one of the main factors altering shape of EMG–force relationship. Specifically, a linear relationship between amplitude of EMG and muscle force up to 50% of MVC is likely to exhibit when the force increment mainly relies on motor unit recruitment. If motor unit firing rate modulation mainly works for further force increase at larger forces, a nonlinear curve can be demonstrated [
16]. Furthermore, the EMG–force relation was found to vary across muscles and individuals, as a typical representative of individual difference in physiological processes. Given such complex findings, recent efforts focus on development of sophisticated methods for modeling muscle force with surface EMG input, including parallel cascade identification (PCI) model [
18], multi-scale physiology-based model [
19], blind source separation [
20] and high-order statistics parameters [
21,
22]. These methods worked well for force estimation under certain conditions.
Considering the nonlinear and non-stationary properties of sEMG, interpreting data with conventional linear time-domain and frequency-domain parameters may unavoidably have limitations. Nonlinear dynamic theory provides an alternative tool for the analysis of EMG signals. There are many analytical parameters for nonlinear complexity analysis, including fractal features [
23] and entropy measures [
24,
25,
26], which have been frequently applied [
23,
24,
25,
27,
28,
29,
30,
31,
32,
33,
34,
35,
36]. Therein, the approximate entropy (ApEn) [
24] and sample entropy (SampEn) [
25] have been widely used for EMG signal [
23,
24,
25,
26,
27,
35,
36]. SampEn is refined on the basis of ApEn, and eliminates the bias and inconsistency for complexity measure. Recently, the fuzzy logic has been introduced into the complexity analysis. Fuzzy entropy (FuzzyEn) [
26], as a representative, has been widely utilized for analysis [
31,
32]. FuzzyEn adopts the fuzzy membership function to replace the Heaviside function for similarity measure, which makes FuzzyEn measure more continuous and smooth. Such advance of FuzzyEn has been confirmed by Chen et al. [
31].
With the above-mentioned considerations, this study re-evaluates the EMG–torque relation in biceps brachii (BB) muscles of healthy subjects, from a novel perspective provided by entropy measures. There have been various studies reporting quantitative analyses using various entropy measures, and most of them suggested that the EMG complexity were somehow regulated by the muscle force [
27,
28,
29,
33,
34,
35]. However, few studies aimed to quantify the relation between EMG complexity and muscle force. Therefore, the SampEn and FuzzyEn are both employed in this study to interpret the recorded sEMG data. Characterization of the EMG–torque relation from a novel point of view by parameterizing sEMG signals in the nonlinear complexity domain other than conventional time domain or frequency domain will help to better understand motor control mechanisms underlying muscular activities, and also provide important guidelines for clinical diagnosis and treatment of neuromuscular disorders. Specifically, the EMG–torque relations characterized by both entropy measures along with the routine RMS amplitude of EMG signal are likely to exhibit different regulations. The resultant different characters of the EMG–torque relation suggest their specific potentials for biomedical and biomechanical applications.
2. Materials and Methods
2.1. Dataset Description
This study involved retrospective data collected in a previous study [
17], which was approved by the Committee for the Protection of Human Subjects at the University of Texas Health Science Center at Houston and Texas Institute for Rehabilitation and Research (TIRR) Memorial Hermann Hospital. This study selected data from the BB muscles of 10 healthy subjects, and their demographic information is listed in
Table 1.
Subjects completed a series of isometric elbow flexion tasks while the forearm of the dominant side was positioned on an equipment with the elbow joint at 90°, the shoulder abducted at 45° and flexed at approximately 30°. The torque sensor was tied tightly by the bandage to the wrist for recording torque; meanwhile, a bipolar EMG electrode was placed on the muscle belly of BB for recording the EMG data. For each subject, the maximal voluntary contraction (MVC) of BB muscle was tested in advance, and all targeted torque levels ranging from 10% to 80% MVC were subsequently determined. During the experiment, all the recorded EMG and the muscle torque signals can be monitored in real time on the screen of a laptop computer. In each trial, the target torque was simultaneously marked on the screen to guide the subject to perform muscle contractions at a desired level by tracing the target torque. The order for the torque level was random. The subject was asked to perform two trials for each torque level, so as to produce a sufficient amount of data. A sufficiently long rest was allowed between two consecutive trials for each subject in order to eliminate the potential effect of mental or muscular fatigue. Finally, the entire dataset used in this study includes data from 16 trials (two trials for each of 8 torque levels) for each subject.
2.2. Data Preprocessing and Segmentation
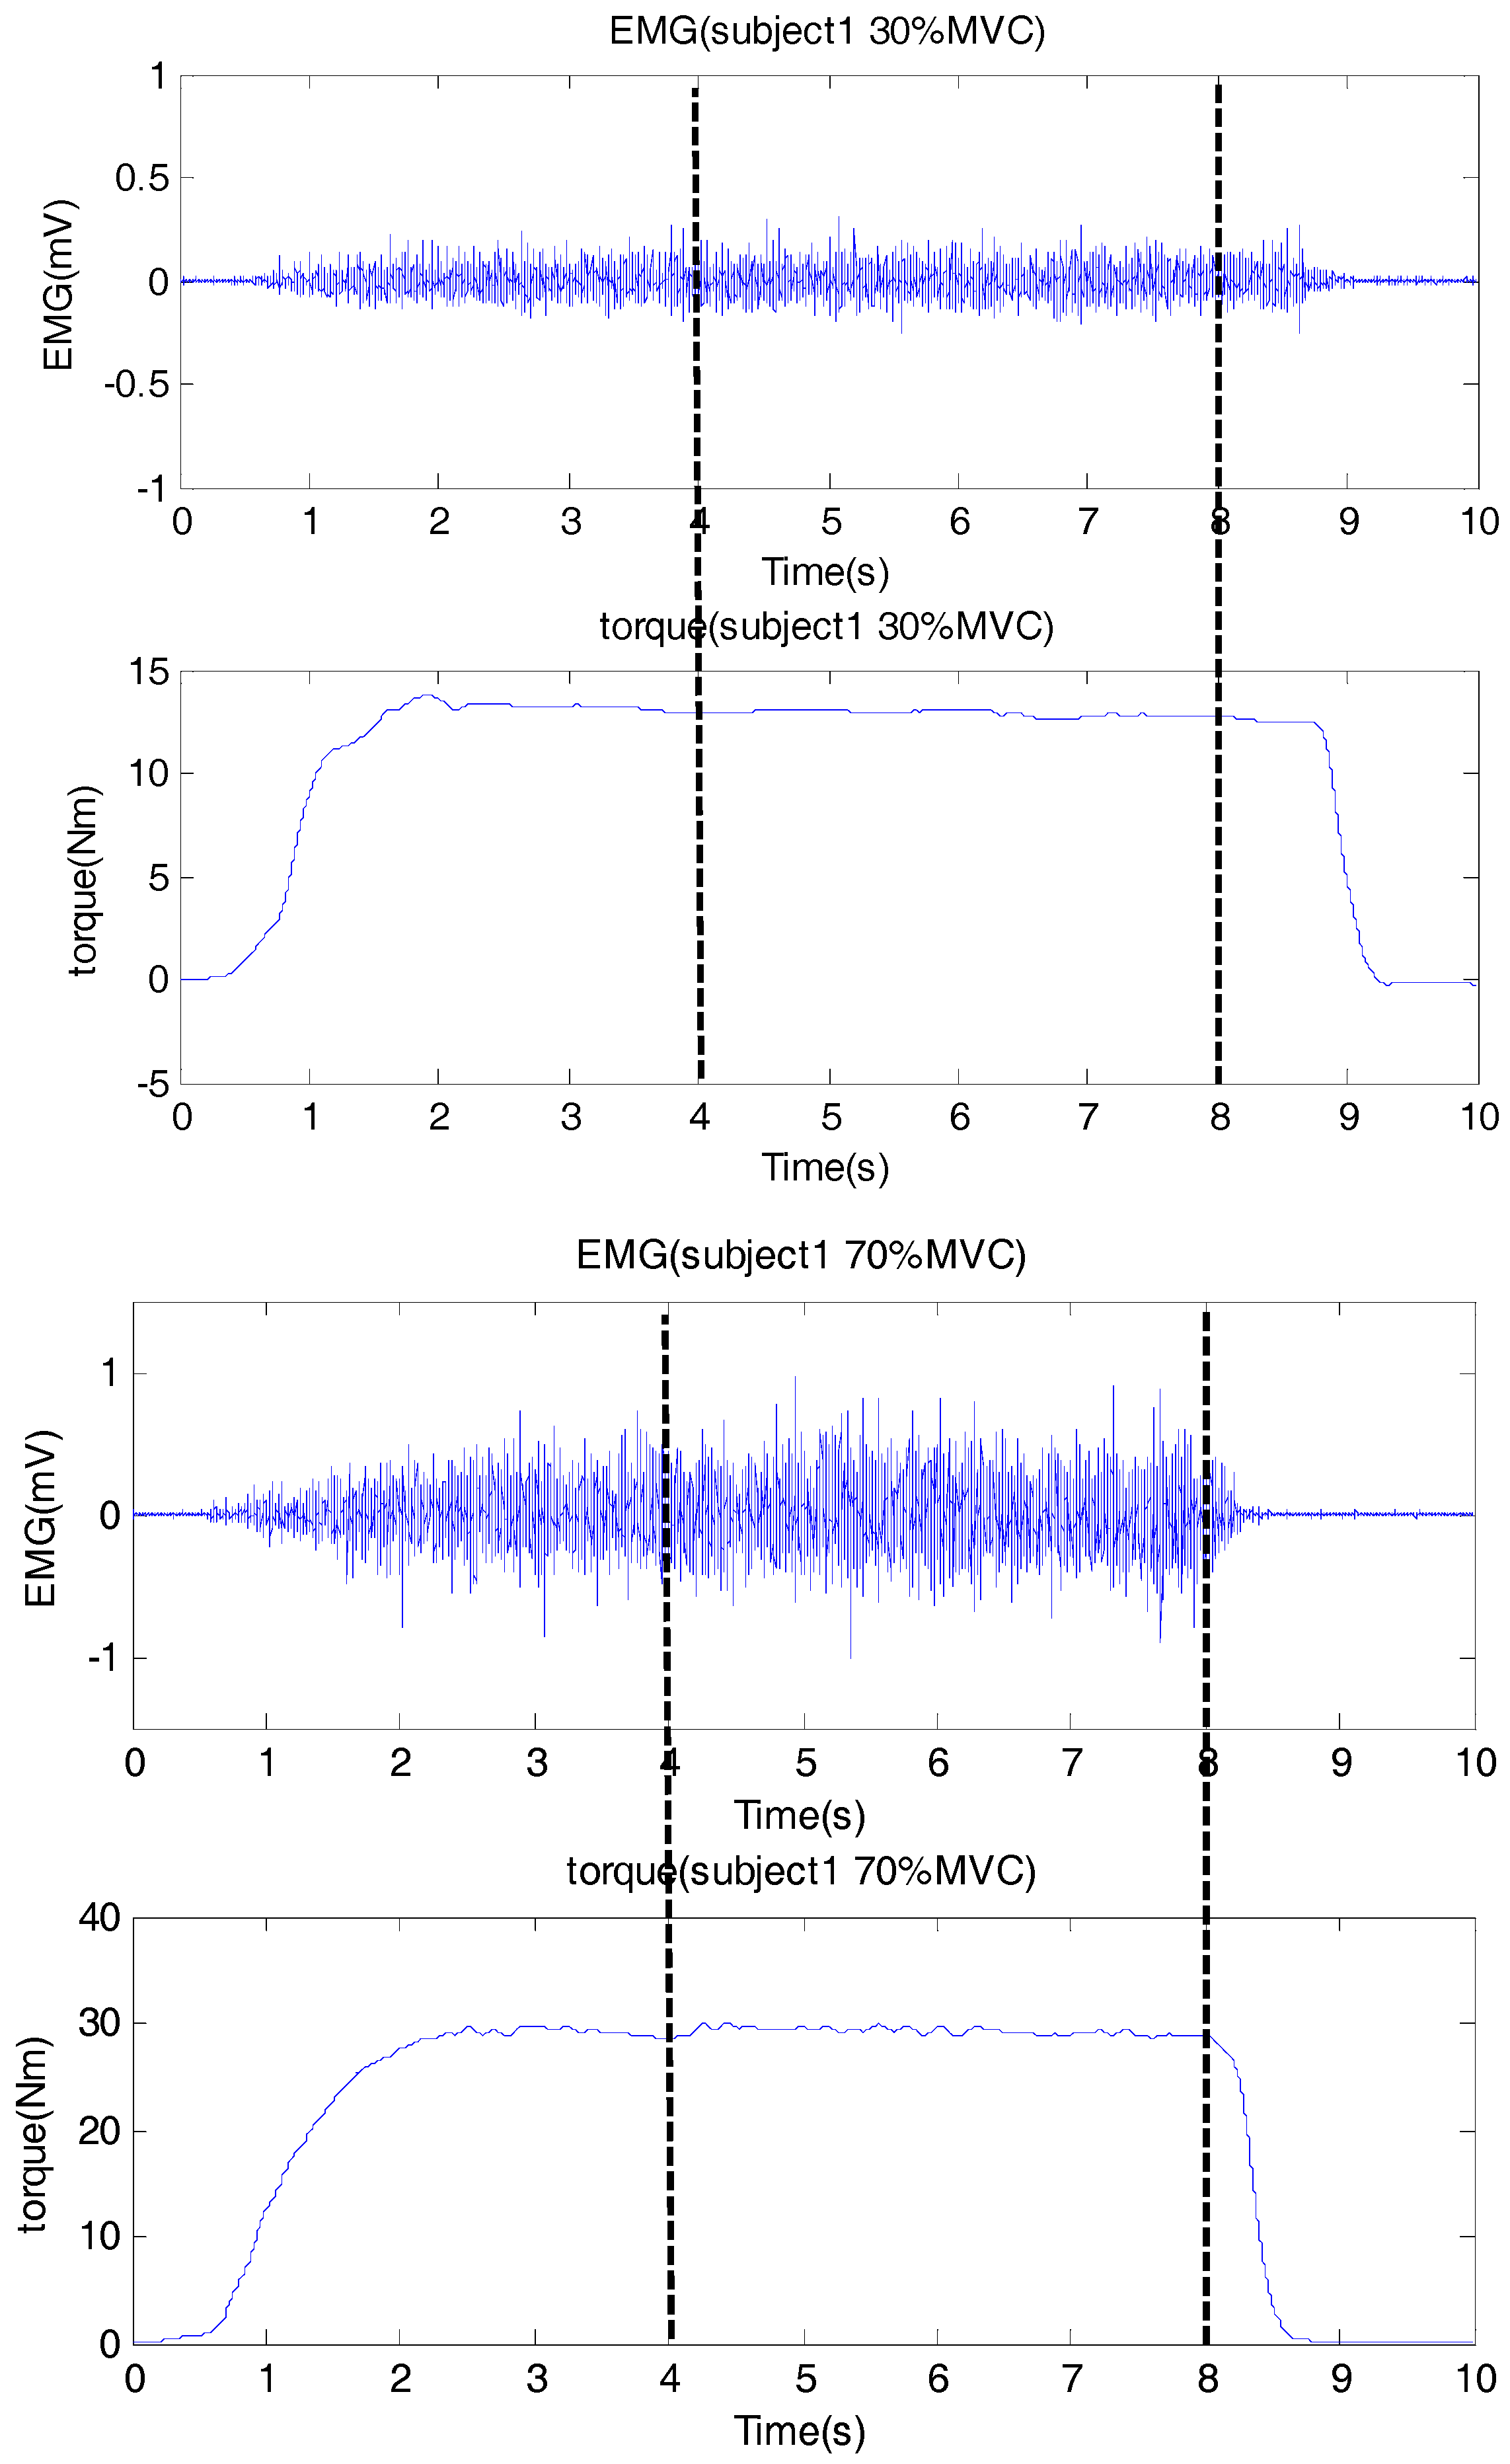
All the data were processed in the Matlab (version 2014a, The Mathworks Inc., Natick MA, USA). The sEMG data were filtered by a zero-lag fourth-order Butterworth band pass filter (20 Hz to 450 Hz) for preprocessing, and the torque signal was filtered by a zero-lag second-order Butterworth low pass filter (10 Hz). In each trial, a 4 s data segment with stable isometric muscle contraction (having the smallest standard variation of the torque signal) was selected for further analysis.
Figure 1 showed an example for the data segment selection.
2.3. Entropy Analysis
SampEn and FuzzyEn are both used for EMG analysis. Suppose that the original signal is x(i), i = 1, 2, 3, …, N. The computation procedure for SampEn is introduced as follows:
- (1)
construct a set of m-dimensional vector X(i), X(i) = {x(i), x(i + 1), …, x(i + m − 1)}, i = 1, 2, …, N − m + 1, m is the embedding dimension.
- (2)
For each
i,
i = 1, 2, …,
N −
m + 1, measure the distance between X(
i) and X(
j) ,
j = 1, 2, …,
N −
m + 1, but
i ≠
j. The distance between X(
i) and X(
j) is defined as follows,
k = 0, 1, …,
m − 1
- (3)
According to the given tolerance
r, we define the degree of similarity between X(
i) and X(
j) by the Heaviside function, measured as
dij,
- (4)
For each
i, all possible similarity measures between X(
i) and other constructed vector X(
j),
j = 1, 2, …,
N −
m + 1, but
j ≠
i, are summed and averaged to represent the probability
B(
i) for X(
i) which is similar to X(
j),
- (5)
Compute the average of
B(
i),
i = 1, 2, …,
N −
m + 1
- (6)
Similarly, when the embedding dimension is m + 1, construct a set of (m + 1)-dimensional vector X’(i), X’(i) = {x(i), x(i + 1), …, x(i + m)}, i = 1, 2, …, N – m.
- (7)
Repeat steps 2 to 4, for
i = 1, 2, …, …
N −
m, count the number
A(
i) of X’(
j) that
d[X’(
i), X’(
j)] <
r,
j = 1, 2, …,
N −
m, but
i ≠
j, and then the average probability
Am + 1 is calculated as,
- (8)
Ideally, the SampEn will be defined as,
Here,
N is the length of the signal, but
N is always limited, so eventually, the SampEn is:
The FuzzyEn calculation is similar to that of the SampEn, but it differs from SampEn on two aspects. On one aspect, they use different ways of constructing m-dimensional vectors. For the SampEn, these vectors are constructed from the original signal, as the step 1 introduced above. By contrast, each vector X(
i) needs to further have mean of its all elements subtracted from it for the FuzzyEn calculation. The other aspect is the difference in similarity measure. FuzzyEn employs fuzzy membership function for similarity measure other than the Heaviside function used by the SampEn. There are many choices for the fuzzy membership function, such as the Gaussian function or bell-shaped function [
31,
32]. In this study, we chose the exponential function from multiple choices for convenience. Therefore, the degree of similarity between X(
i) and X(
j) will be described as,
where the
d[X(
i),X(
j)] represents the distance defined as Equation (1), the power factor
n is the gradient of the boundary of the exponential function, and
r is the tolerance for the given signal.
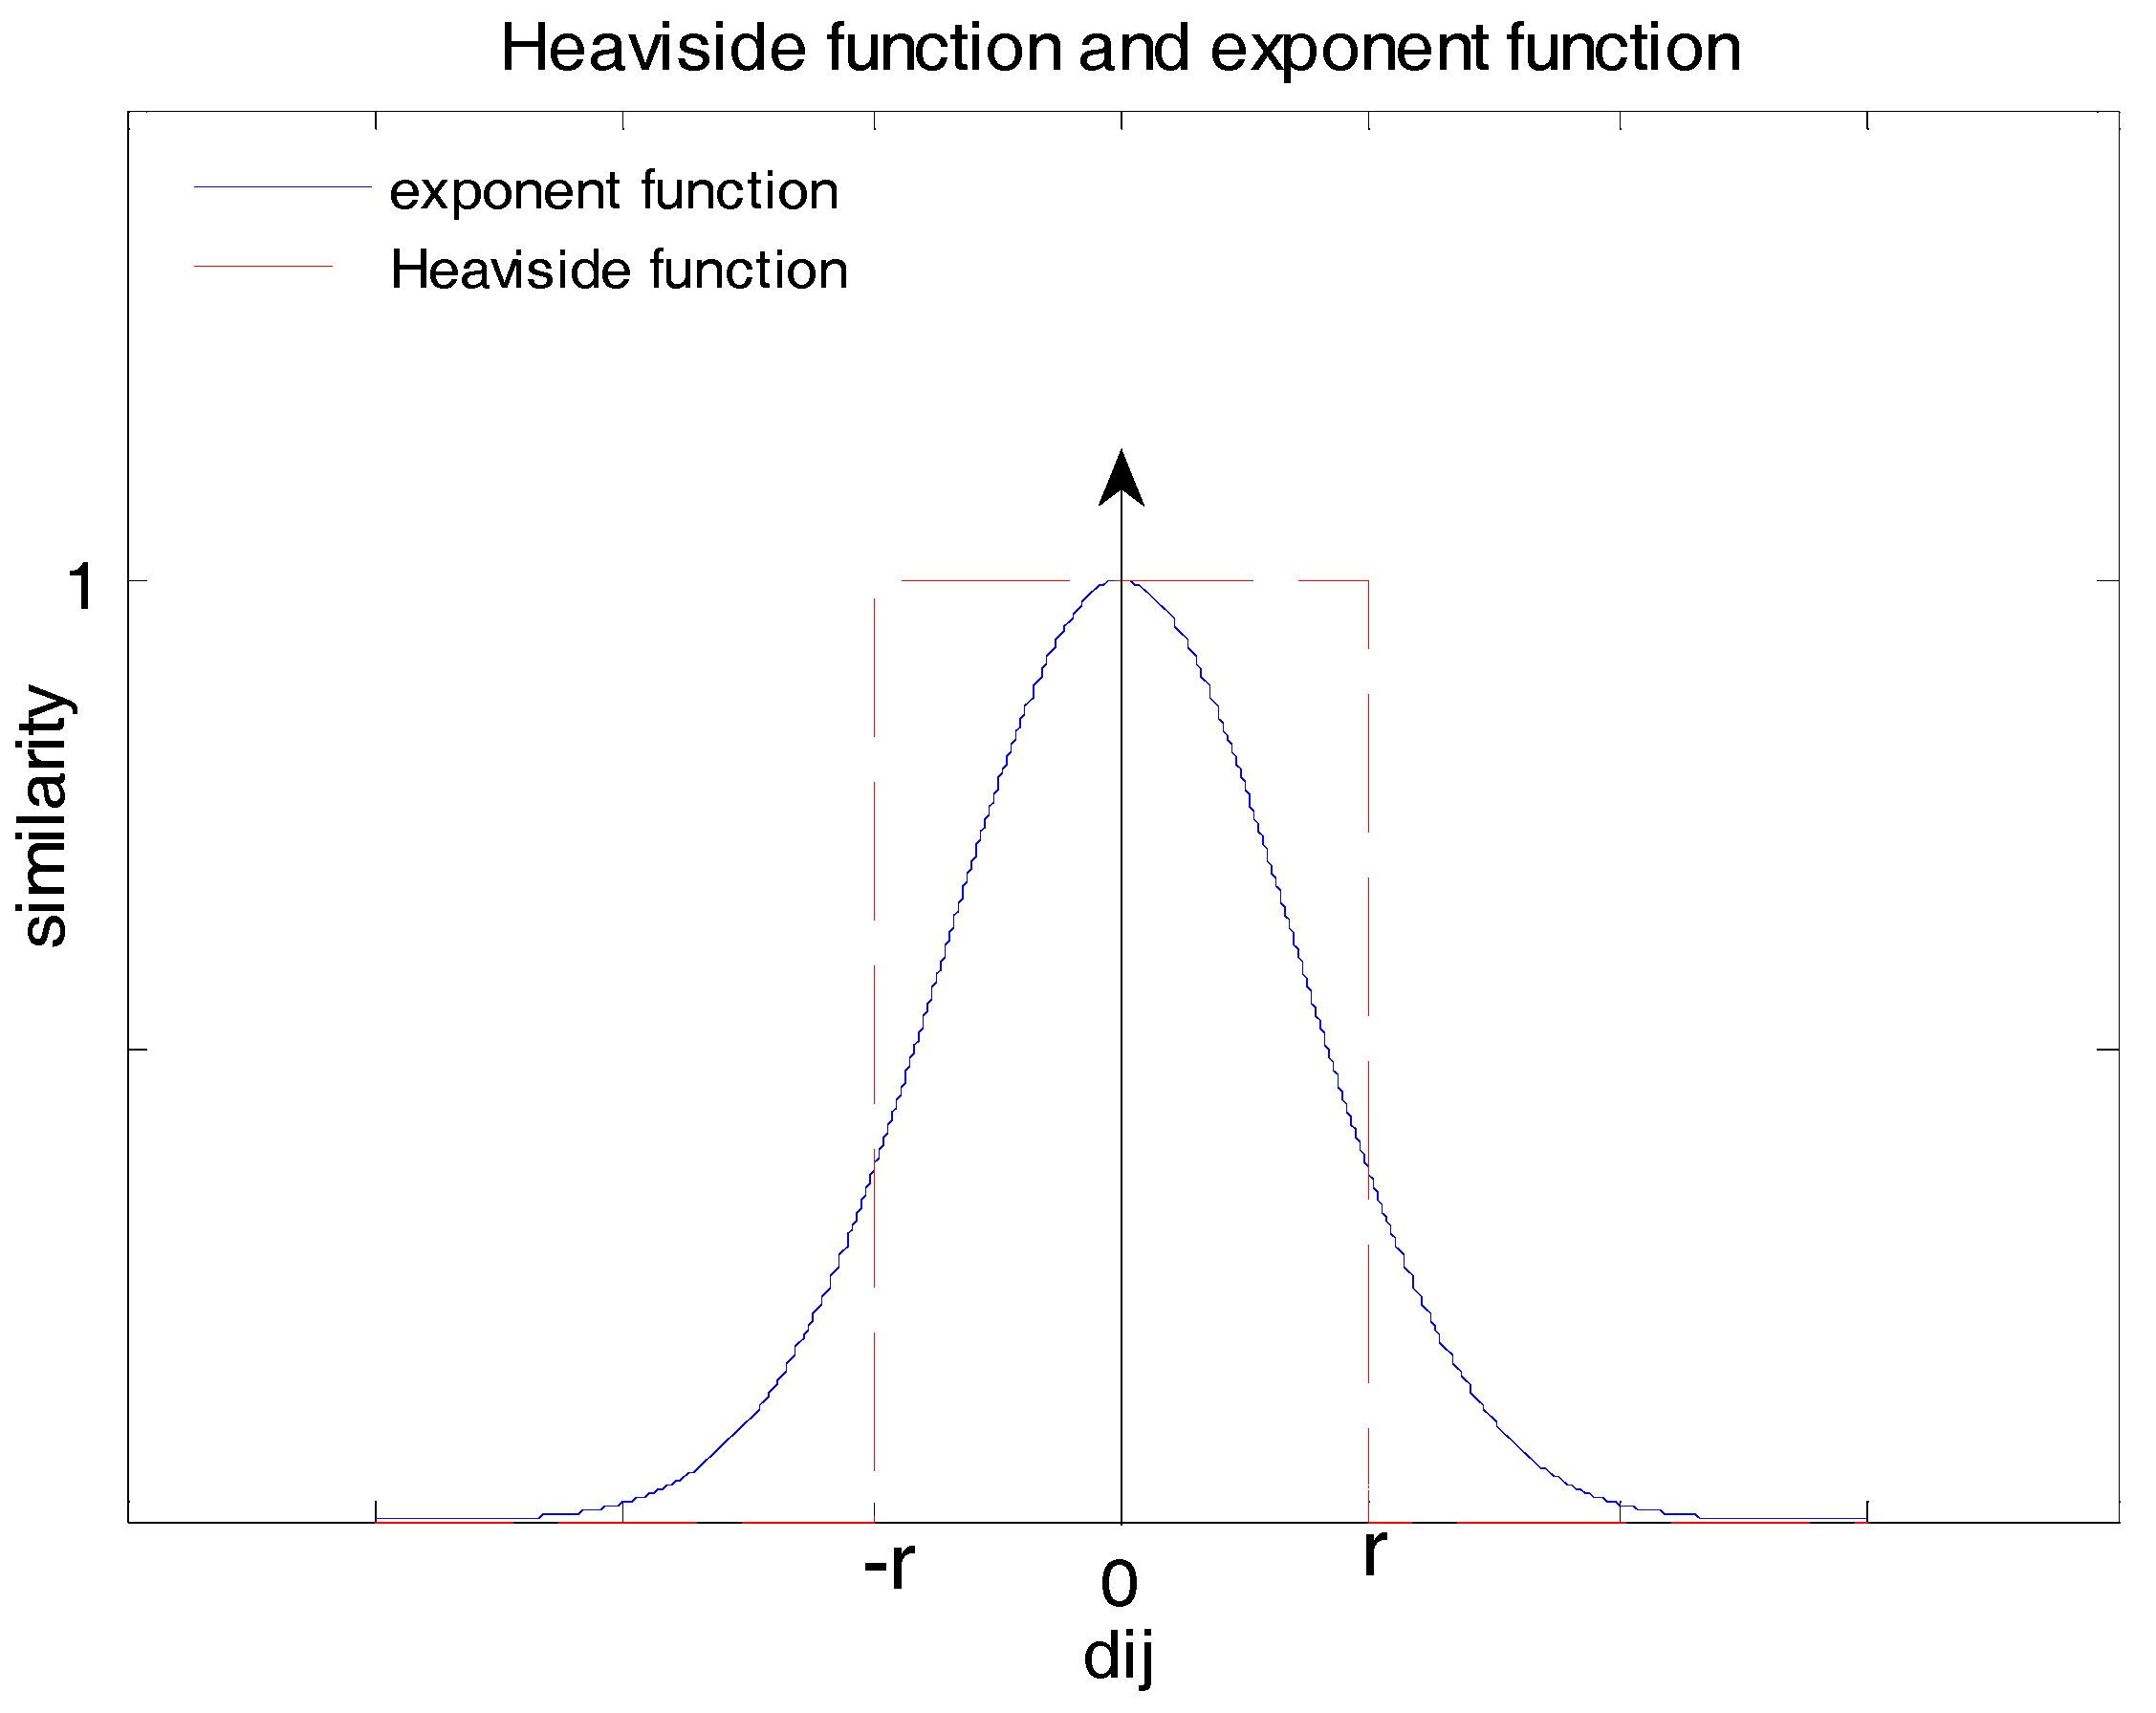
Figure 2 shows the difference between the exponential function and the Heaviside function. A red dashed line indicates the Heaviside function, which produces two totally different measures of similarity for distance inside and outside the range of ±
r. The exponential function is represented as a blue solid line, which gives measures changing gradually along the distance axis.
Both the SampEn and the FuzzyEn calculations involved three parameters, namely the signal length
N, the embedding dimension m and the tolerance
r. Generally, the signal length
N is determined by (10~30)
m, and the embedding dimension
m is set to 2 empirically, so the length
N is required to be 100~ 900 [
31]. Although this length is feasible for entropy calculation, some literature recommended to process sufficiently long signal to avoid notable bias [
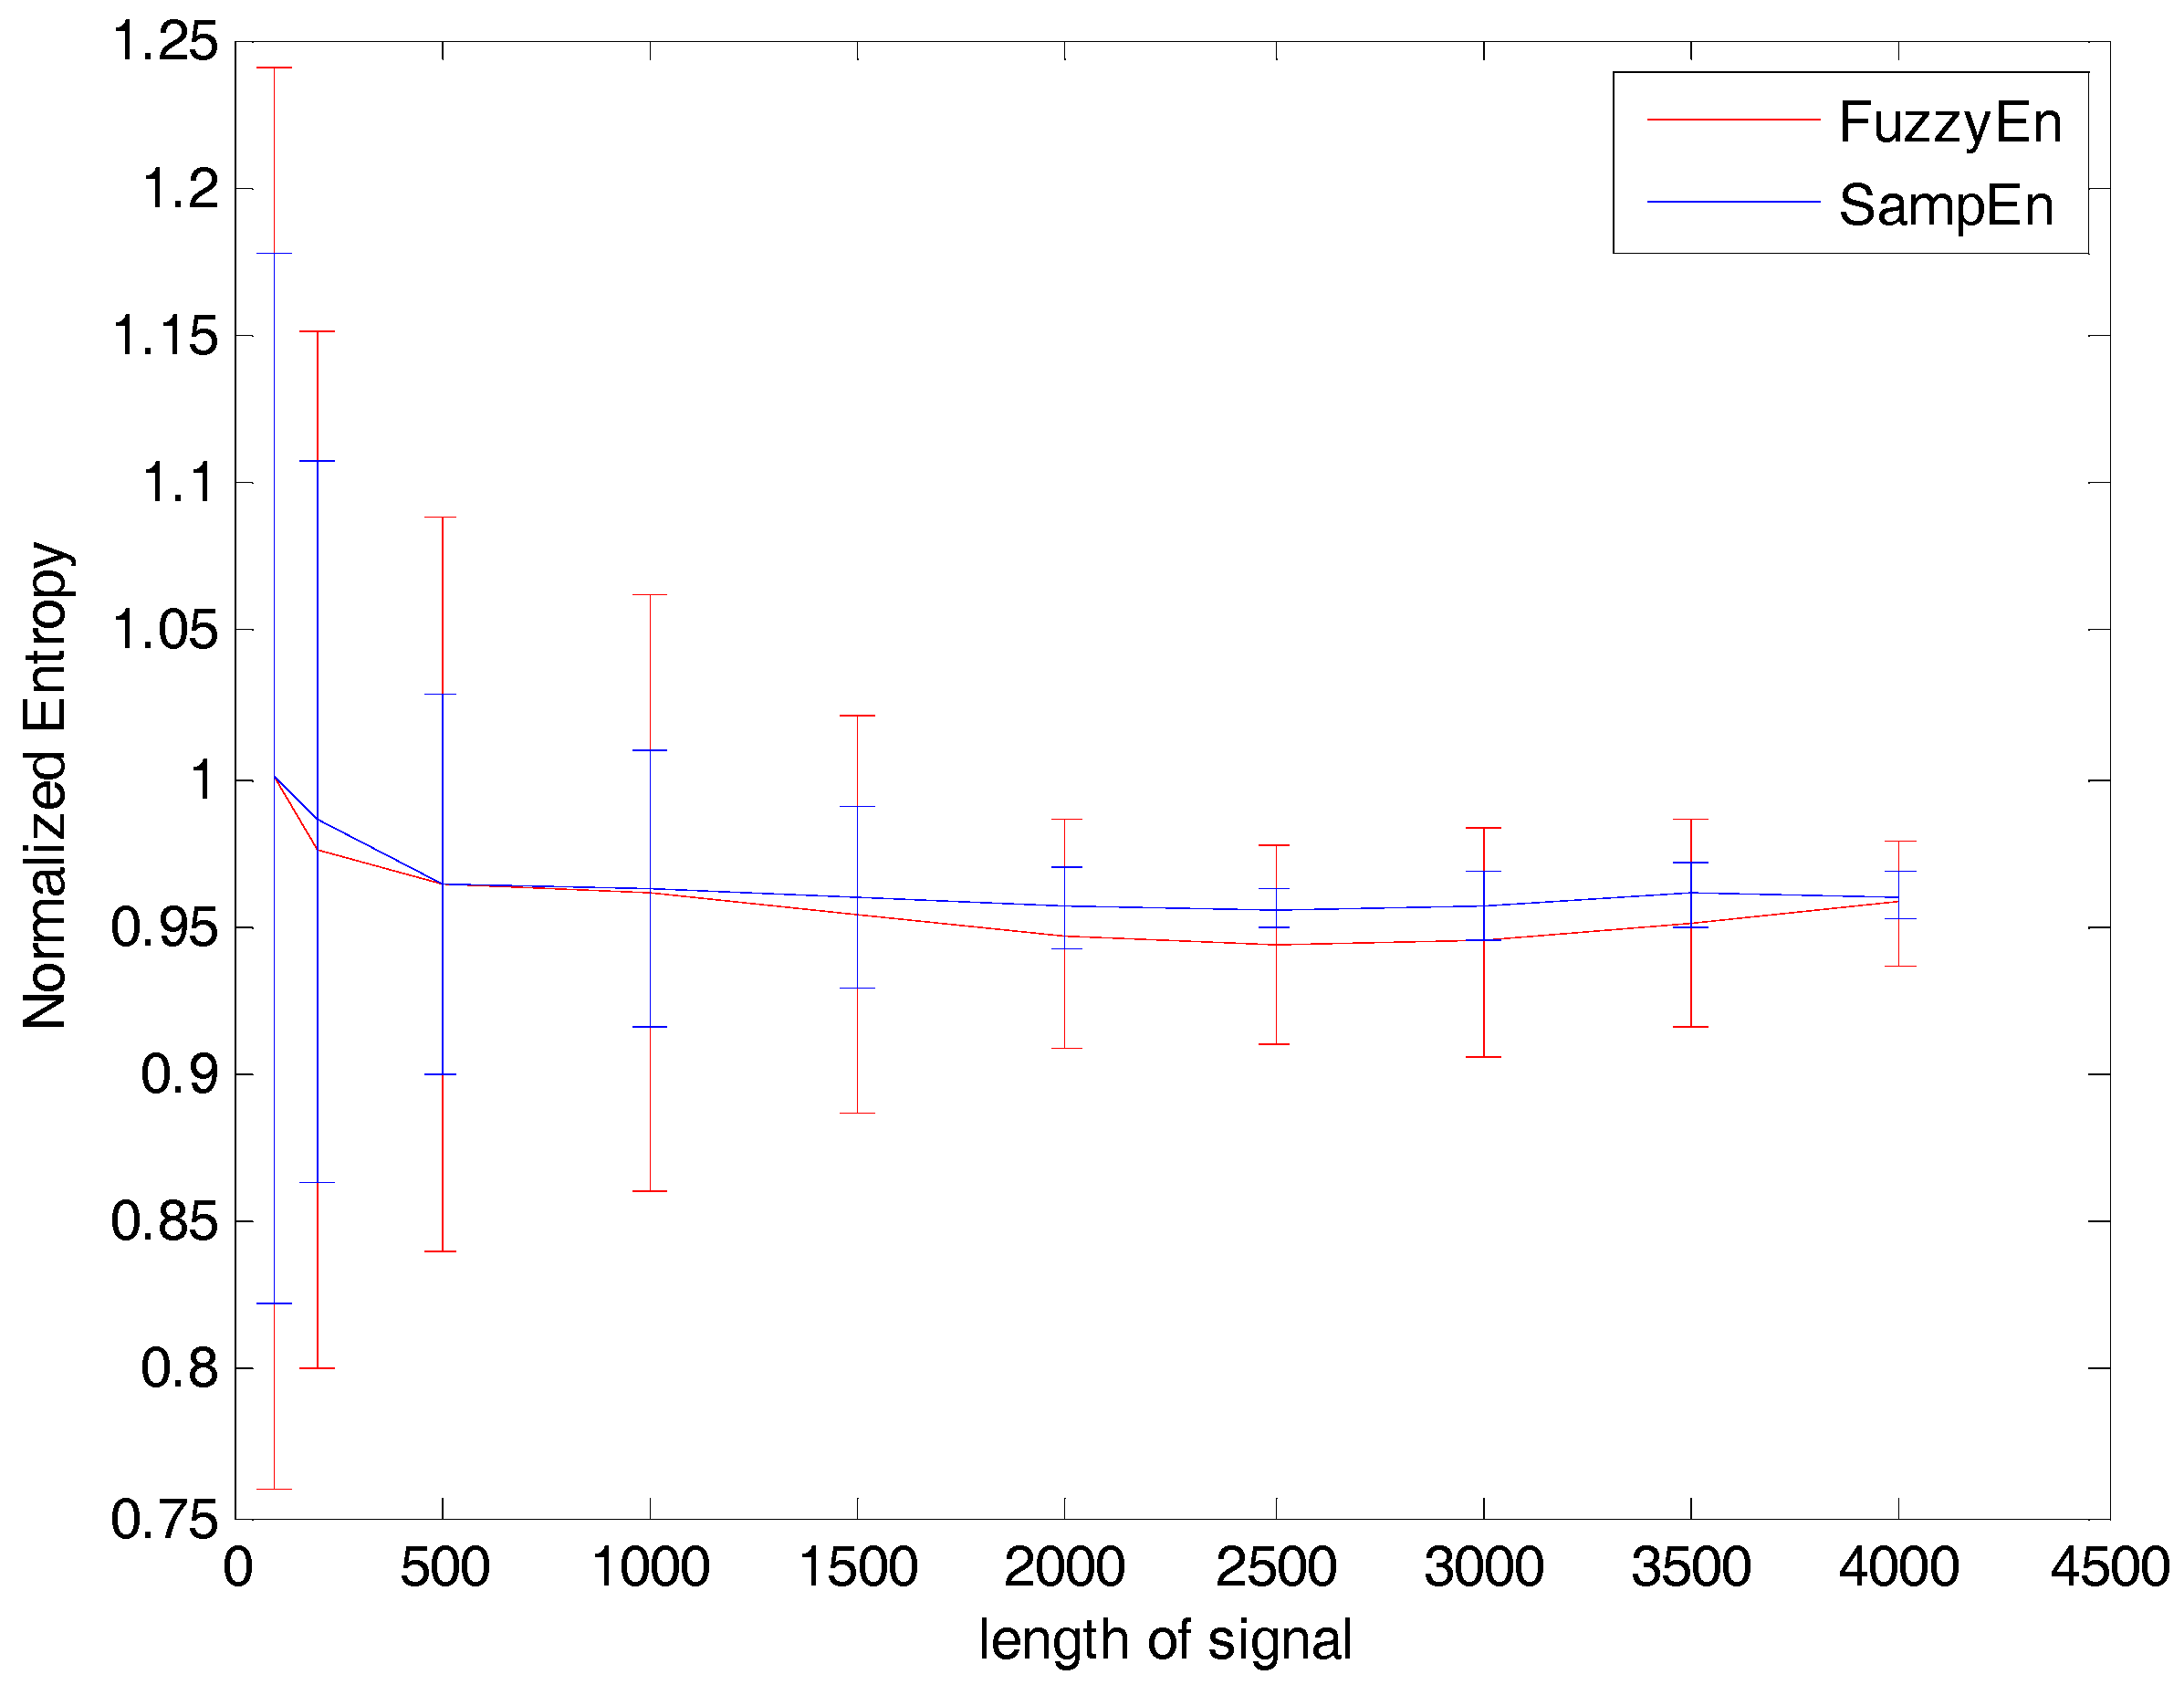
27]. This was confirmed by some pretests in our study. As illustrated in
Figure 3, by varying the length of signals to be processed, stable entropy measures could be observed at the length
N larger than 2000, with relatively smaller error bars also indicating light variations across the processed signals. On this basis, we chose a 4 second data segment (the length is 4000) which was competent for calculation of both entropy measures. The choice of the tolerance
r also needs special consideration. A small tolerance could make the entropy interfered remarkably by noise, and inversely, a large one might cause detailed information loss [
31]. Usually, the tolerance
r is defined as
where
std(
x) represents the standard deviation of the signal. Empirically, 0.1–0.3 are all reasonable for the parameter
k. Here
k is set to 0.25. In addition, the FuzzyEn computation involves a parameter
n representing the gradient of boundary for exponential function. The gradient measures the weight of reconstructed vectors’ similarity. If
n is more than 1, a closer vector is more similar than that of afar ones and it is converse for
n less than 1 [
31]. Generally, a large
n will cause loss of details information [
31]. According to this trade-off,
n is set to2.
2.4. Evaluation of the EMG–Torque Relation
For each subject, the RMS of the torque signal in each data segment was calculated, and then it was normalized to MVC percentage by dividing the subject’s MVC torque to represent the contraction level. Besides the mentioned SampEn, the FuzzyEn, and the RMS of EMG were also computed for each EMG data segment for comparison. The regression analysis was performed in order to interpret the relation between each of the three EMG analytic parameters and the muscle torque, respectively. Since previous studies reported both linear and nonlinear relation between EMG RMS and torque, both linear and exponential models were also employed, as described in the Equations (10) and (11), respectively.
Here,
a,
b,
c and
d are four coefficients in both regression models. Coefficient of determination (R-square) for the regression was utilized to evaluate the fitting.
In order to examine the effect of the parameter and the regression model on the EMG–torque relation, a two-way repeated-measure ANOVA (analysis of variance) was applied on the R-square value derived from the regression analysis, with the model (2 levels: linear and exponential) and parameter (three levels: RMS, FuzzyEn and SampEn) both considered as within-subjects factors. In addition, a one-sample t-test was also applied on the slope of linear model for SampEn of EMG and muscle torque in order to examine the sensitivity of contraction level to SampEn (as explained in the following results). The above-mentioned statistical analyses were conducted by using the SPSS software (ver. 16.0, SPSS Inc., Chicago, IL, USA). Significance level was set to p < 0.05 for all analyses. Besides, the power analysis was also conducted in order to justify the validity of results. The β was set to 0.2 so that the power level (1-β) was 0.8. The power analyses were performed in the EXCLE software (ver. 2013, Microsoft Inc., Redmond, WA, USA).
3. Results
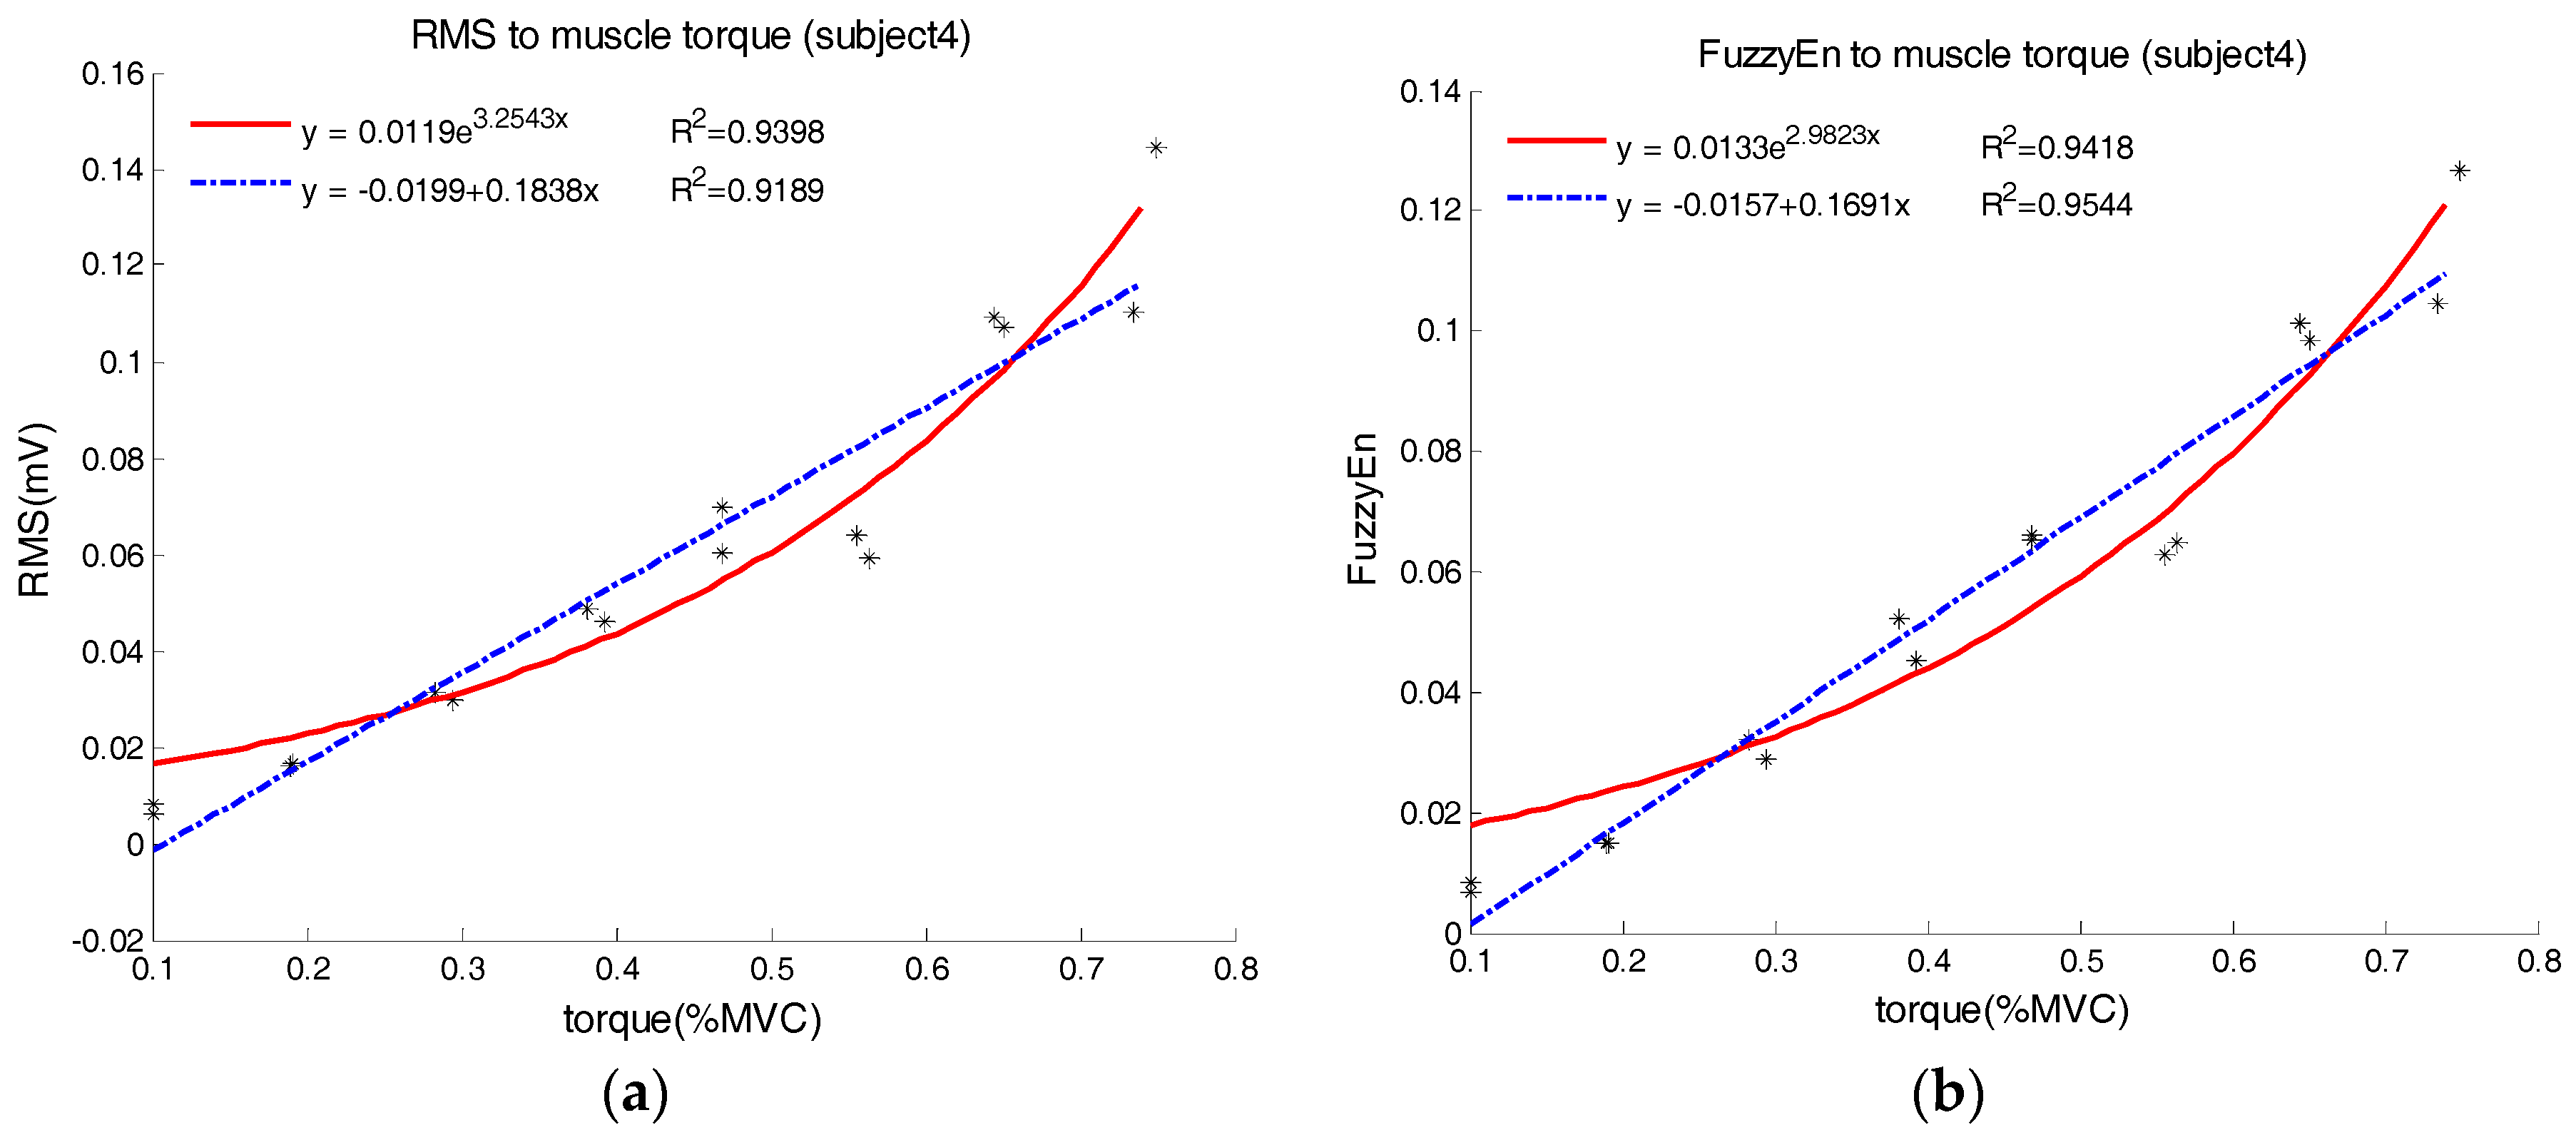
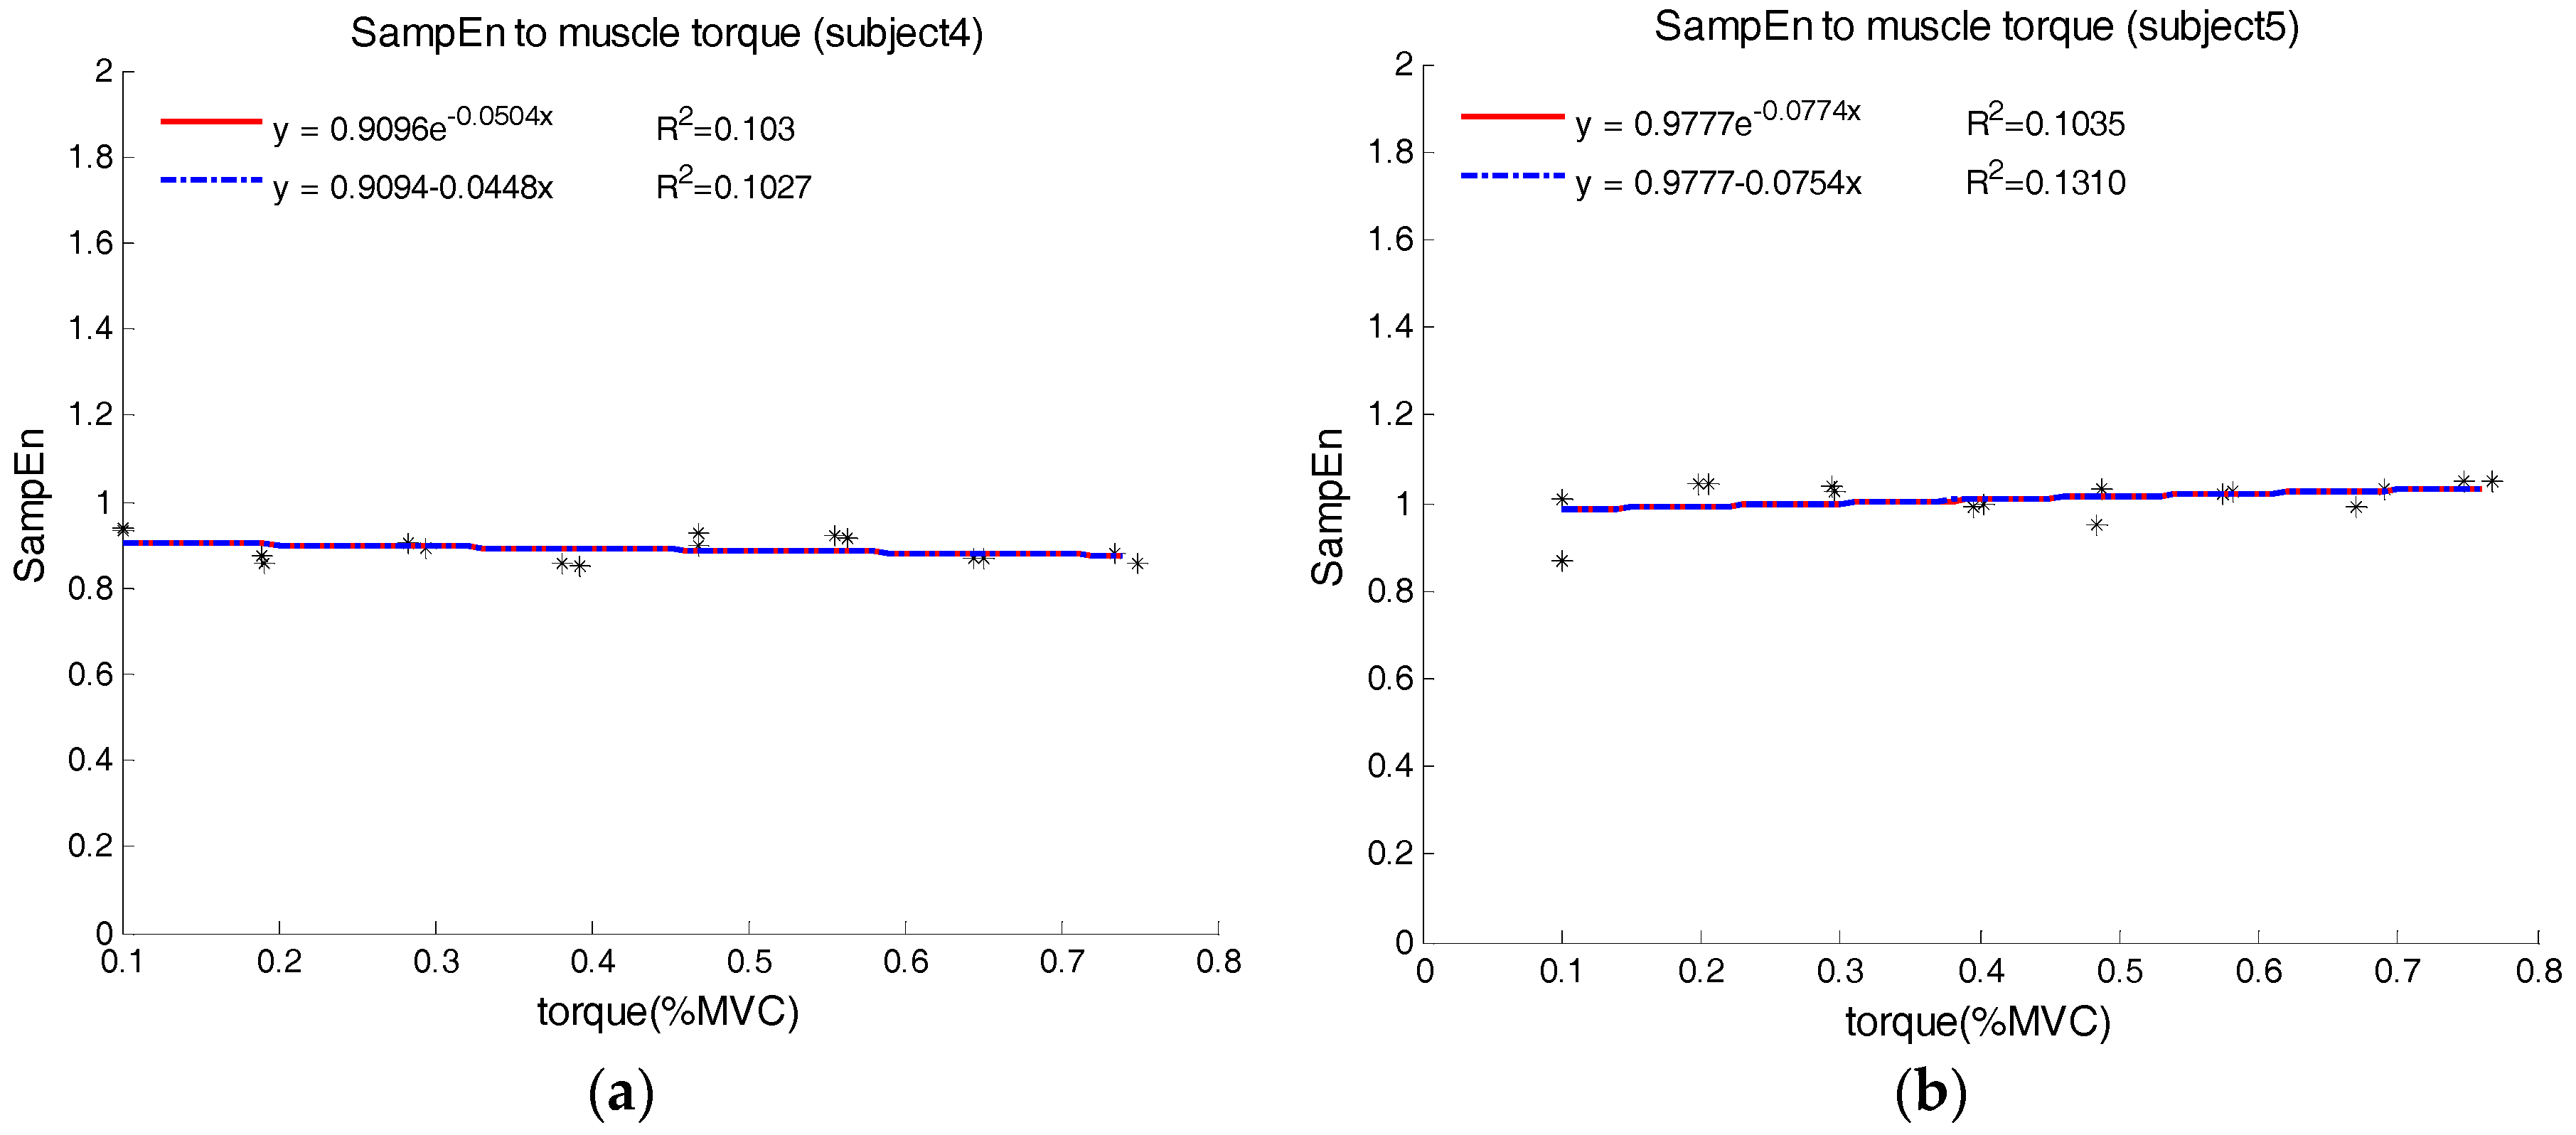
Representative examples of characterizing EMG–force relation using both linear and exponential regression are shown in
Figure 4 and
Figure 5, where the EMG is interpreted by the RMS and FuzzyEn in
Figure 4, and by the SampEn in
Figure 5, respectively. From
Figure 4, we can observe that the exponential model yielded a higher R-square than the linear model for the RMS, but the linear model outperformed the exponential model when the FuzzyEn was employed. This was almost the case across all subjects in our study. In
Figure 5, we surprisingly found that the linear and exponential models were similar in regression analysis for EMG SampEn–torque relation, both with very low R-squares around 0.4. Actually, SampEn was unchanged or fluctuated irregularly within a narrow range with the increasing torque. For all the subjects, the slopes of the linear regression could be positive and negative, with all slope values very close to 0.
The regression analysis results across all subjects in terms of the R-square are listed in
Table 2. The ANOVA reported a significant main effect of the parameter (F = 30.268,
p < 0.001) and an insignificant effect of the model (F = 2.618,
p = 0.141). Besides, a significant interaction was also observed between the two within-subjects factors (F = 4.516,
p < 0.05). More analyses were conducted for more details as follows.
When the EMG was routinely interpreted by its RMS amplitude, the R-squares of linear regression ranged from 0.715 to 0.967 (0.879 ± 0.067, mean ± SD) using the linear model and 0.792 to 0.992 (0.919 ± 0.054) using the exponential model across all subjects, respectively. It was obviously found that the exponential mode achieved higher R-squares than the simple linear model, with statistical significance revealed by pairwise comparison of the ANOVA (F = 6.582, p < 0.05).
When the FuzzyEn was used, both the linear and exponential regression analyses yielded comparably high R-squares of 0.922 ± 0.056 and 0.930 ± 0.028, respectively. This indicated that both models performed well, also with no significant difference (p = 0.385) in terms of the R-square by the pairwise comparison. However, power analysis reported insufficient statistical power for this comparison (β > 0.2). In addition, using the simple linear regression analyses, the mean R-square derived from the FuzzyEn was significantly higher than that from the RMS amplitude (p < 0.001).
It was found that the SampEn of EMG showed a very weak correlation with the muscle torque, with low R-squares derived from either linear model (0.399 ± 0.294) or exponential model (0.402 ± 0.296). Again both models exhibited no significant difference (p = 0.659). In addition, when the linear regression was applied, the slope derived from the EMG SampEn–torque relation had no significant difference from 0 (p = 0.544). Similarly, insufficient statistical power was reported by the power analysis for the above comparisons (β > 0.2).
4. Discussion
The study re-evaluated the EMG–torque relation for healthy BB muscles using three parameters to interpret the EMG signals. The EMG–torque/force relation has been extensively studied, where the EMG was routinely represented by its amplitude. According to literature involving the BB muscle, both linear and nonlinear relations were reported, and more researchers regarded the EMG–torque relation to be nonlinear. In this study, the EMG RMS–torque relation was well described via both linear and exponential model. Although the ANOVA did not report significant main effect of the model on the R-square, the exponential model truly outperformed the linear model in characterizing EMG RMS–torque relation, with statistical significance reported by the pairwise comparisons. This confirmed previous finding that the EMG RMS amplitude of the BB muscle increased faster with the increment of muscle force, and represented a nonlinear EMG RMS–torque relation [
8,
15,
16,
17].
With respect to previous studies employing EMG amplitude, the use of EMG complexity measures including both the FuzzyEn and the SampEn became a novelty of this study towards characterizing the EMG–torque relation. The FuzzyEn was found to be significantly correlated with the muscle torque, and it monotonically increased with the torque increment. Such a finding can be attributed into neurophysiological processes of muscle force production. By recruiting more motor units and increasing their firing rates, the appearance of more overlapped motor unit action potentials in the EMG signal leads to its increased level of complexity evaluated by entropy measures. Specifically, we also found that in the regression analyses, both the linear and exponential models had sufficiently high mean R-squares with no significant difference. This might be mainly due to the selected form of the exponential function in Equation (11), which is able to approximate to the linear model by appropriately adjusting its coefficients. In addition, the use of EMG FuzzyEn yielded significantly improved R-squares from the linear regression analyses over the use of EMG RMS amplitude, demonstrating that the EMG FuzzyEn–torque relation had a higher degree of linearity than the RMS–torque relation.
By contrast, the EMG SampEn–torque relation almost exhibited a flat trend, indicating insensitivity of EMG SampEn to the muscle force. Although both SampEn and FuzzyEn are common measures for quantifying system complexity and signal irregularity, there are still distinctions between them. One aspect is an additional centralization applied to reconstructed vectors in the FuzzyEn calculation. This allows the relevant shape rather than absolute coordinate between any two constructed vectors to be taken into account in measuring their distance. The SampEn, by contrast, measures the vectors’ distance by their coordinates, making its calculation mainly depend on oscillatory amplitude of the signal to be processed [
31]. The other aspect is their different functions for similarity measure of the reconstructed vectors. The SampEn employs the two-state Heaviside function with a predefined tolerance, which is likely to result in abrupt change in the entropy measurement when the tolerance changes slightly [
31,
32]. Nevertheless, the FuzzyEn introduces the concept of fuzzy logic, and the similarity degree judged by fuzzy membership function is able to produce more smooth and continuous measurement [
31,
32]. The two modifications of the FuzzyEn with respect to the SampEn may account for their inconsistent regulations in characterizing EMG–torque relations.
It should be further noted that the insensitiveness of the EMG SampEn to muscle strength is inconsistent with previous studies involving SampEn analysis of EMG signal. Zhang et al. [
27] reported that EMG SampEn increased with the increase of muscle activation level, and it was employed for EMG onset detection [
28]. In addition, some related studies utilized the SampEn to explore pathological change of neuromuscular disease, and the results indicated that the SampEn was correlated with muscle contraction level [
30,
35]. The disagreement with previous findings can be attributed into different tolerance selection schemes for SampEn calculation. Their analysis adopted constant/fixed tolerance across a set of EMG data to be analyzed. Such a global tolerance scheme make the signal amplitude information mainly taken into account in the SampEn calculation and, therefore, the resultant SampEn increases monotonically with muscle torque. This was also called constraint SampEn in the literature [
29]. In this study, however, we employed a local tolerance scheme; that is, the tolerance used for the SampEn calculation was determined by every corresponding signal to be processed, independent on the trials with different muscle contraction levels. Given the adaptively selected tolerance, the resultant SampEn was regarded to mainly focus on the signal’s structure characteristics other than its amplitude. Please note that the effect of tolerance selection scheme on the SampEn calculation was reported in our previous studies [
27]. The global tolerance scheme is more suitable for applications taking the signal amplitude into account, while the local tolerance scheme mainly focuses on quantification of the signal inherent structure. In this regard, the inherent structure of EMG does not change much, with the varying contraction levels.
In addition, it is also worth noting that the two entropy measures showed completely different properties in characterizing EMG–force relation, thus being suitable for different applications. The FuzzyEn of EMG showed a more linear relation than the RMS amplitude. Such a property makes FuzzyEn a straightforward and convenient indicator for predicting force of large muscles. Because of the commonly assumed linearity for EMG amplitude–torque relation, a great many practical applications have been straightforwardly developed, like muscle force estimation by EMG amplitude. Given the finding of this study, the EMG FuzzyEn really provides an optional parameter for more accurate muscle force estimation than the conventional EMG amplitude. By contrast, when applying the local tolerance scheme, the SampEn of EMG shows its insensitiveness to varying muscle torque. It has been also reported by many previous studies that the EMG SampEn, along with other appropriate entropy measures, can highlight the pathological alternations as a result of neuromuscular disorders and injuries [
30,
35,
37,
38], so that they are considered as important biomarkers for surface EMG examination. In these studies, however, the muscle contraction strength has to be taken into account for EMG quantitative analysis so as to calibrate a diagnostic boundary [
28,
30,
33,
34,
35]. Our findings suggested that the SampEn of EMG is likely to be independent on the muscle contraction strength. The diagnostic biomarker developed from the presented procedure using SampEn analysis would be simplified when eliminating interference of the contraction strength. In this regard, the implementation of the SampEn analysis of EMG could be potentially adopted for developing a diagnostic biomarker.
Finally, the primary limitation of the study is the limited number of recruited subjects, which led to insufficient statistical power in some comparisons. However, it should be acknowledged that those comparisons with insufficient statistical power may not hinder our primary conclusions, especially with consistent supports from some previous studies. Our future work will focus on extensive experiments with more subjects to be recruited, and further practical applications of the developed approach based on EMG complexity analysis, including clinical diagnosis and motor control investigations.


