Article

Information Fusion in a Multi-Source Incomplete Information System Based on Information Entropy

School of Sciences, Chongqing University of Technology, Chongqing 400054, China
*
Author to whom correspondence should be addressed.
These authors contributed equally to this work.
Entropy 2017, 19(11), 570; https://doi.org/10.3390/e19110570
Submission received: 14 August 2017 / Revised: 12 October 2017 / Accepted: 19 October 2017 / Published: 17 November 2017

Abstract

:
As we move into the information age, the amount of data in various fields has increased dramatically, and data sources have become increasingly widely distributed. The corresponding phenomenon of missing data is increasingly common, and it leads to the generation of incomplete multi-source information systems. In this context, this paper’s proposal aims to address the limitations of rough set theory. We study the method of multi-source fusion in incomplete multi-source systems. This paper presents a method for fusing incomplete multi-source systems based on information entropy; in particular, by comparison with another method, our fusion method is validated. Furthermore, extensive experiments are conducted on six UCI data sets to verify the performance of the proposed method. Additionally, the experimental results indicate that multi-source information fusion approaches significantly outperform other approaches to fusion.

1. Introduction

Information fusion is used to obtain more accurate and definite inferences from the data provided by any single information source by integrating multiple information sources; several definitions have been proposed in the literature [1,2,3,4,5,6,7,8,9]. The theory of information fusion was first used in the military field; it is defined as a multi-level and multi-aspect process that handles problems. In fact, data fusion can be broadly summarized as such a process; namely, to synthesize comprehensive intelligence from multi-sensor data and information according to established rules and analysis methods, and on this basis, to provide the user-required information, such as decisions, tasks, or tracks. Therefore, the basic purpose of data fusion is to obtain information that is more reliable than data from any single input. Along with the progress of time, information fusion technology has become increasingly important in the field of information service. Multi-source information fusion is one of the most important parts of information service in the age of big data, and many productive achievements have been made. Many scholars have conducted research on multi-source information fusion. For example, Hai [10] investigated predictions of formation drillability based on multi-source information fusion. Cai et al. [11] researched multi-source information fusion-based fault diagnosis of a ground-source heat pump using a Bayesian network. Ribeiro et al. [12] studied an algorithm for data information fusion that includes concepts from multi-criteria decision-making and computational intelligence, especially fuzzy multi-criteria decision-making and mixture aggregation operators with weighting functions. Some relative papers have studied entropy measure with other fuzzy extensions. For instance, Wei et al. [13] proposed uncertainty measures of extended hesitant fuzzy linguistic term sets. Based on interval-valued intuitionistic fuzzy soft sets, Liu et al. [14] proposed a theoretical development on the entropy. Yang et al. [15] proposed cross-entropy measures of linguistic hesitant intuitionistic fuzzy systems.
An information system is the main expression of an information source and the basic structure underlying information fusion. An information system is a data table that describes the relationships among objects and attributes. There is a great deal of uncertainty in the process of information fusion. Rough set theory is usually used to measure the uncertainty in an information table. Rough set theory—which was introduced by Pawlak [16,17,18,19,20]—is an extension of classical set theory. In data analysis, it can be considered a mathematical and soft computational tool to handle imprecision, vagueness, and uncertainty. This relatively new soft computing methodology has received a great deal of attention in recent years, and its effectiveness has been confirmed by successful applications in many science and engineering fields, including pattern recognition, data mining, image processing, and medical diagnosis [21,22]. Rough set theory is based on the classification mechanism, and the theory is classified as an equivalence relation in a specific universe, and this equivalence relation constitutes a partition of the universe. A concept (or more precisely, the extension of a concept) is represented by a subset of a universe of objects, and is approximated by a pair of definable concepts in a logic language. The main idea of rough set theory is the use of known knowledge in a knowledge base to approximate inaccurate and uncertain knowledge. This seems to be of fundamental importance to artificial intelligence and cognitive science. An information system is the basic structure underlying information fusion, and rough set theory is usually used to measure the uncertainty in an information system. Therefore, it is feasible to use rough set theory for information fusion. Some scholars have conducted research in this field. For example, Grzymala-Busse [23] presented and compared nine different approaches to missing attribute values. For testing both naive classification and new classification techniques of LERS (Learning from Examples based on Rough Sets) were used. Dong et al. [24] researched the processing of information fusion based on rough set theory. Wang et al. [25] investigated multi-sensor information fusion based on rough sets. Huang et al. [26] proposed a novel method for tourism analysis with multiple outcome capability based on rough set theory. Luo et al. [27] studied incremental update of rough set approximation under the grade indiscernibility relation. Yuan et al. [28] considered multi-sensor information fusion based on rough set theory. In addition, Khan et al. [29,30] used views of the membership of objects to study rough sets and notions of approximates in multi-source situations. Md et al. [31] proposed a modal logic for multi-source tolerance approximation spaces based on the principle of considering only the information that sources have about objects. Lin et al. studied an information fusion approach based on combining multi-granulation rough sets with evidence theory [32]. Recently, Balazs and Velásquez conducted a systematic study of opinion mining and information fusion [33].
However, these methods of information fusion are all based on complete information systems; a smaller amount of research has been conducted for incomplete information systems ( I I S s ) . Jin et al. [34] studied feature selection in incomplete multi-sensor information systems based on positive approximation in rough set theory. IISs occur as a result of the ability to acquire data, the production environment, and other factors that result in the presence of original data with unknown values of attributes. As science has developed, people have found many ways to obtain information. An information box [35] can have multiple information sources, and every information source can be used to construct an information system. If all information sources are incomplete, then they can be used to construct multiple incomplete information systems. Therefore, the motivation for this paper is shown as follows: From the current research situation, most methods of information system fusion are all based on complete information systems. In order to broaden the research background of information fusion, we study the method of incomplete information system fusion. In order to reduce the amount of information loss in the process of information system fusion, we proposed the method which used information entropy to fuse incomplete information systems. In particular, by comparison with another method, our fusion method is validated. In this paper, we discuss the multi-source fusion of incomplete information tables based on information entropy. It is concluded that the method proposed here is more effective after comparing it with the mean value fusion method.
This rest of this paper is organized as follows: Some relevant notions are reviewed in Section 2. In Section 3, we define conditional entropy in a multi-source decision system, propose a fusion method based on conditional entropy, and design an algorithm for creating a new information table from a multi-source decision table based on conditional entropy. In Section 4, we download some data sets from UCI to prove the validity and reliability of our method; furthermore, we analyze the results of the experiment. The paper ends with conclusions in Section 5.

2. Preliminaries

In this section, we simply review some basic concepts relating to rough set theory, incomplete information systems, incomplete decision systems, and conditional entropy ( C E ) in incomplete decision systems. More details can be found in the literature [16,36,37,38,39].

2.1. Rough Sets

In rough set theory, let S = ( U , A T , V , f ) be an information system. The U = ( x 1 , x 2 , , x n ) is the object set. The A T = ( a 1 , a 2 , , a m ) is the attribute set. The V = ( v 1 , v 2 , , v m ) is a set of corresponding attribute values. The f : U V is a mapping function.
Let P R and P ϕ , the intersection of all the equivalence relations in P is called the equivalence relation on P or the indistinguishable relation is defined by I N D ( P ) .
Let X be a subset of U. Then, x is an object of U, the equivalence class of x about R is defined by
[ x ] R = { y U | x R y } ,
which represents the equivalence class that contains x.
When a set X expresses a union of equivalence classes, the set X can be precisely defined; otherwise, the set X can only be approximated; in rough set theory, upper and lower approximation sets are used to describe the set X. Given a finite nonzero set, U, which is called the domain, that R is an equivalence relation in the universe U and X U , the upper and lower approximations of X are defined by
R ¯ ( X ) = { x U | [ x ] R X } , R ̲ ( X ) = { x U | [ x ] R X } .
The R positive region, negative region, and the boundary region of X are defined as follows, respectively.
p o s R ( X ) = R ̲ ( X ) , n e g R ( X ) = R ¯ ( X ) and b n R ( X ) = R ¯ ( X ) R ̲ ( X )
The approximation accuracy and roughness of the concept X in an attribute set, A, are defined as follows:
α A ( X ) = A ̲ ( X ) A ¯ ( X ) , ρ A ( X ) = 1 α A ( X ) ,
respectively. They are often used for measuring uncertainty in rough set theory. X refers to the cardinality of the set X.
The approximation accuracy for rough classification was proposed by Pawlak [19] in 1991. By employing the attribute set R, the approximation accuracy provides the percentage of possibly correct decisions when classifying objects.
Let D S = ( U , A T D , V , f ) be a decision system, U / D = { Y 1 , Y 2 , , Y m } be a classification of universe U, and R be an attribute set satisfying R A T . Then, the R-lower and R-upper approximations of U / D are defined as
R ̲ ( U / D ) = R ̲ ( Y 1 ) R ̲ ( Y 2 ) R ̲ ( Y m )
R ¯ ( U / D ) = R ¯ ( Y 1 ) R ¯ ( Y 2 ) R ¯ ( Y m ) .
The approximation accuracy of U / D for R is defined as
α R ( U / D ) = Y i U / D | R ̲ ( Y i ) | Y i U / D | R ¯ ( Y i ) | .
Recently, Dai and Xu [40] extended this to incomplete decision systems; i.e.,
α B ( U / D ) = Y i U / D | T B ̲ ( Y i ) | Y i U / D | T B ¯ ( Y i ) | .
The corresponding approximation roughness of U / D for R is defined as
R o u g h n e s s R ( U / D ) = 1 α R ( U / D ) .

2.2. Incomplete Information System

A quadruple I S = ( U , A T , V , f ) is an information system. U is a nonempty finite set of objects, A T is a nonempty finite set of attributes, V= a A V a , where V a is the domain of a, and f : U × A T V is an information function such that f ( x , a ) V a for each a A T and x U . A decision system, ( D S ) , is a quadruple D S = ( U , A T D T , V , f ) , where C is the condition attribute set, D is the decision attribute set, and C D = ϕ , V is the union of the attribute domain.
If there exists a A T and x U such that f ( a , x ) is equal to a missing value (denoted “∗”), then the information system is an incomplete information system ( I I S ) . Otherwise, the information system is a complete information system ( C I S ) . If V D T but V A T , then we call the decision system an incomplete decision system ( I D S ) . If V D T and V A T , then the information system is a complete decision system ( C D S ) .
Because there are missing values, the equivalence relation is not suitable for incomplete information systems. Therefore, Kryszkiewicz [36,37] defined a tolerance relation for incomplete information systems. Given an incomplete information system, I I S = ( U , A T , V , f ) , for any attribute subset B A T , let T ( B ) denote the binary tolerance relation between objects that are possibly indiscernible in terms of B. T ( B ) is defined as
T ( B ) = { ( x , y ) a B , f ( a , x ) = f ( a , y ) o r f ( a , x ) = o r f ( a , y ) = }
The tolerance class of object x with reference to an attribute set B is denoted T B ( x ) = { y | ( x , y ) T ( B ) } . For X U , the lower and upper approximations of X with respect to B are defined as
T B ¯ ( X ) = { x U | T B ( x ) X } , T B ̲ ( X ) = { x U | T B ( x ) X } .

3. Multi-Source Incomplete Information Fusion

With the development of science and technology, people have access to increasing numbers of channels from which to obtain information. The diversity of the channels has produced a large number of incomplete information sources—that is, a multi-source incomplete information system. Investigating some special properties of this system and fusing the information are the focus of the information technology field. In this section, we present a new fusion method for multi-source incomplete information systems and compare our fusion method with the mean value fusion method in a small experiment.

3.1. Multi-Source Information Systems

Let us consider the scenario in which we obtain information regarding a set of objects from different sources. Information from each source is collected in the above information system, and thus, a family of the single information systems with the same domain is obtained; it is called a multi-source information system [41].
Definition 1.
(see [32]) A multi-source information system can be defined as
M S = { I S i | I S i = ( U , A T i , { ( V a ) a A T i } , f i ) } ,
where U is a finite non-empty set of objects, A T i is a finite non-empty set of attributes of each subsystem, { V a } is the value of attribute a A T i , and f i : U × A T i { ( V a ) a A T i } such that for all x U and a A T i , f i ( x , a ) V a .
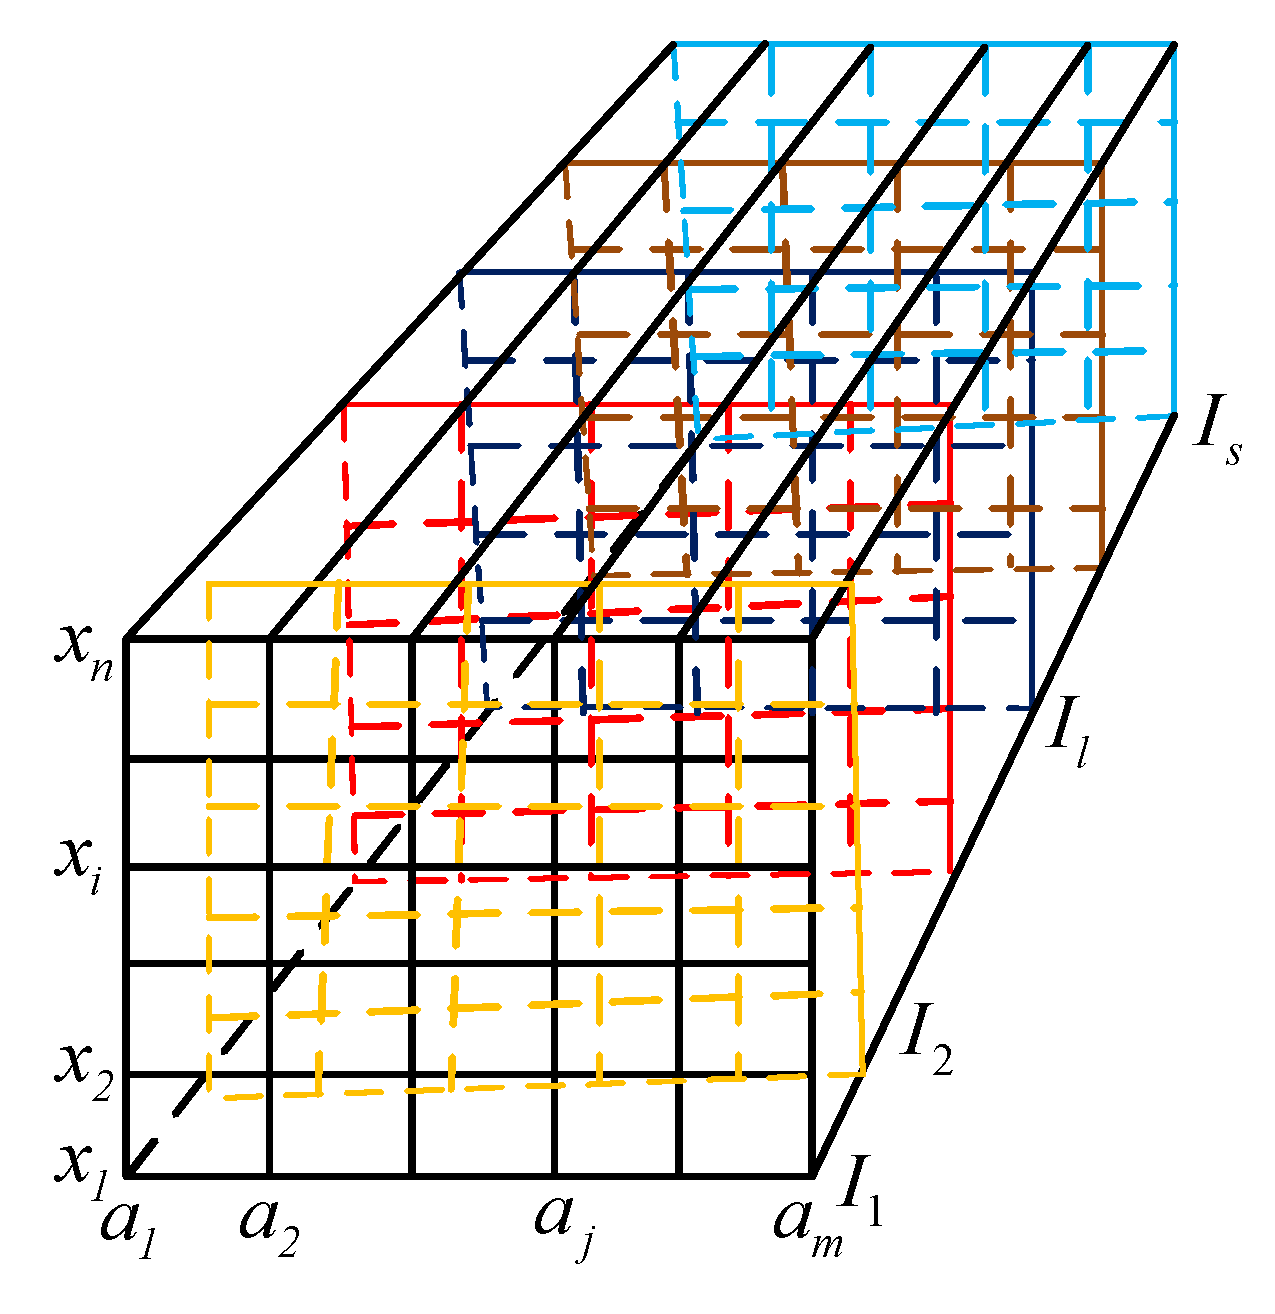
In particular, a multi-source decision information system is given by M S = { I S i | I S i = ( U , A T i , { ( V a ) a A T i } , f i , D , g ) } , where D is a finite non-empty set of decision attributes and g d : U V d for any d D , where V d is the domain of decision attribute d. The multi-source information system includes s single information sources. Let the s overlapping pieces of single-source information system form an information box with s levels, as shown Figure 1, which comes from our previous study [35].

3.2. Multi-Source Incomplete Information System

Definition 2.
A multi-source incomplete information system ( M I I S ) is defined as M I I S = { I I S i | I I S i = ( U , A T i , { ( V a ) a A T i } , f i ) } , where
  • I I S i is the incomplete information system of subsystem i;
  • U is a finite non-empty set of objects;
  • A T i is the finite non-empty set of attributes for subsystem i;
  • { V a } is the value of attribute a A T i ;
  • f i : U × A T i { ( V a ) a A T i } such that for all x U and a A T i , f i ( x , a ) V a .
In particular, a multi-source decision information system is given by M I I S = { I I S i | I I S i = ( U , A T i , { ( V a ) a A T i } , f i , D , g ) } , where D is a finite non-empty set of decision attributes and g d : U V d for any d D , where V d is the domain of decision attribute d.

3.3. Multi-Source Incomplete Information Fusion

Because the information box in each table is not complete, we propose a new fusion method.
Definition 3.
Let I be an incomplete information system ( I I S ) and U = { x 1 , x 2 , , x n } . a A T , x i , x j U , we define the distance between any two objects in U with attribute a as follows.
d i s a ( x i , x j ) = 0 , i f f ( x i , a ) = o r f ( x j , a ) = ; f ( x i , a ) f ( x j , a ) e l s e .
Definition 4.
Given an incomplete information system I I S = ( U , A T , V , f ) , for any attribute a A T , let T ( a ) denote the binary tolerance relation between objects that are possibly indiscernible in terms of a. T ( a ) is defined as
T ( a ) = { ( x , y ) d i s a ( x , y ) L a } ,
where L a indicates the threshold associated with attribute a. The tolerance class of object x with reference to attribute a is denoted by T a ( x ) = { y | ( x , y ) T ( a ) } .
Definition 5.
Given an incomplete information system I I S = ( U , A T , V , f ) , for any attribute subset B A T , let T ( B ) denote the binary tolerance relation between objects that are possibly indiscernible in terms of B. T ( B ) is defined as
T ( B ) = a B T ( a ) .
The tolerance class of object x with respect to an attribute set B is denoted by T B ( x ) = { y | ( x , y ) T ( B ) } .
In the literature [39], Dai et al. proposed a new conditional entropy to evaluate the uncertainty in an incomplete decision system. Given an incomplete decision system I D S = ( U , A T D T , V , f ) , U = { u 1 , u 2 , , u n } . B A T is a set of attributes, and U / D = { Y 1 , Y 2 , , Y m } . The conditional entropy of D with respect to B is defined as
H ( D B ) = i = 1 U j = 1 m T B ( u i ) Y j U log T B ( u i ) Y j T B ( u i ) .
Because the conditional entropy is monotonous and because the attribute set B increases in importance as the conditional entropy decreases, we have the following definitions:
Definition 6.
Let I 1 , I 2 , , I s be s incomplete information systems and U = { u 1 , u 2 , , u n } . a A T , U / D = { Y 1 , Y 2 , , Y m } . The uncertainty of the information sources in D with respect to I q ( q = 1 , 2 , , s ) for attribute a is defined as
H a ( D I q ) = i = 1 U j = 1 m T a q ( u i ) Y j U log T a q ( u i ) Y j T a q ( u i ) ,
where T a q ( u i ) is the tolerance class of the information sources in D with respect to I q ( q = 1 , 2 , , s ) for attribute a.
Because the conditional entropy of Dai [39] is monotonous, H a ( D I q ) ( q = 1 , 2 , , s ) for attribute a is also monotonous, and for attribute a, the smaller the conditional entropy is, the more important the information source is. We have the following Definition 7:
Definition 7.
Let I 1 , I 2 , , I s be s incomplete information system. We define the l t h ( l = 1 , 2 , , s ) incomplete information system, which is the most important for attribute a, as follows:
l a = a r g   m i n q { 1 , 2 , , s } ( H a ( D | I q ) ) ,
where l a represents the l t h information source, which is the most important for attribute a.
Example 1.
Let us consider a real medical examination issue at a hospital. When diagnosing leukemia, there are 10 patients, x i ( i = 1 , 2 , , 10 ) , to be considered. They undergo medical examinations at four hospitals, which test 6 indicators, a i ( i = 1 , 2 , , 6 ) , where a 1 a 6 are, respectively, the “hemoglobin count,” “leukocyte count,” “blood fat,” “blood sugar,” “platelet count,” and “ H b level”. Table 1, Table 2, Table 3 and Table 4 are incomplete evaluation tables based on the medical examinations performed at the four hospitals; the symbol “∗” means that an expert cannot determine the level of a project.
Suppose V D = { L e u k e m i a p a t i e n t , N o n l e u k e m i a p a t i e n t } and U / D = { Y 1 , Y 2 } , where Y 1 = { x 1 , x 2 , x 6 , x 8 , x 9 } , Y 2 = { x 3 , x 4 , x 5 , x 7 , x 10 } . Then, the conditional entropy of the information sources of D with respect to I q ( q = 1 , 2 , 3 , 4 ) for attribute a i ( i = 1 , 2 , , 6 ) is as follows:
Because the conditional entropy can be used to evaluate the importance of information sources for attribute a, we can determine the importance of all attributes for all information sources by using Definition 7 and Table 5. The smaller the conditional entropy is, the more important the information sources are for attribute a. Therefore, I 1 is the most important for a 1 and a 6 , I 2 is the most important for a 3 and a 5 , and I 4 is the most important for a 2 and a 4 . I 3 is not the most important for any attribute. A new information system, ( N I S ) is established by part of each table. Furthermore, we take I 1 for the value of a property for a 1 and a 6 , I 2 for the property’s value for a 3 and a 5 , and I 4 for the property’s value for a 2 and a 4 . That is, N I S = ( V a 1 I 1 , V a 2 I 4 , V a 3 I 2 , V a 4 I 4 , V a 5 I 2 , V a 6 I 1 ) , where V a i I q ( q = 1 , 2 , 3 , 4 ; i = 1 , 2 , , 10 ) represents the range of attribute a i under I q , and we obtain the new information system ( N I S ) after fusion. The new information system, ( N I S ) , after fusion is shown in Table 6.
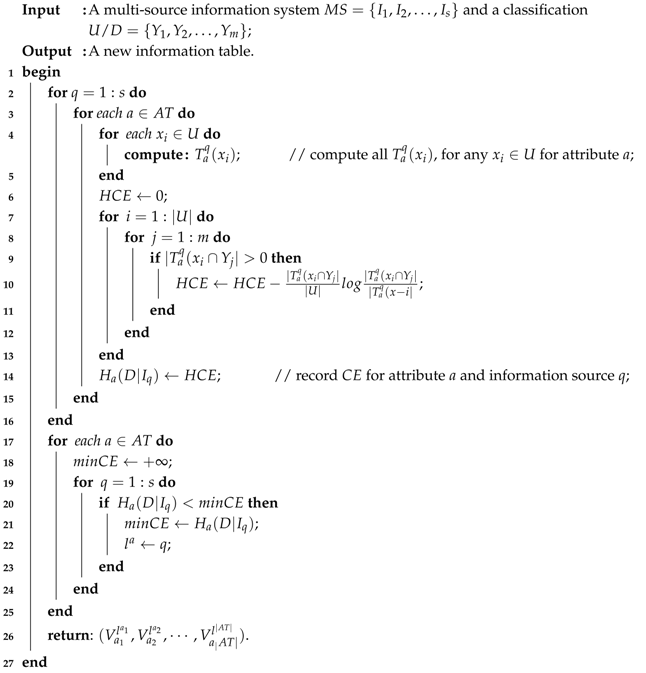
The fusion process is shown in Figure 2. Suppose that there is a multi-source information system M S = { I 1 , I 2 , , I s } that contains s information systems and that there are n objects and m attributes in each information system I i ( i = 1 , 2 , , s ) . We calculate the conditional entropy of each attribute by using Definition 6. Then, we determine the minimum of the conditional entropy for each attribute of the values using Definition 7. For example, we use different colors of rough lines to express the corresponding attributes to select a source. Then, the selected attribute values are integrated into a new information system.
In practical applications, the mean value fusion method is one of the common fusion methods. We compare this type of method with conditional entropy fusion based on approximation accuracy. The results of two types of fusion method are presented in Table 6 and Table 7.
Using Table 6 and Table 7, we compute the approximation accuracy of the results of the two fusion methods and compare their approximation accuracy. Please see Table 8.
By comparing the approximation accuracies, we see that multi-source fusion is better than mean value fusion. Therefore, we design a multi-source fusion algorithm (Algorithm 1) and analyze its computational complexity.
The given algorithm (Algorithm 1) is a new approach to multi-source information fusion. Its approximation accuracy is better than that of mean value fusion in the result of example Section 3.3. First, we can calculate all the similarity classes T a q ( x ) for any x U for attribute a. Then, the conditional entropy, H a ( D | I q ) , is computed for information source q and attribute a. Finally, the minimum of the conditional entropy of the information source is selected for attribute a, and the results are spliced into a new table. The computational complexity of Algorithm 1 is shown in Table 9.
Algorithm 1: An algorithm for multi-source fusion.
Entropy 19 00570 i001
In steps 4 and 5 of Algorithm 1, we compute all T a q ( x ) for any x U for attribute a. Steps 6–14 calculate the conditional entropy for information source q and attribute a. Steps 17–26 are to find the minimum of the conditional entropy of the corresponding source for any a A T . Finally, the results are returned.

4. Experimental Evaluation

In this section, to further illustrate the correctness of the conclusions of the previous example, we conduct a series of experiments to explain why the approximate precision of conditional entropy fusion is generally higher than that of the mean value fusion based on standard data sets from the machine learning data repository of the University of California at Irvine (http://archive.ics.uci.edu/ml/datasets.html) called “Statlog (Vehicle Silhouettes)”, “Letter Recognition”, “Phishing Websites”, “Robot Execution Failures”, “Semeion Handwritten Digit”, and “SPECTF Heart” in Table 10. The experimental program is running on a personal computer with the hardware and software described in Table 11.
To build a real multi-source incomplete information system, we propose a method for obtaining incomplete data from multiple sources. First, to obtain incomplete data, a complete data set with some data randomly deleted is used as the original incomplete data set. Then, a multi-source incomplete decision table is constructed by adding Gaussian noise and random noise to the original incomplete data set.
Let M I I S = { I 1 , I 2 , , I s } be a multi-source incomplete decision table constructed using the original incomplete information table, I.
First, s numbers ( g 1 , g 2 , , g s ) that have an N ( 0 , σ ) distribution, where σ is the standard deviation, are generated. The method of adding Gaussian noise is as follows:
I i ( x , a ) = I ( x , a ) + g i if ( I ( x , a ) ) else ,
where I ( x , a ) is the value of object x with attribute a in the original incomplete information table and I i ( x , a ) represents object x with attribute a in the i-th incomplete information source.
Then, s random numbers ( e 1 , e 2 , , e s ) between e and e, where e is a random error threshold, are generated. The method of adding random noise is as follows:
I i ( x , a ) = I ( x , a ) + e i if ( I ( x , a ) ) else ,
where I ( x , a ) represents the value of object x for attribute a in the original incomplete information table and I i ( x , a ) represents object x for attribute a in the i-th incomplete information source.
Next, 40% of the objects are randomly selected from the original incomplete information table, I, and Gaussian noise is added to these objects. Then, 20% of the objects are randomly selected from the rest of the original incomplete information table, I, and random noise is added to these objects.
Finally, a multi-source incomplete decision table, M I I S = { I 1 , I 2 , , I s } , can be created.

5. Related Works and Conclusion Analysis

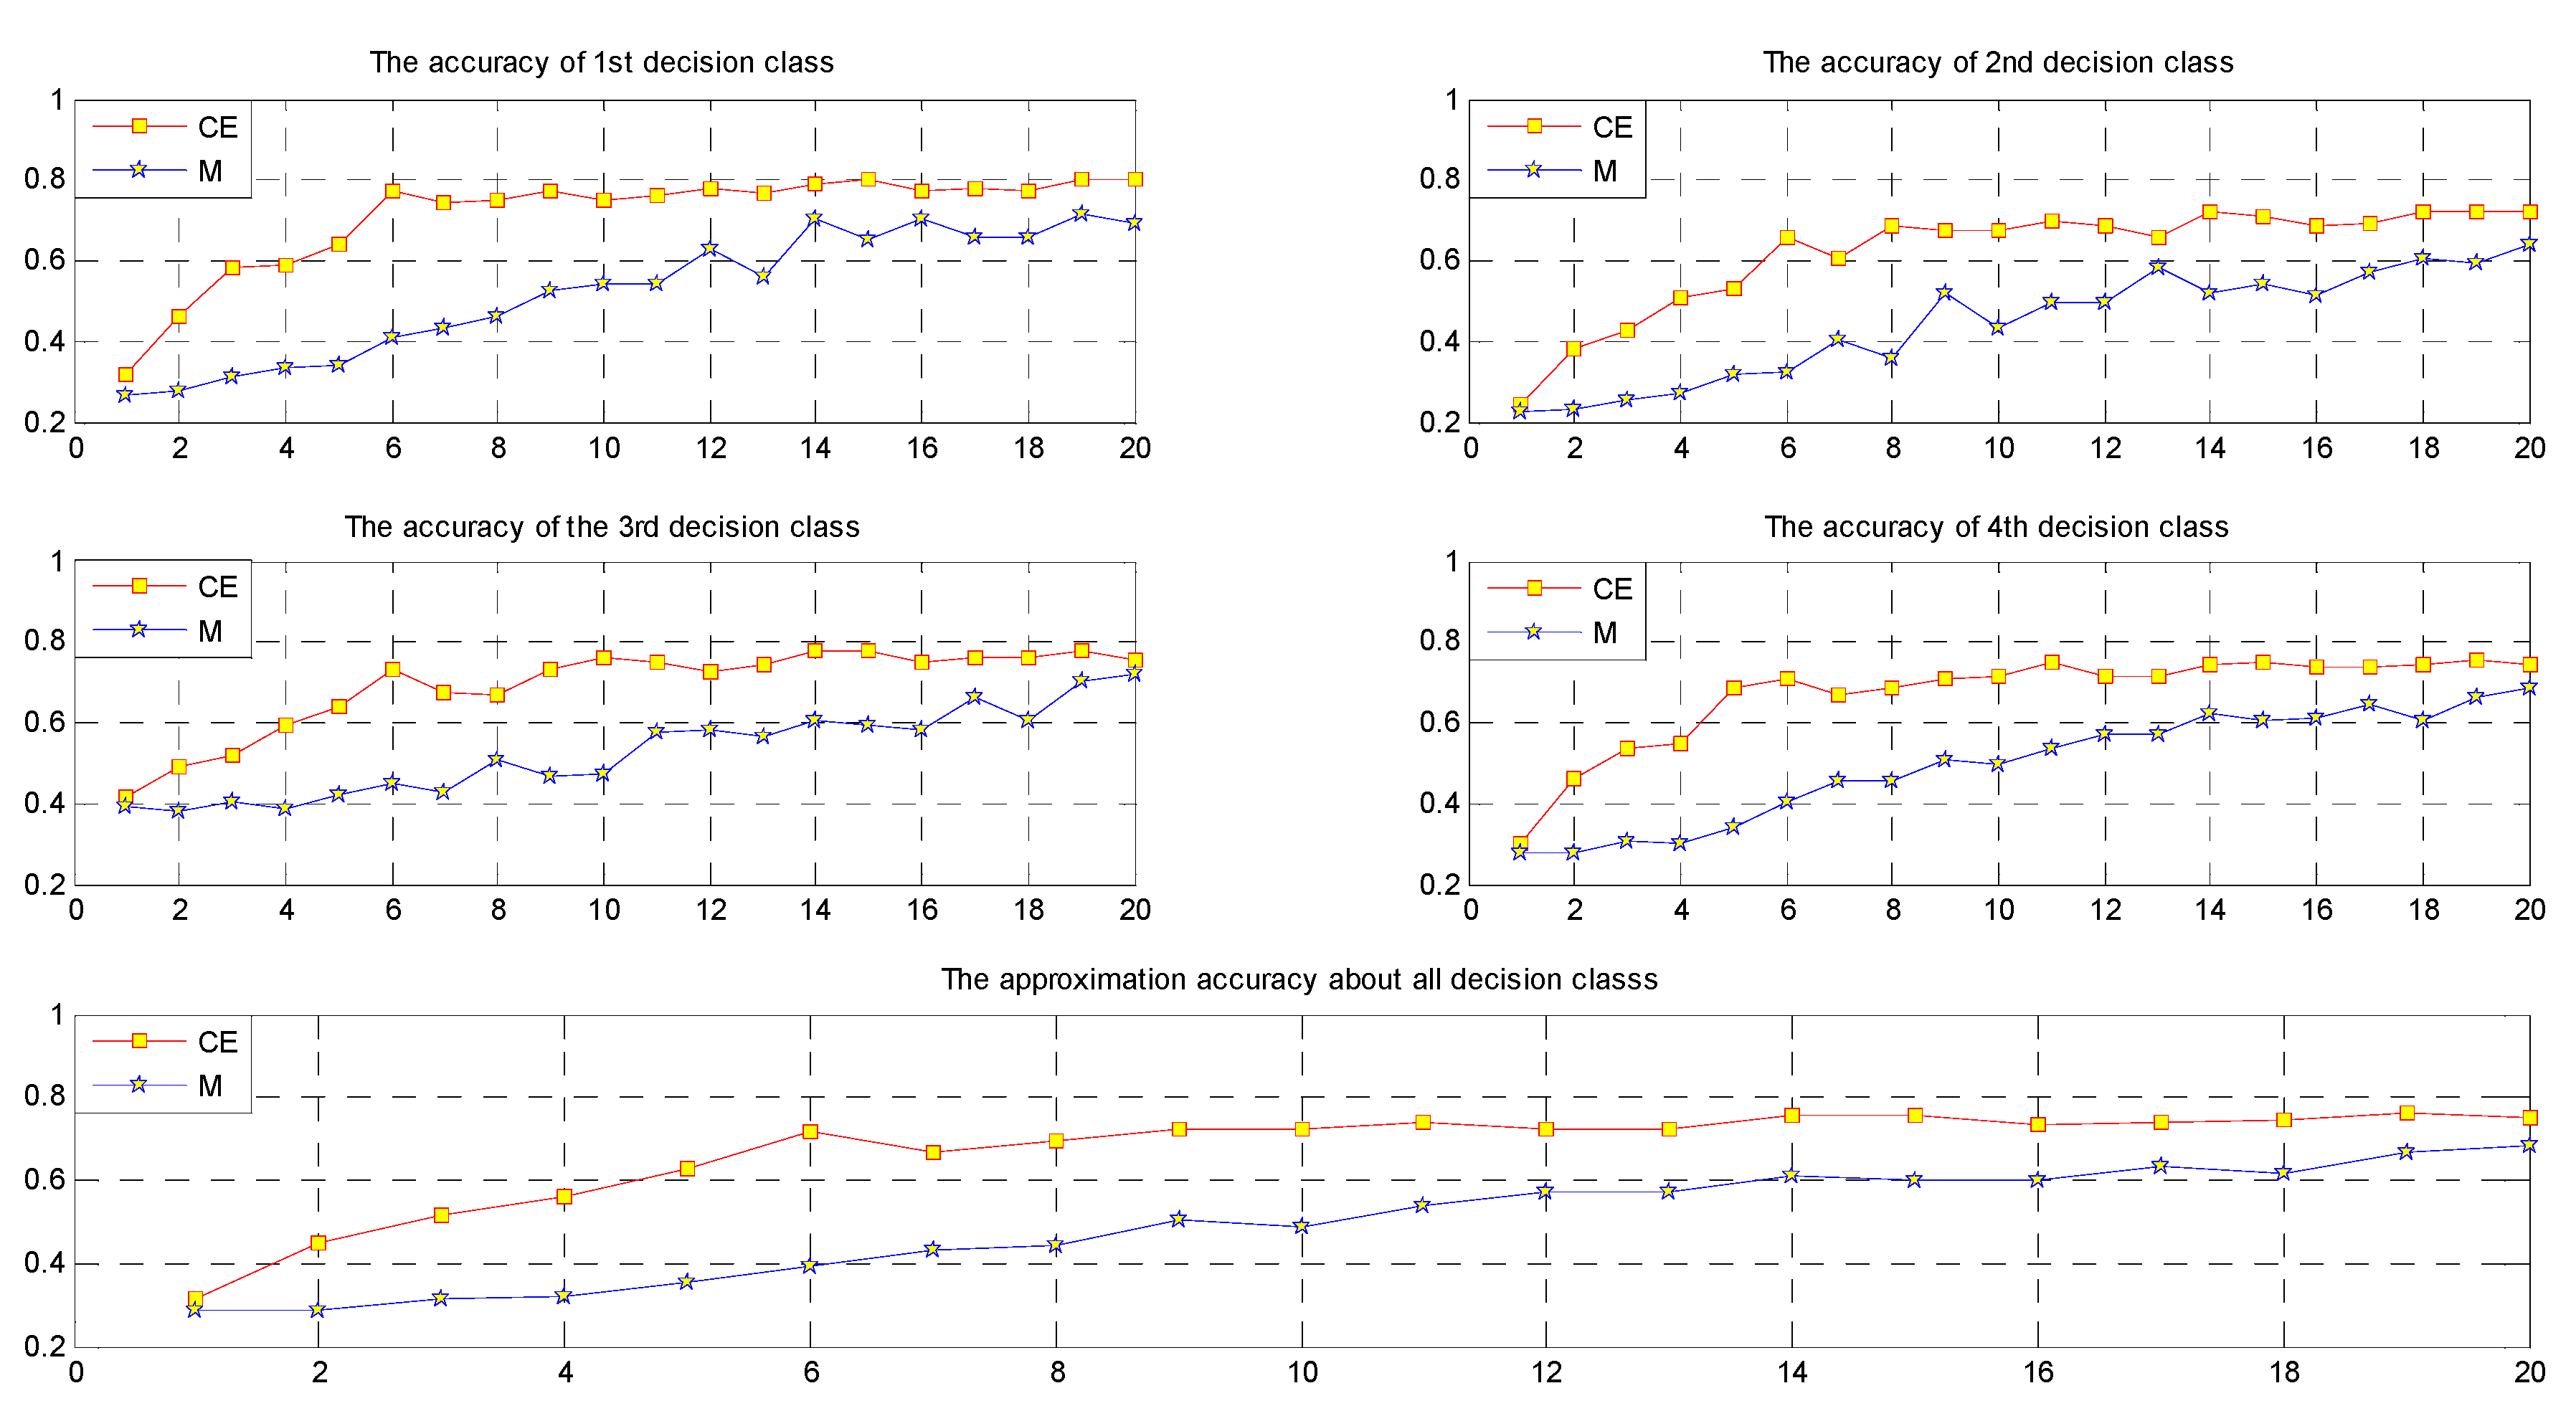
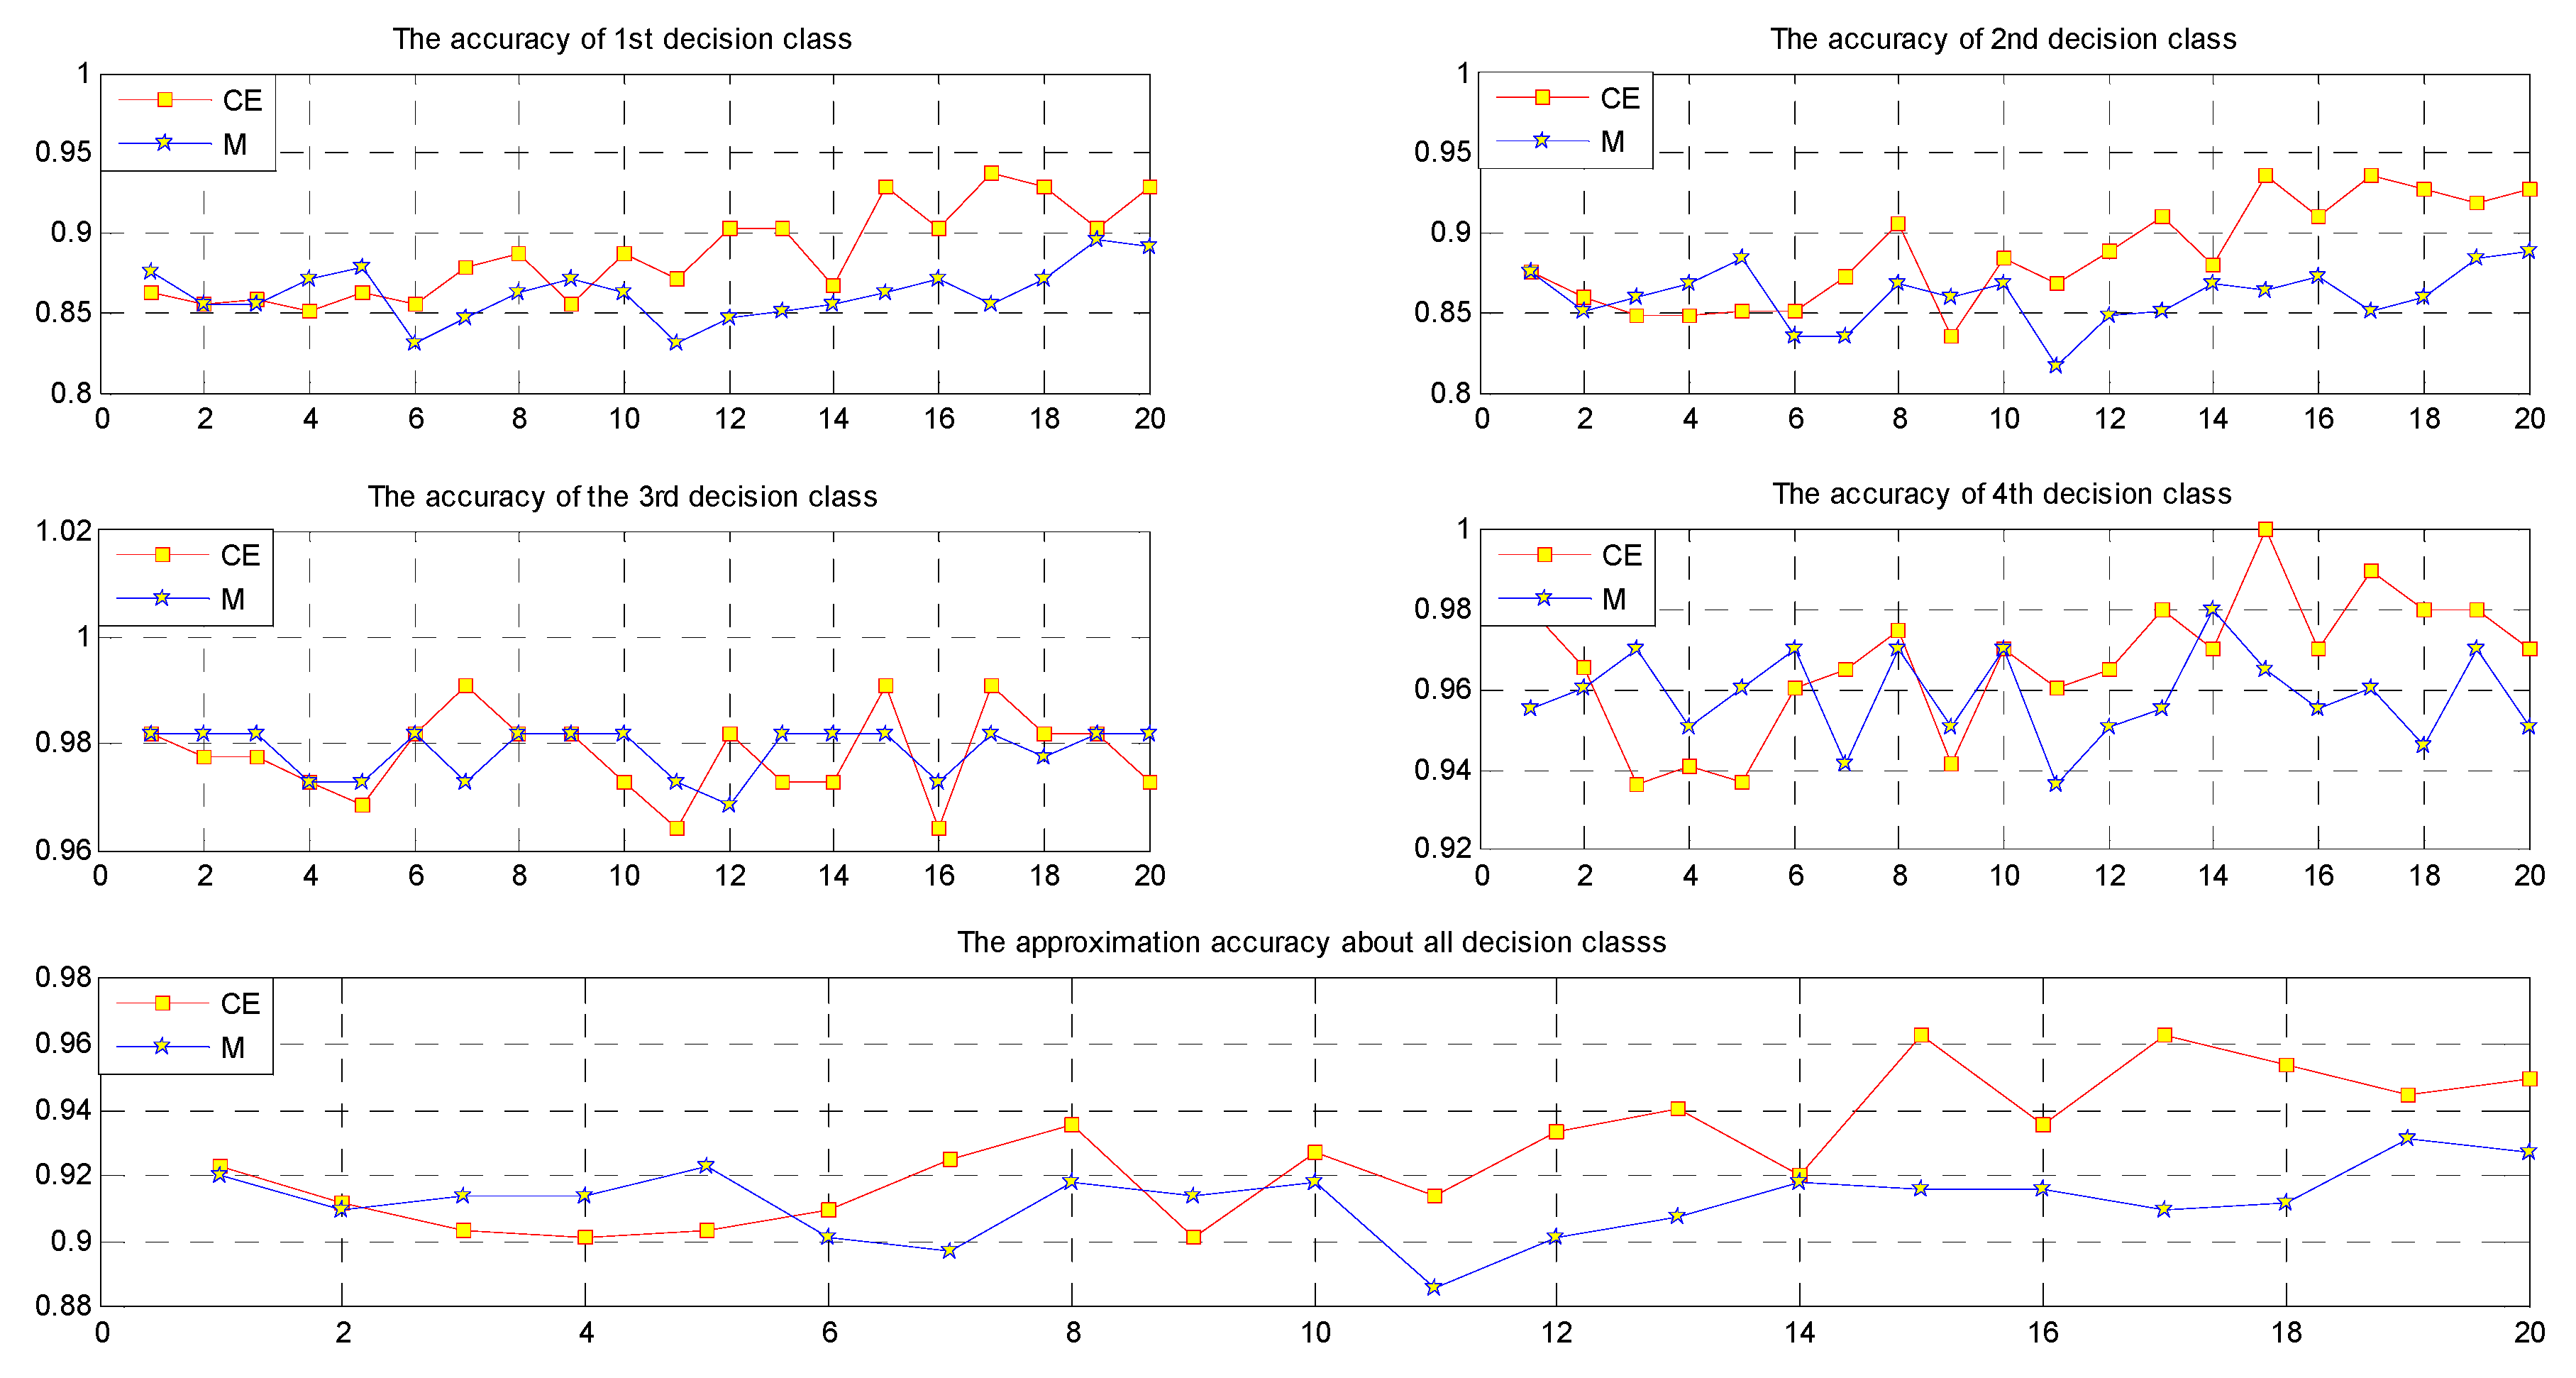
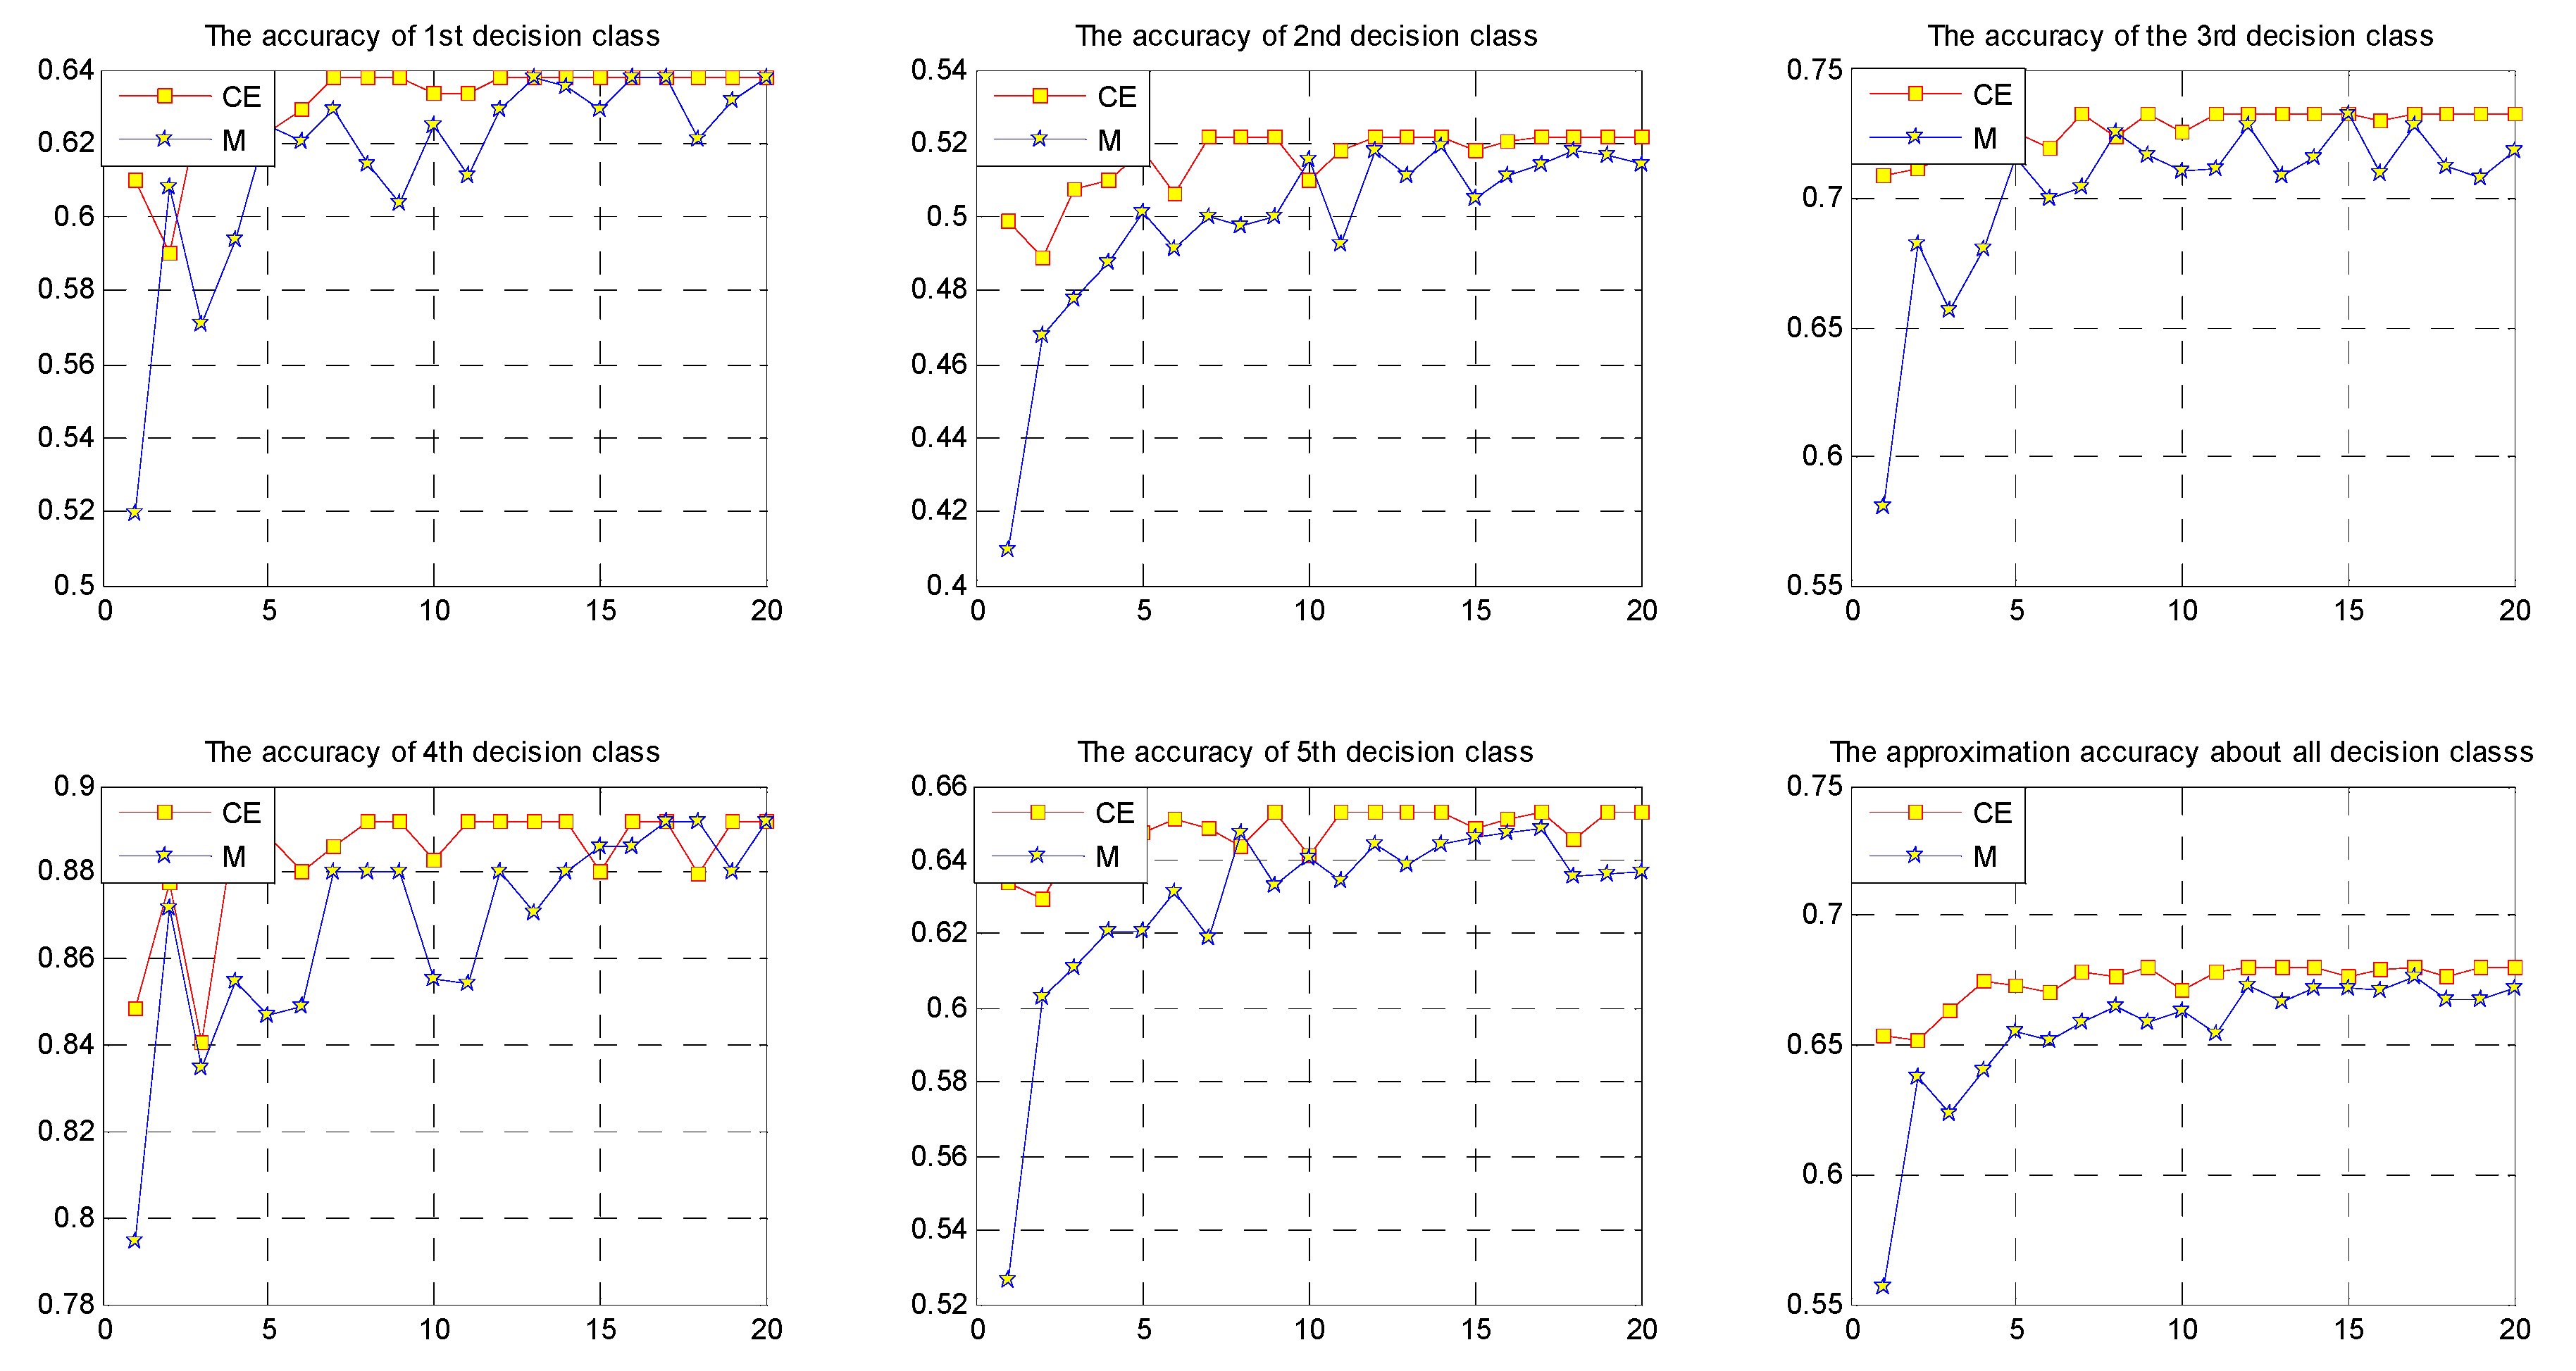
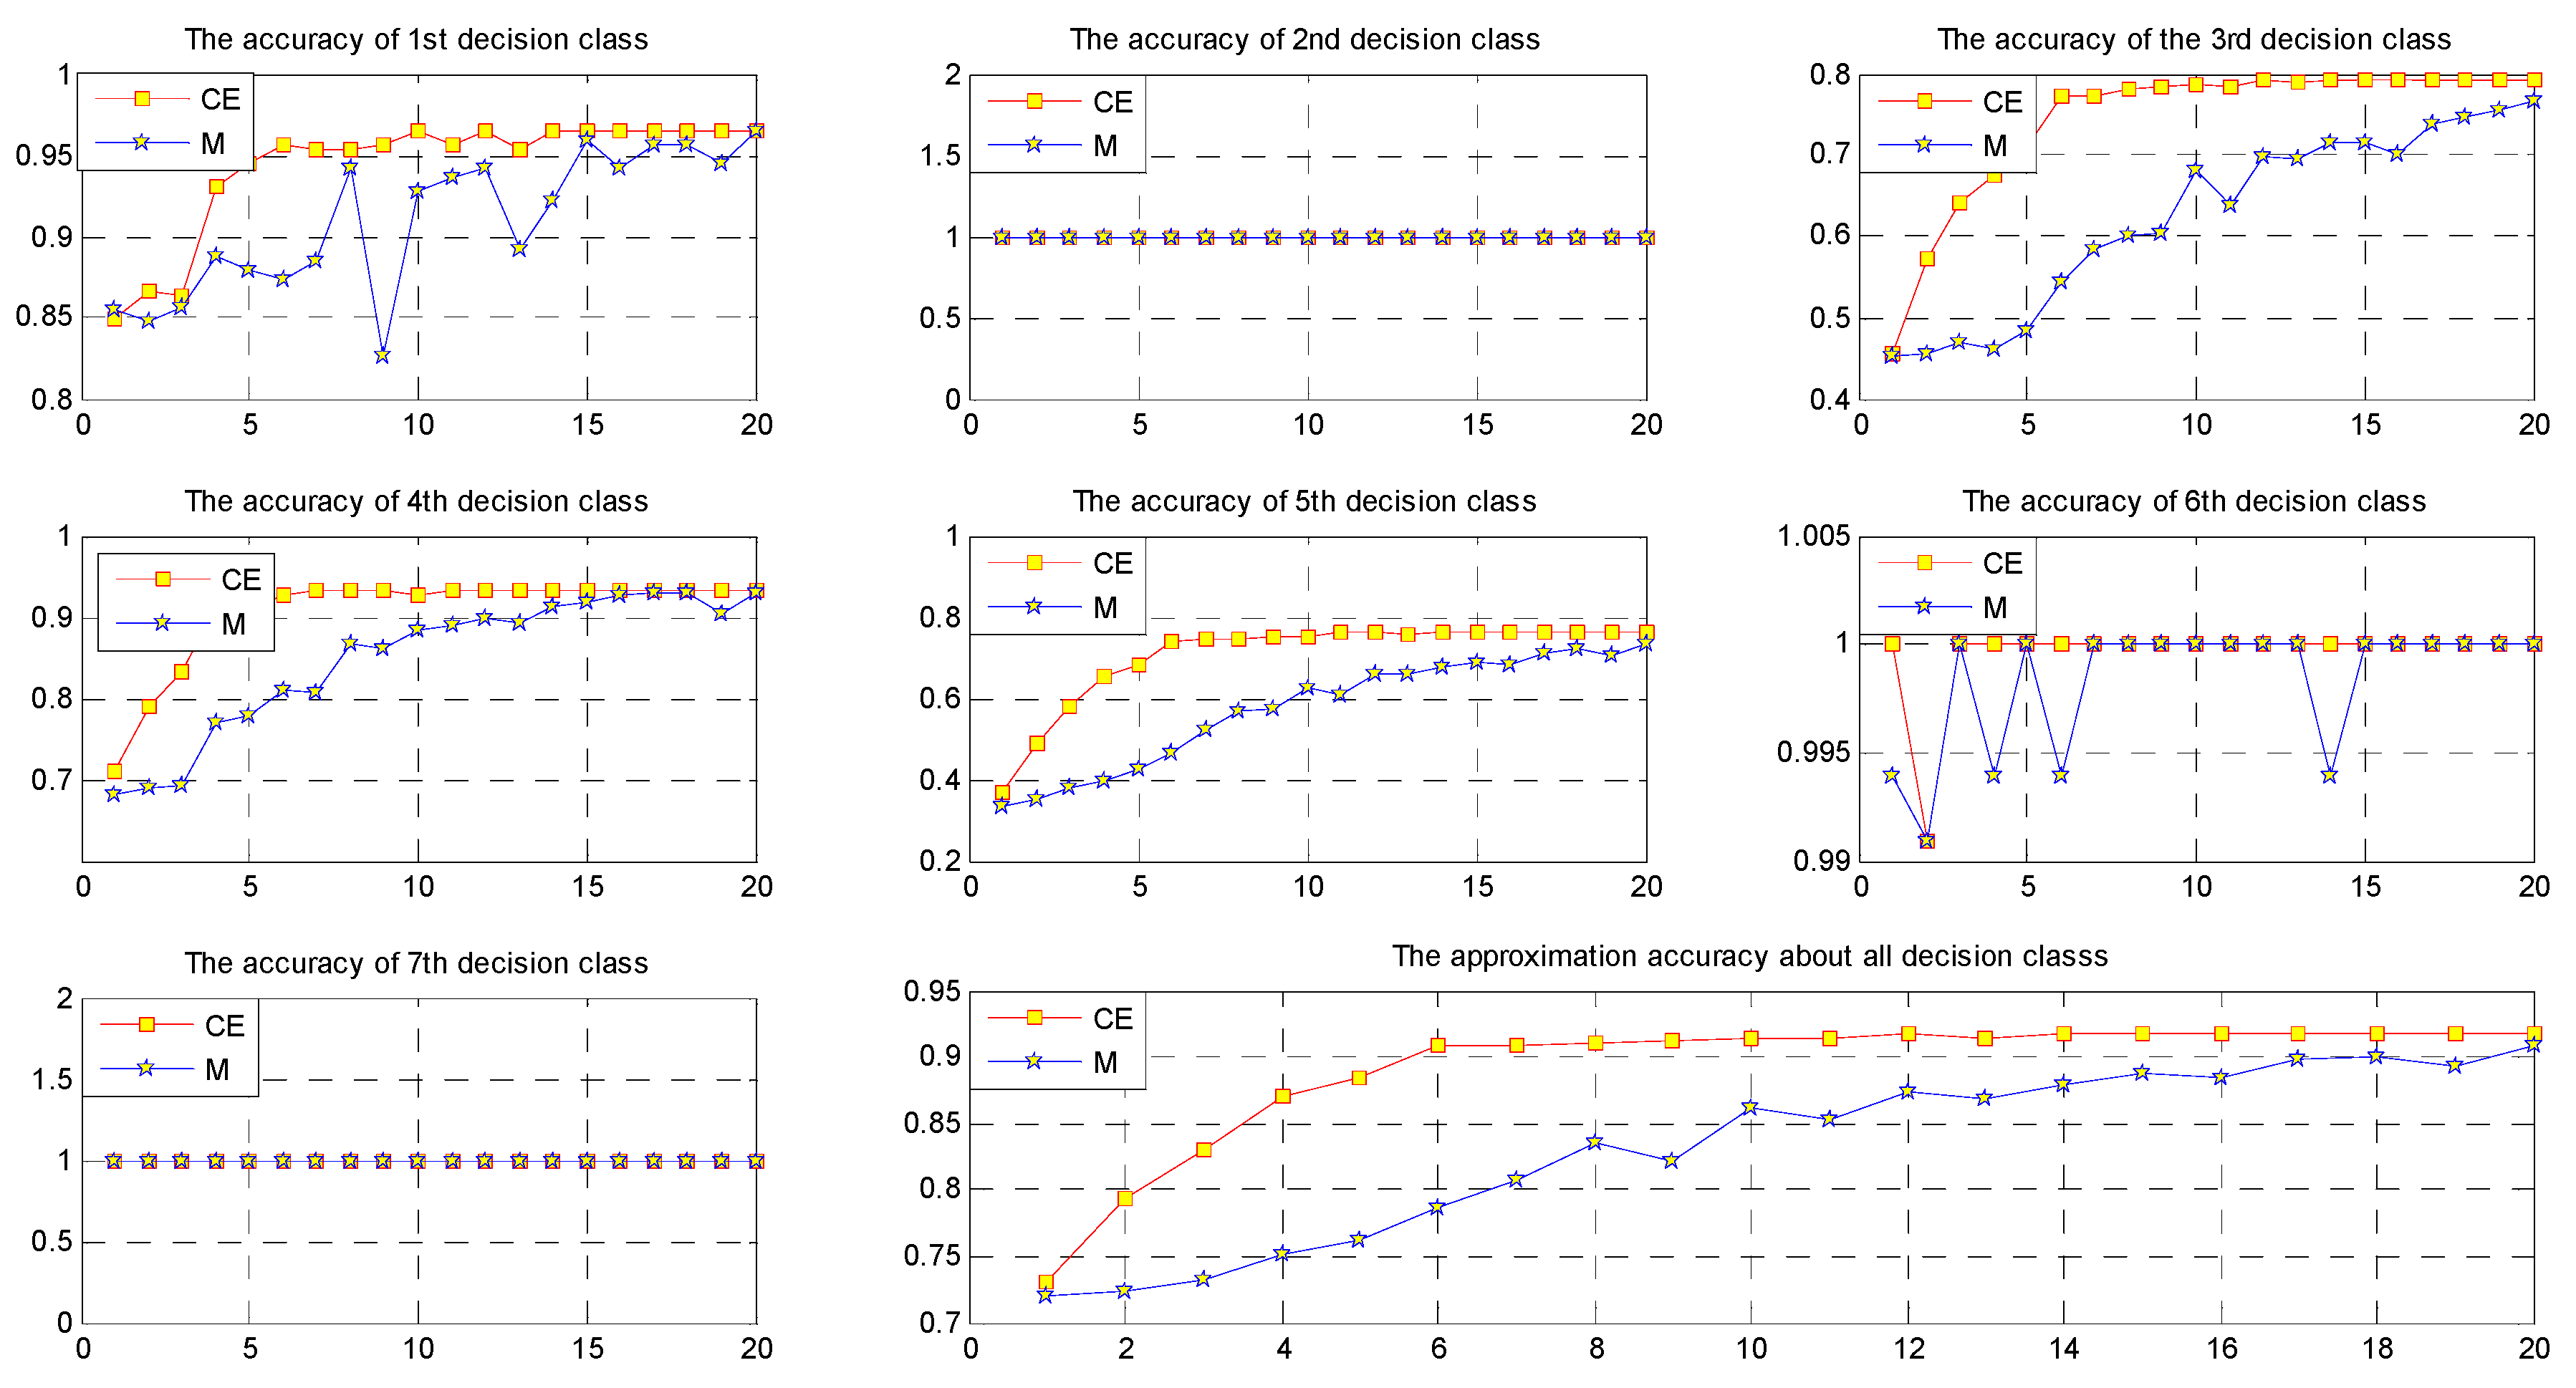
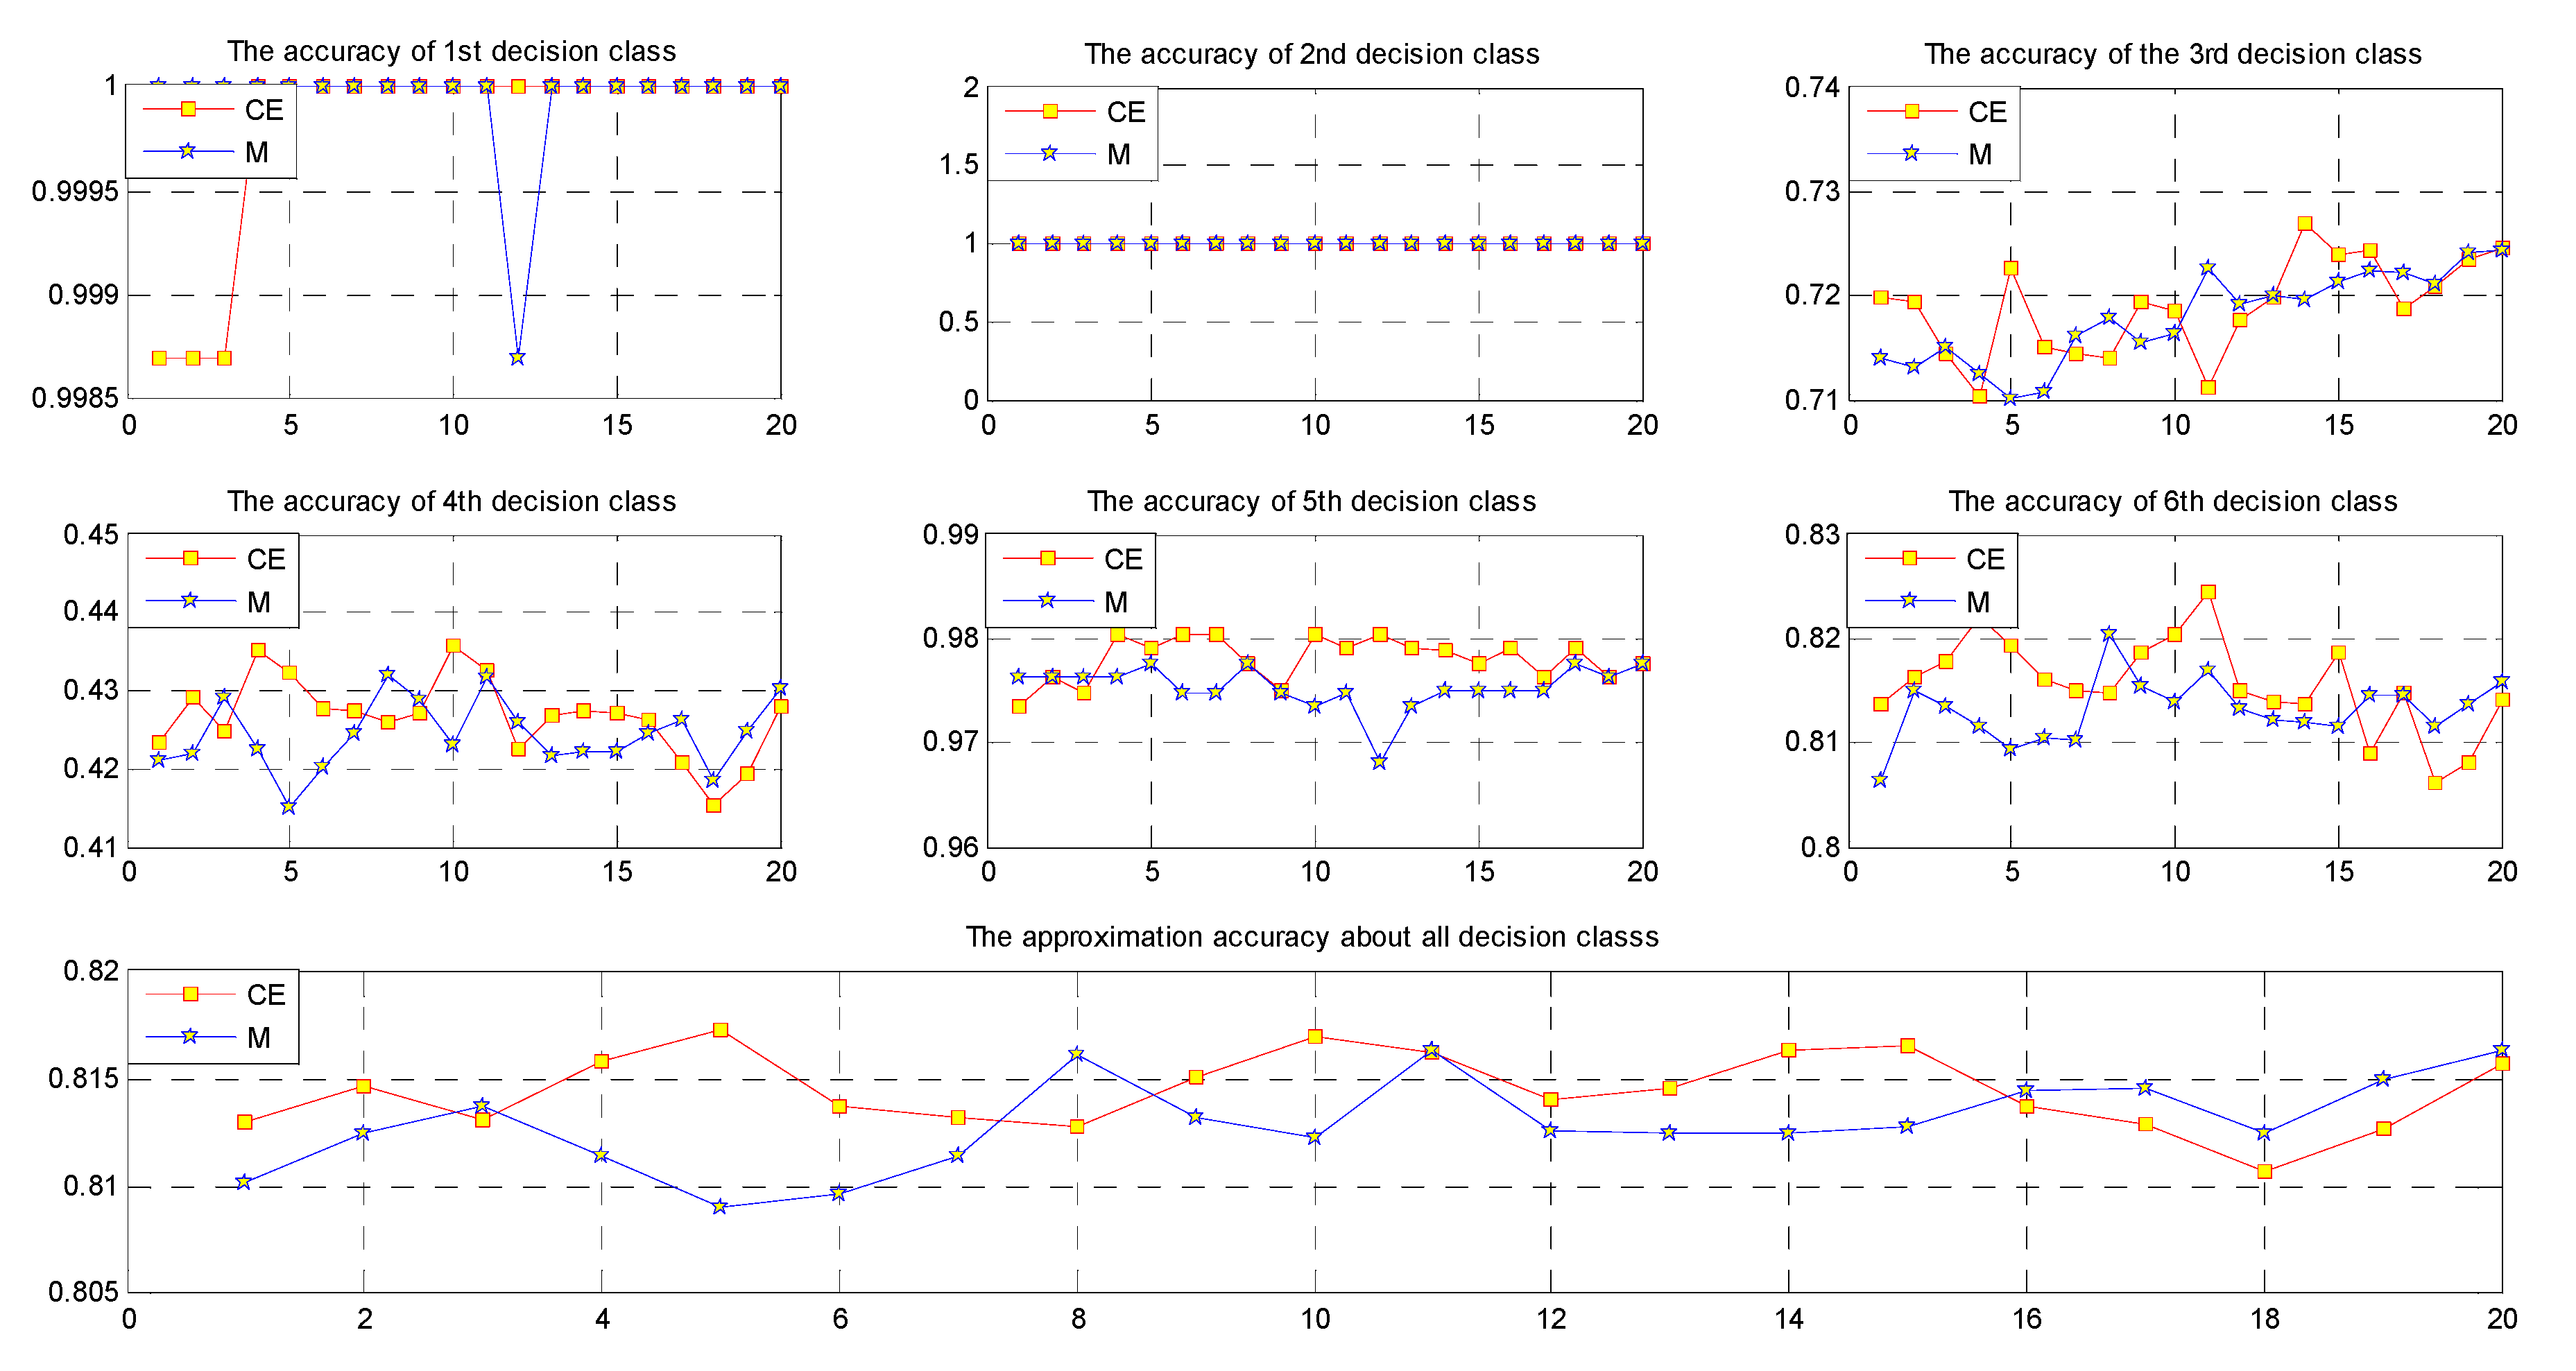
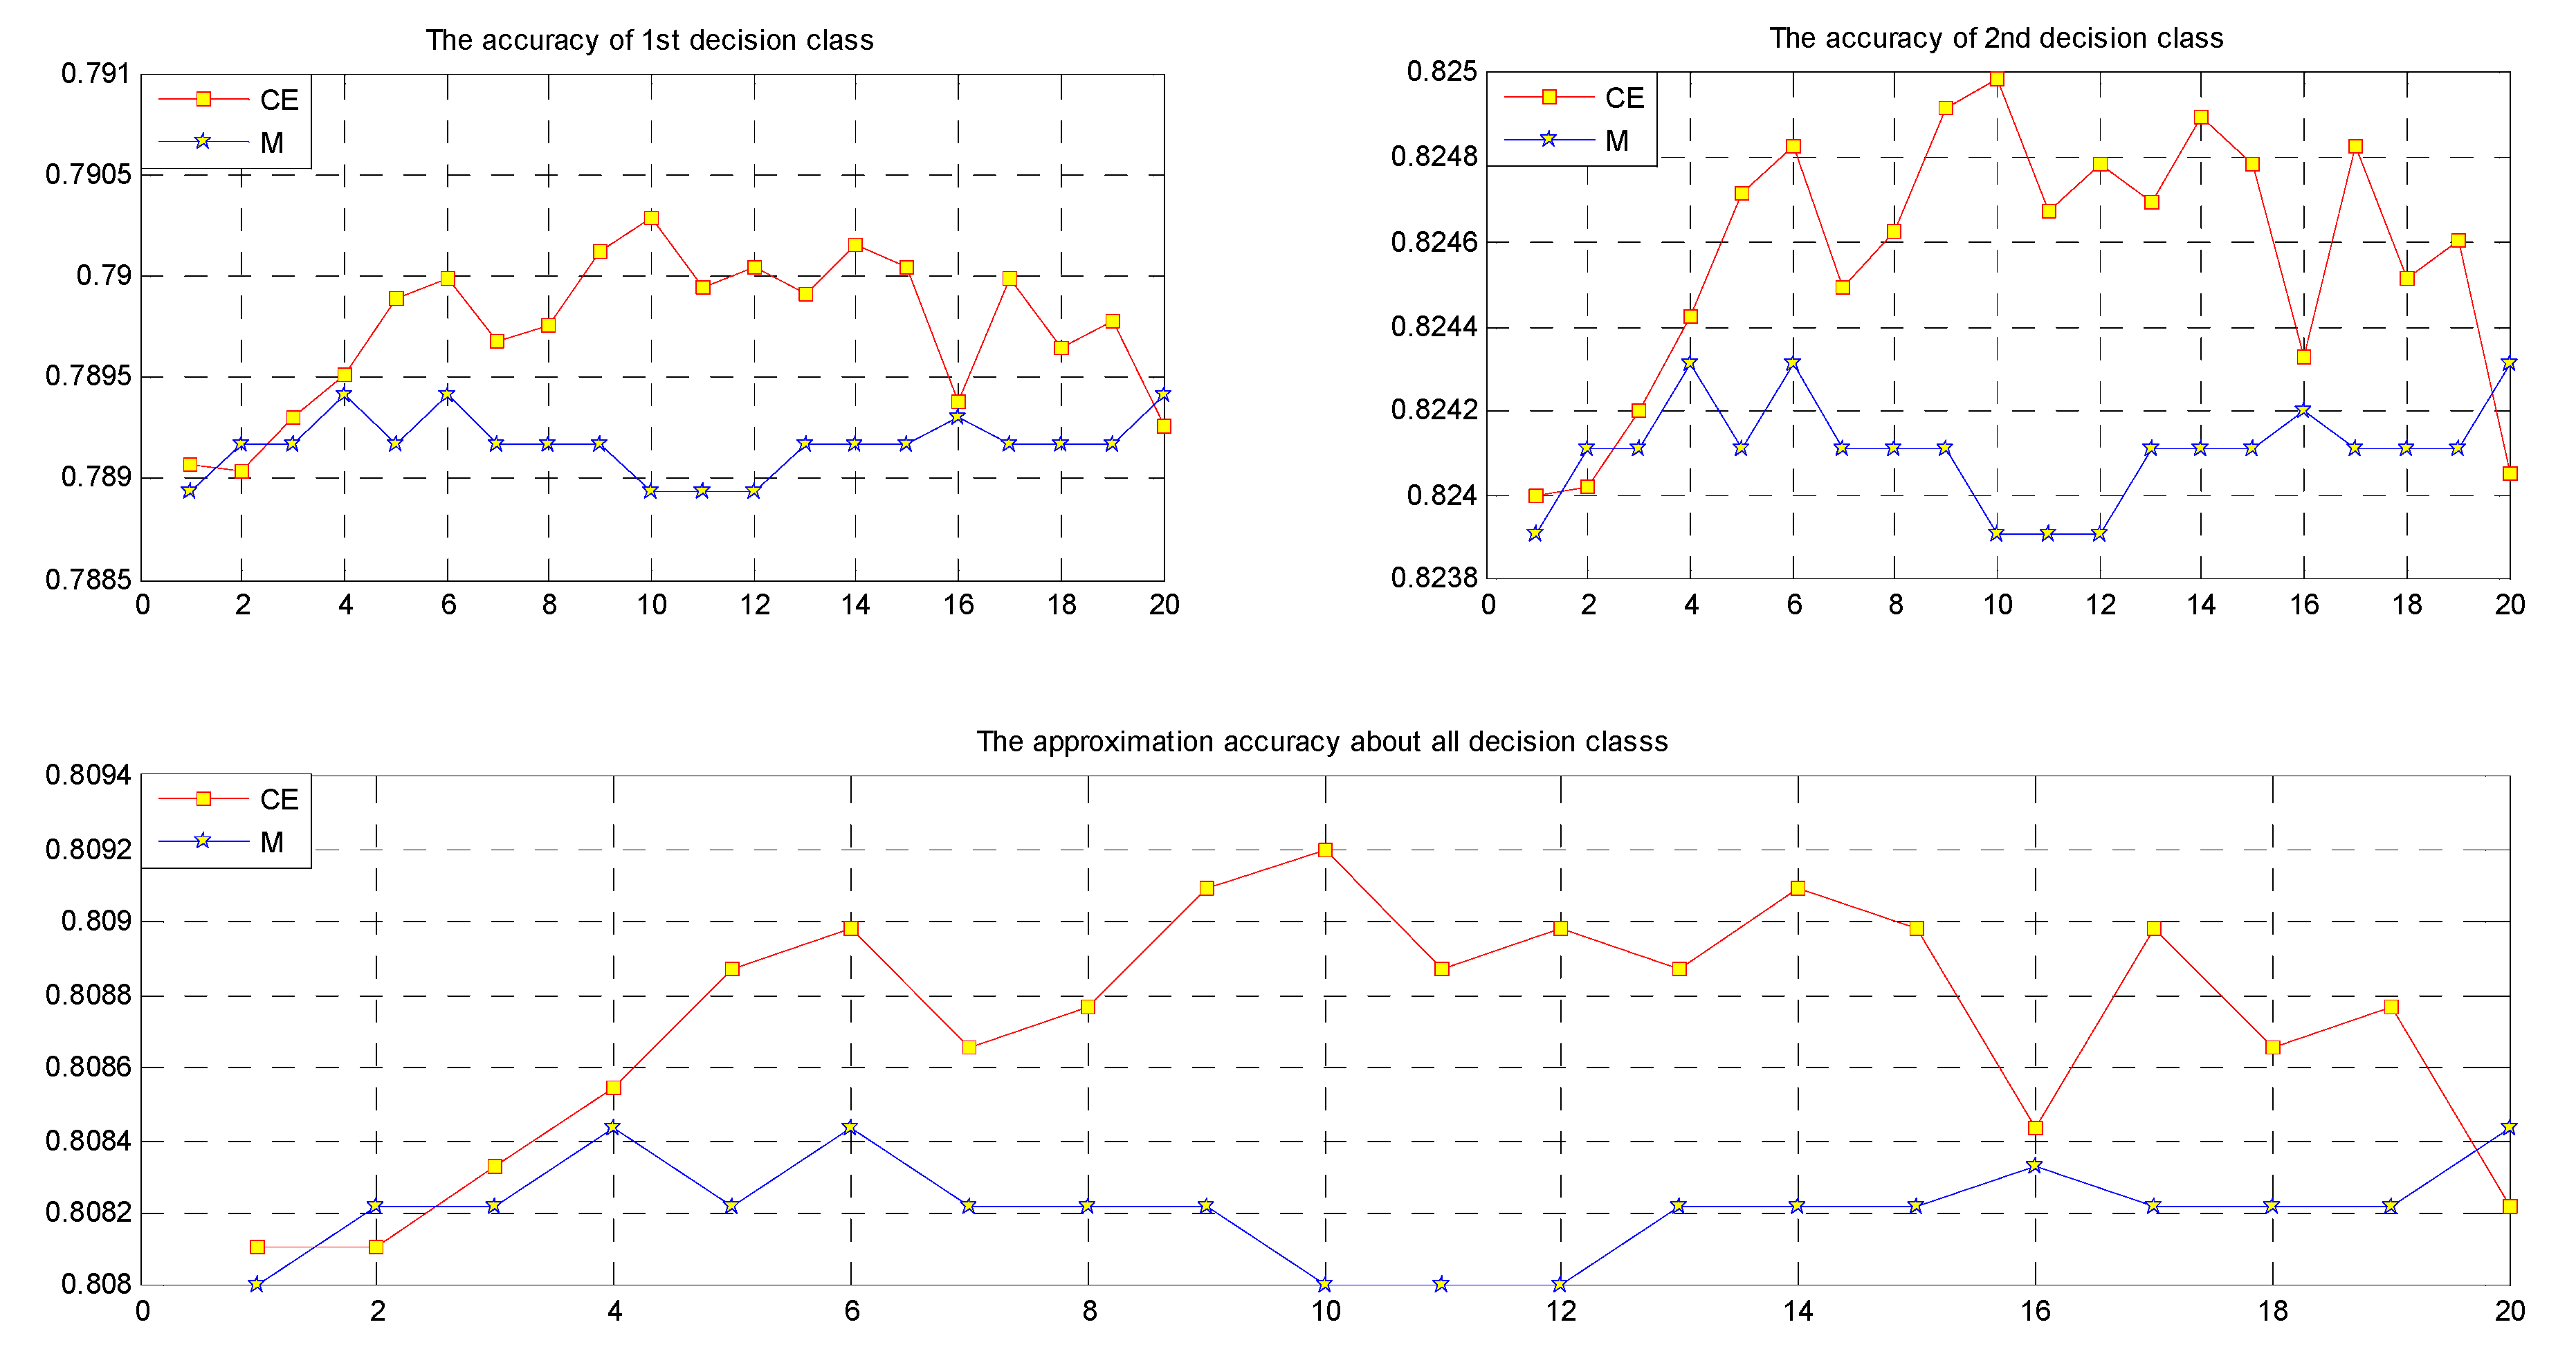
In different fields of science, the standard deviation of Gaussian noise and the random error threshold of random noise may differ. In this paper, we conducted 20 experiments for each data set and set the standard deviation σ and the random error threshold e to values from 0 to 2, with an increase of 0.1 in each experiment. For CE fusion and mean value fusion, the approximation accuracy of U / D for each data set is displayed in Table 12 and Figure 3, Figure 4, Figure 5, Figure 6, Figure 7 and Figure 8. CE and M stand for CE fusion and mean value fusion, respectively.
We can easily see from Figure 3, Figure 4, Figure 5, Figure 6, Figure 7 and Figure 8 and Table 12 that when the noise is small, in most cases, the approximation accuracy of CE fusion is slightly higher than that of mean value fusion. In a certain range, as the noise increases, the approximation accuracy of CE fusion becomes much better than that of mean value fusion.
By observing the approximation accuracies of the extensions of concepts of CE and mean value fusion for the six data sets, we find that in most cases, the approximation accuracy of CE fusion is higher than that of mean value fusion. In a certain range, as the amount of noise increases, the accuracies of the extensions of concepts of CE and mean value fusion trend upward, but they are not strictly monotonic.

6. Conclusions

In this paper, we studied multi-source information fusion in view of the conditional entropy. There are many null information sources in the age of big data. To solve the problem of integrating multiple incomplete information sources, we studied an approach based on multi-source information fusion. We transformed a multi-source information system into an information table by using this fusion method. Furthermore, we used rough set theory to investigate the fused information table, and compared the accuracy of our fusion method with that of the mean value fusion method. According to the accuracies, CE fusion is better than mean value fusion under most conditions. In this paper, we constructed six multi-source information systems, each containing 10 single information sources. Based on these data sets, a series of experiments was conducted; the results showed the effectiveness of the proposed fusion method. This study will be useful for fusing uncertain information in multi-source information systems. It provides valuable selections for data processing in multi-source environments.

Acknowledgments

The authors wish to thank the anonymous reviewer. This work is supported by the Natural Science Foundation of China (No. 61105041, No. 61472463 and No. 61402064), the National Natural Science Foundation of CQ CSTC (No. cstccstc2015jcyjA1390), the Graduate Innovation Foundation of Chongqing (No. CYS16217) and the Graduate Innovation Foundation of Chongqing University of Technology (No. YCX2016227).

Author Contributions

Mengmeng Li is the principal investigator of this work. He performed the simulations and wrote this manuscript. Xiaoyan Zhang contributed to the data analysis work and checked the whole manuscript. All authors revised and approved the publication.

Conflicts of Interest

The authors declare no conflicts of interest.

References

  1. Bleiholder, J.; Naumann, F. Data fusion. ACM Comput. Surv. 2008, 41, 1–41. [Google Scholar] [CrossRef]
  2. Lee, H.; Lee, B.; Park, K.; Elmasri, R. Fusion techniques for reliable information: A survey. Int. J. Digit. Content Technol. Appl. 2010, 4, 74–88. [Google Scholar]
  3. Khaleghi, B.; Khamis, A.; Karray, F.O. Multisensor data fusion: A review of the state of the art. Inf. Fusion 2013, 14, 28–44. [Google Scholar] [CrossRef]
  4. Han, C.Z.; Zhu, H.Y.; Duan, Z.S. Multiple-Source Information Fusion; Tsinghua University Press: Beijing, China, 2010. [Google Scholar]
  5. Peng, D. Theory and Application of Multi Sensor Multi Source Information Fusion; Thomson Learning Press: Beijing, China, 2010. [Google Scholar]
  6. Schueremans, L.; Gemert, D.V. Benef it of splines and neural networks in simulation based structural reliability analysis. Struct. Saf. 2005, 27, 246–261. [Google Scholar] [CrossRef]
  7. Pan, W.K.; Liu, Z.D.; Ming, Z.; Zhong, H.; Wang, X.; Xu, C.F. Compressed Knowledge Transfer via Factorization Machine for Heterogeneous Collaborative Recommendation. Knowl. Based Syst. 2015, 85, 234–244. [Google Scholar] [CrossRef]
  8. Wang, X.Z.; Huang, J. Editorial: Uncertainty in Learning from Big Data. Fuzzy Sets Syst. 2015, 258, 1–4. [Google Scholar] [CrossRef]
  9. Wang, X.Z.; Xing, H.J.; Li, Y.; Hua, Q.; Dong, C.R.; Pedrycz, W. A Study on Relationship between Generalization Abilities and Fuzziness of Base Classifiers in Ensemble Learning. IEEE Trans. Fuzzy Syst. 2015, 23, 1638–1654. [Google Scholar] [CrossRef]
  10. Hai, M. Formation drillability prediction based on multisource information fusion. J. Pet. Sci. Eng. 2011, 78, 438–446. [Google Scholar]
  11. Cai, B.; Liu, Y.; Fan, Q.; Zhang, Y.; Liu, Z.; Yu, S.; Ji, R. Multi-source information fusion based fault diagnosis of ground-source heat pump using Bayesian network. Appl. Energy 2014, 114, 1–9. [Google Scholar] [CrossRef]
  12. Ribeiro, R.A.; Falcão, A.; Mora, A.; Fonseca, J. FIF: A fuzzy information fusion algorithm based on multi-criteria decision. Knowl. Based Syst. 2014, 58, 23–32. [Google Scholar] [CrossRef]
  13. Wei, C.P.; Rodrguez, R.M.; Martnez, L. Uncertainty Measures of Extended Hesitant Fuzzy Linguistic Term Sets. IEEE Trans. Fuzzy Syst. 2017, 1. [Google Scholar] [CrossRef]
  14. Liu, Y.Y.; Luo, J.F.; Wang, B.; Qin, K. A theoretical development on the entropy of interval-valued intuitionistic fuzzy soft sets based on the distance measure. Int. J. Comput. Intell. Syst. 2017, 10, 569. [Google Scholar] [CrossRef]
  15. Yang, W.; Pang, Y.F.; Shi, J.R. Linguistic hesitant intuitionistic fuzzy cross-entropy measures. Int. J. Comput. Intell. Syst. 2017, 10, 120. [Google Scholar] [CrossRef]
  16. Pawlak, Z. Rough sets. Int. J. Comput. Inf. Sci. 1982, 11, 341–356. [Google Scholar] [CrossRef]
  17. Pawlak, Z. Rough set theory and its applications to data analysis. Cybern. Syst. 1998, 29, 661–688. [Google Scholar] [CrossRef]
  18. Pawlak, Z.; Skowron, A. Rough sets: Some extensions. Inf. Sci. 2007, 177, 28–40. [Google Scholar] [CrossRef]
  19. Pawlak, Z. Rough Sets: Theoretical Aspects of Reasoning About Data; Kluwer: Boston, MA, USA, 1991. [Google Scholar]
  20. Pawlak, Z. Vagueness and uncertainty: A rough set perspective. Comput. Intell. 1995, 11, 227–232. [Google Scholar] [CrossRef]
  21. Li, H.L.; Chen, M.H. Induction of multiple criteria optimal classification rules for biological and medical data. Comput. Biol. Med. 2008, 38, 42–52. [Google Scholar] [CrossRef] [PubMed]
  22. Liu, J.F.; Hu, Q.H.; Yu, D.R. A weighted rough set based method developed for class imbalance learning. Inf. Sci. 2008, 178, 1235–1256. [Google Scholar] [CrossRef]
  23. Grzymala-Busse, J.W.; Hu, M. A Comparison of Several Approaches to Missing Attribute Values in Data Mining. In Proceedings of the Second International Conference on Rough Sets and Current Trends in Computing, Banff, AB, Canada, 16–19 October 2000; Springer-Verlag: Berlin, Germany, 2000; pp. 378–385. [Google Scholar]
  24. Dong, G.; Zhang, Y.; Dai, C.; Fan, Y. The Processing of Information Fusion Based on Rough Set Theory. J. Instrum. Meter China 2005, 26, 570–571. [Google Scholar]
  25. Wang, J.; Wang, Y. Multi-sensor information fusion based on Rough set. J. Hechi Univ. 2009, 29, 80–82. [Google Scholar]
  26. Huang, C.C.; Tseng, T.L.; Chen, K.C. Novel Approach to Tourism Analysis with Multiple Outcome Capability Using Rough Set Theory. Int. J. Comput. Intell. Syst. 2016, 9, 1118–1132. [Google Scholar] [CrossRef]
  27. Luo, J.F.; Liu, Y.Y.; Qin, K.Y.; Ding, H. Incremental update of rough set approximation under the grade indiscernibility relation. Int. J. Comput. Intell. Syst. 2017, 10, 212. [Google Scholar] [CrossRef]
  28. Yuan, X.; Zhu, Q.; Lan, H. Multi-sensor information fusion based on rough set theory. J. Harbin Inst. Technol. 2006, 38, 1669–1672. [Google Scholar]
  29. Khan, M.A.; Banerjee, M. A study of multiple-source approximation systems. Lect. Notes Comput. Sci. 2010, 12, 46–75. [Google Scholar]
  30. Khan, M.A.; Banerjee, M. A perference-based multiple-source rough set model. Lect. Notes Comput. Sci. 2010, 6068, 247–256. [Google Scholar]
  31. Md, A.K.; Ma, M.H. A modal logic for multiple-source tolerance approximation spaces. Lect. Notes Comput. Sci. 2011, 6521, 124–136. [Google Scholar]
  32. Lin, G.P.; Liang, J.Y.; Qian, Y.H. An information fusion approach by combining multigranulation rough sets and evidence theory. Inf. Sci. 2015, 314, 184–199. [Google Scholar] [CrossRef]
  33. Balazs, J.A.; Velásquez, J.D. Opinion Mining and Information Fusion: A survey. Inf. Fusion 2016, 27, 95–110. [Google Scholar] [CrossRef]
  34. Zhou, J.; Hu, L.; Chu, J.; Lu, H.; Wang, F.; Zhao, K. Feature Selection from Incomplete Multi-Sensor Information System Based on Positive Approximation in Rough Set Theory. Sens. Lett. 2013, 11, 974–981. [Google Scholar] [CrossRef]
  35. Yu, J.H.; Xu, W.H. Information fusion in multi-source fuzzy information system with same structure. In Proceedings of the 2015 International Conference on Machine Learning and Cybernetics, Guangzhou, China, 12–15 July 2015; pp. 170–175. [Google Scholar]
  36. Kryszkiewicz, M. Rough set approach to incomplete information systems. Inf. Sci. 1998, 112, 39–49. [Google Scholar] [CrossRef]
  37. Kryszkiewicz, M. Rules in incomplete information systems. Inf. Sci. 1999, 113, 271–292. [Google Scholar] [CrossRef]
  38. Pawlak, Z.; Skowron, A. Rudiments of rough sets. Inf. Sci. 2007, 177, 3–27. [Google Scholar] [CrossRef]
  39. Dai, J.; Wang, W.; Xu, Q. An Uncertainty Measure for Incomplete Decision Tables and Its Applications. IEEE Trans. Cybern. 2013, 43, 1277–1289. [Google Scholar] [CrossRef] [PubMed]
  40. Dai, J.; Xu, Q. Approximations and uncertainty measures in incomplete information systems. Inf. Sci. 2012, 198, 62–80. [Google Scholar] [CrossRef]
  41. Khan, M.A.; Banerjee, M. Formal reasoning with rough sets in multiple-source approximation systems. Int. J. Approx. Reason. 2008, 49, 466–477. [Google Scholar] [CrossRef]
Figure 1. A multi-source information box.
Entropy 19 00570 g001
Figure 2. The process of multi-source information fusion.
Entropy 19 00570 g002
Figure 3. Approximation accuracies for the decision classes in data set WC.
Entropy 19 00570 g003
Figure 4. Approximation accuracies for the decision classes in data set S (VS).
Entropy 19 00570 g004
Figure 5. Approximation accuracies for the decision classes in data set AS-N.
Entropy 19 00570 g005
Figure 6. Approximation accuracies for the decision classes in data set IS.
Entropy 19 00570 g006
Figure 7. Approximation accuracies for the decision classes in data set S (LS).
Entropy 19 00570 g007
Figure 8. Approximation accuracies for the decision classes in data set EES.
Entropy 19 00570 g008
Table 1. Information source I 1 .
U a 1 a 2 a 3 a 4 a 5 a 6
x 1 14311250.31507960.1
x 2 160.811.1160.2115.98843
x 3 127.34118.2*11480.2
x 4 130.25.6120.598.515077.9
x 5 132.6*115.772.817789.3
x 6 200.115.4230120.57644.9
x 7 1255.811180*77.3
x 8 16716.72251208040
x 9 **222.5133.47755.3
x 10 1358.111610021099
Table 2. Information source I 2 .
U a 1 a 2 a 3 a 4 a 5 a 6
x 1 *11.2249.9149.87859
x 2 16111*1158745.5
x 3 132.33.7120.58811581
x 4 127.8*120.59915278
x 5 129.86.3117*17589
x 6 197.315269.7*7545.2
x 7 130.55.5*80.318177.2
x 8 *16.7222.91218140.9
x 9 178.913.3222.81337655
x 10 132.17.9116.1101.1211*
Table 3. Information source I 3 .
U a 1 a 2 a 3 a 4 a 5 a 6
x 1 140.1*250150.179*
x 2 16512.3160.9114.88845
x 3 *4.2120.587.511581
x 4 1305.1121*15177.9
x 5 130.66.9117.97317688.8
x 6 *16.8*119.975*
x 7 127.75.2111.279.618177
x 8 166*221.3119.98140.8
x 9 173.813.4223132.97754.5
x 10 133.58*100.2*100.1
Table 4. Information source I 4 .
U a 1 a 2 a 3 a 4 a 5 a 6
x 1 142.511*1507860
x 2 163.212.2160.311486*
x 3 133.34117.888.111581
x 4 *5*9915077.9
x 5 131.8*116.572.9*89.2
x 6 20016.3*1507445
x 7 1295111*18177
x 8 *16.2221120.281*
x 9 17213**7755
x 10 1348.2*10021099.8
Table 5. The conditional entropy of information sources for different attributes.
U I 1 I 2 I 3 I 4
a 1 2.51412.54673.01032.6553
a 2 2.46152.38102.23101.9983
a 3 2.54672.35832.69663.0103
a 4 2.80292.87412.79362.7256
a 5 2.17591.64432.20842.0198
a 6 2.79363.01032.87412.9453
Table 6. The result of multi-source information fusion.
U a 1 a 2 a 3 a 4 a 5 a 6
x 1 14311249.91507860.1
x 2 160.812.2*1148743
x 3 127.34120.588.111580.2
x 4 130.25120.59915277.9
x 5 132.6*11772.917589.3
x 6 200.116.3269.71507544.9
x 7 1255**18177.3
x 8 16716.2222.9120.28140
x 9 *13222.8*7655.3
x 10 1358.2116.110021199
Table 7. The result of mean value fusion of multiple information sources.
U a 1 a 2 a 3 a 4 a 5 a 6
x 1 141.866711.0667250.0667149.97578.559.7
x 2 162.511.65160.4667114.92587.2544.5
x 3 130.96673.975119.2587.8667114.7580.8
x 4 129.33335.2333120.666798.8333150.7577.925
x 5 131.26.6116.77572.917689.075
x 6 199.133315.875249.85130.13337545.0333
x 7 128.055.375111.066779.966718177.125
x 8 166.516.5333222.55120.27580.7540.5667
x 9 174.913.2333222.7667133.176.7554.95
x 10 133.658.05116.05100.325210.333399.6333
Table 8. The approximation accuracies of two fusion methods.
Multi-Source FusionMean Value Fusion
Approximation accuracy0.428570.33333
Table 9. Computational complexity of Algorithm 1.
Steps 4–5 O ( | U | 2 )
Steps 6–14 O ( | U | × m 2 )
Steps 1–16 O ( s × | A T | × ( | U | 2 + | U | × m 2 ) )
Steps 17–25 O ( | A T | × s )
Step 26 O ( | U | × | A T | )
Total O ( s × | A T | × ( | U | 2 + | U | × m 2 ) + | A T | × s + | U | × | A T | )
Table 10. Experimental data sets.
No.Data Set NameAbbreviationObjectsAttributesDecision ClassesNumber of SourcesElements
1Wholesale CustomersWC440941039,600
2Statlog (Vehicle Silhouettes)S (VS)84619410160,740
3Airfoil Self-NoiseAS-N15037510105,210
4Image SegmentationIS231020710462,000
5Statlog (Landsat Satellite)S (LS)6435376102,380,950
6EEG Eye StateEES14,980152102,247,000
Table 11. Description of the experimental environment.
NameModelParameters
CPUIntel i3-3702.40 GHz
MemorySamsung DDR32 GB; 1067 MHz
Hard DiskWest Data500 GB
SystemWindows 732 bit
PlatformV C + +6.0
Table 12. Approximation accuracies of conditional entropy fusion (CE) and mean value fusion (M) for each data set.
No.WCS (VS)AS-NISS (LS)EES
CEM.CEM.CEM.CEM.CEM.CEM.
10.3166020.2855380.9227270.9205450.6533330.5565520.7309960.7194720.8130050.8101720.808110.808001
20.4491650.288010.9118640.9097070.651410.6375660.7929310.7232640.8146860.8124480.808110.808219
30.5161810.3169470.9032620.9140270.6632760.6233020.8301290.733210.8130920.813710.8083280.808219
40.5596640.3211960.9011240.9140270.6747970.6404020.8709160.751690.81590.8114910.8085470.808437
50.6281140.3528610.9032620.9227270.6733370.6556330.883570.7626220.8173060.8090010.8088740.808219
60.716730.395150.9097070.9011240.6700860.6517090.908230.7862620.8137270.8096160.8089830.808437
70.6691180.4326350.9249150.8968610.6784360.6584450.9089790.8076030.8132830.8114050.8086560.808219
80.6962260.4456190.9359270.9183670.6766140.6652310.9105520.8353080.8128310.8162040.8087650.808219
90.7205320.5040390.9011240.9140270.6802610.6588110.9121290.8213310.8151660.8132830.8090930.808219
100.724470.4867810.9271070.9183670.6711660.6634410.9137080.8616130.8170150.8123350.8092020.808001
110.740310.5363040.9140270.8862880.6784360.6540110.9144980.8530940.8162920.8163290.8088740.808001
120.7250.5697280.9337140.9011240.6802610.6729830.9168730.8746970.8140410.8125870.8089830.808001
130.7203070.5699660.9403670.9075540.6802610.6666670.9145690.8678710.8146340.81250.8088740.808219
140.7549020.6114080.9205450.9183670.6802610.6720690.9168730.8800650.8164060.8124740.8090930.808219
150.758350.597920.9628770.9161950.6766140.6720780.9168730.8886180.8166080.8128390.8089830.808219
160.7364340.5996470.9359270.9161950.6789790.6711740.9168730.8841460.8137620.8144950.8084370.808328
170.7417480.6342340.9628770.9097070.6802610.6766140.9168730.8976670.8129440.8145820.8089830.808219
180.7480470.6187050.9538110.9118640.6766140.667920.9168730.9007790.8107620.81250.8086560.808219
190.7618110.6672860.9448280.9315070.6802610.6673850.9168730.8934690.8127170.8150010.8087650.808219
200.7534250.6847010.9493090.9271070.6802610.6722550.9168730.9081930.8157340.8164060.8082190.808437