We can conclude from
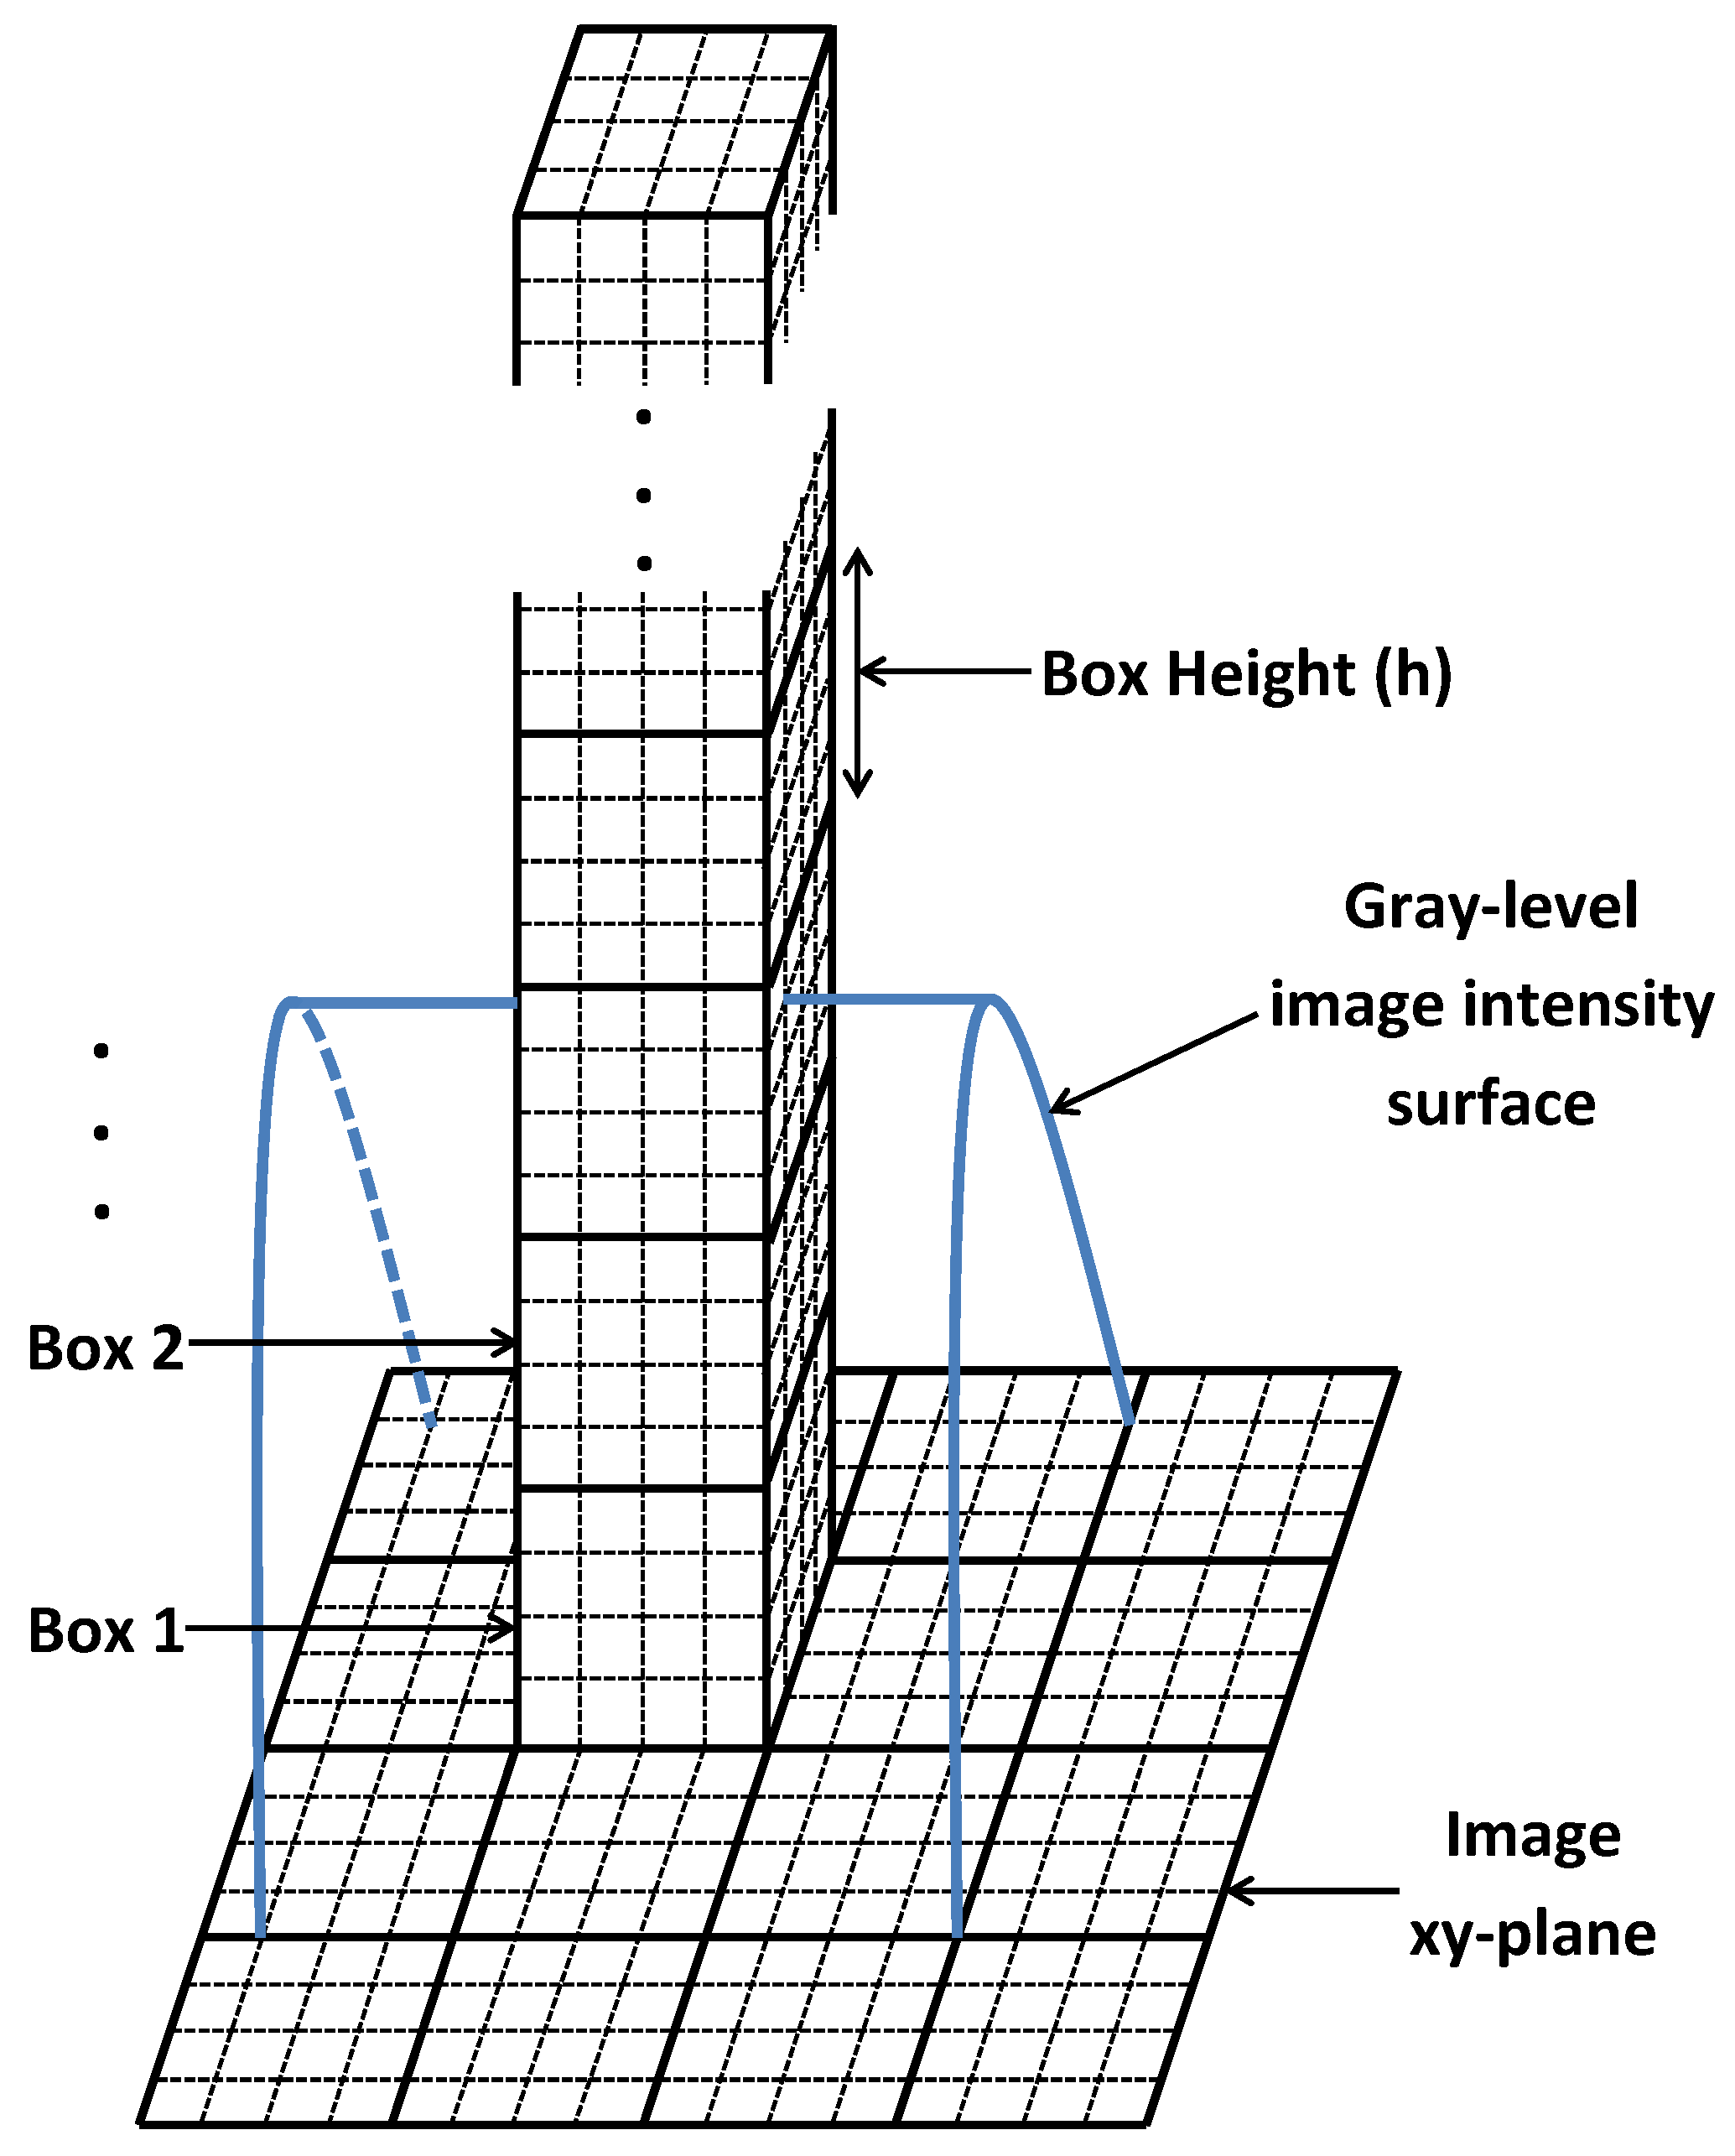
Section 2.4 that the standard expression for box height is as follows:
where,
R is any real number (
) and
R must be greater than or equal to one (
) because if the value of
R is less than one and the value of
s is large then
h will be more than
G in that case the obtained value of FD will be inaccurate. Most of the authors have considered
R as a positive natural number for their works. Thus, a series of natural numbers 1 to 100 have been chosen for the value of
R to compute FD value in order to find out a
R value for an image, which satisfies Equation (
7) in this work. Bicubic interpolation method is applied on each of these images of size
pixels to resize them into
,
,
and
pixels for further experiments. FD of ideal fractal sets are invariant to size of the set i.e., for any value of
s in Equation (
1), the value of
will remain same. Since texture images are not ideal fractals, their FD value changes with the size of the image though the difference in FD values are less but not equal to zero. Hence we have used different image sizes in-order to relate their FD value and using their relation a new box height is proposed in this paper.
The Equation (
6) is applied as box height with other parameters of DBC described in
Table 1 on 112 textured images from Brodatz Database at different image sizes
,
,
,
and
pixels.
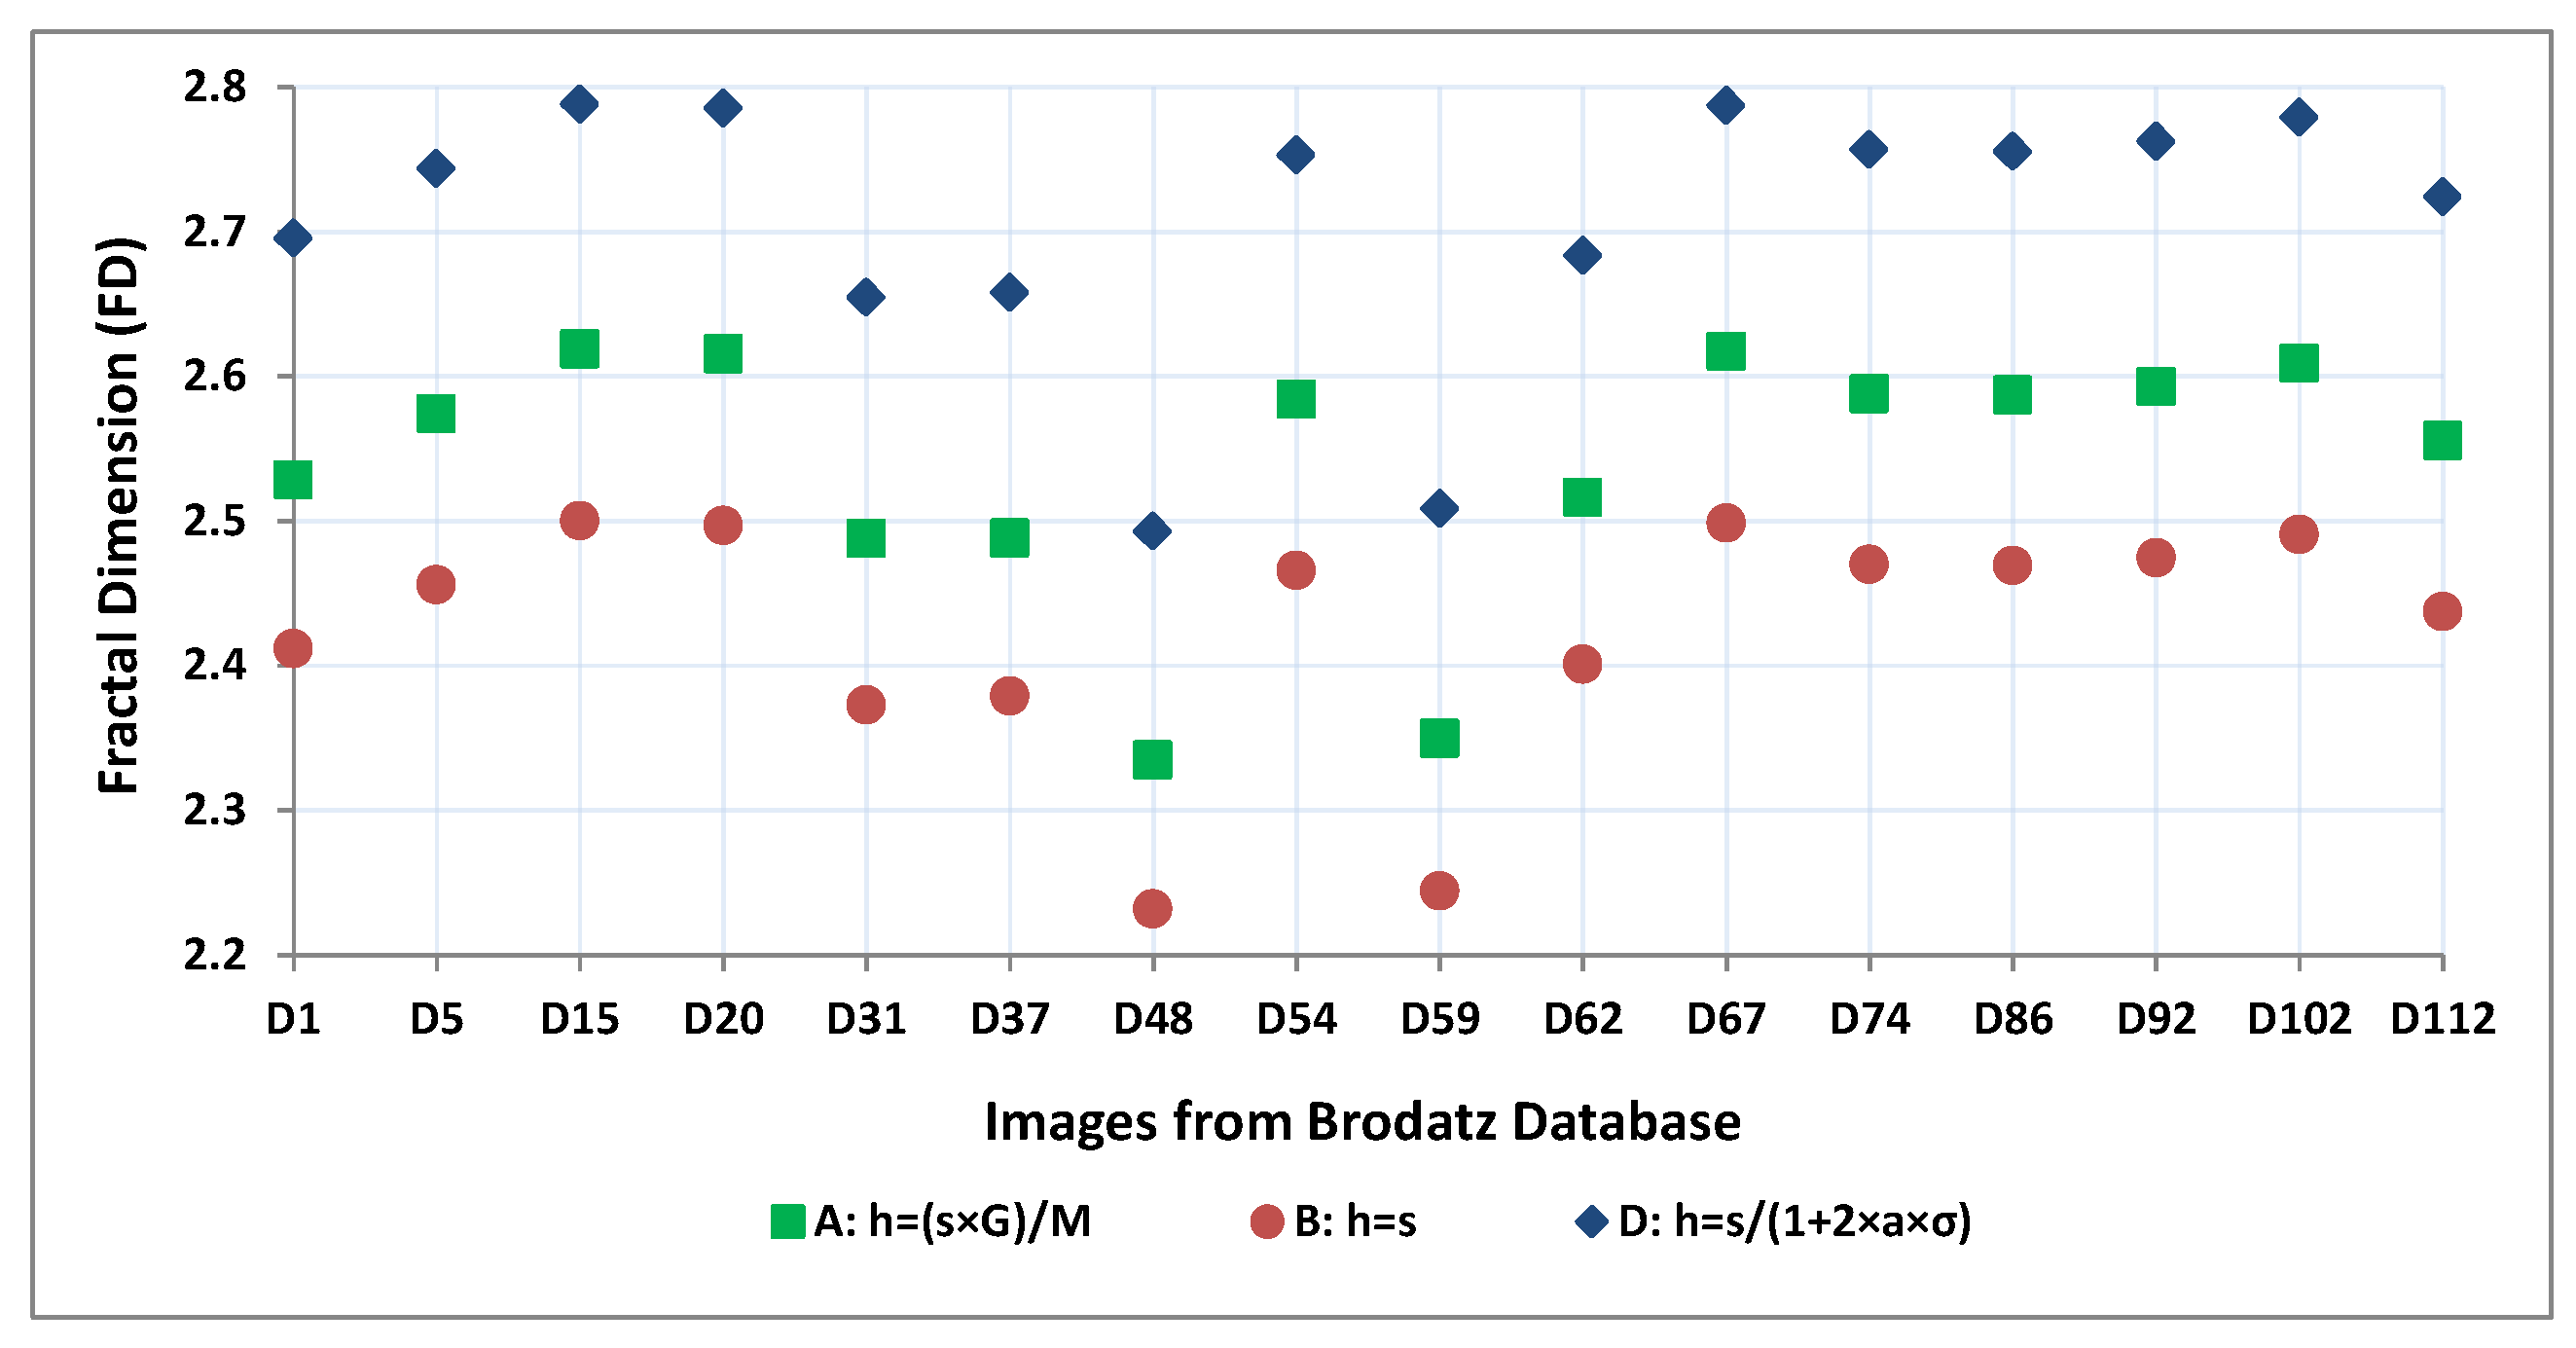
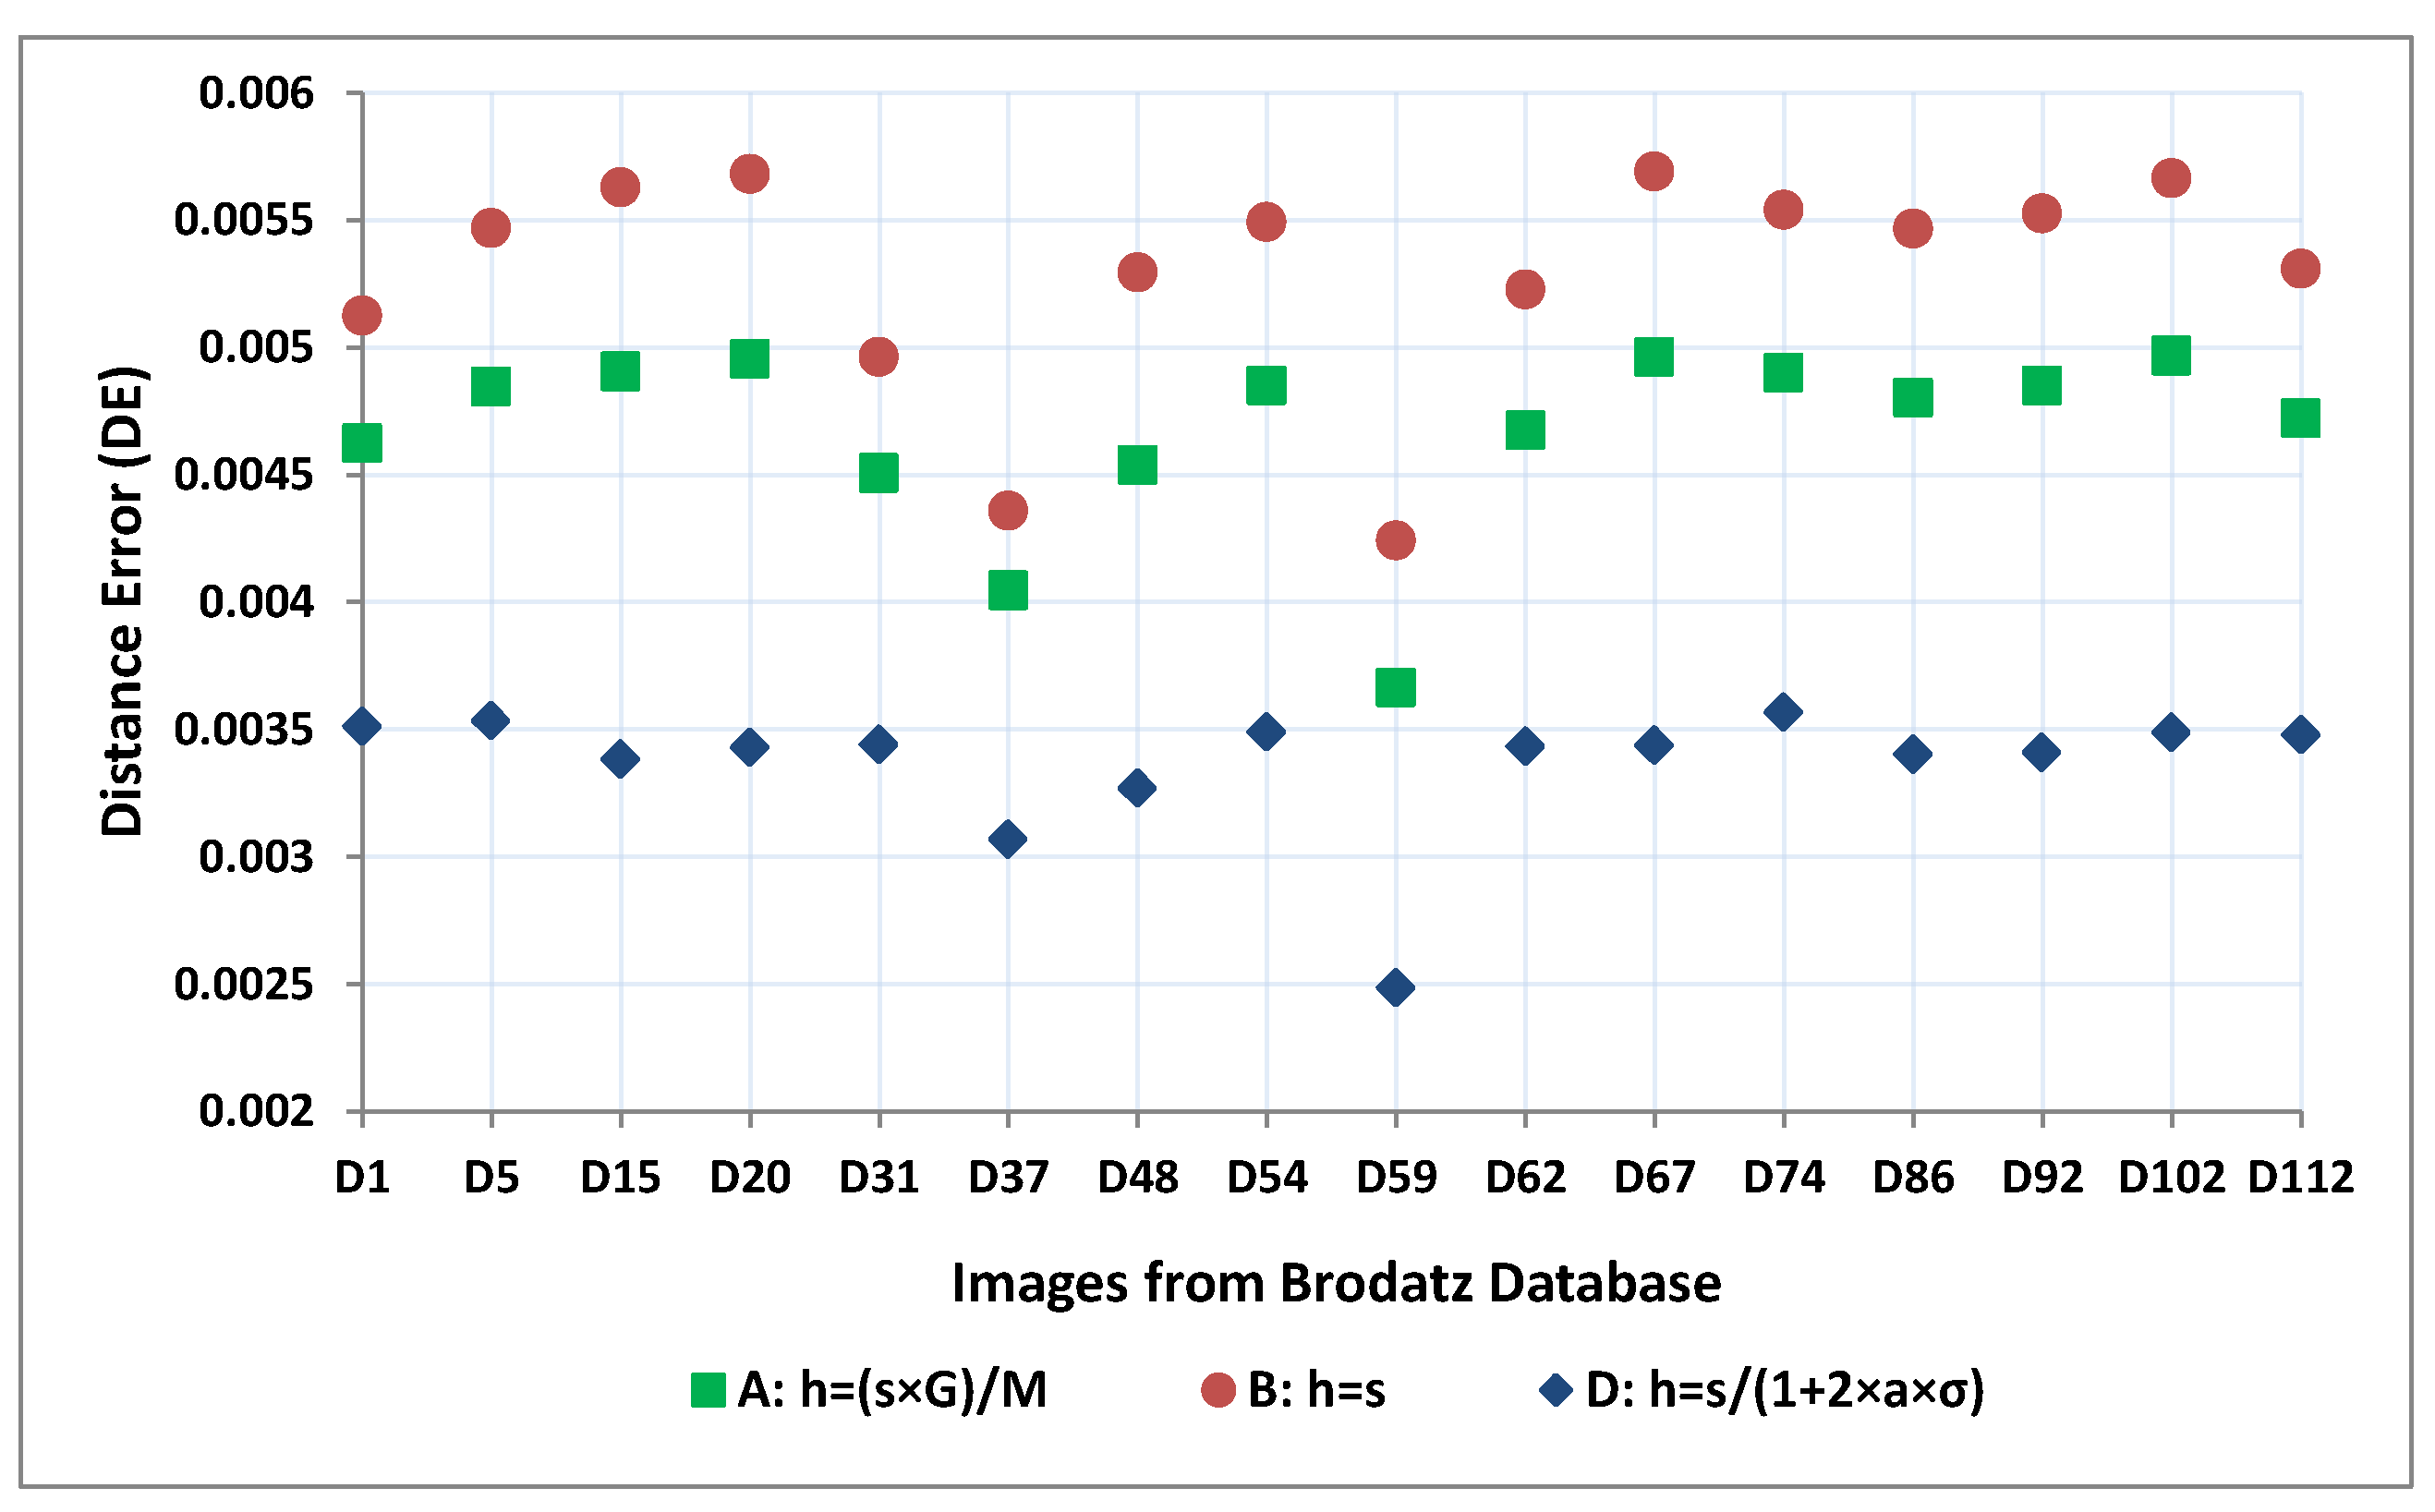
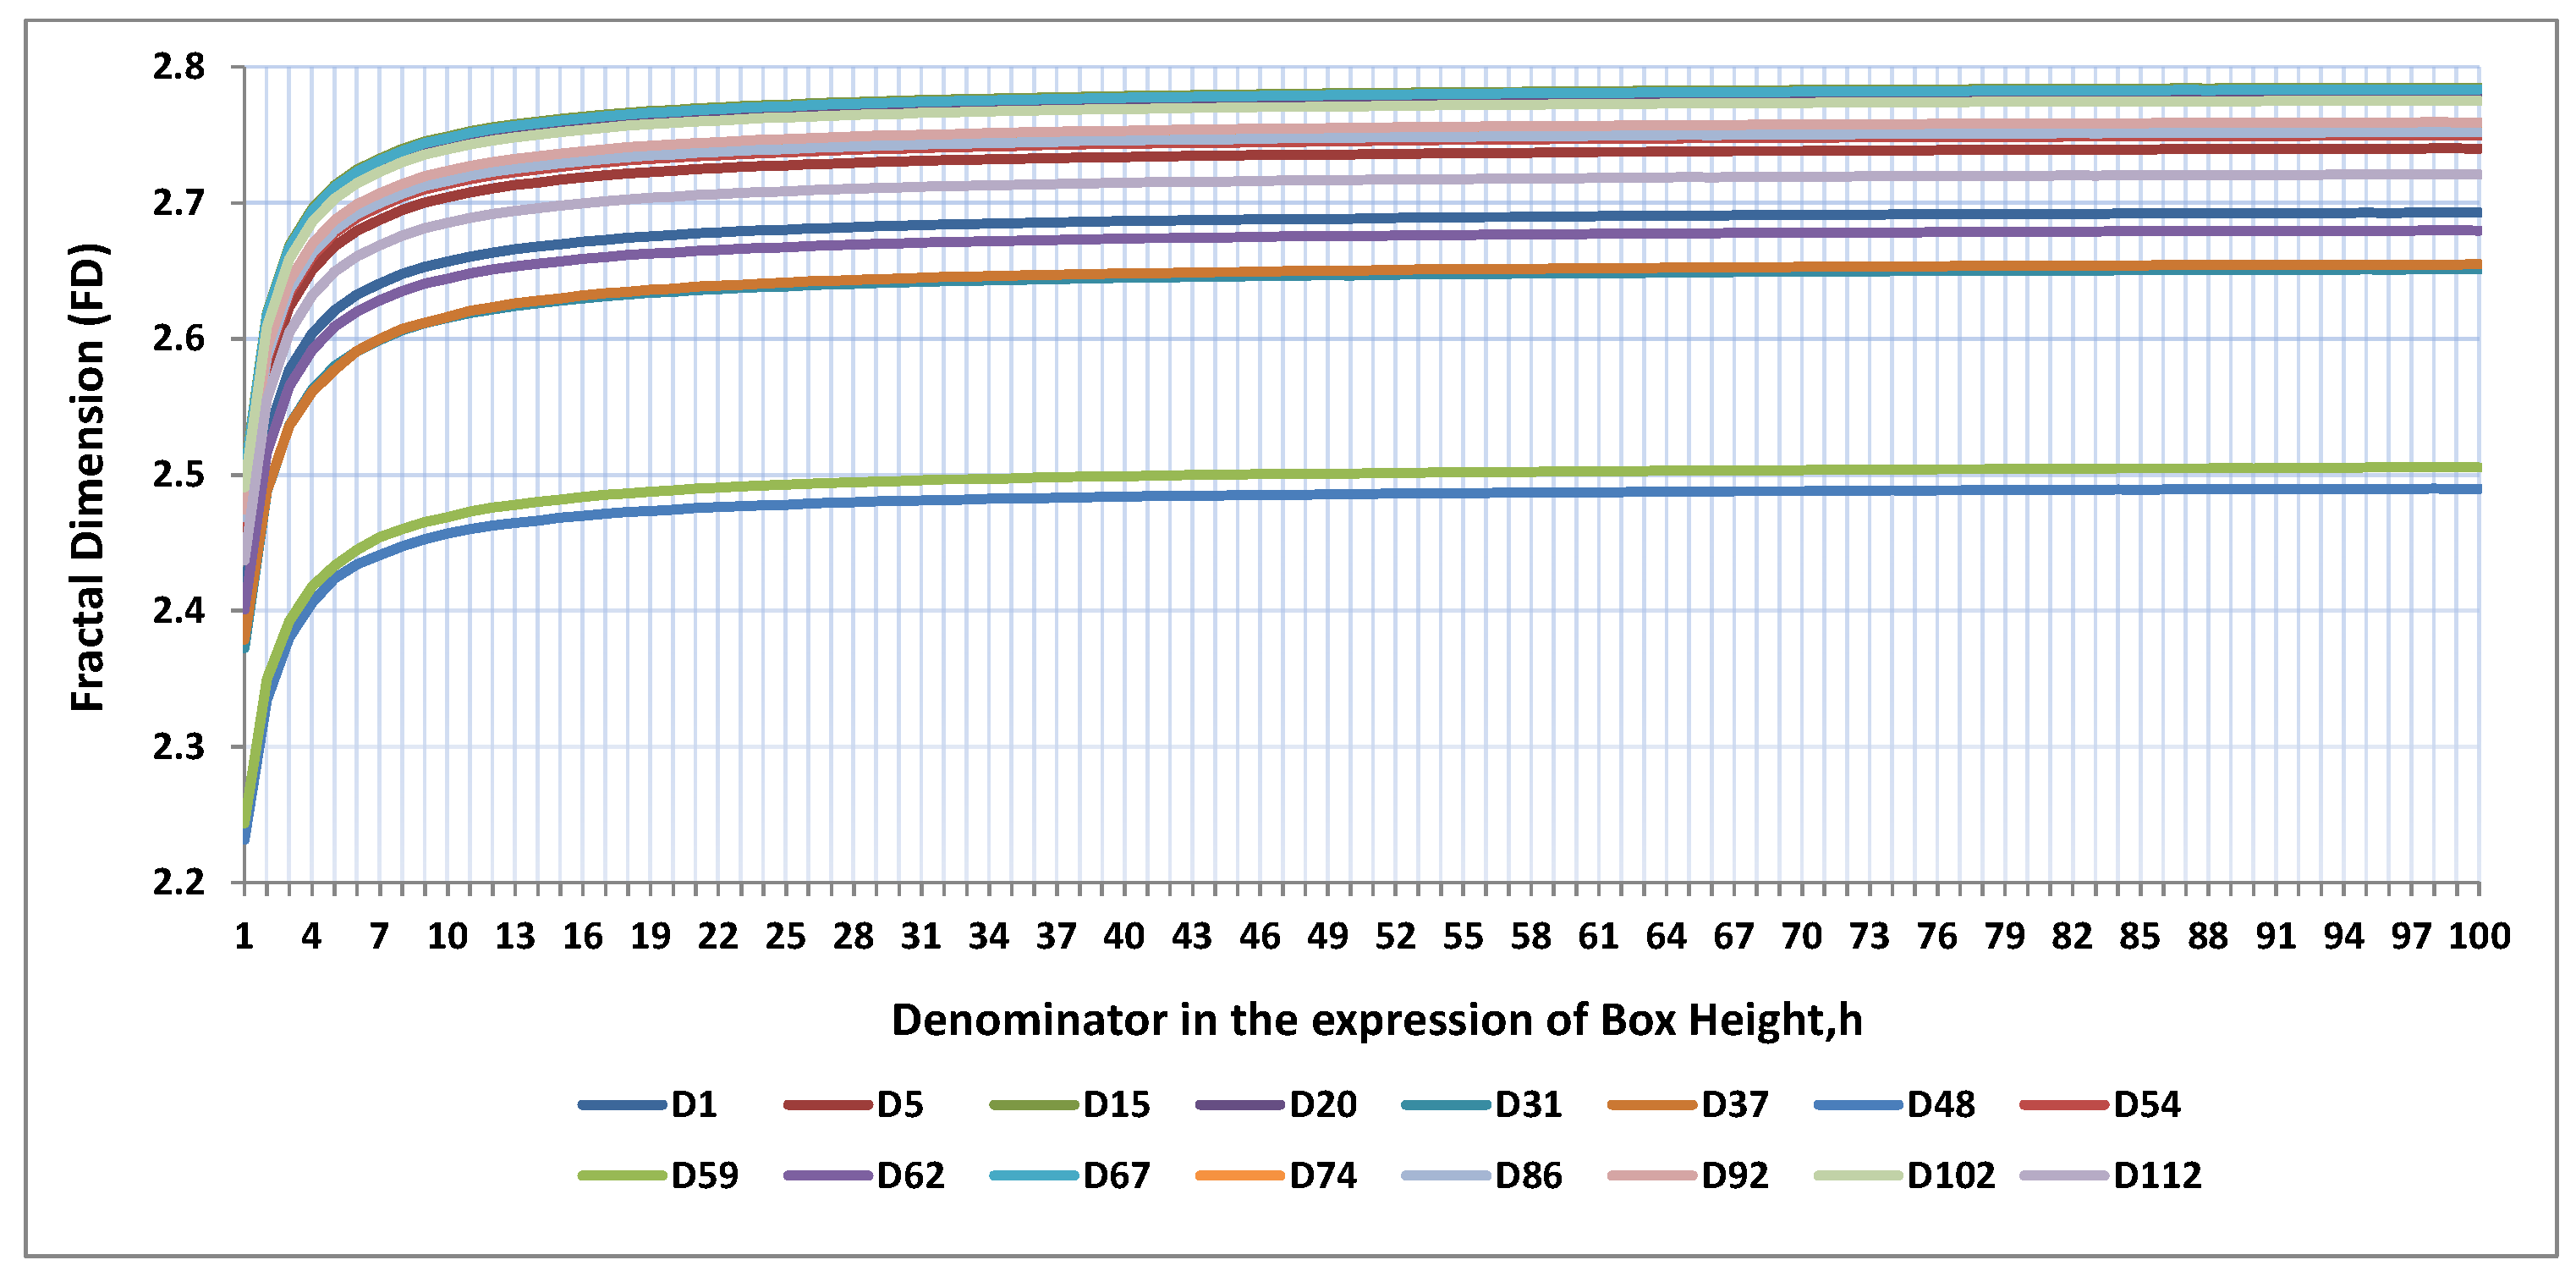
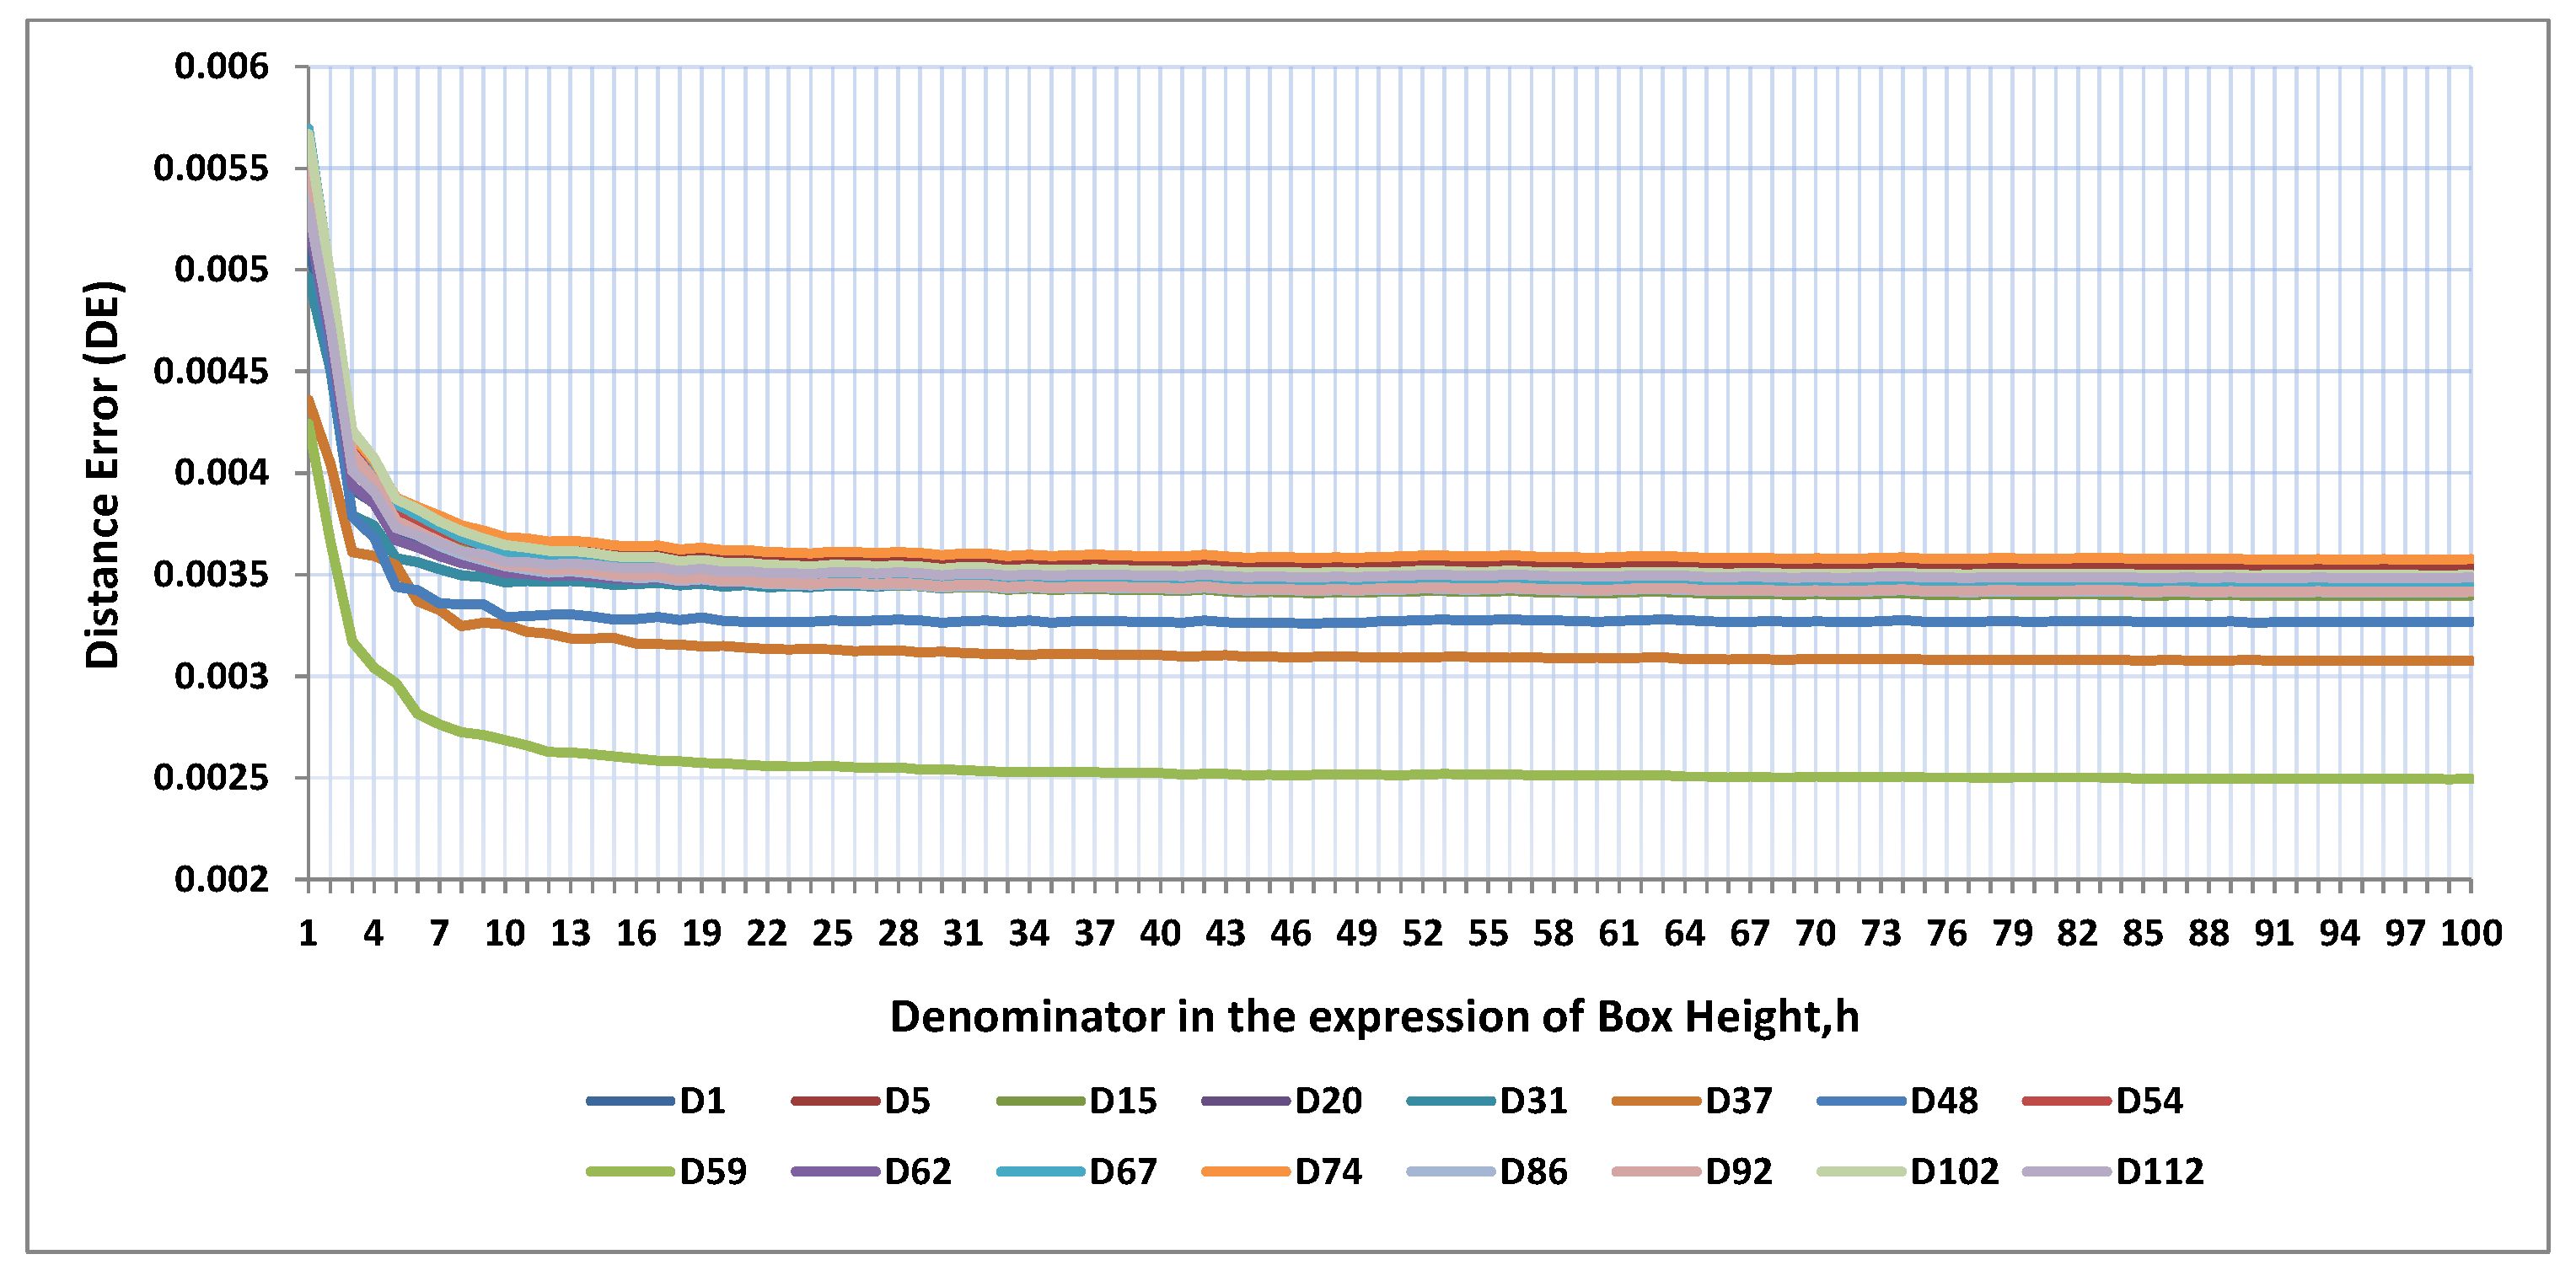
Figure 7 and
Figure 8 show different FD values and DE values for different values of
R respectively, which has started from 1 to 100 with step size 1.
Figure 7 contains the FD values of images, which are shown in
Figure 2. The similar experiments have been performed on 112 images with different image sizes
,
,
and
pixels. It is observed that the same trend persist between these experiments as shown in
Figure 7. Moreover, it is clear from
Figure 7 that for all images when box height decreases i.e.,
R in Equation (
6) increases then the computed FD value increases, but after some higher value of
R the estimated FD value almost remains the same as
R increases. Similarly
Figure 8 shows that as box height decreases, incurred error i.e., DE, decreases. Though decreasing of DE values are not fully monotonic but eventually after some lower box height, i.e., for higher
R values, the DE values remain almost the same. So, we have to find out a proper value of
R for a particular image size in such a way that there is no significant change in the difference of two successive FD values for two successive values of
R.
Approximating R
Let,
be a FD value of an image numbered as
p from Brodatz Database having
pixels with a particular value of
R where,
R starts from one and
. Now, smallest integer value,
R, has to be found that satisfies Equation (
7) for each image
p at a particular image size
.
It is observed from the experiments that the value of FD up-to four decimal places is enough to distinguish textures. Moreover, floating point arithmetic is very expensive. So, a threshold value 0.0001 is chosen for our work.
Table 2 shows the number of images having the same
R value for different image size that satisfy Equation (
7). Here,
is marked using red color in
Table 2, which represents the smallest
R value for an
M, after which FD value does not change significantly for all the images.
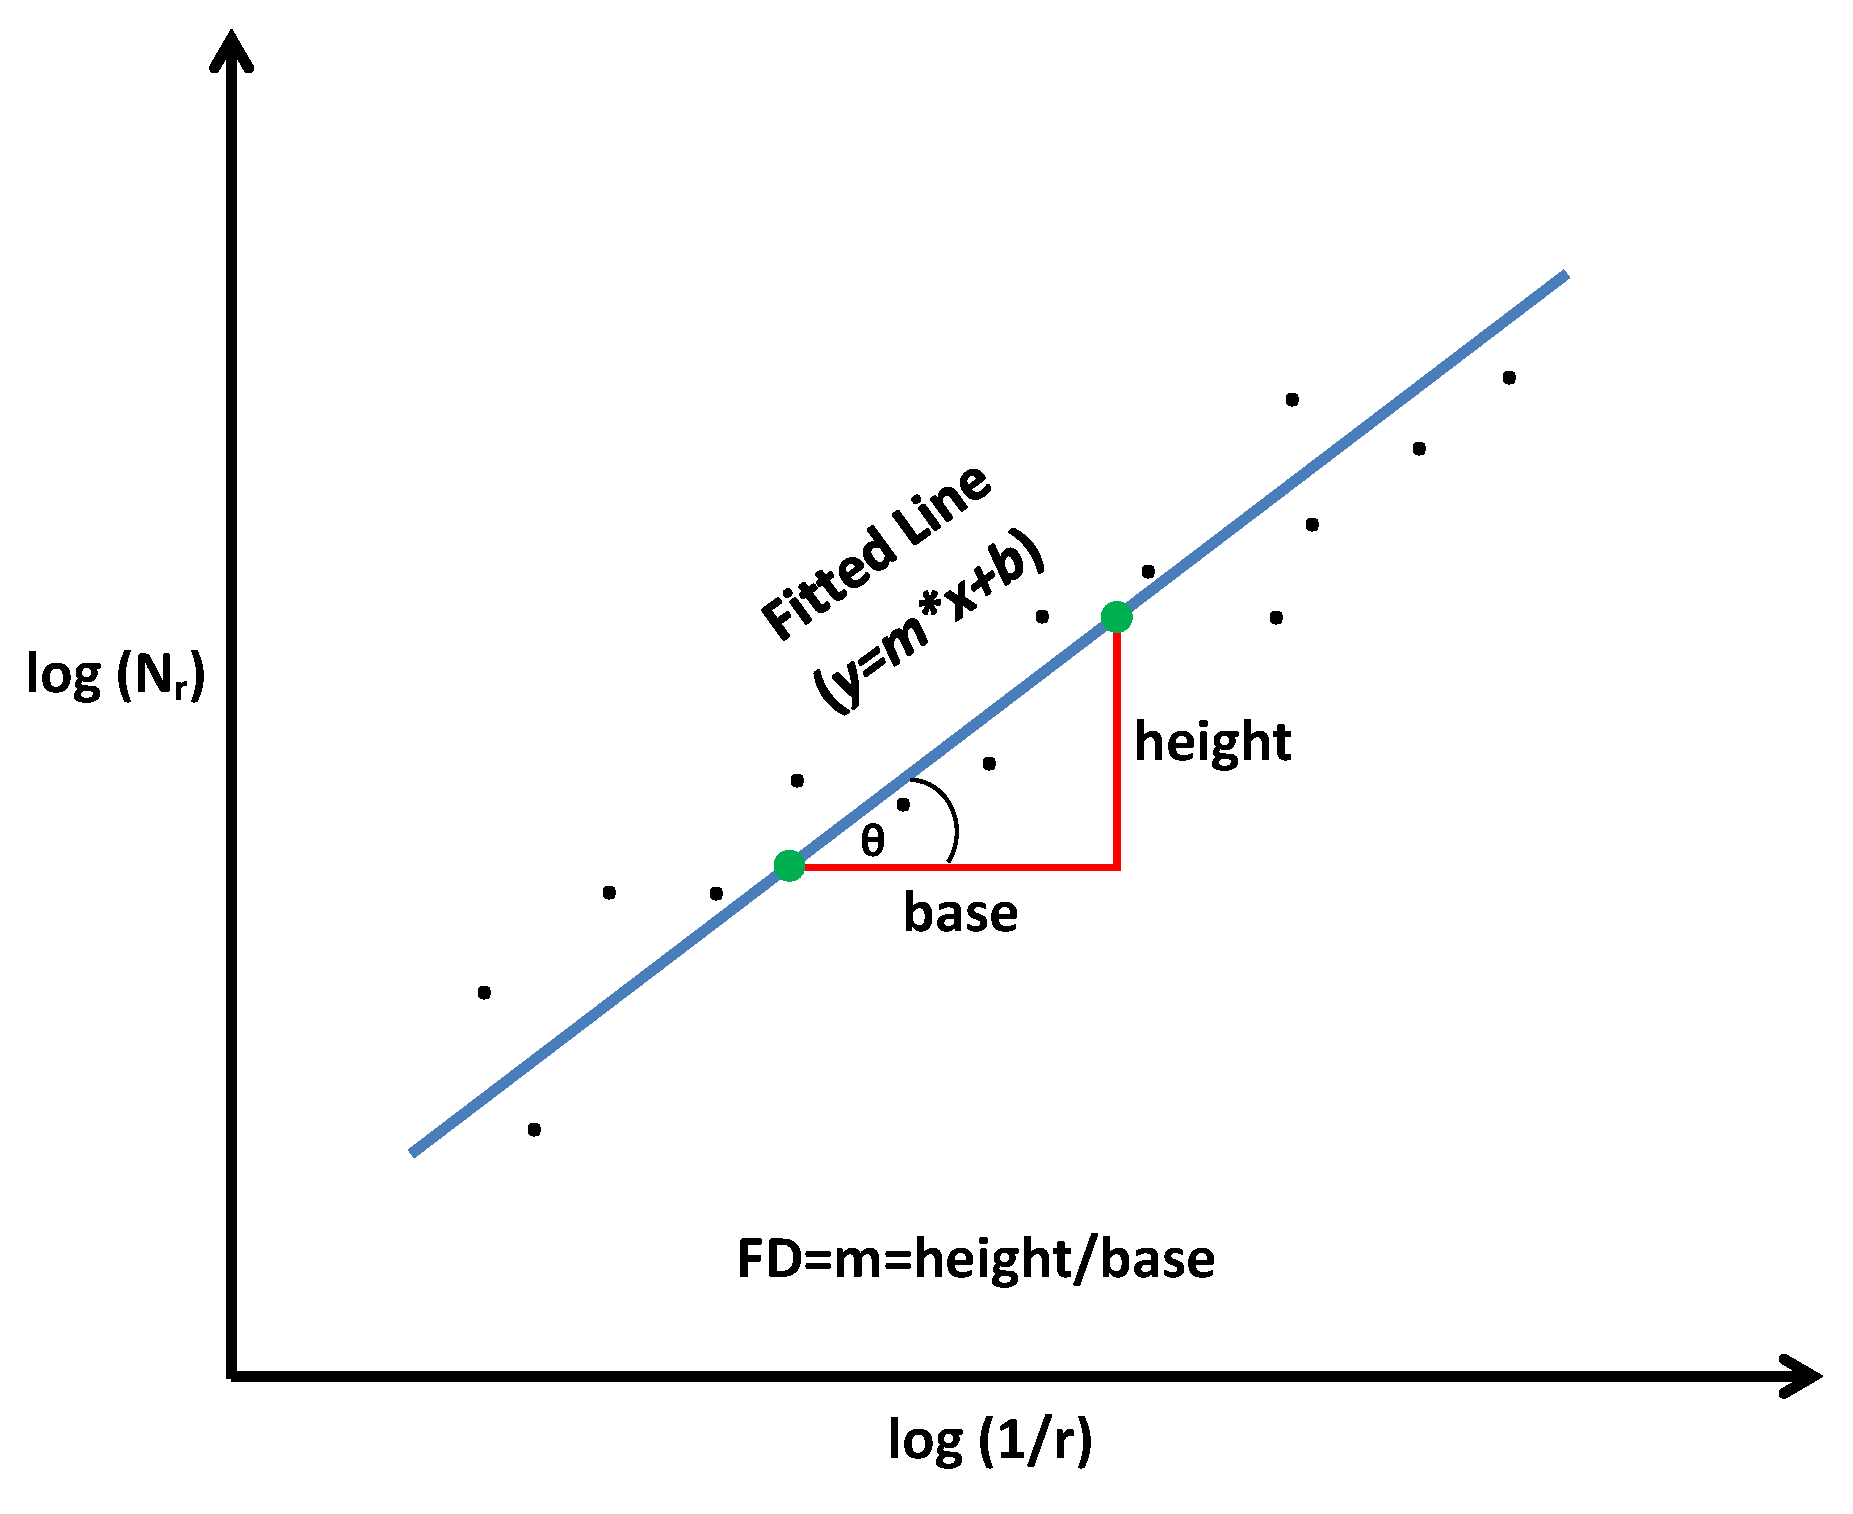
Then all the points
are plotted into a 2D plane to get a line using linear least square, where
x-axis represents
M i.e., image size and
y-axis denotes
of a particular image size
M. Here,
corresponds to
,
,
,
and
that have been obtained from
Table 2. The expression of the plotted line is represented by Equation (
8).
Now, this line is validated by putting different values of
M (128, 256, 512, 640 and 1024) and the obtained R values are shown in
Table 3. It is clear from
Table 3 that the obtained
R value is not always greater than or equal to
. So, the next task is to find out an exact equation, which can replace Equation (
8). In other words, an exact equation is expected in this work, which can find out
R after putting
M, where the value of R will be always greater than or equal to
without performing the above analysis. However, this analysis helps us to propose a novel box height, which depends on image size. The expression of
R in Equation (
8) is approximated by
, which is shown in Equation (
9). Initially we started with
because it is the nearest multiple of
to satisfy for least image size
M = 128 and its
.
This expression is again validated using different values of
M (128, 256, 512, 640 and 1024). Unfortunately, it fails for image size 640 and 1024 as shown in
Table 3. Equation (
9) has two parts and 1 has been added to the second part,
. New formula is shown in Equation (
10).
Again, Equation (
10) has been validated for all image size
M (128, 256, 512, 640 and 1024) and this time Equation (
10) works fine for all image sizes
M. The ceil function,
is used to deal with the image sizes,
M which are not a power of 2 like when
M = 640 i.e., to obtain an integer value. Hence, Equation (
10) is used to fix the value of
R. Therefore using Equations (
6) and (
10), the new box height proposed in this paper for DBC [
13] is as follows:
If .
If .
If becomes relatively higher.
Hence when
, we need to restrict
R. Hence if
then
. Therefore the final proposed formula to compute box height is as follows:
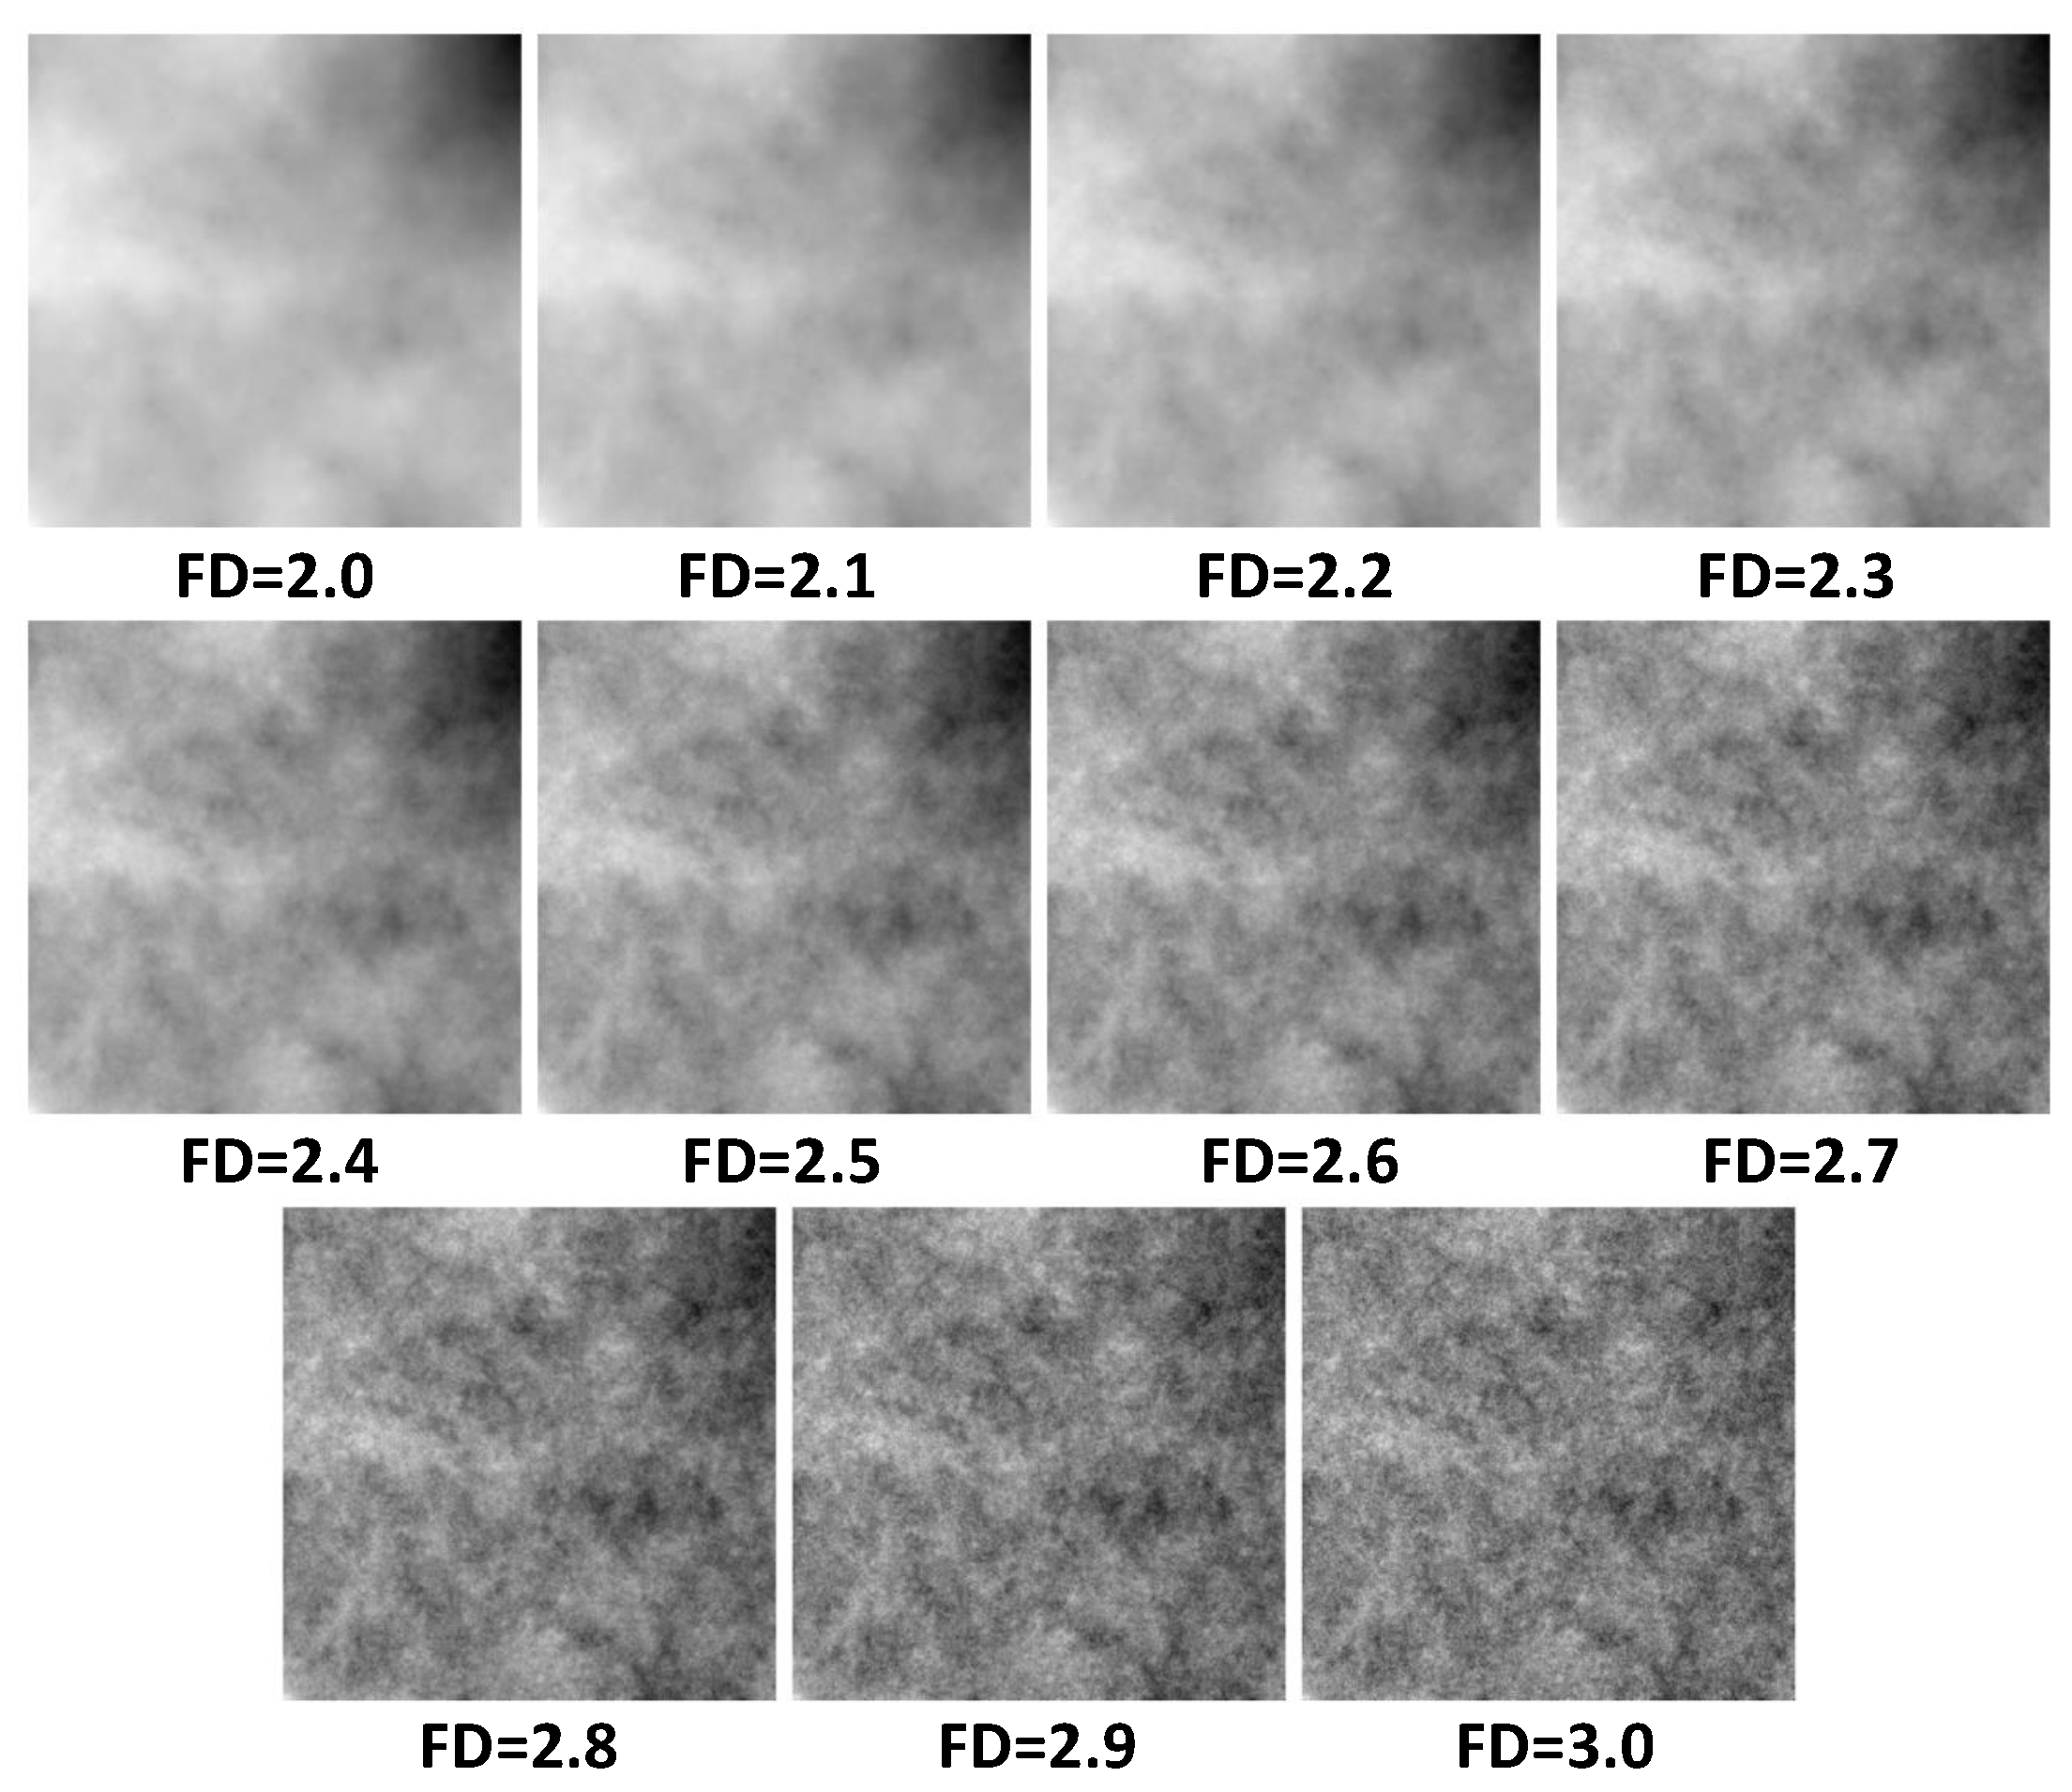
Eleven generated FBM images as shown in
Figure 2 have been used for the first set of experiment to validate the proposed box height as denoted in Equation (
12). The FBM images are generated using random mid-point displacement algorithm with different Hurst components. The value of Hurst component varies from 0 to 1 with step size 0.1 in this work. So, we have altogether 11 Hurst values, which help to create eleven FBM images. Moreover, Hurst component defines the actual FD value of an image. The different Hurst values and their acutal FD values are shown in 1st column and 2nd column of
Table 4 respectively. The 3rd column of
Table 4 depicts the FD values obtained using original DBC method.
Table 1 shows different parameters of DBC, SDBC [
15], IDBC [
18] and ITDBC [
22]. Now, the proposed box height have been used and the achieved FD values for all the above mentioned images are shown in column number 4 of
Table 4. The 5th and 6th columns of
Table 4 show the difference of the FD values obtained by DBC method and new box height from actual FD values respectively. The DE values using both the methods are also reported in
Table 4. It is clear from the columns 5th and 6th of
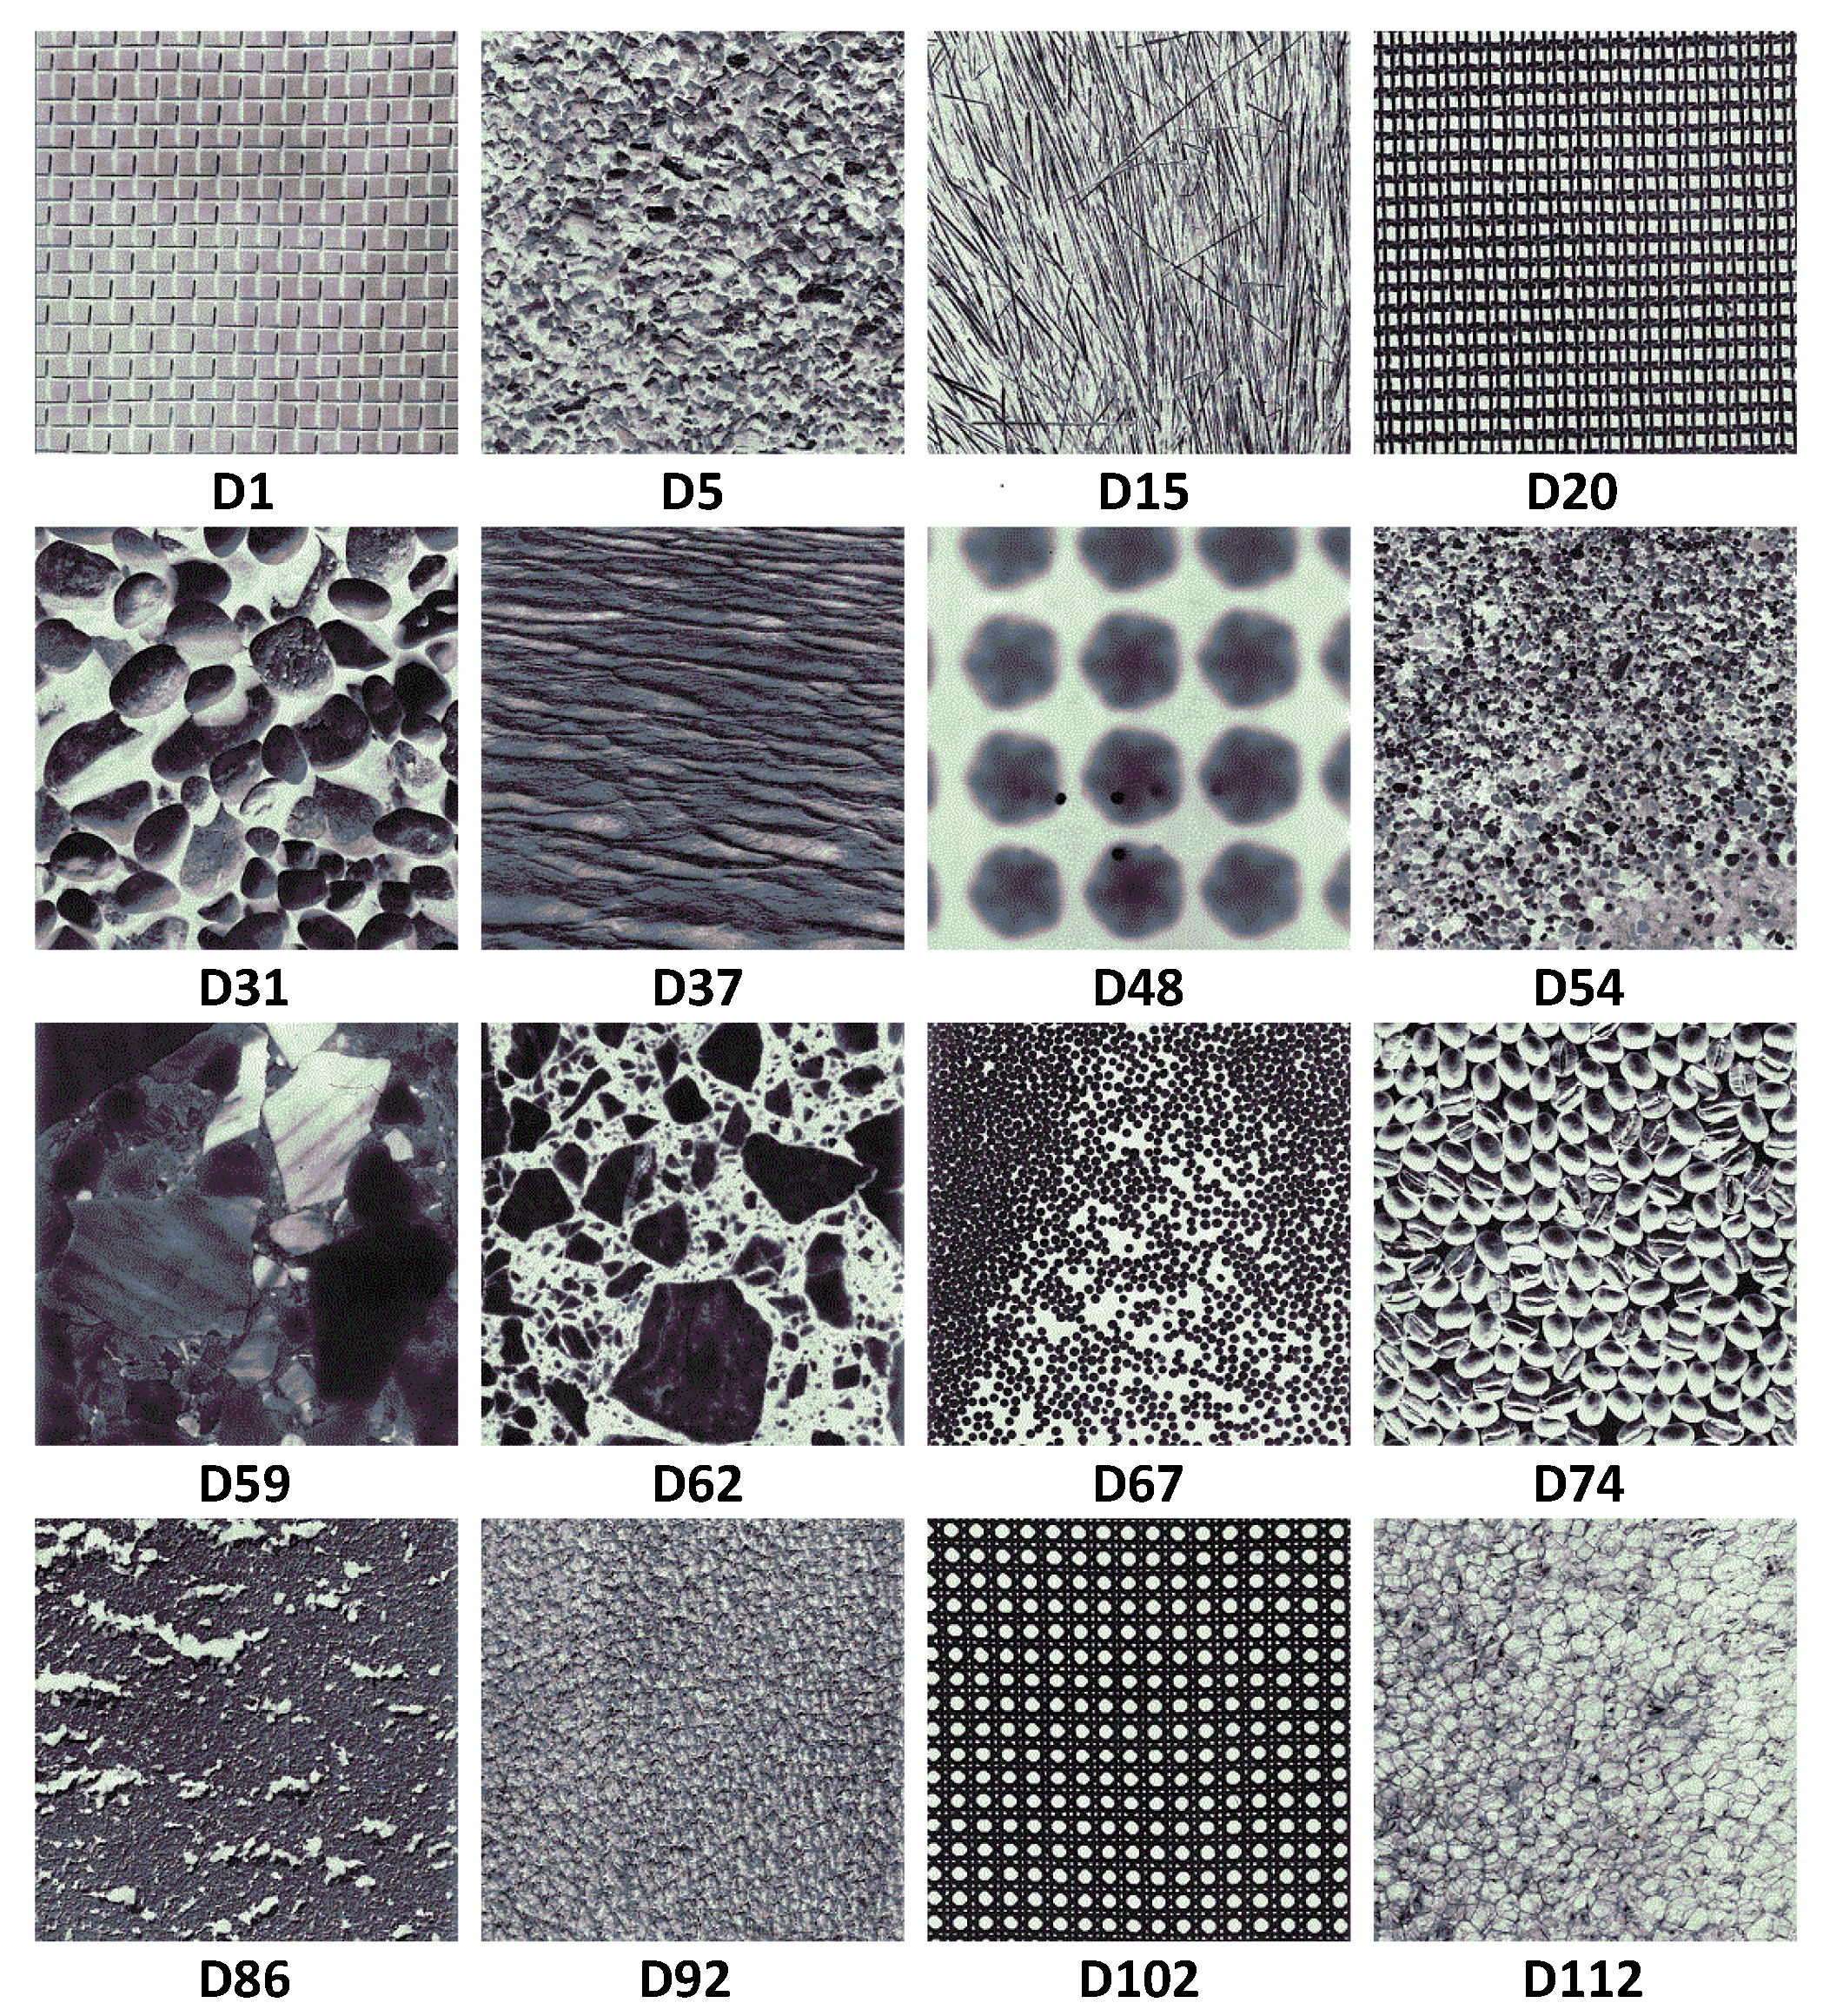
Table 4 that the proposed box height allows to better estimate FD values, which are closer to actual FD values with less DE values. The same set of experiments using both the methods have been done on sixteen textured images from Brodatz Database as shown in
Figure 1 and the results are shown in
Table 5. We do not have actual FD values for these textured images. So, the actual FD values are missing in
Table 5. However, the obtained FD values using the proposed box height of DBC are larger than the achieved FD values by the original DBC method. Thus, we can conclude that new box height of DBC estimates better FD values than the original DBC method.
In the next set of experiment, original SDBC [
15] and SDBC with proposed box height have been considered on eleven generated FBM images and sixteen textured images from Brodatz Database and the obtained results are shown in
Table 6 and
Table 7 respectively.
Then IDBC [
18] method and the proposed box height have been used for the next set of experiments on eleven generated FBM images and sixteen textured images from Brodatz Database and the achieved results are shown in
Table 8 and
Table 9 respectively.
Again, similar experiments using ITDBC method [
22] and proposed box height have been considered on both set of images i.e., on generated FBM, textured images and the gained results are reported in
Table 10 and
Table 11 respectively.
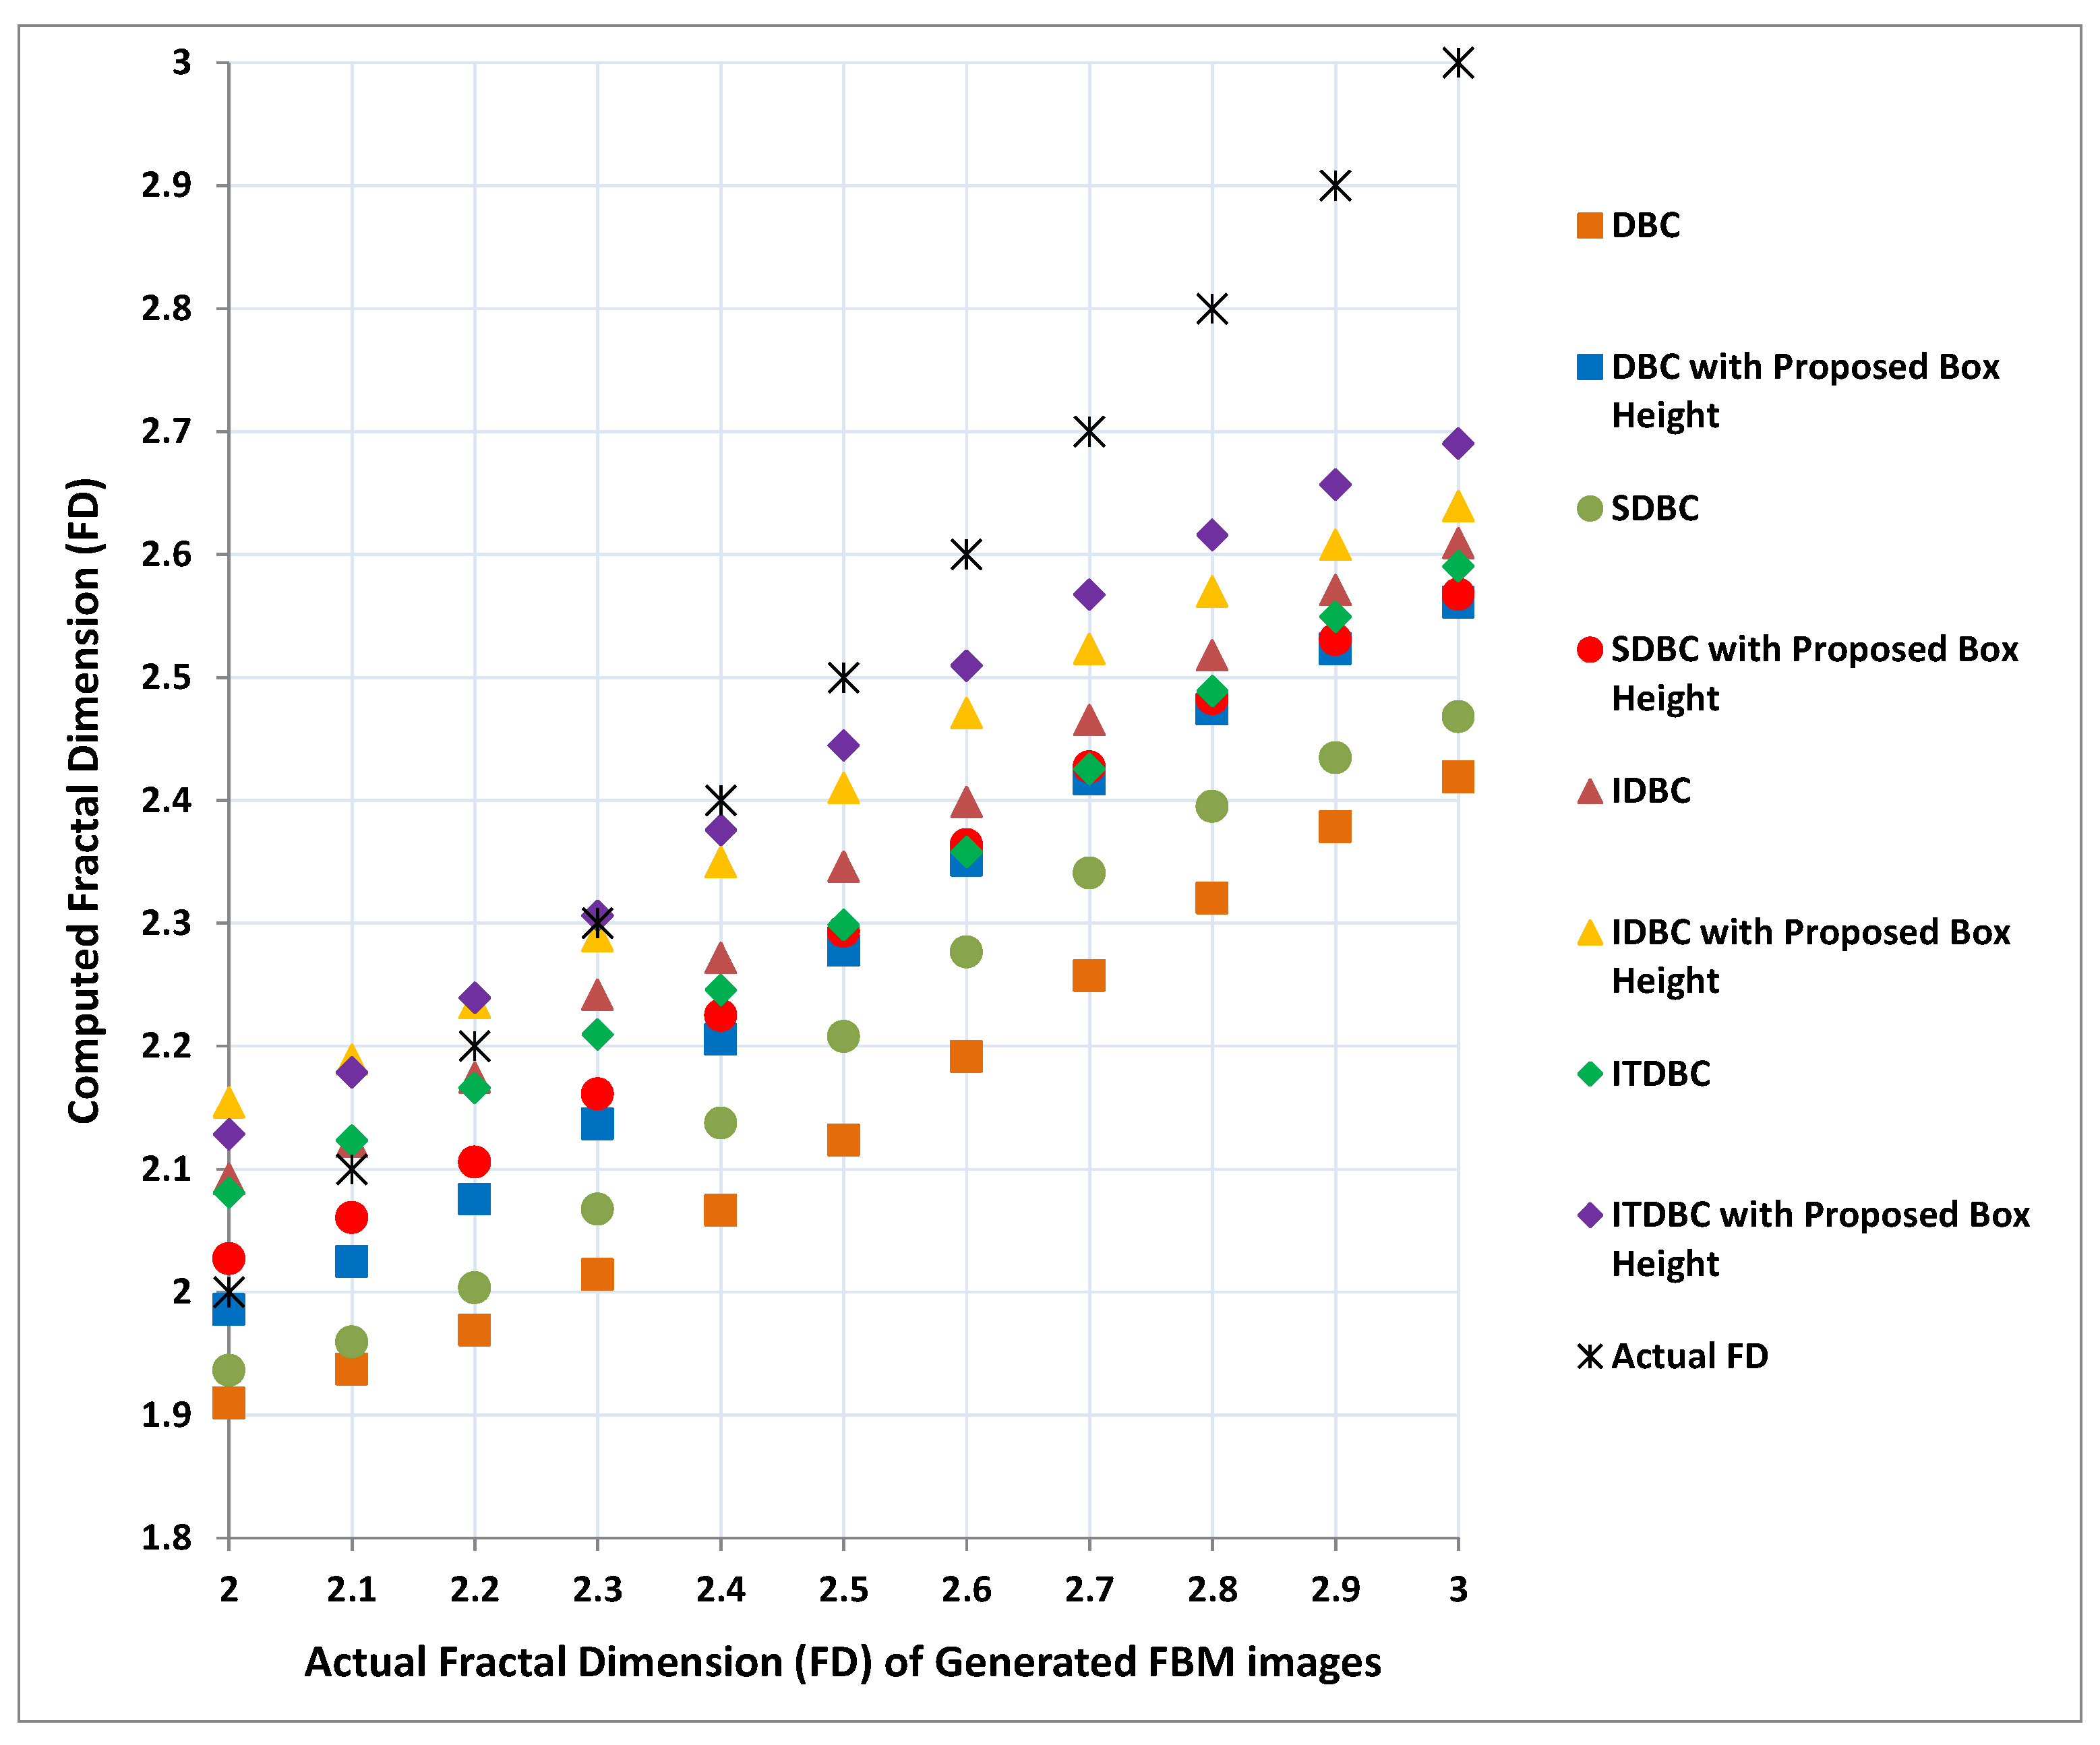
To know the impact of the new box height for different methods such as DBC, SDBC, IDBC and ITDBC, we have also plotted the results of these methods obtained using their original parameters and the results obtained with the proposed box height as shown in
Figure 9. While plotting, the actual FD values are represented in
x-axis and the corresponding computed FD values in
y-axis. It is clear from
Figure 9 that for all the cases the proposed box height allows the four existing methods to compute better FD values compare to their original methods. Moreover, we can conclude from
Figure 9 that the proposed box height together with ITDBC estimate better FD values for maximum set of experiments.
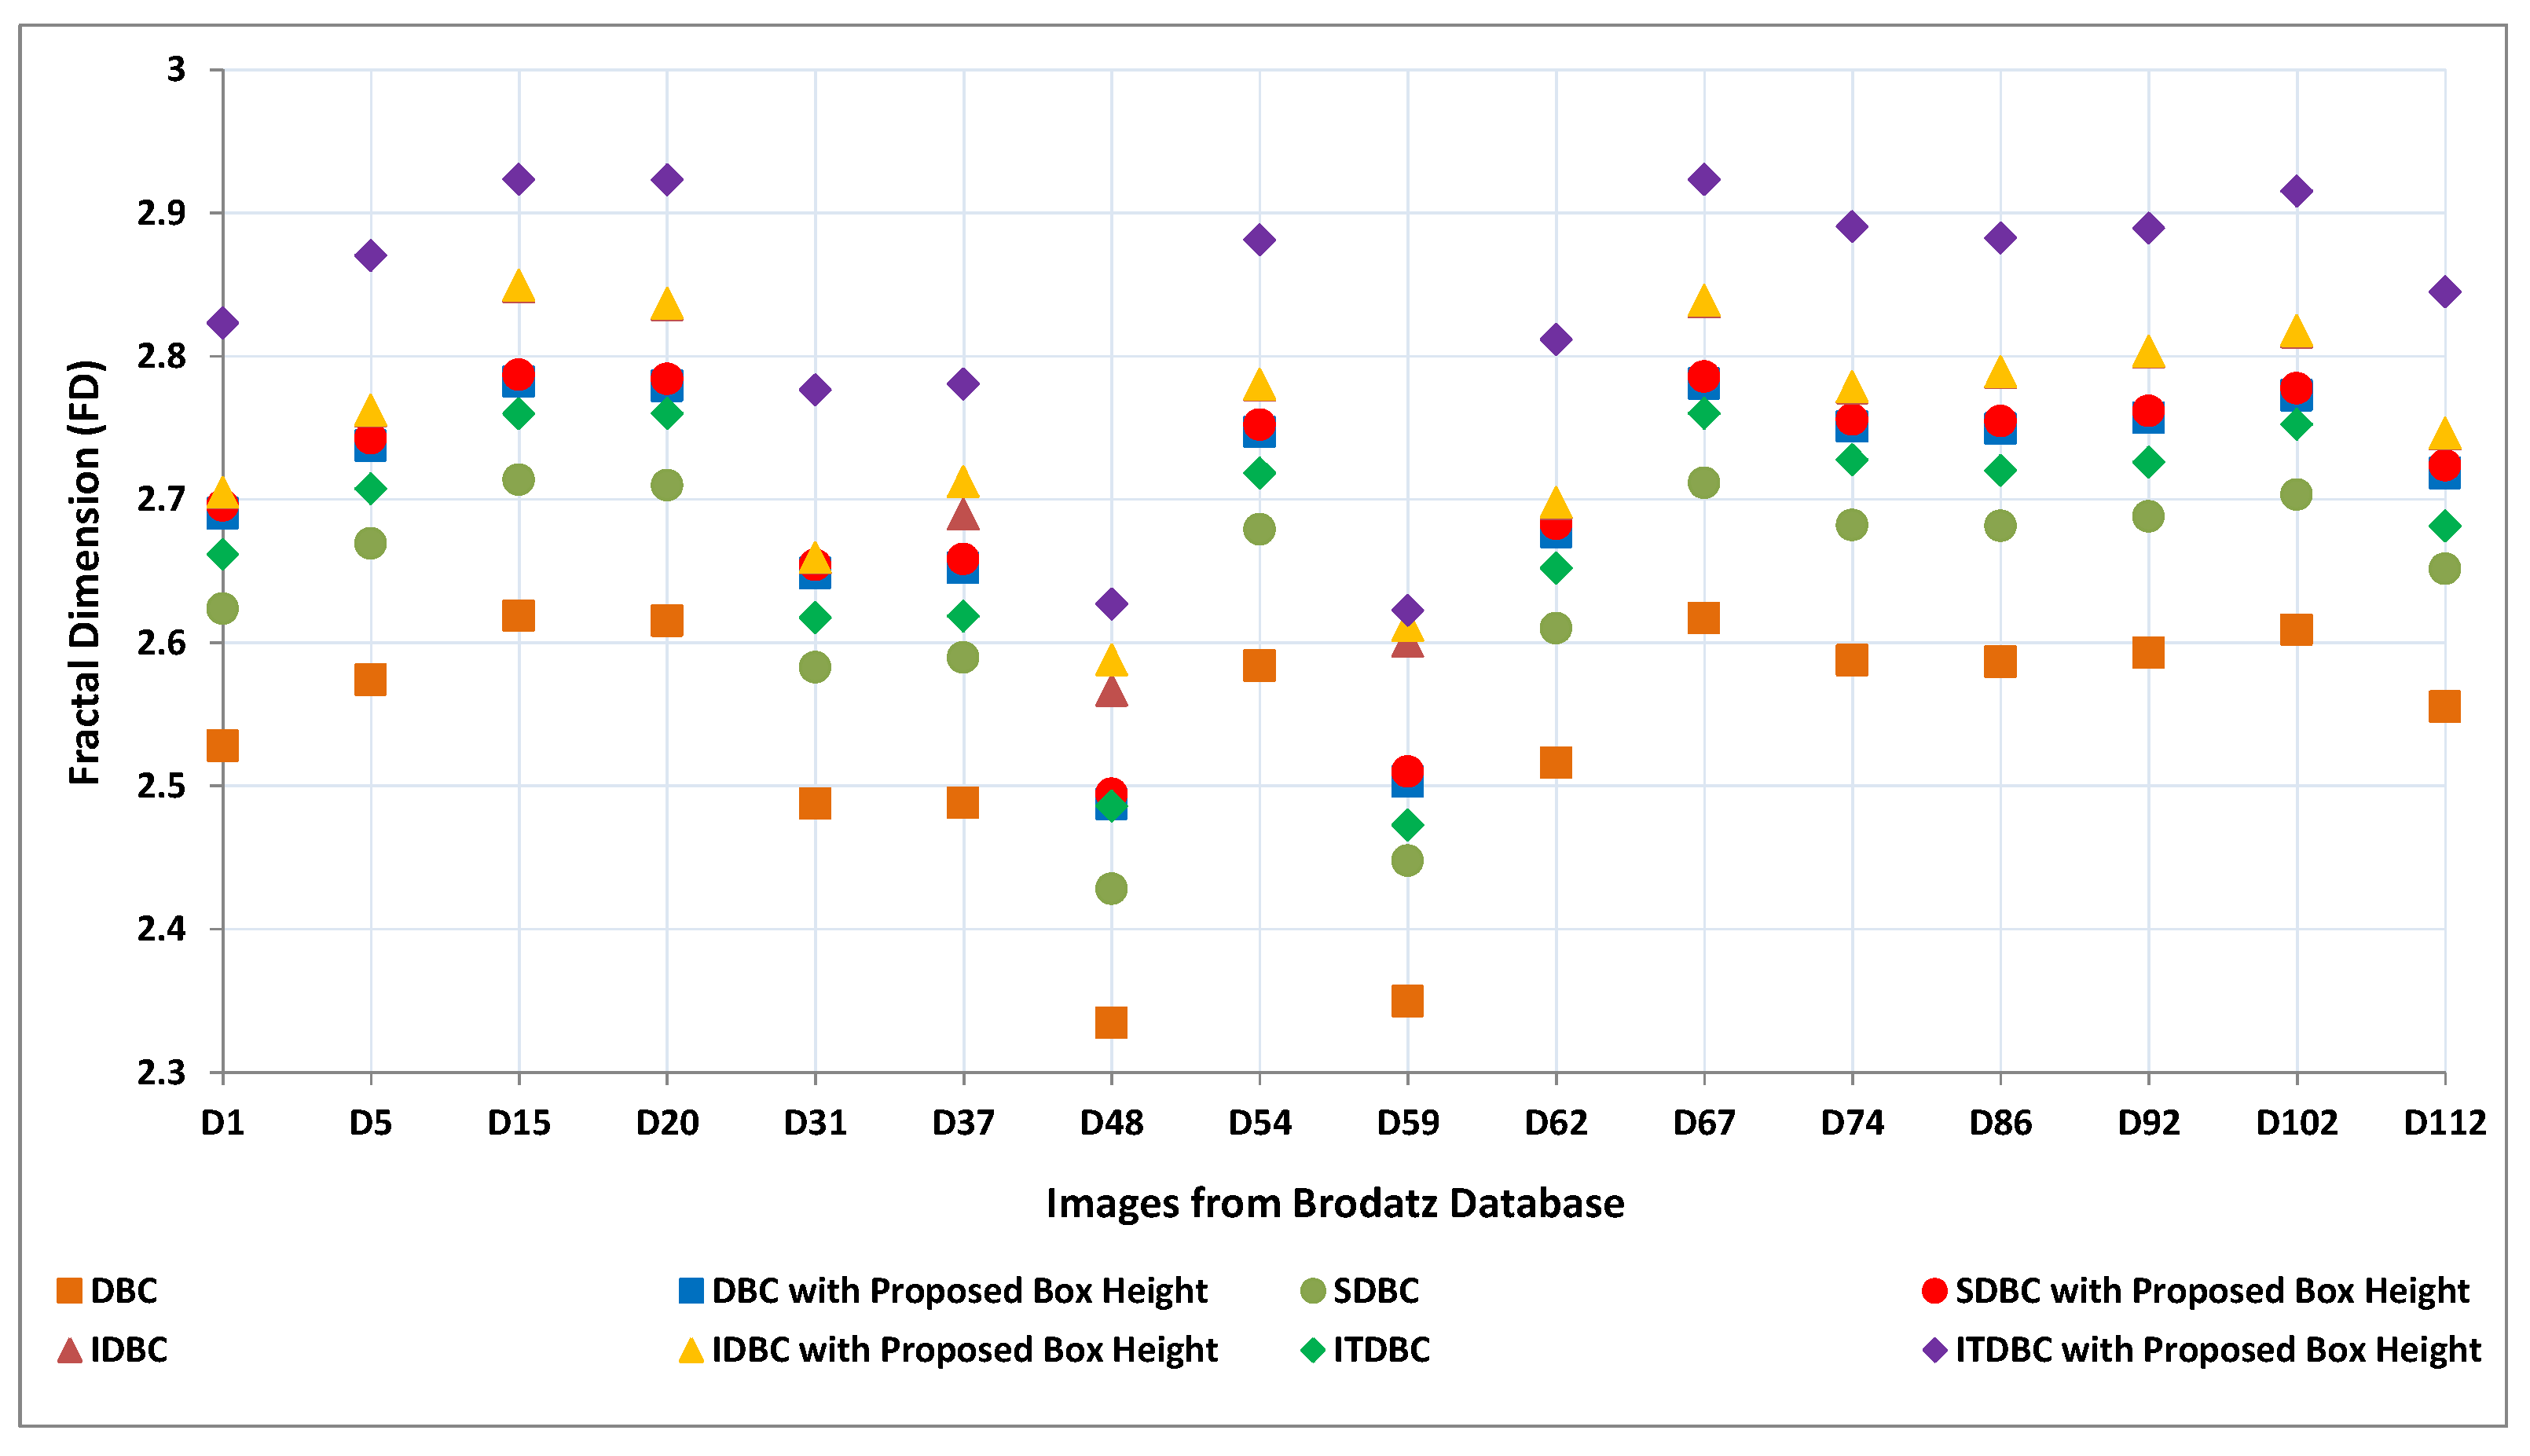
We have also plotted a similar graph for Brodatz Database in
Figure 10. In
x-axis of
Figure 10 represents image number and
y-axis denotes computed FD values using all the above mentioned methods. We can easily determine that the proposed box height along with ITDBC outperforms than other methods shown in
Figure 10.
FD is the main factor that indicates image roughness. DE is merely a secondary component of FD values and if less DE is generated than it is good but slightly high DE is acceptable and that does not mean that the method is entirely bad. The main priority lies in better estimating FD values, Hence we relaxed DE value while defining proposed box height i.e., not all DE values generated by proposed box height for DBC, SDBC, IDBC and ITDBC are less when compared with their original box heights as shown in last columns of
Table 8,
Table 9,
Table 10 and
Table 11.


 ,
, 


