1. Introduction
Methods based on the non-invasive monitoring of alterations in fish behavior and responses have shown their potential to indicate the influence on fish systems of stressors such as high density [
1,
2], exposure to hypochlorite [
3], hypoxia, feeding regime [
4], human drugs [
5], and MeHg [
6]. Implementation in aquaculture of these biological warning system (BWS) methods, could help to achieve the on-line quality and safety monitoring of farmed fish and aid in the certification of fish welfare practices [
7,
8]. The application of BWS concept as a monitoring method [
8] is particularly interesting when dealing with unexpected and/or novel contaminants, as was the case of melamine contamination in foods and feeds that caused thousands of deaths and was found to contaminate fish feed also [
9]. The analytical techniques for the detection of some highly relevant contaminants—in particular, environmental pollutants such as polychlorinated biphenyl (PCB) and dioxins, heavy metals, and human and veterinary medicines—are very specific, usually require sophisticated equipment and specialized personnel, and are relatively costly [
10], which hardly makes them suitable for their implementation within routine monitoring activities. On the other hand, it would be a great advantage to implement non-invasive monitoring methods capable of detecting deviations from the normal behavior that could serve as indicators of alterations affecting the fish. The application of BWS to fish farming requires the conceptualization of fish farming itself as a system subject to monitoring and modeling, identification of its “optimal operational point”, which in this case refers to the Shannon entropy (SE) value measured under optimal conditions for the European seabass system, and the measurement of its “actual operation point”, which is the current or measured SE value of the system, to detect potential deviations. It is to be expected that deviations from the norm will take place when negative alterations are introduced, but possibly also when those alterations induce an improvement on the animal’s quality of life.
Our current work is focused on MeHg because of the impact of this environmental contaminant on recommendations on fish consumption [
11]. MeHg is a neurotoxic substance and chronic exposure to it induces, among others, symptoms similar to those observed in amyotrophic lateral sclerosis, such as the early onset of hind limb weakness in humans [
12,
13]. The active swimming in salmon is affected by MeHg [
13]. MeHg also lowers the Shannon entropy (SE) of the trajectory in response to a stochastic event of a European seabass system [
6].
An adequate monitoring procedure should be able to identify both the loss and the recovery of homeostasis in the system—the latter in order to document the success of corrective actions. Accordingly, the purpose of the present work was to monitor the early evolution of SE in a European seabass system during a recuperation period of 11 days following a 15-day exposure to MeHg. The hypothesis to test was that the removal of the contaminant would bring the SE of the response to a stochastic event back to the optimal working range measured without the contaminant. The results indicated that 11 days was not sufficient to bring the system back to their initial SE values and that not only the trend of the SE
vs. time contains information, but also the daily evolution of the SE value. In addition, not surprisingly, 11 days may be too short a period of time to successfully eliminate the effects of this persistent organic pollutant. It is very likely that, once it has entered the food chain, special treatments may be required for its elimination or neutralization [
14].
2. Materials and Methods
2.1. Biological Material and Water/Environmental Conditions
European seabass (Dicentrarchus labrax, 4 ± 2 g, 8 ± 1 cm) generously provided by Grupo Tinamenor (Cantabria, Spain) had been transported to our lab in seawater with constant aeration. Upon arrival, they were acclimated for 1 week to 1800-L epoxy-coated fiberglass tanks containing aerated, circulating seawater at 13 °C. During the entire experimental period, the fish were subjected to a 12-h/12-h dark/light photoperiod and were fed once a day INICIO Plus feed from BioMar (56% crude protein, 18% crude fat) according to the manufacturer’s specifications for fish size, biomass, and water temperature.
The salinity was measured prior to the beginning of the experiment by a multiparametric meter HANNA HI98192 (Hanna Instruments, Inc., Woonsocket, RI, USA), and it was 33 gr/L. The following water parameter values were also measured—temperature: 16.2–17.4 °C, pH: 7.8–7.9, ammonium: 0 mg/L and O2 saturation: > 80%. These values are considered non-stressful for seabass farming. The water used was pumped directly from the sea and was naturally sand-filtered and treated with ion exchange resins in order to eliminate any possible contaminant. An additional stone-diffused air supply was introduced into the tank which was interrupted only during the time necessary to video-record the fish in order to avoid artifacts in the images.
2.2. Experimental Setup and Exposure to Methylmercury (MeHg)
The two experimental cases of European seabass were C
1 (control system, not exposed to MeHg) and C
2 (exposed system, treated with 4 μg MeHg/L during the previous 14 days, according to Branco
et al. [
15]). MeHg (CH
3ClHg, was Sigma-Aldrich product number 33368) was added to the water to ensure that all fish were exposed to the same concentration of the contaminant. During the 11 days following the removal of the contaminant, both cases were monitored, and their SE measured, as described by Eguiraun
et al. [
6]. Fifteen days of exposure to MeHg in the water were selected because we had observed that it was both sufficient to induce biological changes (including thyoredoxine reductase activity in liver and metabolite profile in brain, work in preparation) and short enough to avoid inflicting unnecessary suffering to the fish. The selection of the length of recovery period was set to 11 days, because we were interested in mapping the initial recovery period of the system and did not know how the system might respond. During the 14 days of MeHg treatment and the 11 days of recuperation, both cases were subjected to the same conditions, including the frequency of water changes (every second day during the treatment period), which induced an unavoidable development of turbidity in the water due to the impossibility of having circulating seawater with a reliable constant and continuous MeHg concentration. The differences in the fish number in C
1 (
n = 26) and C
2 (
n = 19) during the 11 days of recuperation were due to the mortality that took place during the 15 days of exposure to MeHg in C
2. No mortality was registered in C
1.
As described by Eguiraun
et al. [
6], European seabass were placed in 2 tanks (100 cm × 100 cm × 90 cm) filled up to a height of 80.5 cm with 810 L of aerated seawater and acclimatized for 3 weeks. Each tank was under direct artificial light (2 × 58 W and 5200 Lm), avoiding shadows as much as possible. During the 15 days of exposure to MeHg, the water of both tanks (treated and control) was renewed every 48 h, or less, to limit the concentration of nitrogen residuals. The water was running during the post-exposure recuperation period.
The experimental procedure was approved by The Ethical Committee for Animal Welfare No. CEBA/285/2013MG.
2.3. Data Acquisition
Image acquisition was carried out as described by Eguiraun
et al. [
6] using a GoPro Hero3 camera with underwater housing (GoPro, Inc., San Mateo, CA USA) inside each tank. Raw data were recorded in a 1440-pixel high definition format at 24 frames per second (fps) and a 4:3 aspect ratio, and it was stored on SanDisk 32 Gb UltraMicro SDHCTM (Class 10) secure cards.
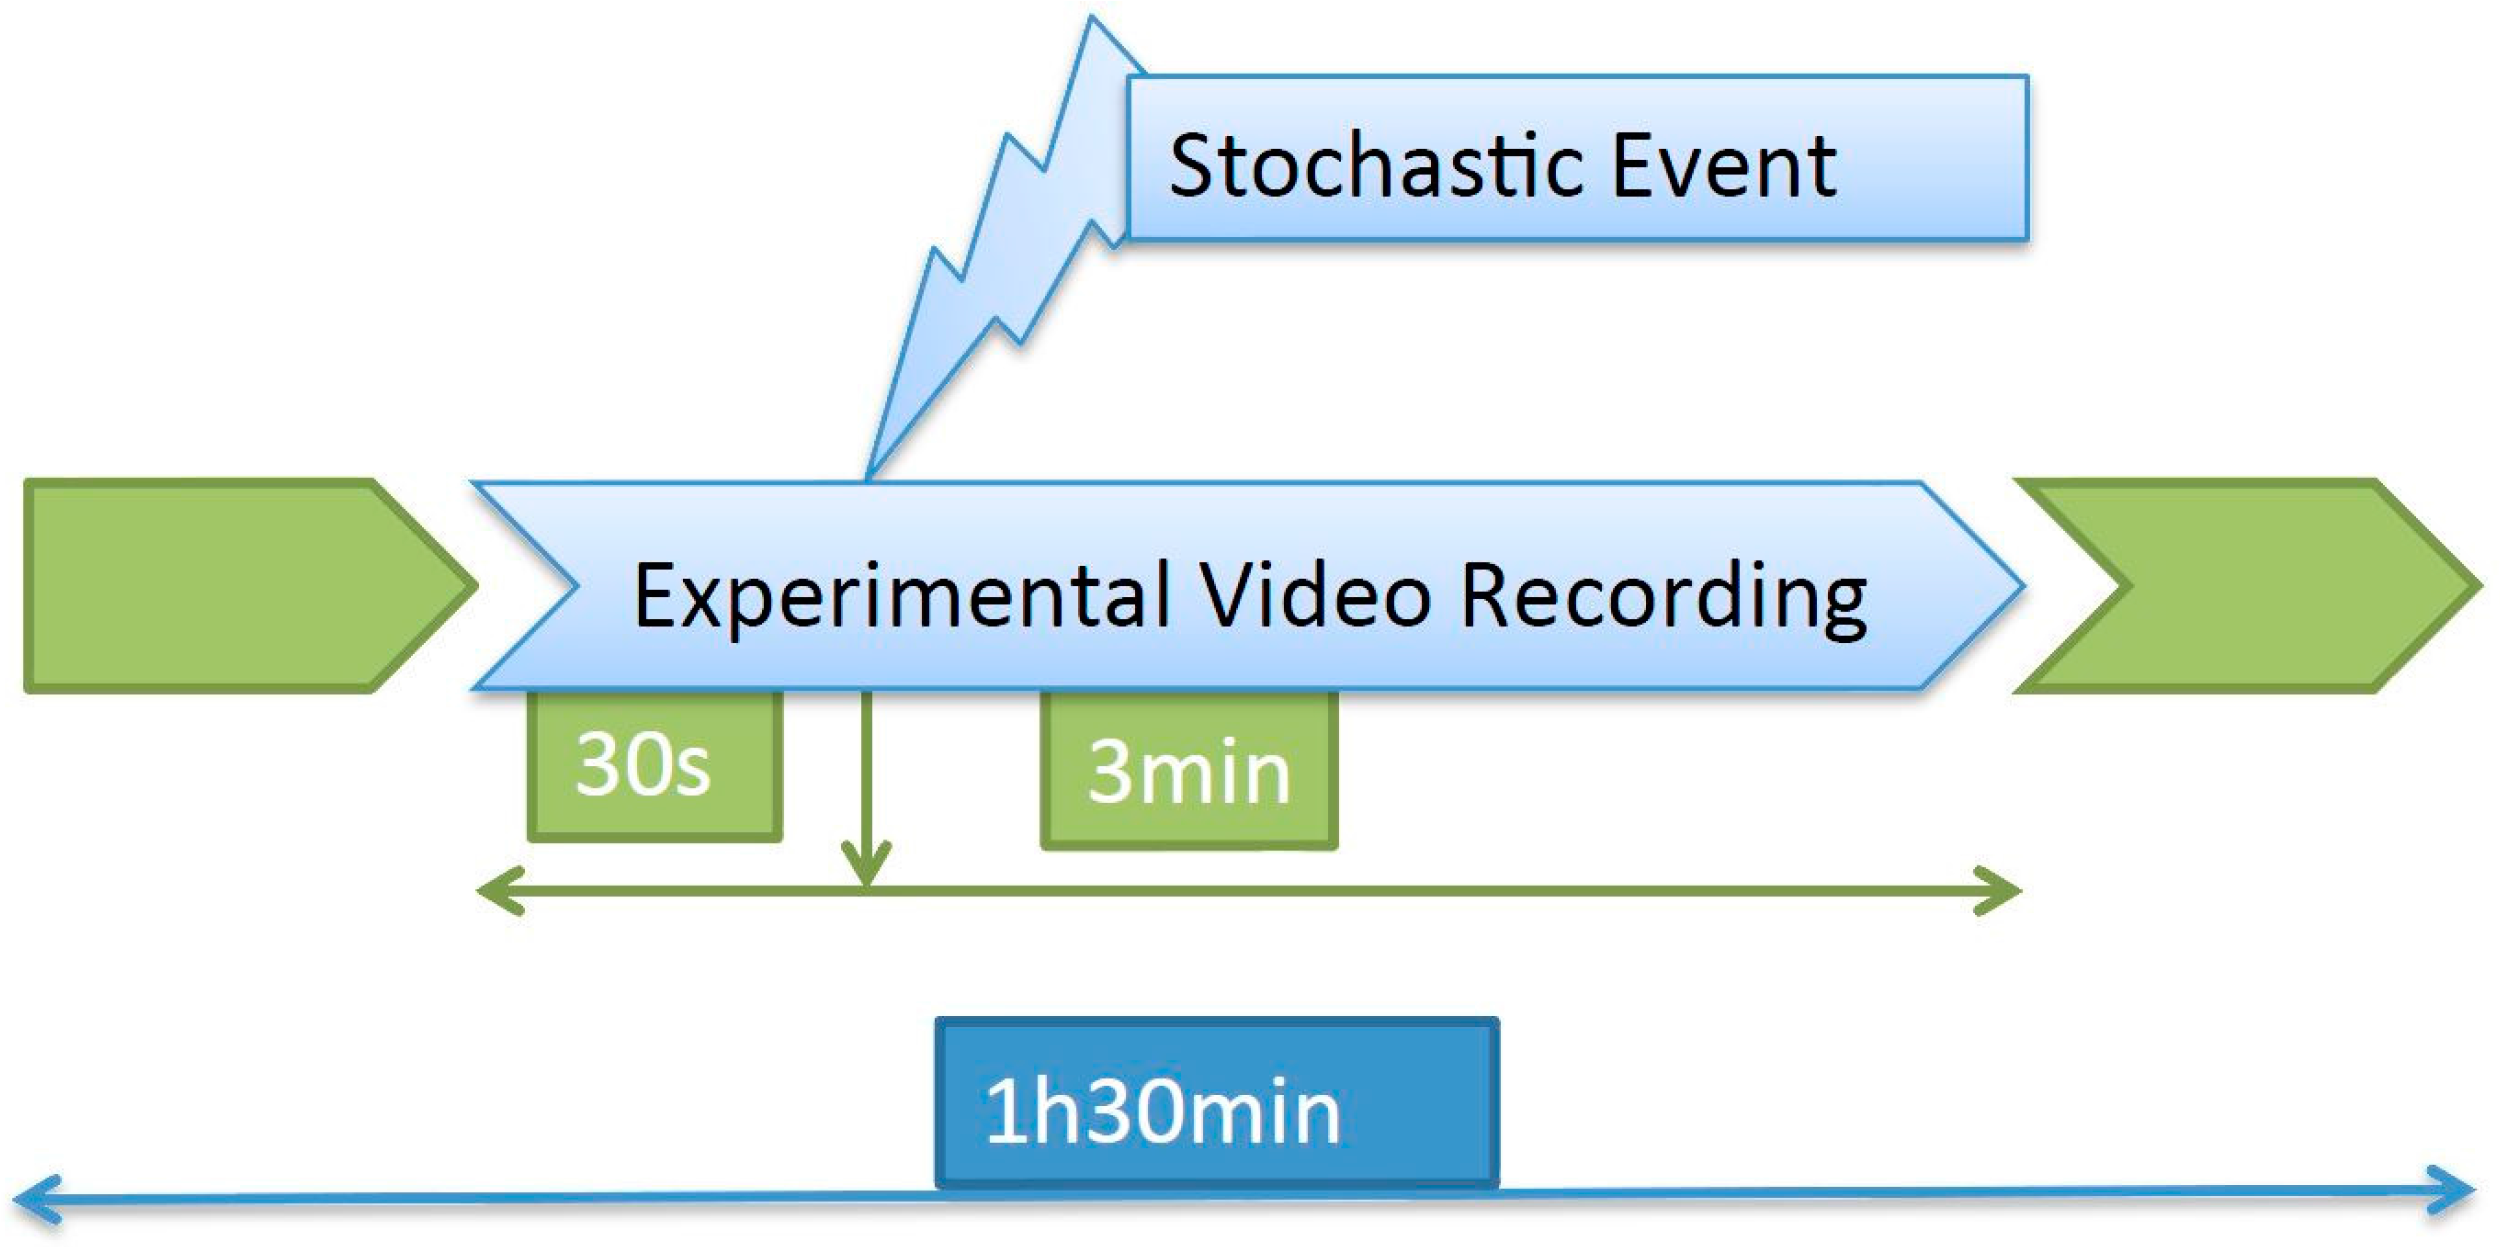
The recording took place for 1.5 h every day, and approximately in the middle of that period a stochastic event consisting of a hit on the tank was introduced. The images to be processed consisted of a 3.5-min video clip containing the response to the event (
Figure 1).
2.4. Image Processing
Once the wanted video clips (1 event per tank and per day) were located in the 1.5-h recordings, they were transformed into a 640 × 480 pixel format image sequences per video clip at 24 fps using the iMovie commercial software (version 10.1.2, Apple Inc., Cupertino, CA, USA) and MPEG Streamclip free software (version 1.9.2, Squared 5 srl, Roman, Italy). Subsequent image and feature extraction were carried out with Matlab (version R2014a, The MathWorks, Inc., Natick, MA, USA) running on a MacBook Pro (Apple Inc., Cupertino, CA, USA) 2.6 GHz Intel Core i7 laptop with a SSD storage disk and 16 GB of RAM.
2.5. Trajectory Estimation
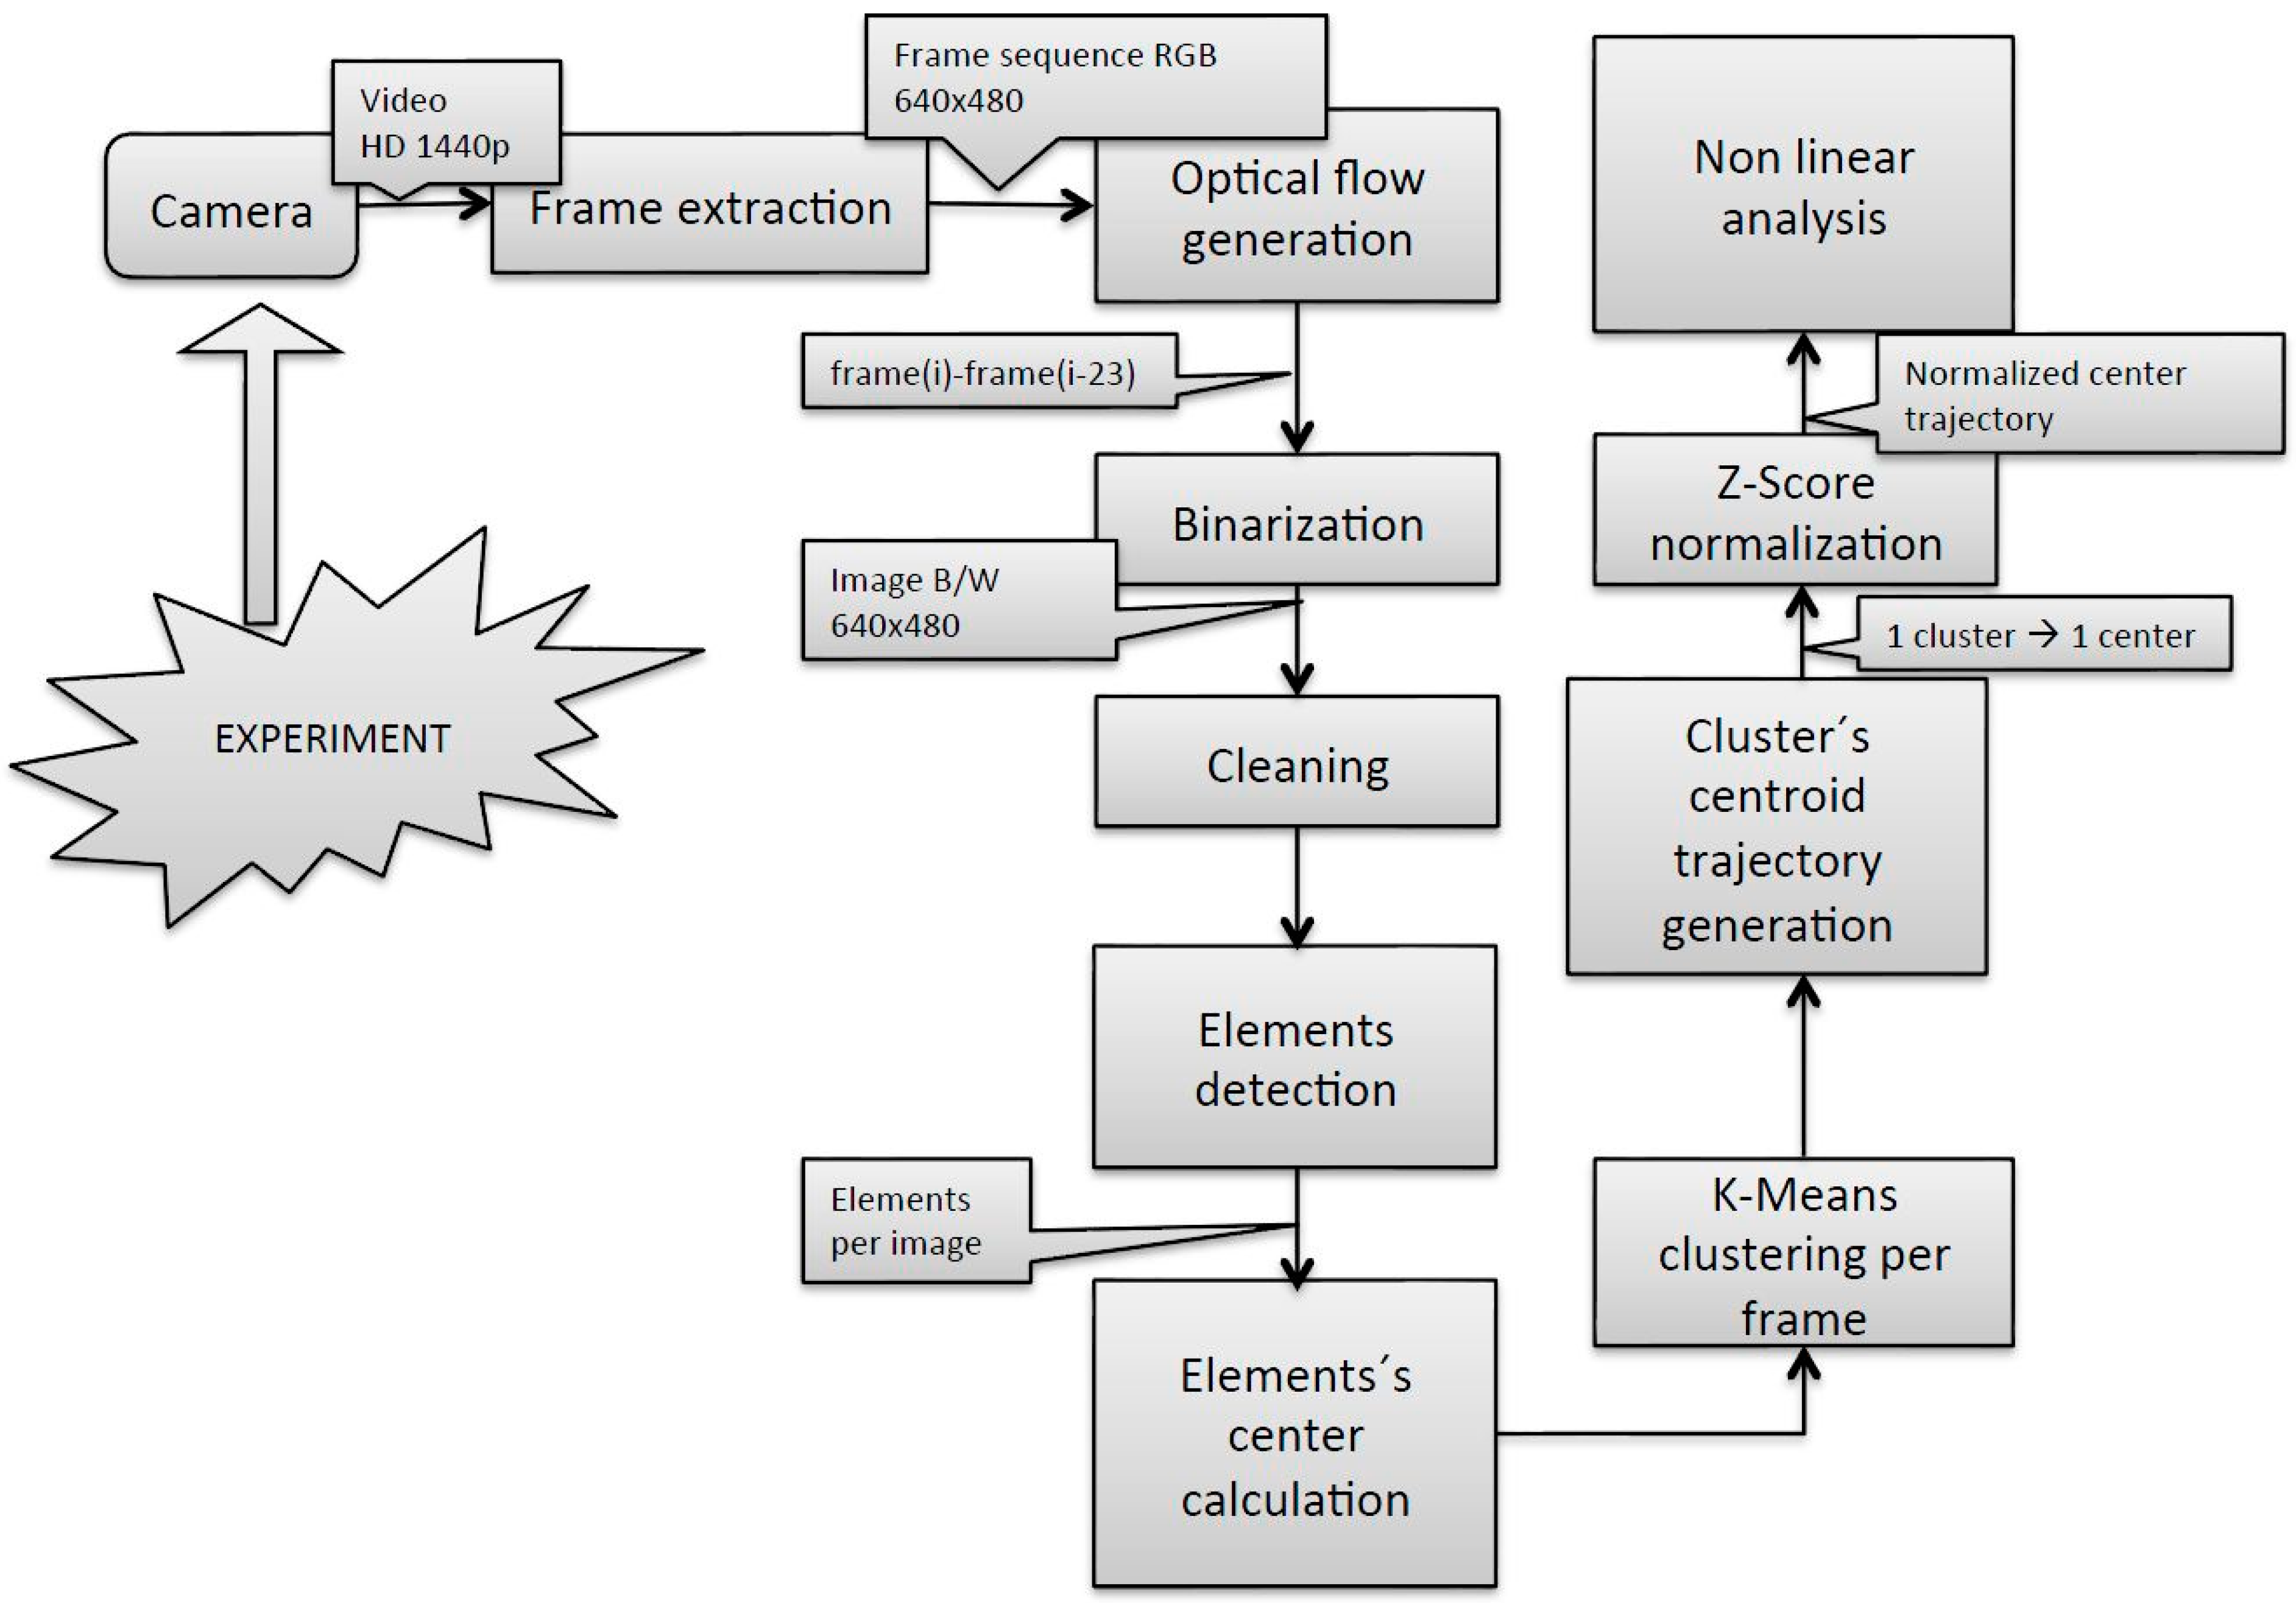
The methodology used from image acquisition to the fish group centroid trajectory estimation, depicted in
Figure 2, was based on that described in [
6], with some modifications introduced in the fish group centroid trajectory estimation. Firstly, the trajectory of the cluster’s centroid was built computing the element’s centers in every single frame, which led to a very noisy signal unsuitable for the subsequent non-linear signal analysis. Accordingly, the noise of the signal was reduced calculating the cluster’s centroid applying the k-means algorithm to the number of elements in each frame using the centers of the elements in the first frame as input coordinates. Secondly, the trajectories in X- and Y-axes present different scale dimensions. X trajectories have dimension from 0 to 640 and Y trajectories have dimension from 0 to 480 due to the 640 × 480 pixel image size. Although the results indicated that analyzing those raw trajectories by the SE algorithm led to satisfactory results, we considered it stricter and more robust for future applications to normalize those two signals. Normalization was performed using the z-score technique for the X and Y trajectories in the current work.
2.6. Non-Linear Trajectory Analysis—Calculation of the Shannon Entropy
SE was selected as the best parameter to analyze the trajectories due to its low computational load and robustness [
6]. As proposed by Shannon on his studies on languages [
16], the SE allows the estimation of the average minimum number of bits needed to encode a string of symbols based, in his case, on the alphabet size and the frequency of the symbols. This indicated the minimal number of bits per symbol needed to encode the information in binary form in case the logarithm base were 2. Shannon used this entropy measurement to estimate redundancy in the English language [
17].
Formally, the entropy
of a single discrete random variable
is a measure of its average uncertainty. Shannon entropy [
16] was calculated as described by Eguiraun
et al. [
6]. It follows a detailed description of the equations used to perform the calculations.
where X represents a random variable with a set of values
and probability mass function
, and
represents the expectation operator. Note that
if
.
For a time series representing the output of a stochastic process, that is, an indexed sequence of
random variables,
, with a set of values
, respectively, and
, the joint entropy is defined by
where
is the joint probability for the
variables
.
By applying the chain rule to Equation (2), the joint entropy can be written as a sum of conditional entropies, each of which is a non-negative quantity:
Therefore, the joint entropy is an increasing function of
. The rate at which the joint entropy grows with
,
i.e., the entropy rate
, is defined as
It must be said that for stationary ergodic processes as random processes, the evaluation of the rate of entropy has proven to be a very useful parameter [
18,
19,
20,
21,
22,
23].
The trajectories of the response to the stochastic event were measured both in the control case C1 and in the treated C2.
3. Results and Discussion
We have selected in our studies to monitor the SE of the fish system in response to a stochastic event that appears to be simpler and requires less computational load than other algorithms and will probably be easier to adapt to other species [
6]. Despite the fact that, during the experimental period, many “events” have taken place (feeding, placing, and removing the camera, changes in the environment,
etc.), it would not have been possible to monitor the responses to all of them. Therefore, we chose to measure the response to only one event that we provoked ourselves, namely, a physical punch on the tank with the fist to which we refer to as “a hit on the tank”.
During the MeHg treatment period, the seawater was not circulated in either tank. In C
1, as control case, it was necessary to keep the same conditions used for the experimental case (C
2). In C
2, the water could not be kept running because we needed to maintain the MeHg concentration, and we also wished to minimize the volume of contaminated water that had to be treated prior to being safely discarded. Although the parameters used as diagnostic for acceptable seawater quality (ammonia, nitrate, dissolved O
2, temperature, and pH) were monitored daily and found to be within an acceptable range, turbidity did develop in the 48-h periods that the water was kept still, and we assume that these conditions must have induced some degree of stress in the fish. In consequence, during the 11-day period of this study, we expected recuperation from stressful conditions in both tanks—in C
1, from suboptimal water quality; in C
2, from suboptimal water quality and from MeHg poisoning. Although we did not expect any mortality in any of the groups [
15], the observed mortality in the treated group in our study may be, at least partially, due to the small size of the fish combined with the exposure to the contaminant.
The working hypothesis was that, upon improvement of the quality of the water and withdrawal of the MeHg, the fish would initiate a period of gradual recuperation to reach homeostasis, that the recuperation would be faster in the control group (C1), and that these changes would be reflected in the SE of the shoal’s centroid, i.e., that the SE values would be outside the optimal operational point at the beginning of the recuperation phase and tend towards the optimal operation point values as the fish systems approach homeostasis.
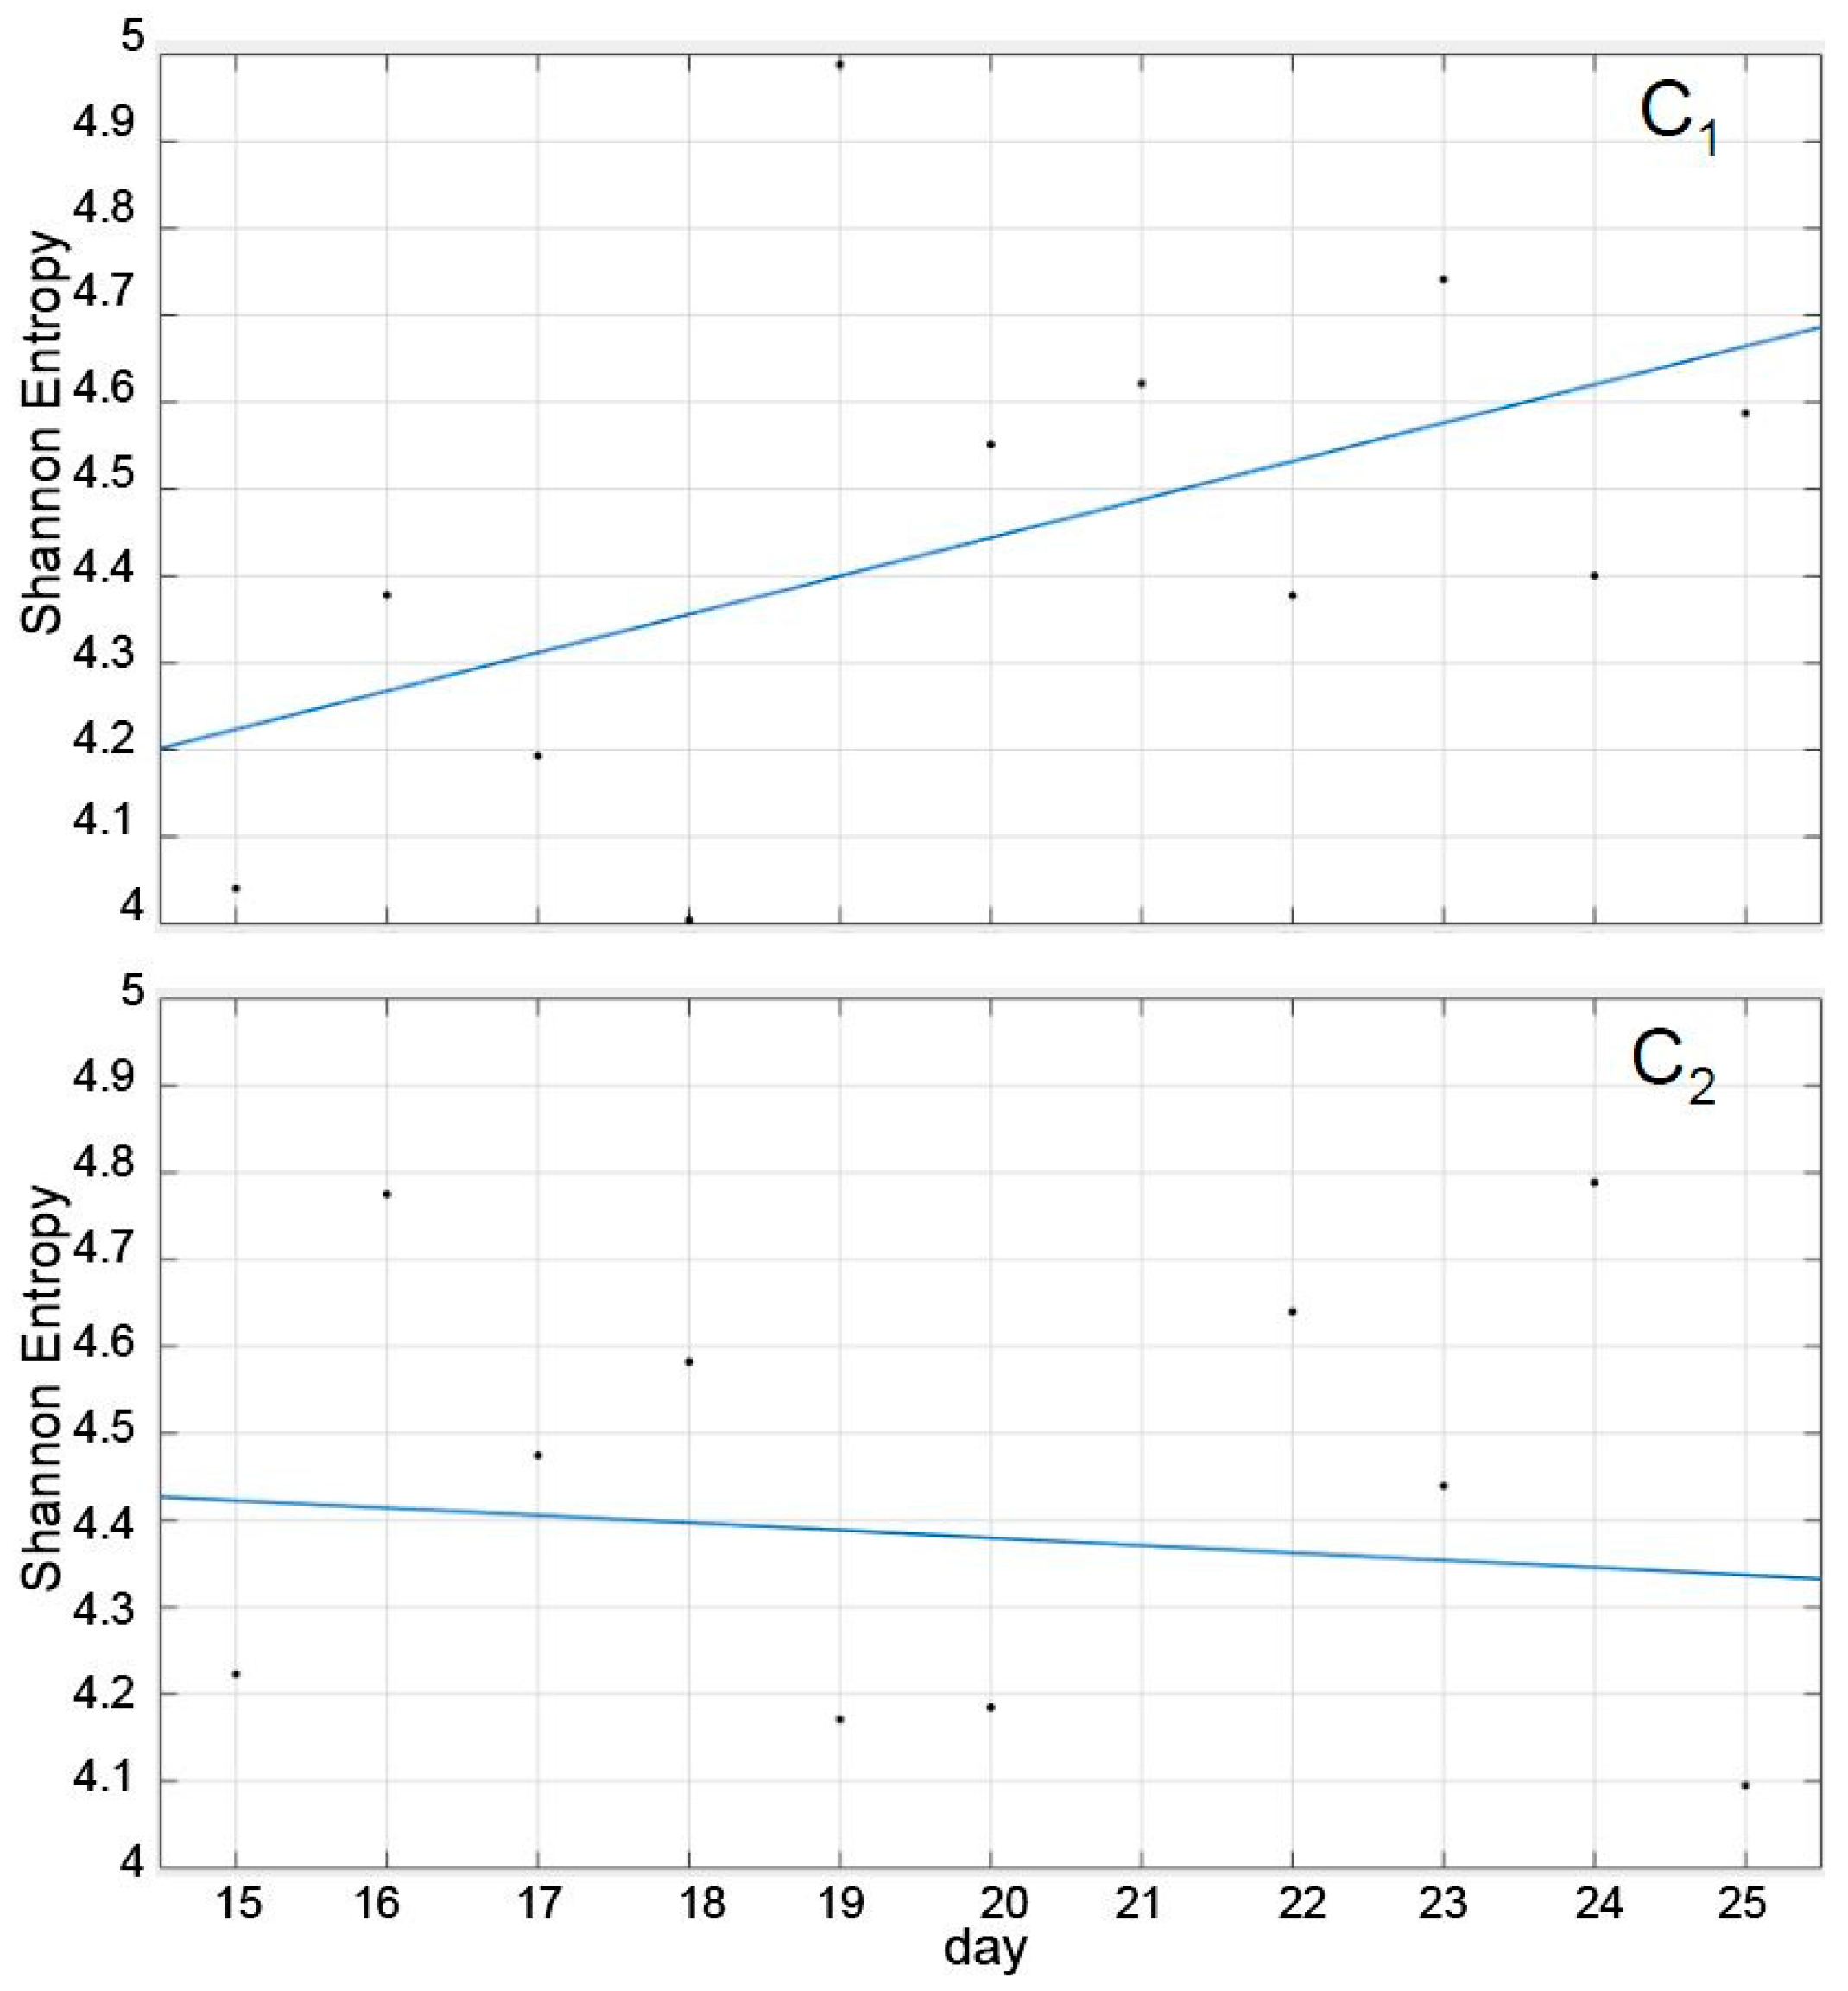
Interestingly, as shown in
Figure 3, the SE trend corresponding to the recuperation was remarkably different in both cases, although their average values during the period was not (
Table 1). Thus, while the recuperation period in C
1 induced a more or less consistent trend towards increasing its SE, tending towards the pre-treatment value, the trend in C
2 was practically absent, with daily SE values nearly erratic and oscillating between 4.8 and 4.1 (recuperation days 10th and 11th). In other words, the trend that the SE followed during the recuperation period had a discriminatory value, but the values themselves, individually or averaged, did not (
Figure 3 and
Table 1).
However, since the calculation of the SE was based solely on the trajectory of the cluster´s centroid, it may have been influenced by underlying factors intrinsic to the species such as subgroup formation and size, individual interactions, the shape and volume of the tanks, the selected recording periods and time of the day, and swimming characteristics. Given that the SE represents the integration of all that diverse information, the interpretation of
Figure 3 should be cautious, and the use of only the trend of the SE may not be sufficient to consider the system as recovered.
A complementary plausible explanation is that 11 days may be too short a period to achieve a significant recuperation. Moreover, given the absence of physiological and biochemical data to substantiate the differences in C1 and C2, it is not possible at this stage to propose a meaningful interpretation of these results. Nevertheless, it is tempting to speculate that the lack of recovery in the SE values of C2 reflects the lack of elimination of the contaminant from the fish tissues, which is in accordance with its known role as a persistent environmental pollutant. SE, on the other hand, seemed to follow a clearly increasing trend when the system was recuperating from a more modest stress, namely, the lack of water circulation for two-day periods, which may have only slightly affected the fish welfare.
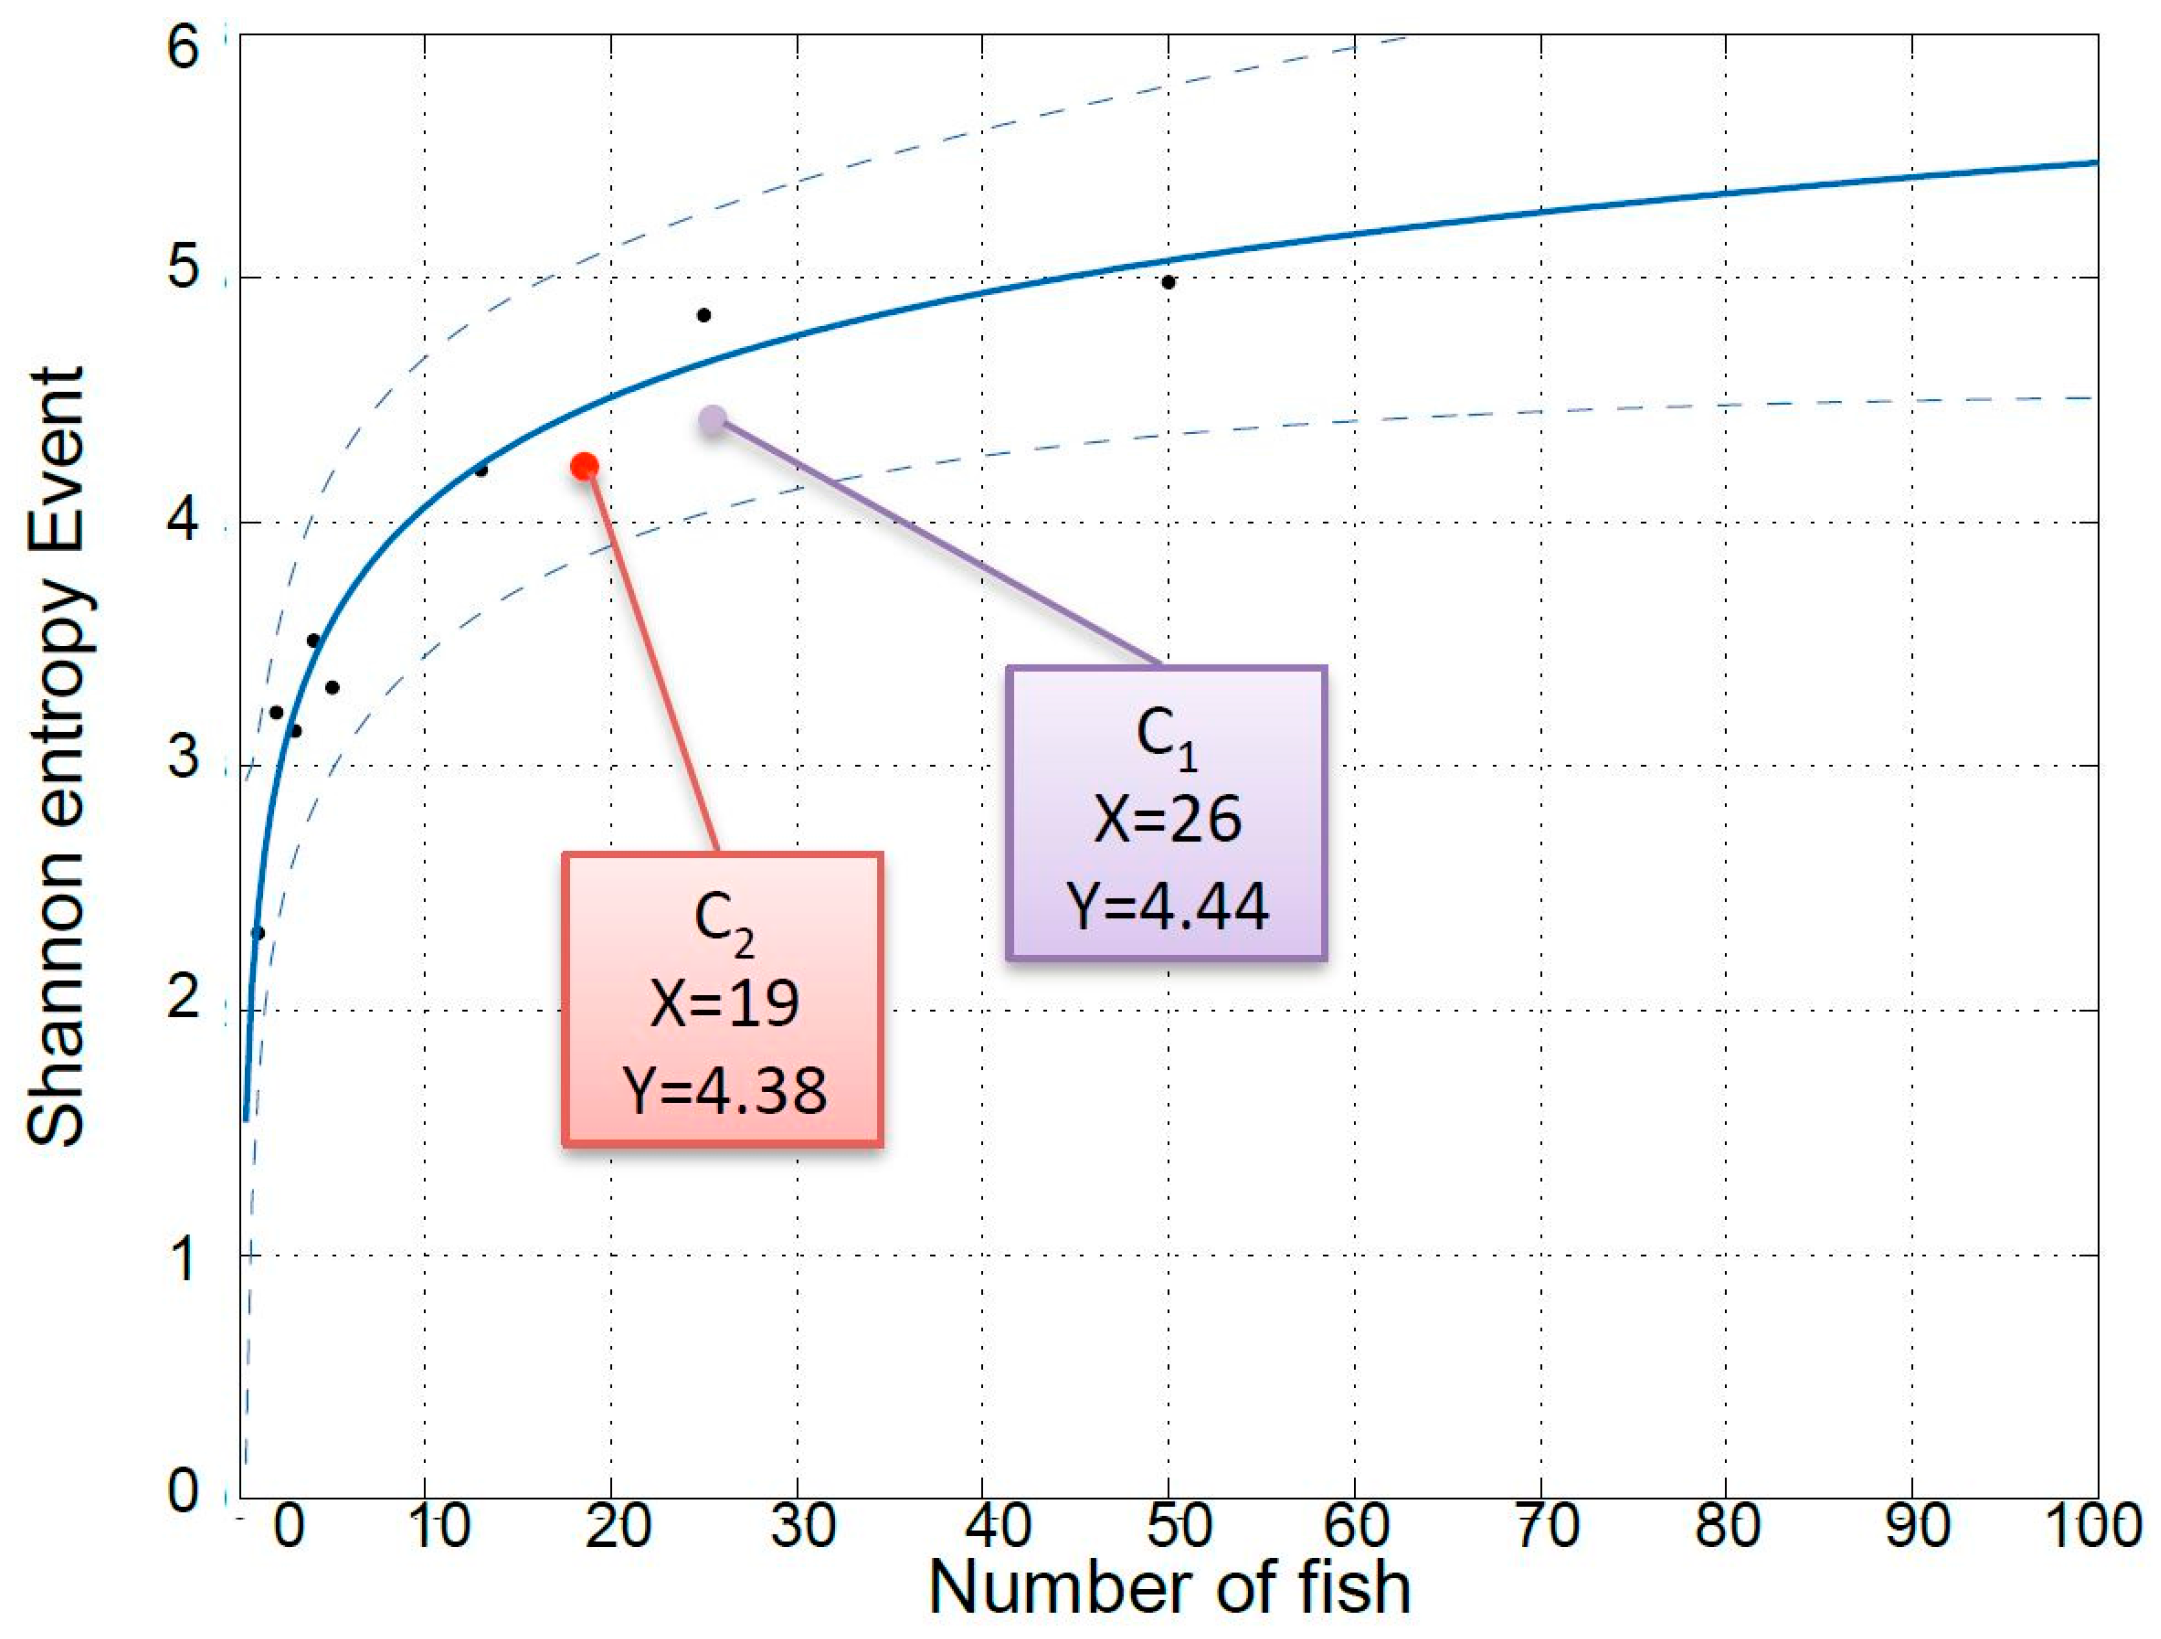
In addition to the negative effect that the MeHg treatment exerted (illustrated both by the decreased SE of the system and by the fact that six fish died in the treated group and none in the control), the difference in the number of fish between the two groups seems to have influenced the SE of the systems, although we cannot offer any explanation on the underlying physiological, behavioral, or ethological mechanisms causing this effect.
Figure 4 is a plot of the SE of responses to a stochastic event of eight different European seabass systems with different numbers of fish (1, 2, 3, 4, 5, 13, 25, and 50 fish) and not subject to any known stressor (results submitted for publication in another paper). Interestingly, the average SE values measured in the present work during the recuperation period for the two cases with 16 (C
1) and 19 (C
2) fish are in accordance with those predicted by the model calculated based on a variable number of individuals.
At this point, we wish to postulate that the fish behave like a system that suffers an alteration when a perturbation is introduced and that, unless the perturbation has a very big impact (such as that of MeHg poisoning), the system gradually recovers and gets back to a steady state. However, when the perturbation introduced has substantial and persistent effects, the system presents a much less clear evolution along the recovery period, as seen in C2. The results obtained support the suggestion that the tool designed may have an application in the monitoring of fish welfare and seafood safety. Thus, fish might be considered unsuitable for consumption if their SE is not within the optimal working range and displays widely daily oscillation patterns. These results may also be a first step towards classifying different stressors on fish systems according to the kind of responses and trends they induce on their SE.
Additional experiments are required to confirm the effect of MeHg exposure on the SE of fish systems, for example, (i) whether there is a dose-response effect; (ii) whether removal of the contaminant alone might bring it back to the optimal working range; (iii) whether additional treatments may be necessary for the recovery of the system; (iv) what the length of time necessary for the system to recover is; or (v) whether affected systems must simply be destroyed for their constituting a risk to the environment and to humans.
Thus, the results of this work have the potential to be applied to other stressors that affect the fish system’s status and its response to an event. However, it must be taken into account that the response of different species to a given contaminant, as well as the response of a given system to different contaminants, may vary. Our work must be envisioned as the demonstration of the potential to implement the proposed non-invasive monitoring of the SE of a system to estimate its deviation from what is considered “normal” by the operator (
i.e., the farmer), and this information may be used to infer the presence of a stressor (such a contaminant, but also a parasitic infection, a pathogen, or any other factor) and not a method to estimate the presence of any given contaminant, pathogen, or parasite. This second part of the identification of the agent causing the alteration in the SE requires traditional identification methods,
i.e., analytical chemistry for chemical contaminants and biological methods (polymerase chain reaction (PCR), immunological techniques) for biological agents [
8].
Moreover, analyzing fish behavior is a very complex and species-specific attribute. Given that there are several thousand species of fish that are currently used as food, we recommend that the application of the current results to other pairs of species-contaminant interactions be made with caution, particularly for phylogenetically distant species and for contaminants with different mechanisms of action. Optimally, the behavior of each species should be tested. Furthermore, it must be considered that inorganic Hg is also a relevant environmental contaminant, and, while its physiological effects have been studied in different species and tissues [
24,
25,
26], its effect on the SE of the fish system should also be mapped in future works.


