Article

The Effect of Threshold Values and Weighting Factors on the Association between Entropy Measures and Mortality after Myocardial Infarction in the Cardiac Arrhythmia Suppression Trial (CAST)

by
Christopher Mayer
1,*,
Martin Bachler
1,2,
Andreas Holzinger
3,
Phyllis K. Stein
4 and
Siegfried Wassertheurer
1
1
Biomedical Systems, Health & Environment Department, AIT Austrian Institute of Technology, Donau-City-Str. 1, 1220 Vienna, Austria
2
Institute for Analysis and Scientific Computing, Vienna University of Technology, Wiedner Hauptstr. 8–10, 1040 Vienna, Austria
3
Research Unit, HCI-KDD, Institute for Medical Informatics, Statistics and Documentation, Medical University Graz, Auenbruggerplatz 2, 8036 Graz, Austria
4
Cardiovascular Division, Washington University School of Medicine, 660 S. Euclid Ave., St. Louis, MO 63110, USA
*
Author to whom correspondence should be addressed.
Entropy 2016, 18(4), 129; https://doi.org/10.3390/e18040129
Submission received: 28 January 2016 / Revised: 23 March 2016 / Accepted: 31 March 2016 / Published: 8 April 2016

Abstract

:
Heart rate variability (HRV) is a non-invasive measurement based on the intervals between normal heart beats that characterize cardiac autonomic function. Decreased HRV is associated with increased risk of cardiovascular events. Characterizing HRV using only moment statistics fails to capture abnormalities in regulatory function that are important aspects of disease risk. Thus, entropy measures are a promising approach to quantify HRV for risk stratification. The purpose of this study was to investigate this potential for approximate, corrected approximate, sample, fuzzy, and fuzzy measure entropy and its dependency on the parameter selection. Recently, published parameter sets and further parameter combinations were investigated. Heart rate data were obtained from the "Cardiac Arrhythmia Suppression Trial (CAST) RR Interval Sub-Study Database" (Physionet). Corresponding outcomes and clinical data were provided by one of the investigators. The use of previously-reported parameter sets on the pre-treatment data did not significantly add to the identification of patients at risk for cardiovascular death on follow-up. After arrhythmia suppression treatment, several parameter sets predicted outcomes for all patients and patients without coronary artery bypass grafting (CABG). The strongest results were seen using the threshold parameter as a multiple of the data’s standard deviation ( r = 0 . 2 · σ ). Approximate and sample entropy provided significant hazard ratios for patients without CABG and without diabetes for an entropy maximizing threshold approximation. Additional parameter combinations did not improve the results for pre-treatment data. The results of this study illustrate the influence of parameter selection on entropy measures’ potential for cardiovascular risk stratification and support the potential use of entropy measures in future studies.

1. Introduction

More than 50 years ago, it was realized that the variation of the heart rate, i.e., heart rate variability (HRV), could be used as a marker of cardiovascular health status [1]. This discovery was originally applied to fetal medicine where reductions in fetal HRV during labor identified babies who were in distress [1]. However, when HRV measures were applied to post-myocardial infarction (MI) patient populations, it became clear that the presence of decreased HRV could be important for risk-stratifying such patients [2].
HRV reflects the net effect of many physiological factors modulating the normal rhythm of the heart and ideally providing cardiac output that is matched to the needs of the body on a beat by beat basis. The data on which HRV analysis is based have traditionally been derived from the ambulatory electrocardiogram (ECG), i.e., the electrical signature of the cardiac cycles from which normal-to-normal interbeat intervals can be identified and measured.
An increasing number of measures are being developed and applied to quantify HRV in the time- and/or frequency domain [3,4]. Sassi et al. [5] provided a critical review of newer methods (e.g., long-range correlation and fractal analysis, short-term complexity, entropy) highlighting their contribution to the technical understanding of HRV and their ability to quantify the complex regulation mechanism of the heart rate not covered by traditional methods. In addition, they addressed the rather limited success of these newer methods in clinical applications.
More specifically, some of the traditional HRV measures [4] achieve good results in clinical settings (e.g., Total Power, Ultra and Very Low Frequency Power, Low Frequency/High Frequency ratio, [6]), others work only on specific subgroups (e.g., the standard deviation of normal-to-normal (NN) intervals (SDNN) or the standard deviation of the 5-minute average of NN intervals (SDANN), [6]), and some are very limited in assisting in the diagnosis of patients (e.g., the average of NN intervals (AVGNN), or the root mean square successive difference of NN intervals (rMSSD), [7]). Therefore, in the quest of comprehensively quantifying all aspects of HRV, one has to try new measures and learn more about their potential and optimal settings.
Machine learning, which combines computer and data science, statistics, and artificial intelligence, can potentially help to overcome the aforementioned limitations. It is rapidly growing, in terms of new learning algorithms and theory, and this growth is fueled by the increasing amount of available online data and the availability of low-cost computing power. The adoption of data-intensive machine-learning methods can lead to more evidence-based decision-making in the biomedical domain [8]. However, one is confronted with probabilistic, uncertain, unknown, incomplete, heterogeneous, noisy, and dirty data sets which increase the possibility of the modeling of artifacts. Another problem is that most machine learning approaches assume homogeneity in time, although most physiologic processes do not fulfill this requirement.
Entropy measures represent a family of new methods to quantify the variability of the heart rate [9]. Use of entropy measures is a promising approach, due to their ability to discover certain patterns and shifts in the "apparent ensemble amount of randomness" of a stochastic process [10], and to measure randomness as well as the predictability of processes [11]. In recent years, a huge variety of entropy measures was developed. Amongst the most widely used, especially in HRV analysis, are the approximate entropy ( ApEn ) [12], sample entropy ( SampEn ) [13], and fuzzy entropy ( FuzzyEn ) [14]. Some of those have been further developed, e.g., fuzzy measure entropy ( FuzzyMEn ) [15] and corrected ApEn ( CApEn ) [16].
In general, entropy measures quantify the likelihood that two similar runs of patterns of a certain length remain similar after increasing this length by one point [12]. Their specific behavior is determined by a number of parameters and the selection of these is crucial for the results.
In recent years, there have been several reports about the selection of parameters for various entropy measures (e.g., [17,18]). The results of these studies are in agreement on a couple of parameters, but there are different results published for some others. Furthermore, to our knowledge, all these HRV studies have performed their parameter selection on cross-sectional data, in order to differentiate between pathological and non-pathological HRV. However, to the best of our knowledge, the predictive value (i.e., the ability to predict mortality) of entropy measures utilizing the published parameter sets has not been investigated using outcome data. Therefore, Holzinger et al. recently raised the question of how to select parameters for entropy measures. By now, this problem has not yet been solved, especially for ApEn, SampEn, FuzzyEn and FuzzyMEn [9].
We therefore set out to assess the effect of parameter selection on the predictive value of entropy measures in a study of high risk post-myocardial infarction patients with multiple recordings who were followed for survival over a period of 362 ± 243 days. Thus, there are two primary aims of this study. The first is to investigate the predictive value of HRV for mortality using recently published parameter sets. Secondly, if these existing parameter sets fail to deliver significant results, our aim is to investigate additional possible parameter combinations. In this work, we are addressing the question raised by Holzinger et al. [9]; therefore, we focus on ApEn , SampEn , FuzzyEn , and FuzzyMEn . Furthermore, this work is based on the findings of previous publications focused on the same entropy measures [17,19]. Moreover, ApEn is known to be biased by self-matches, and several corrections have been proposed. SampEn is one of those corrections, and CApEn is another. To enhance comparability of the results of this work, CApEn was added to the list of methods under investigation.

2. Methods

2.1. Data

All heart rate data used in this study were taken from Physionet [20], a free-access, on-line archive of physiological signals. Physionet guarantees that all data have been fully de-identified (anonymized), and may be used without further institutional review board approval.
All RR interval data were taken from the "Cardiac Arrhythmia Suppression Trial (CAST) RR Interval Sub-Study Database" [7]. This subset was selected based on the availability of usable qualifying and suppression tapes to allow for evaluating the predictive value of HRV parameters with treatment [7]. CAST was designed to analyze the effects of suppression of ventricular arrhythmia by anti-arrhythmic drugs after MI on survival [21,22]. Corresponding outcome and clinical data were provided by one of the investigators and co-authors Phyllis K. Stein. Baseline (pre-treatment) interbeat (RR) interval data and data after treatment were used. In total, 760 pre-treatment and 740 after treatment recordings with corresponding follow-up data were available and used. Patient baseline data can be found in Table 1.

2.2. Entropy Measures

Entropy measures quantify the logarithmic likelihood of two similar sequences of length m (template length) to remain similar after increasing the length to m + 1 [12]. Thereby, similarity is defined either using a rectangular function of radius r (threshold parameter) or a fuzzy membership function of radius r and exponent n (weighting factor). Finally, some entropy measures distinguish between local and global similarity, therefore requiring local and global radii and exponents ( r L , r F , n L , and n F ). The total length of the analyzed series is commonly denoted as N.
In this work, approximate entropy ( ApEn ), corrected approximate entropy ( CApEn ), sample entropy ( SampEn ), fuzzy entropy ( FuzzyEn ), and fuzzy measure entropy ( FuzzyMEn ) were tested.
  • The approximate entropy ApEn as introduced by Pincus et al. [12] is calculated as
    ApEn ( m , r , N ) : = 1 ( N - m + 1 ) i = 1 N - m + 1 log C i m ( r ) C i m + 1 ( r ) ,
    where C i m ( r ) is the number of points found within the distance r for any point x ( i ) within the points x i m : = [ x ( i ) , . . . , x ( i + m - 1 ) ] , divided by N - m + 1 .
  • Since ApEn is biased by self-matches, the corrected approximate entropy CApEn was introduced by Porta et al. [16]. The correction is obtained by replacing the ratio C i m ( r ) / C i m + 1 ( r ) in Equation (1) by 1 / ( N - m + 1 ) when C i m ( r ) = 1 or C i m + 1 ( r ) = 1 .
  • Another modification of ApEn in order to correct its bias by self-matches is the sample entropy SampEn as introduced by Richman and Moorman [13]. It is defined as
    SampEn ( m , r , N ) : = l o g i = 1 N - m C i m ( r ) - l o g i = 1 N - m - 1 C i m + 1 ( r ) ;
    however, this time, C i m ( r ) does not count self-matches.
  • To soften the effects of a hard threshold r, Chen et al. [14] replaced it with the fuzzy membership function
    μ ( x , n , r ) : = e x p ( - 0 . 69 · ( x / r ) n ) .
    The factor of 0.69 was incorporated to get a value of 0.5 for x / r = 1 , which is important for comparisons between rectangular and fuzzy membership functions. Finally, with
    ϕ m ( r , n , N ) : = 1 N - m i = 1 N - m j = 1 , j i N - m μ ( d ( x i m , x j m ) , n , r ) N - m - 1 ,
    where d is the Chebyshev distance, the fuzzy entropy FuzzyEn is defined as:
    FuzzyEn ( m , r , n , N ) : = ln ϕ m ( r , n , N ) ϕ m + 1 ( r , n , N ) .
  • The fuzzy measure entropy FuzzyMEn , proposed by Liu et al. [15], introduces a distinction between local and global similarity based on FuzzyEn :
    FuzzyMEn ( m , r L , r F , n L , n F , N ) : = ln ϕ m ( r L , n L , N ) ϕ m + 1 ( r L , n L , N ) + ln ϕ m ( r F , n F , N ) ϕ m + 1 ( r F , n F , N ) .

2.3. Application of Entropy Measures to CAST Data

NN interval data were downloaded from Physionet [20] using the Waveform Database library (WFDB) for Matlab (version 0.9.10) [20,23]. Thus, the wrapper function "ann2rr.m" was extended to use the full functionality of the function "ann2rr" of the WFDB Software Package (version 0.9.10) [20] including the options "-p N" and "-P N" to restrict the output to NN intervals. There was no pre-processing step necessary, since downloaded NN intervals were already free of obvious artifacts. NN intervals at 6 p.m. (chosen to avoid transition effects between day and night) were extracted for all subjects to decrease computation time and to avoid daytime dependent variations. Depending on the parameter set, data length N was either 1000 or 1200, as listed in Table 2.
Unfortunately, we could not perform more robust randomized testing strategies (i.e., the permutation of the original data and choosing various time intervals) due to the high computational complexity of the entropy measures, which was already increased by two orders of magnitude due to parameter variation. A randomized testing strategy would have multiplied the computation time further by at least a thousand times.
Concerning the choice of the parameters of the entropy measures, recent studies are in agreement on a couple of parameters, such as template and data lengths (m and N), but there are discrepancies regarding the threshold parameters r ( r L , r F ) for all entropy measures and the selection of the weighting factors n ( n L , n F ) for fuzzy entropies [17,18].
Therefore, the parameters were first set according to those in the literature to test whether entropy measures have a predictive value with the suggested parameter sets [17,18]. The parameters used in this analysis can be found in Table 2.
Second, a parameter iteration and selection process for r ( r L and r F ) and n ( n L and n F ), respectively, was attempted to test whether the modified parameter sets improved the ability of the measures to risk stratify patients. Consistent with published recommendations, template and data length were set to m = 2 and N = 1200 , respectively [17,18]. The other parameters were iterated in the following ranges: (1) r [ 0 . 10 · σ , 0 . 45 · σ ] , where σ is the standard deviation of the signal, and r [ 0 . 25 · r Chon , 3 . 00 · r Chon ] , where r Chon is an approximation for the r value maximizing entropy values [24], and (2) n [ 1 . 0 , 5 . 0 ] .
The template length is usually set to m = 2 based on the recommendations of Pincus and Goldberger for ApEn [25], Yentes et al. for SampEn [26], and Porta et al. for CApEn [16]. These recommendations have been confirmed by other studies, e.g., [27]. Zhao et al. showed that SampEn performed similarly with m = 2 and m = 3 , but the latter choice is not suitable for FuzzyMEn [18]. A false nearest neighbor method is sometimes used as well, but its suitability for ApEn for human heart rate variability data could not be shown [24]. In [14,15], the template length is set to m = 2 for FuzzyEn and FuzzyMEn as well.
There have been reports that these measurements are sensitive to data length N [3,11,12]. The influence of data length on SampEn was not large for N > 200 [13,28], but was for N < 100 [26], indicating a stabilization of the behavior in the dataset that was tested [18]. Zhao et al. reported only small changes for SampEn and FuzzyMEn from N = 300 to N = 1000 [18]. In our previous study, we suggested choosing N > 200 or even N > 1000 depending on the threshold value r [17].

2.4. Statistical Analysis

The predictive value of each entropy measure was determined using a univariate Cox proportional hazards regression. It is a method to determine the influence of predictor variables X i (in this work: entropy measures) on survival times by fitting the coefficients b i of the model
h ( t ) = h 0 ( t ) · e x p i b i X i
to the observations, where the hazard rate h ( t ) and the baseline hazard rate function h 0 ( t ) are estimated from the data [29,30]. Finally, the particular hazard ratios are calculated as e x p ( b ) . Hazard ratios quantify the increase (or decrease) of the instantaneous risk at any particular time for every unit increase in the associated predictor variable. For example, a hazard ratio of 2 for a certain entropy measure means that the risk of dying is doubled for every unit increase in the entropy measure.
The univariate Cox proportional hazards regression is based on the null hypothesis that the predictor variable does not have any influence on mortality, i.e., that b = 0 and therefore the hazard ratio equals 1. The p-value represents the probability of a certain or more extreme observation under the assumption of a true null hypothesis. In this work, significance levels were set at the 5% level, i.e., the null hypothesis is rejected if p 0 . 05 .
Data were transformed by using the two-parametric Box–Cox transformation [31,32] to remove skewness after replacing negative values by 0 and adding an offset of λ 2 = 0 . 001 to fulfill the requirement of positive inputs. The transformation parameter λ is given where necessary.
Results for the parameter iteration and selection process are presented by their p-values and not by their corresponding hazard ratios and their 95% confidence interval opposed to literature, since the focus of the study was to assess the effect of parameter selection on the predictive value of entropy measures but not to compare these hazard ratios. Furthermore, this approach was chosen for reasons of clarity and comprehensibility, because some confidence intervals differ in order of magnitude and their visual comparison would be meaningless.
Additionally, cut-off values and their corresponding sensitivity and specificity were determined for entropies with significant predictive values. Thus, survival curves were compared for various cut-off values using the log-rank test, i.e., a rank order statistics to compare survival distributions of two samples [33], and the cut-off value maximizing the separation was chosen, i.e., cut-off value with lowest p-value. Results are stated as sensitivity and specificity with their corresponding results from the log-rank test comparing lower and higher risk groups ( χ 2 statistics and the associated p-value).
The analyses were performed on the whole data set as well as in subsets of patients without coronary artery bypass grafting (CABG), and without CABG and diabetes as reported in [7,34]. Baseline data and data after treatment were analyzed independently. All computations were performed using Matlab (R2014a) and R (Version 3.2.3).
We used statistical tests based on the same null hypothesis, (i.e., the predictor variable does not influence mortality), the same subject groups, the same endpoints and only slight variations of the analysis method. Thus, interaction of the observed results is not only possible, but highly probable. However, p-value adjustments, such as the commonly used Bonferroni correction, assume uncorrelated endpoints and are therefore considered inappropriate for the tasks in this work [35]. Besides, the aim of this work is not to test whether there is a difference between groups, but to investigate the ability of the measures to risk stratifying patients.

3. Results

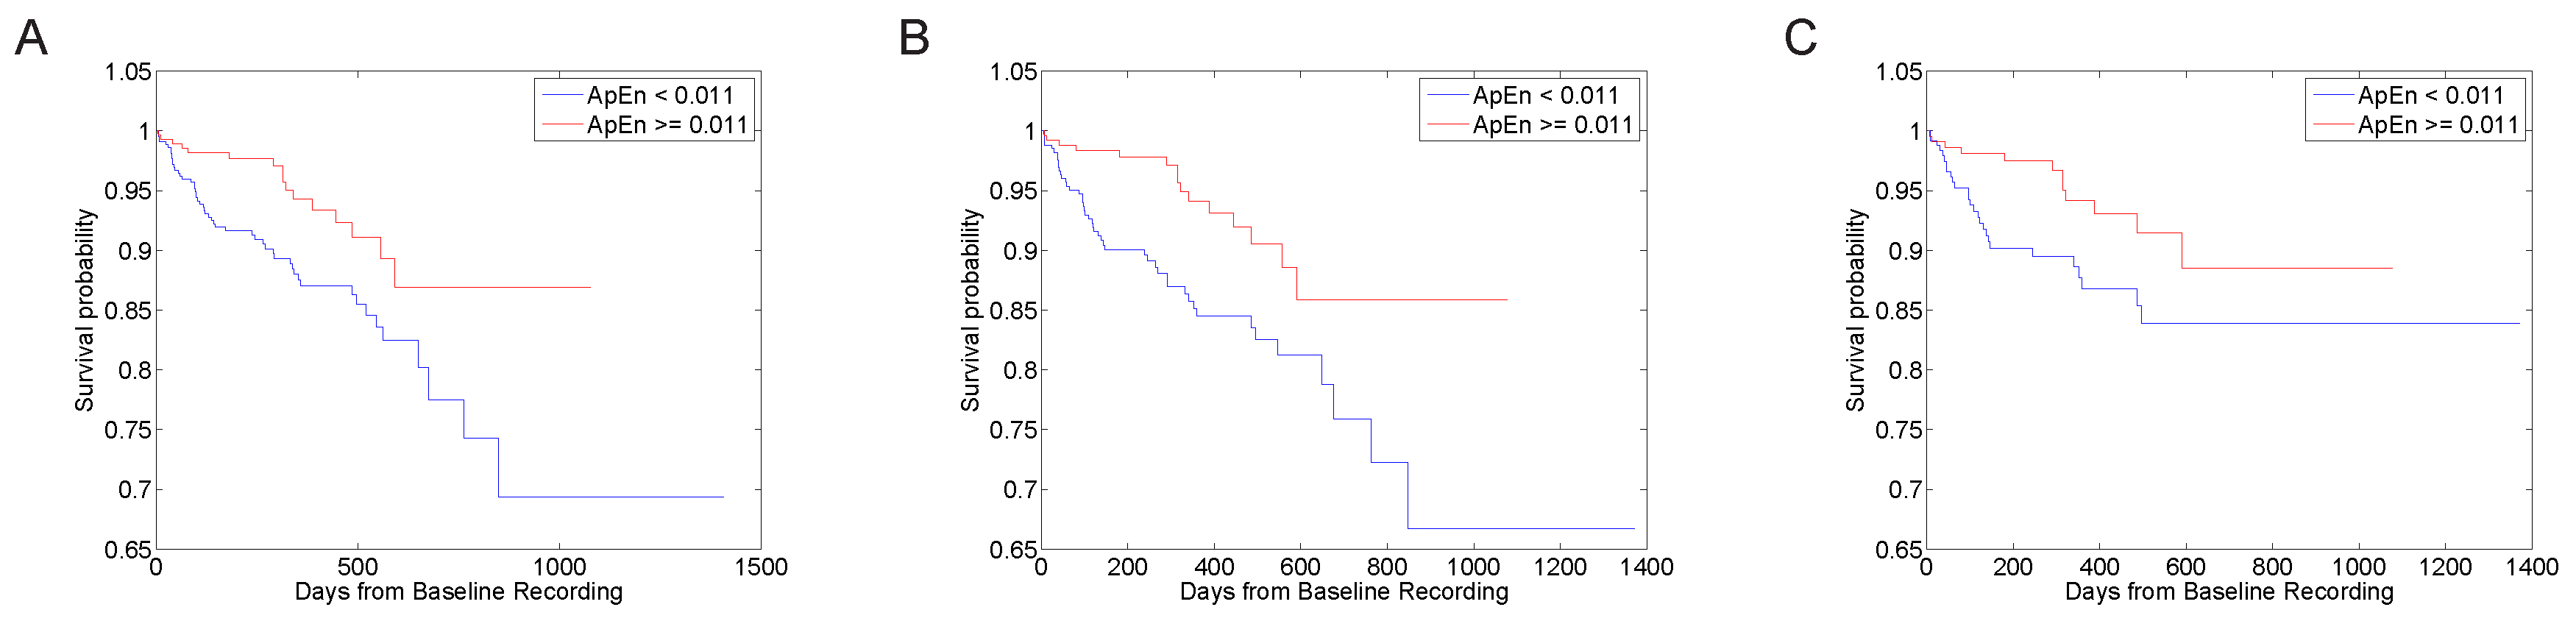
3.1. Predictive Value with Standard Parameter Sets

The results for baseline data from a univariate Cox proportional hazards regression using parameters from the literature (see Table 2) are shown in Table 3. No combination of parameter sets or entropy measures from the pre-treatment baseline provided significant hazard ratios for all patients or for subgroups, respectively. Furthermore, the transformation parameter λ of the Box–Cox transformation are stated in Table 3 to indicate the skewness of the data before transformation and to allow an interpretation of the hazard ratio by inversely transforming the data.
Results shown in Table 4 indicate that the situation is different for post-treatment data. This table is quite revealing in several ways. First, unlike in Table 3, ApEn and SampEn each had significant predictive value for all groups if r = r Chon is chosen. CApEn reached very similar results. Second, several further parameter sets are significant predictors of outcome both for all patients and for patients without CABG, especially FuzzyEn and FuzzyMEn with r = 0 . 2 · σ . Third, using a constant r does not lead to any significant risk stratification. Therefore, the use of r = 0 . 2 · σ seems especially promising for FuzzyEn and FuzzyMEn , while r = r Chon seems better suited for ApEn , CApEn , and SampEn .
In the following, sensitivity and specificity are presented exemplarily for ApEn ( r = r Chon ) for post-treatment data. ApEn < 0 . 011 had a sensitivity of 77% and a specificity of 42% for mortality for all patients ( χ 2 = 7 . 8 , p = 0 . 005 ) , a sensitivity of 76% and a specificity of 45% for mortality for patients without CABG ( χ 2 = 9 . 5 , p = 0 . 002 ) and a sensitivity of 69% and a specificity of 49% for mortality for patients without CABG and DM ( χ 2 = 5 . 2 , p = 0 . 023 ). In Figure 1, survival curves are presented separated according to risk groups.

3.2. Parameter Selection Process

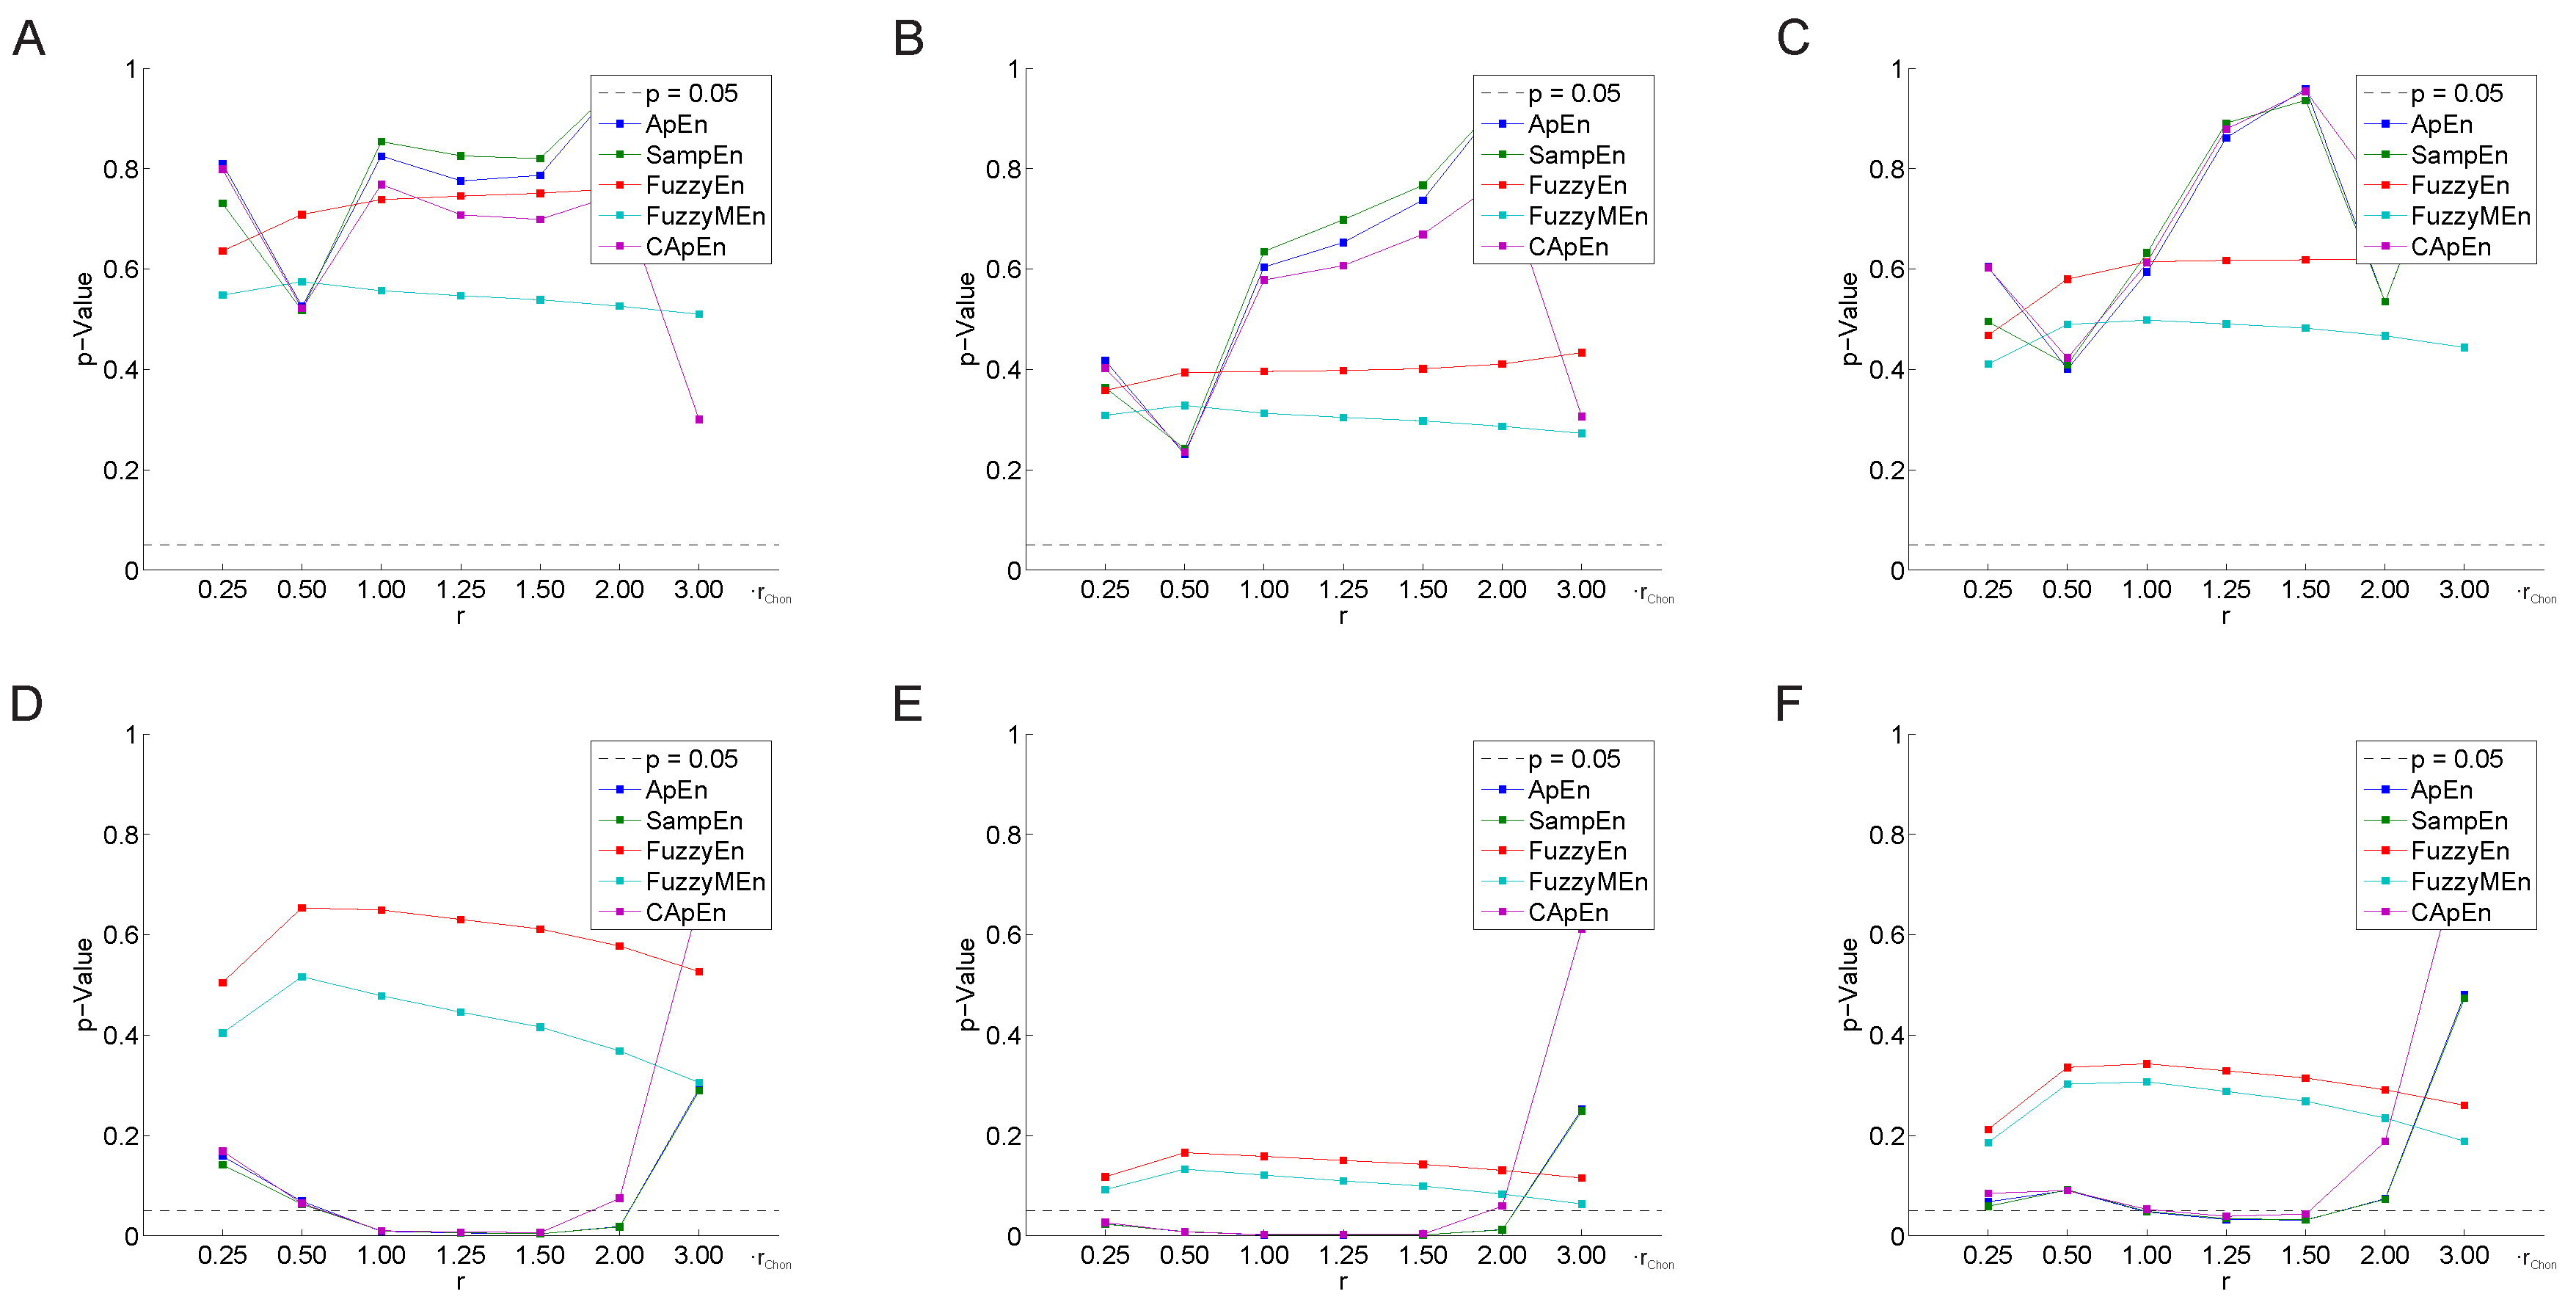
3.2.1. Variation of the Threshold Value

Variation of the threshold value r as a multiple of r Chon , i.e., an approximation of the threshold value maximizing entropy values [24], does not improve the predictive value of the studied entropy measures for baseline data, as can be seen in Figure 2A–C. The significant predictive values of ApEn and SampEn for data after treatment are confirmed for 1 . 00 , 1 . 25 and 1 . 50 times r Chon with p-values between 0 . 002 and 0 . 049 for all subgroups in Figure 2D–F. In the subgroup of patients without CABG (Figure 2E), ApEn and SampEn provided significant predictive values for all threshold values except 3 . 00 · r Chon . CApEn performed similar to ApEn and SampEn in the range of 1 . 00 · r Chon to 1 . 50 · r Chon . FuzzyEn and FuzzyMEn did not provide any significant results.
Variations of the threshold value r as a multiple of σ are displayed in Figure 3 and, for baseline data (Figure 3A–C), yielded similar results as the variation as multiple of r Chon —with one exception, where ApEn had borderline significance ( p = 0 . 056 ) for the subgroup without CABG and without diabetes mellitus (Figure 3C). In contrast to the results displayed in Figure 2, all entropy measures were statistically significantly associated with outcome for data after treatment for at least one r value for all patients and patients without CABG (Figure 3D,E). Furthermore, FuzzyEn and FuzzyMEn outperformed the other three entropy measures with constantly reaching significant results for the whole range of r for the same groups. However, in contrast to Figure 2, no entropy measure reached significance for data after treatment for patients without CABG and without diabetes mellitus (Figure 3F).
Independent variation of r L and r F as a multiple of r Chon did not improve the results for FuzzyMEn , except for the subgroup without CABG for data after treatment (Figure 4E). In this subgroup, the following duplets reached p-values in the range from 0.034 to 0.044: ( r L , r F ) { ( 1 . 50 , 0 . 25 ) , ( 2 . 00 , 0 . 25 ) , ( 3 . 00 , 0 . 25 ) , ( 3 . 00 , 0 . 50 ) , ( 3 . 00 , 1 . 00 ) , ( 3 . 00 , 1 . 25 ) · r Chon } . Furthermore, despite achieving or not achieving statistical significance, r L = 3 . 00 and r F = 0 . 25 appear to be the most suitable selections.
Independent variation of r L and r F as a multiple of σ again confirmed the results of the variation with r L = r F for all data (Figure 5). Again, significance could not be reached for the pre-treatment groups. For post-treatment data, the choice of r L and r F is not critical, since all combinations lead to significant results for all patients and the subgroup patients without CABG (Figure 5D,E).

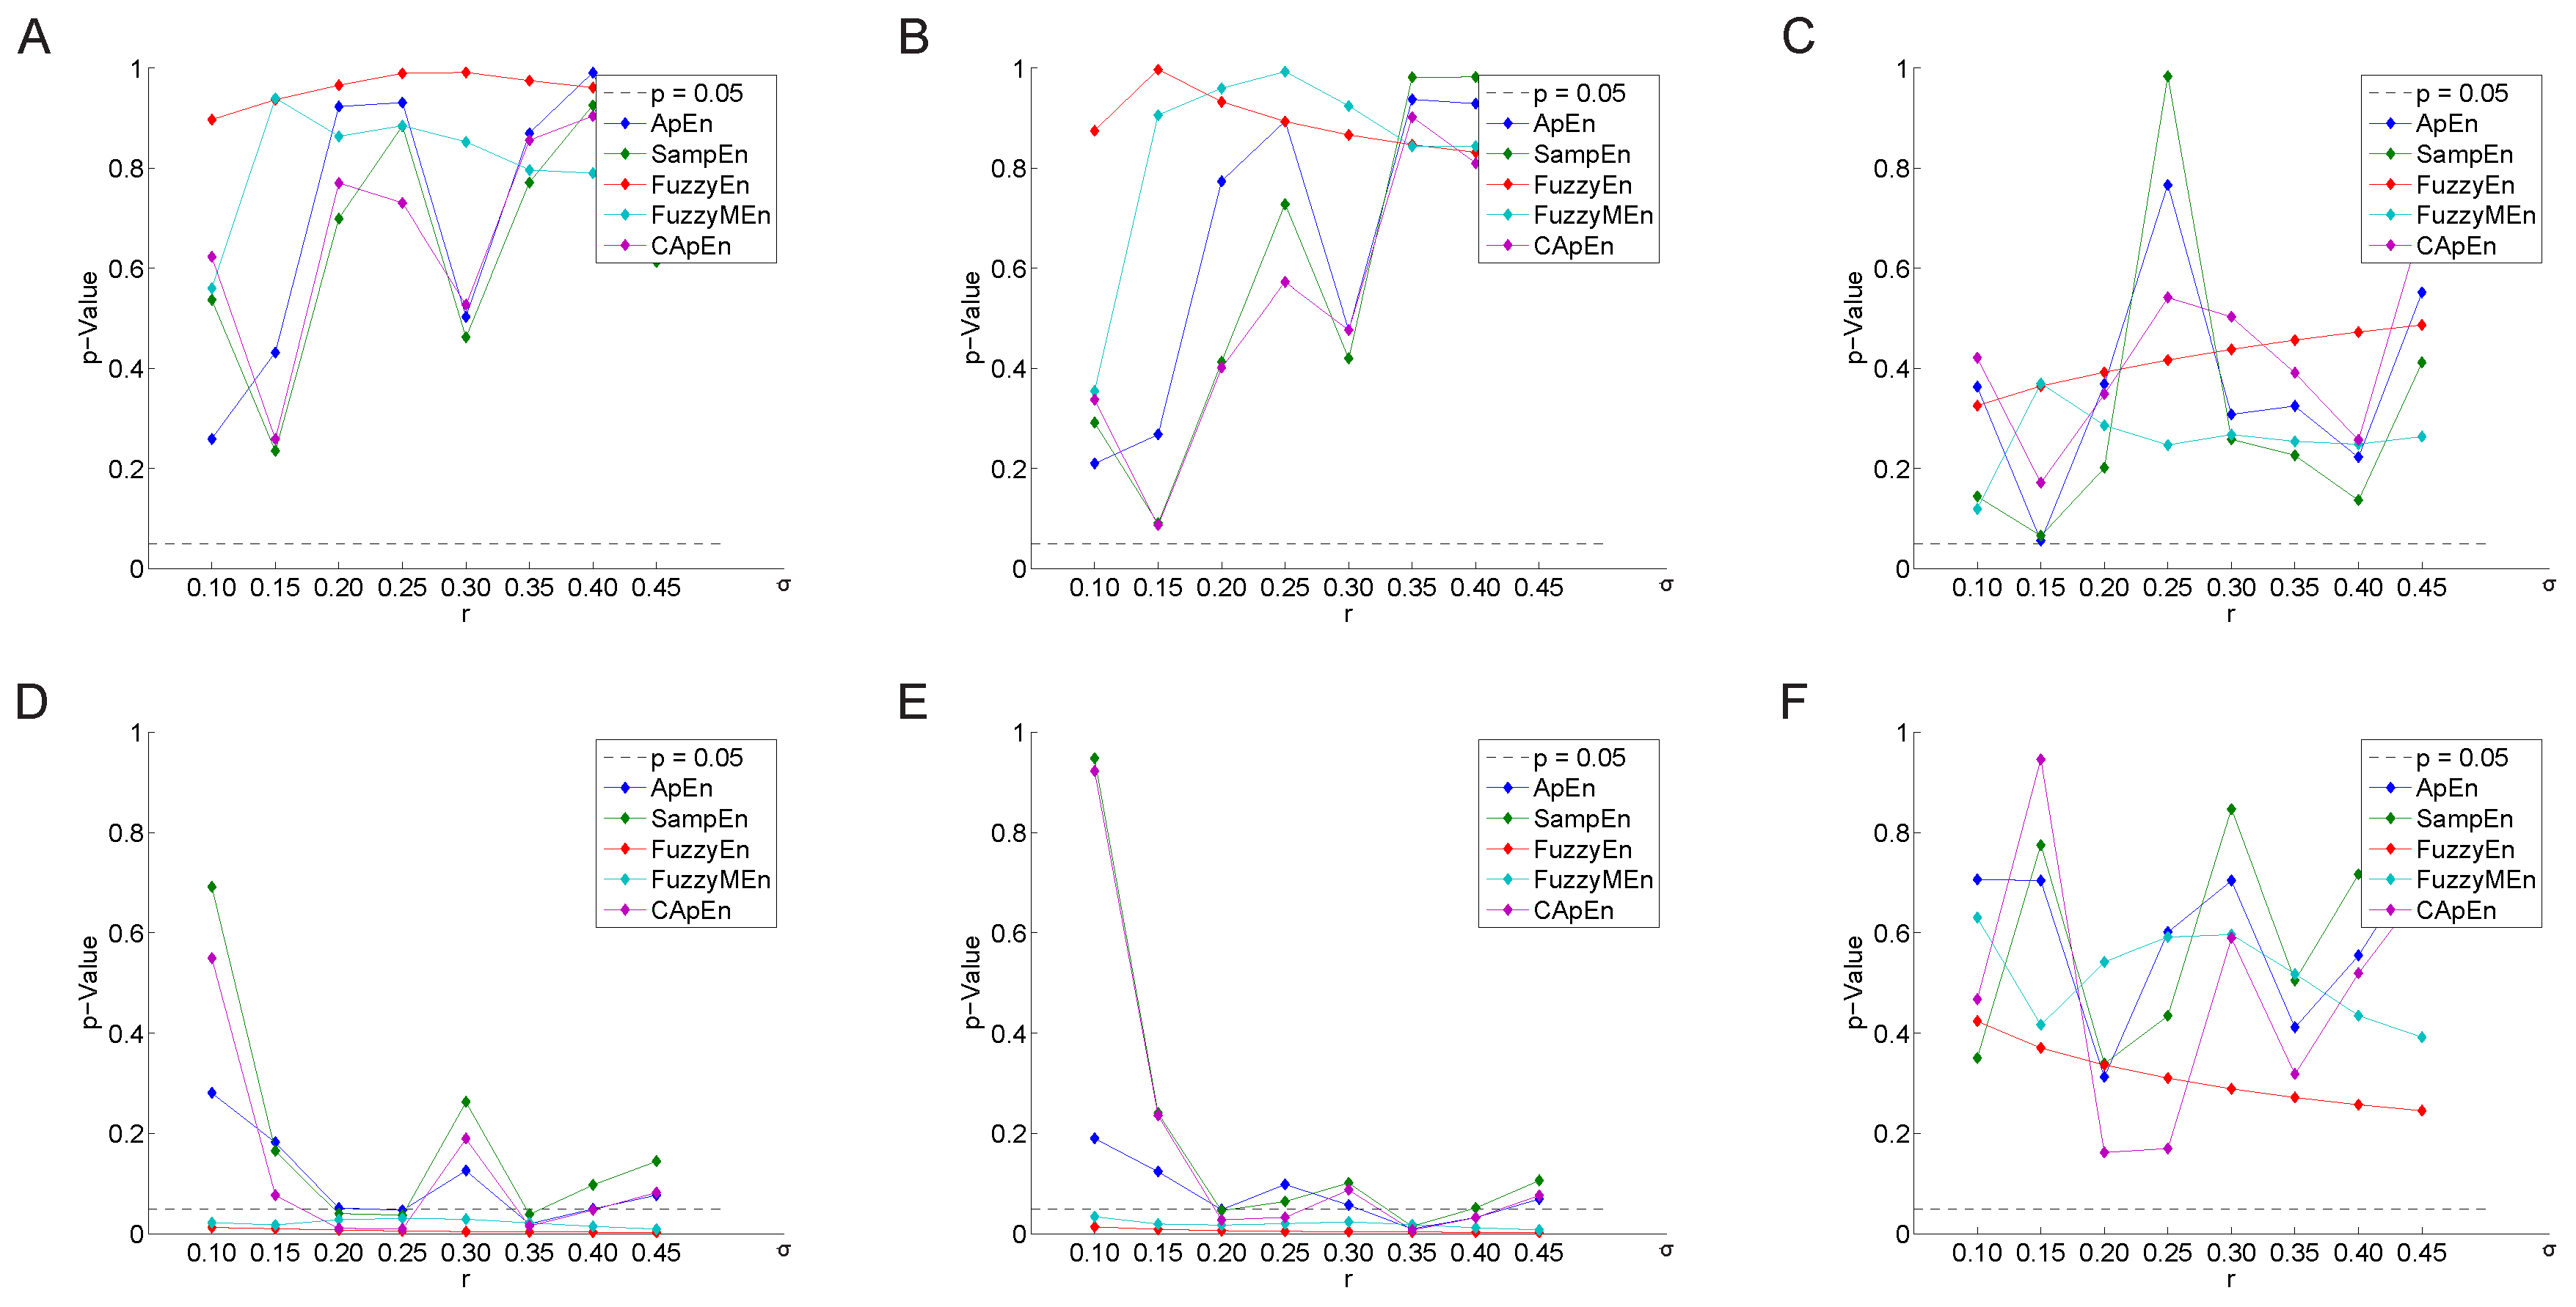
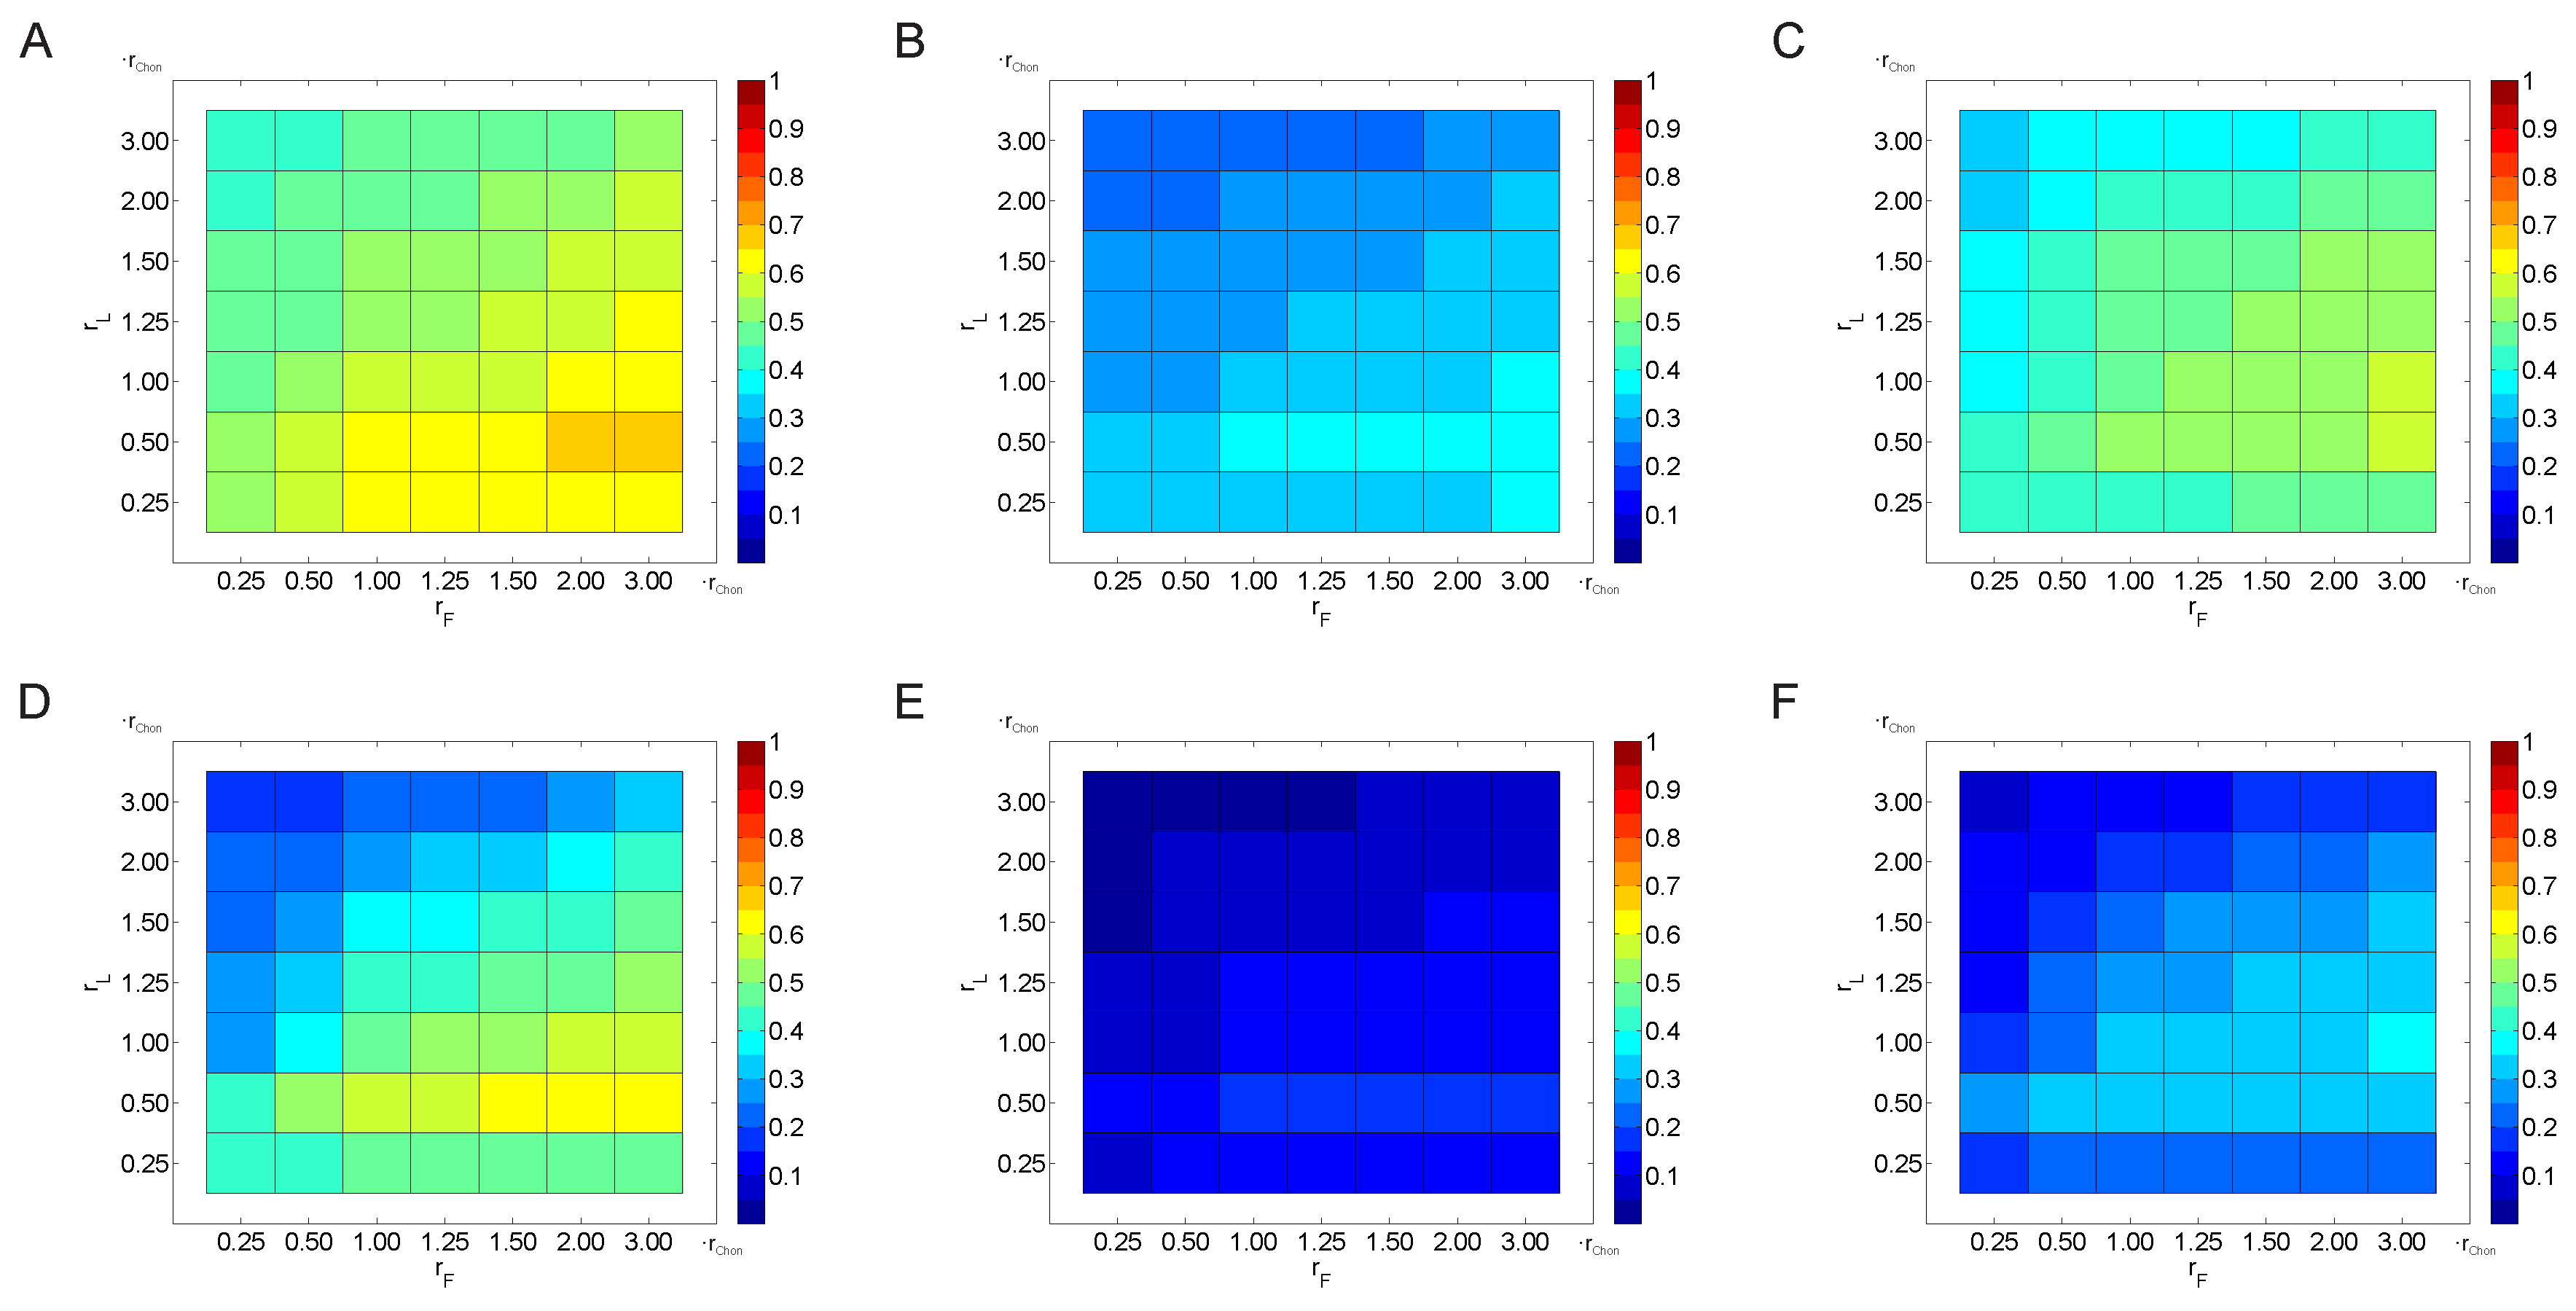
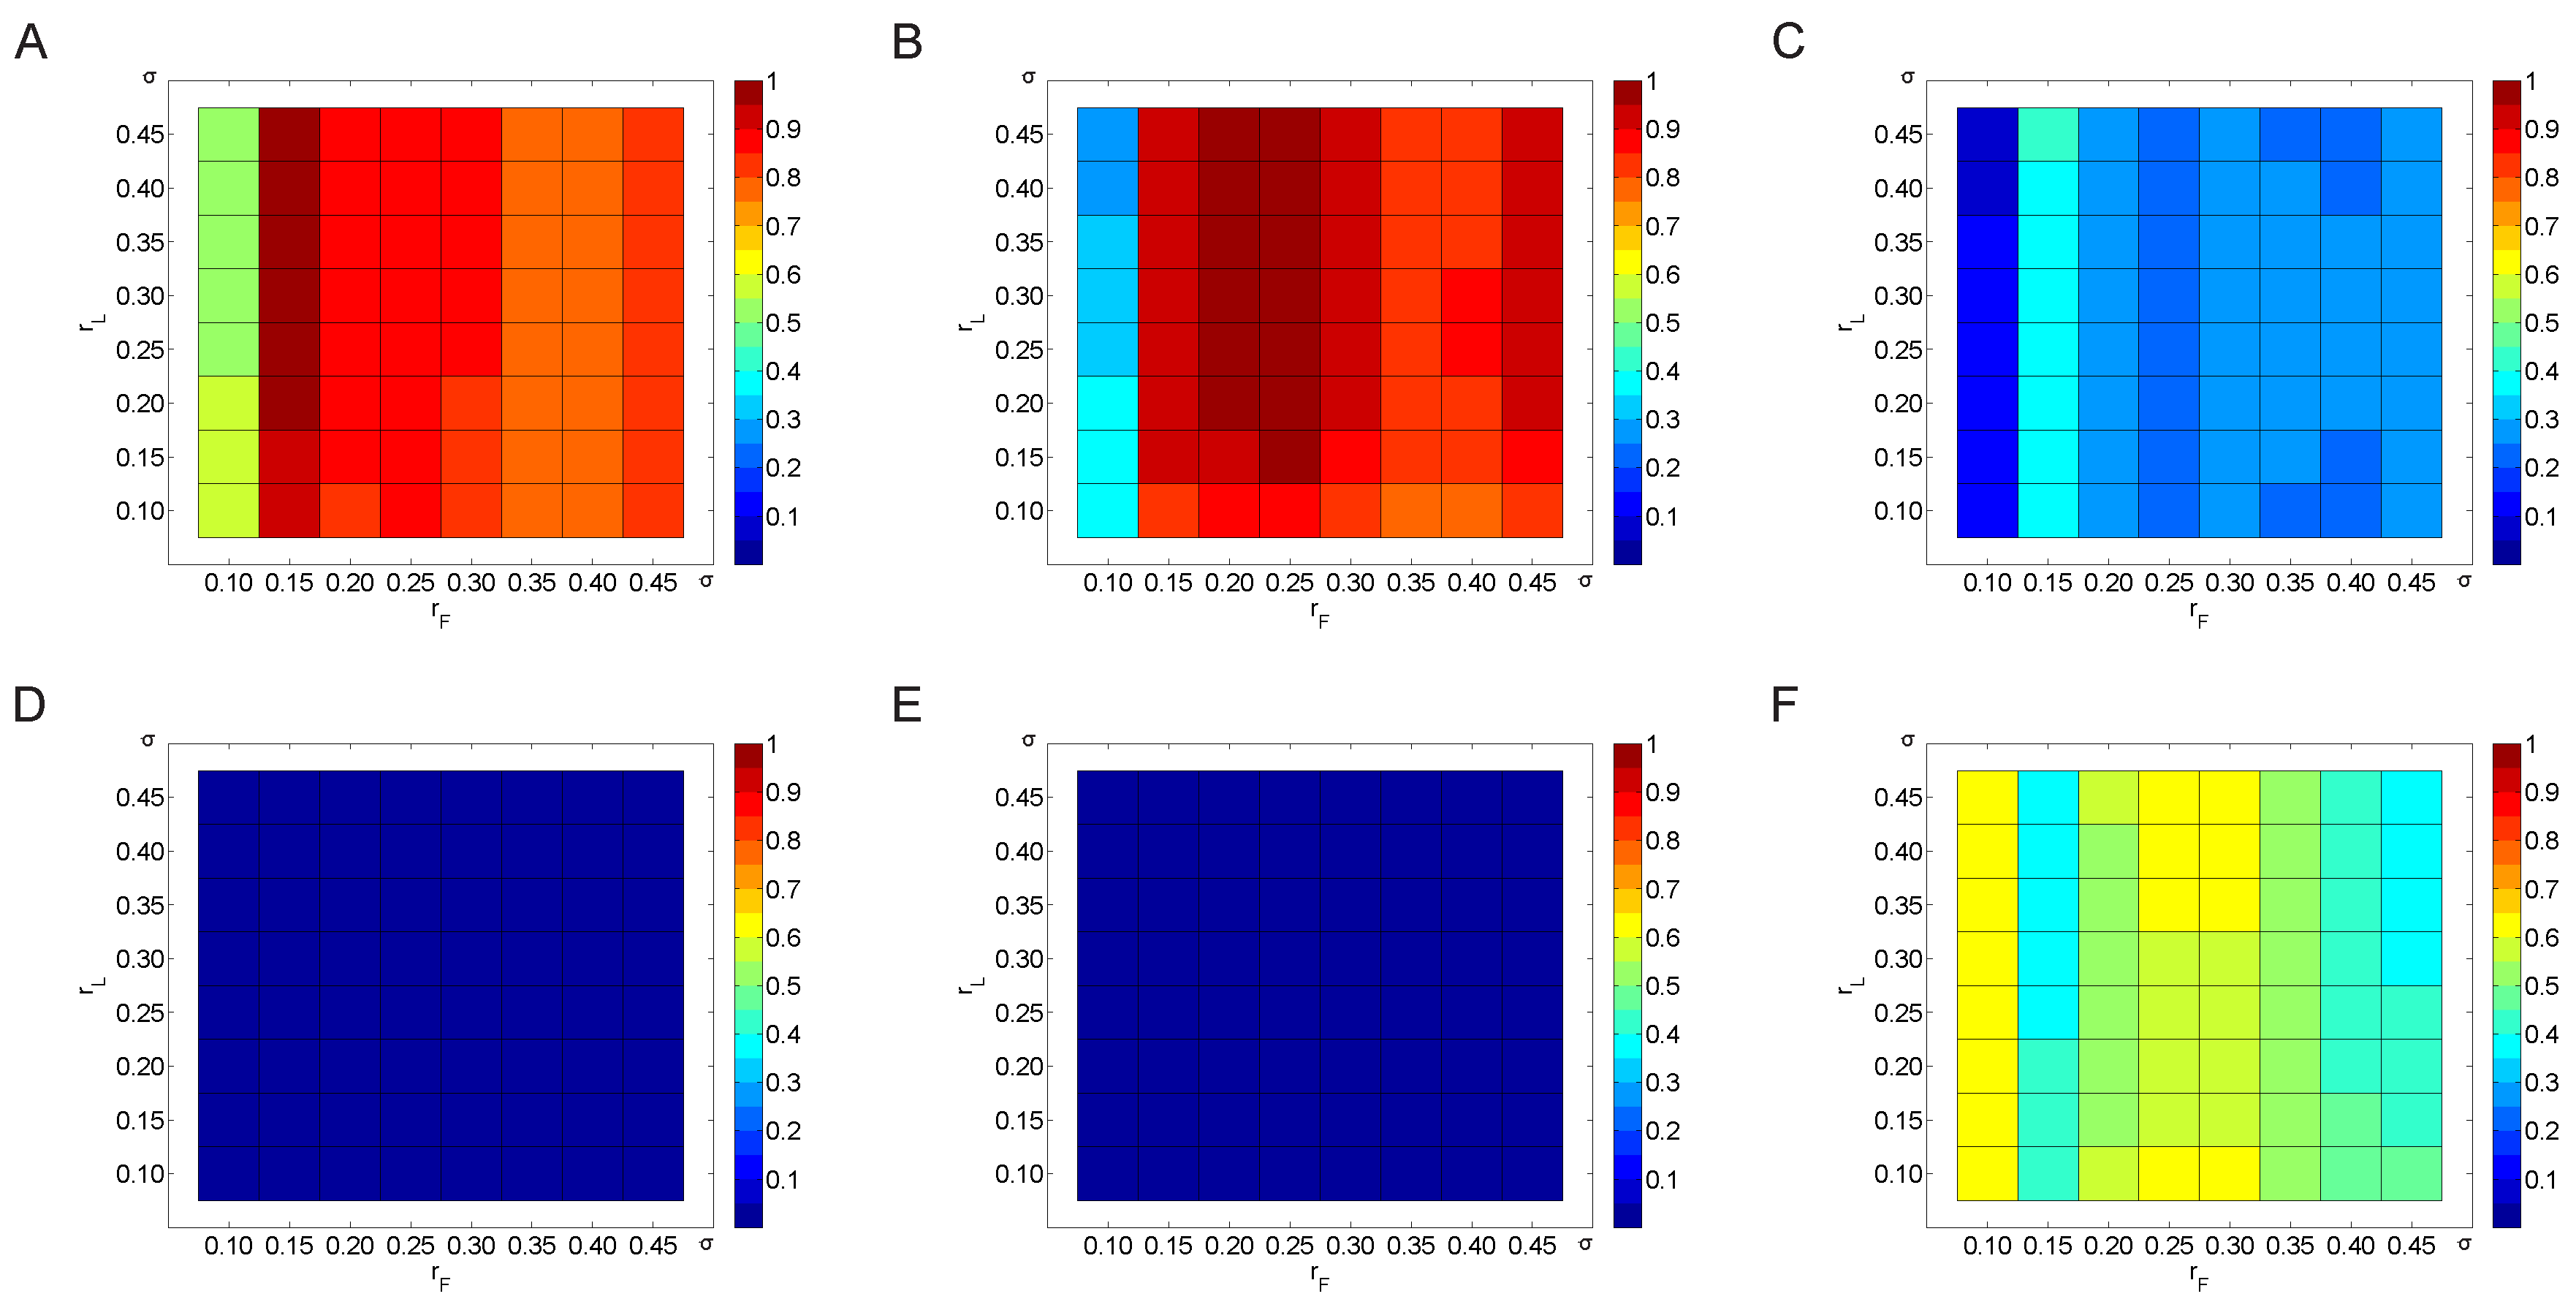
3.2.2. Variation of the Weighting Factor

Results for variation of the weighting factor(s) for FuzzyEn and FuzzyMEn are shown in the online supplement Figures S1–S4. Overall, it can be stated that the variation of the weighting factor(s) does not lead to significant changes in the results. Significance ( p < 0 . 05 ) is reached for all n = n L and n F values for all patients and patients without CABG after treatment but not for baseline data and patients without CABG and diabetes mellitus, if r = r L = r F = 0 . 2 · σ . In contrast, using r = r L = r F = r Chon and variation of the weighting factor(s) does not improve the predictive value of FuzzyEn and FuzzyMEn for almost all cases. Only FuzzyMEn achieved better results with very high n F and n L for all patients after treatment and for patients without CABG after treatment, when r = r L = r F = r Chon is used. However, for the same subgroups, r = r L = r F = 0 . 2 · σ led to better results with any n F and n L anyway.

4. Discussion

An interesting finding was that the predictive value of the entropy measures is different for data at baseline and data after treatment. This holds true for parameter sets from the literature and all of the different parameter variations, as well as for the threshold parameter r as a multiple of the standard deviation σ or as a multiple of r Chon . Analysis of baseline data did not lead to significant results for any of the subgroups or any of the parameter combinations. In contrast, entropy measures applied to the after treatment data proved to have significant predictive value, especially for all patients and patients without CABG. This finding was unexpected but can probably be explained by the fact that the encainide/flecainide phase of the Cardiac Arrhythmia Suppression Trial (CAST) was stopped early because of excess mortality and the moricizine arm of the trial, which was not stopped early, had no effect on mortality [36,37]. Thus, these measures likely reflect the overall negative effect of treatment on outcomes in the trial. Another possible explanation could be the fact that the subjects for the trial were initially selected as being at elevated risk of mortality based on frequent ventricular premature contractions (VPCs).
Another important finding was that different approaches for choosing the threshold parameter r yield different results. In the literature, there are three common ways of choosing the threshold value r. The first approach uses constant r values, e.g., r { 0 . 10 , 0 . 15 } for SampEn and m = 2 or m = 3 , or r { 0 . 10 , 0 . 15 , 0 . 20 , 0 . 25 } for FuzzyEn and m = 1 or m = 2 [18]. Choosing such a constant value was questioned, especially for fast dynamic series in [38] and [27]. An approach to overcoming these shortcomings is to choose r as a multiple of the standard deviation σ of the time series as suggested by Pincus, i.e., r [ 0 . 1 · σ , 0 . 25 · σ ] [12]. A threshold value of r = 0 . 2 · σ is most commonly reported in the literature [13,15,17,38,39,40]. Another approach for choosing r is to maximize entropy values. A replacement for the computationally expensive maximization is an approximation r Chon suggested by Chon et al. [24]. The formula was derived from non-physiologic data and it was shown in [39] that it does not outperform a constant r. The authors cited in [15,17] suggested choosing r L = r F for FuzzyMEn .
In our study, we determined that a constant choice and parameter sets suggested by Zhao et al. [18] without additional parameter variation did not result in significant predictive values. Thus, we were unable to demonstrate that r Chon does not outperform a constant value as shown in [39]. The results presented in Figure 2 and Figure 3 do not support superiority of the choice of the threshold parameter as a multiple of the standard deviation σ or as a multiple of r Chon . For after treatment data, one can see a tendency to the former approach, since all five entropy measures show good to acceptable performance, but the latter seems to be appropriate as well, especially for ApEn , CApEn , and SampEn . In general, one can see that the entropy measures behave more stably with respect to changing magnitudes of r Chon compared to the approach depending on the standard deviation, which shows more unstable behavior especially for ApEn , CApEn , and SampEn . The results of this study are consistent with other research which suggest setting r L = r F for FuzzyEn [15,17].
Varying the threshold parameter r showed that, in general, ApEn , CApEn , and SampEn are more sensitive to changes in r than FuzzyEn and FuzzyMEn . This phenomenon can be found for both choices of r, in all subgroups, at baseline and after treatment (Figure 2 and Figure 3). These findings are in line with those of previous studies and reflect the idea of using a fuzzy membership function instead of the Heaviside function to overcome the sensitivity of ApEn , CApEn , and SampEn with respect to the threshold parameter [14].
The choice of the weighting factors for FuzzyEn and FuzzyMEn has been less investigated and reported in the literature. Chen et al. [14] used n = 2 and r = 0 . 2 · σ for test signals, whereas it is described that for a larger n, closer data points are weighted more strongly. Liu et al. [15] used the weighting factors n L = 3 , n F = 2 and r L = r F = 0 . 2 · σ for heart rate variability analysis. Their choices for n L and n F were given without any motivation. Our previous findings in [17] had suggested the choice of n = n L = 2 and n F = 1 for r Chon according to [24] or n = n L = 1 and n F = 3 for r = 0 . 2 · σ .
In the current study, as stated in Section 3.2.2, the variation of the weighting factors does not lead to significant changes in the results. Thus, it can be assumed that the choice of the weighting factors is less critical than the choice of the threshold parameter in this population. These results and the variation of r support previous research and are in line with the choices of n as suggested in [17]. Nevertheless, this aspect of parameter selection needs to be investigated in more detail in future research.
One unanticipated finding was that the predictive power of the entropy measures could not be shown for the smallest subgroup, i.e., patients without coronary artery bypass grafting and without diabetes mellitus, for data after treatment, even when apparent in the two other groups. This result has not previously been described and reported. Stein et al. reported that an inclusion of patients with diabetes mellitus or CABG decreases predictive power of traditional heart rate variability after myocardial infarction [34]. A possible explanation for this might be, as both of these groups tend to have lower HRV, that entropy measures capture a feature in patients with low HRV that is not captured by traditional HRV measures. Alternatively, since the primary difference between the smallest subgroup and the others is the absence of diabetes, a relation between diabetes and entropy affecting mortality might be suspected. Nevertheless, this fact needs further attention.
Another interesting finding was that none of the tested entropy measures, regardless of the used parameter sets, were able for predicting mortality for baseline data. This is especially surprising as several traditional HRV measures proved to be reliable predictors in the same dataset in previous studies [6,7,34]. Compared to the time domain HRV parameters reported by Stein et al. [7] (see Table 5), one can see for some entropy measures and parameter combinations trends similar to SDNN and Ln SDANN for baseline data (Figure 3 A,B,C) when varying r as a multiple of σ, i.e., no significance for all data (A), approaching the significance level for patients w/o CABG (B) and (borderline) significance for all patients w/o CABG and DM (C). The other time-domain parameters did not predict mortality for baseline data in uni-variate analysis as well [7]. On the contrary, all of the entropy measures under investigation proved to be able to predict mortality after treatment. It therefore can be assumed that these complexity measures detect adverse effects of the treatments used in the CAST. Sensitivity and specificity were in a similar range as reported for frequency-domain parameters by Stein et al. [34].
Finally, a number of important limitations of this study need to be considered. First, this study is limited to a relatively small part of the entire 24 h recordings, which was necessary to decrease computation time. Second, the template length was fixed to m = 2 for all calculations, as the number of possible parameter combinations would increase dramatically otherwise. According to the literature, m = 2 seems to be a reasonable choice. Furthermore, parameters were iterated consecutively and not simultaneously to reduce the dimension of the parameter space. In addition, the study did not evaluate the dependency of the entropy measures on age and gender as reported in literature [41,42]. Finally, one has to keep in mind that the Cardiac Arrhythmia Suppression Trial tested three antiarrhythmic drugs which led to adverse effects in some patients. Therefore, the results for data after treatment of this study cannot be generalized to patients with different or without treatment.

5. Conclusions

This study aimed to assess the effect of parameter selection on the predictive value of entropy measures using outcome data. Previously, similar heart rate variability-based studies performed parameter selection on cross-sectional data and attempted to allow for differentiating between pathological and non-pathological data. The results of this study help to understand the influence of the parameters on the predictive value of entropy measures. Nevertheless, more research is needed to better understand the underlying principles and to overcome the limitations of this study.

Supplementary Materials

The following are available online at www.mdpi.com/1099-4300/18/4/129/s1. Figure S1: Significance of predictive values of entropy measures for different choices of n ( n = n L [ 1 . 0 , 5 . 0 ] , n F = 1 ); parameters: m = 2 , N = 1200 , r = r L = r F = r Chon ; HRV data at baseline (A,B,C) and after treatment (D,E,F); for all patients (A,D), for all patients w/o CABG (B,E) and w/o CABG and DM (C,F). Figure S2: Significance of predictive values of entropy measures for different choices of n ( n = n L [ 1 . 0 , 5 . 0 ] , n F = 1 ); parameters: m = 2 , N = 1200 , r = r L = r F = 0 . 2 · σ ; HRV data at baseline (A,B,C) and after treatment (D,E,F); for all patients (A,D), for all patients w/o CABG (B,E) and w/o CABG and DM (C,F). Figure S3: Significance of predictive values of FuzzyMEn for different choices of n L and n F ( n L , n F [ 1 . 0 , 5 . 0 ] ); parameters: m = 2 , N = 1200 , r = r L = r F = r Chon ; HRV data at baseline (A,B,C) and after treatment (D,E,F); for all patients (A,D), for all patients w/o CABG (B,E) and w/o CABG and DM (C,F). Figure S4: Significance of predictive values of FuzzyMEn for different choices of n L and n F ( n L , n F [ 1 . 0 , 5 . 0 ] ); parameters: m = 2 , N = 1200 , r = r L = r F = 0 . 2 · σ ; HRV data at baseline (A,B,C) and after treatment (D,E,F); for all patients (A,D), for all patients w/o CABG (B,E) and w/o CABG and DM (C,F).

Author Contributions

Christopher Mayer participated in the design and coordination of the study, the interpretation of the results and drafted the manuscript. Martin Bachler carried out the calculations and interpretation of the results and participated in drafting the manuscript. Andreas Holzinger helped to draft the manuscript. Phyllis K. Stein provided the outcome data and participated in drafting the manuscript. Siegfried Wassertheurer participated in the design of the study and drafting the manuscript. All authors read and approved the final manuscript.

Conflicts of Interest

The authors declare no conflicts of interest.

References

  1. Hon, E.H.; Lee, S. The fetal electrocardiogram. Am. J. Obstet. Gynecol. 1963, 87, 804–813. [Google Scholar] [CrossRef]
  2. Huikuri, H.V.; Stein, P.K. Heart Rate Variability in Risk Stratification of Cardiac Patients. Progr. Cardiovasc. Dis. 2013, 56, 153–159. [Google Scholar] [CrossRef] [PubMed]
  3. Rajendra Acharya, U.; Paul Joseph, K.; Kannathal, N.; Lim, C.M.; Suri, J.S. Heart rate variability: A review. Med. Biol. Eng. Comput. 2006, 44, 1031–1051. [Google Scholar] [CrossRef] [PubMed]
  4. American Heart Association Inc.; European Society of Cardiology. Guidelines—Heart rate variability. Eur. Heart J. 1996, 17, 354–381. [Google Scholar]
  5. Sassi, R.; Cerutti, S.; Lombardi, F.; Malik, M.; Huikuri, H.V.; Peng, C.K.; Schmidt, G.; Yamamoto, Y.; Gorenek, B.; Lip, G.H.; et al. Advances in Heart Rate Variability Signal Analysis: Joint Position Statement by the E-Cardiology ESC Working Group and the European Heart Rhythm Association Co-Endorsed by the Asia Pacific Heart Rhythm Society. Europace 2015. [Google Scholar] [CrossRef] [PubMed]
  6. Stein, P.K.; Domitrovich, P.P.; Huikuri, H.V.; Kleiger, R.E.; Investigators, C. Traditional and Nonlinear Heart Rate Variability Are Each Independently Associated with Mortality after Myocardial Infarction. J. Cardiovasc. Electrophysiol. 2005, 16, 13–20. [Google Scholar] [CrossRef] [PubMed]
  7. Stein, P.K.; Kleiger, R.E.; Domitrovich, P.P.; Schechtman, K.B.; Rottman, J.N. Clinical and demographic determinants of heart rate variability in patients post myocardial infarction: Insights from the cardiac arrhythmia suppression trial (CAST). Clin. Cardiol. 2000, 23, 187–194. [Google Scholar] [CrossRef] [PubMed]
  8. Jordan, M.I.; Mitchell, T.M. Machine learning: Trends, perspectives, and prospects. Science 2015, 349, 255–260. [Google Scholar] [CrossRef] [PubMed]
  9. Holzinger, A.; Hörtenhuber, M.; Mayer, C.; Bachler, M.; Wassertheurer, S.; Pinho, A.J.; Koslicki, D. On Entropy-Based Data Mining. In Interactive Knowledge Discovery and Data Mining in Biomedical Informatics; Holzinger, A., Jurisica, I., Eds.; Springer: Berlin/Heidelberg, Germany, 2014; Volume 8401, pp. 209–226. [Google Scholar]
  10. Pincus, S. Assessing serial irregularity and its implications for health. Ann. N. Y. Acad. Sci. 2001, 954, 245–267. [Google Scholar] [CrossRef] [PubMed]
  11. Hornero, R.; Aboy, M.; Abasolo, D.; McNames, J.; Goldstein, B. Interpretation of approximate entropy: Analysis of intracranial pressure approximate entropy during acute intracranial hypertension. IEEE Trans. Biomed. Eng. 2005, 52, 1671–1680. [Google Scholar] [CrossRef] [PubMed]
  12. Pincus, S.M. Approximate entropy as a measure of system complexity. Proc. Natl. Acad. Sci. USA 1991, 88, 2297–2301. [Google Scholar] [CrossRef] [PubMed]
  13. Richman, J.S.; Moorman, J.R. Physiological time-series analysis using approximate entropy and sample entropy. Am. J. Physiol. Heart Circ. Physiol. 2000, 278, H2039–H2049. [Google Scholar] [PubMed]
  14. Chen, W.; Zhuang, J.; Yu, W.; Wang, Z. Measuring complexity using FuzzyEn, ApEn, and SampEn. Med. Eng. Phys. 2009, 31, 61–68. [Google Scholar] [CrossRef] [PubMed]
  15. Liu, C.; Li, K.; Zhao, L.; Liu, F.; Zheng, D.; Liu, C.; Liu, S. Analysis of heart rate variability using fuzzy measure entropy. Comput. Biol. Med. 2013, 43, 100–108. [Google Scholar] [CrossRef] [PubMed]
  16. Porta, A.; Gnecchi-Ruscone, T.; Tobaldini, E.; Guzzetti, S.; Furlan, R.; Montano, N. Progressive decrease of heart period variability entropy-based complexity during graded head-up tilt. J. Appl. Physiol. 2007, 103, 1143–1149. [Google Scholar] [CrossRef] [PubMed]
  17. Mayer, C.; Bachler, M.; Hörtenhuber, M.; Stocker, C.; Holzinger, A.; Wassertheurer, S. Selection of entropy-measure parameters for knowledge discovery in heart rate variability data. BMC Bioinform. 2014, 15. [Google Scholar] [CrossRef] [PubMed]
  18. Zhao, L.; Wei, S.; Zhang, C.; Zhang, Y.; Jiang, X.; Liu, F.; Liu, C. Determination of Sample Entropy and Fuzzy Measure Entropy Parameters for Distinguishing Congestive Heart Failure from Normal Sinus Rhythm Subjects. Entropy 2015, 17, 6270–6288. [Google Scholar] [CrossRef]
  19. Bachler, M.; Hörtenhuber, M.; Mayer, C.; Holzinger, A.; Wassertheurer, S. Entropy-Based Data Mining on the Example of Cardiac Arrhythmia Suppression. In Brain Informatics and Health; Ślȩzak, D., Tan, A.-H., Peters, J., Schwabe, L., Eds.; Springer International Publishing: Berlin/Heidelberg, Germany, 2014; Volume 8609, pp. 574–585. [Google Scholar]
  20. Goldberger, A.L.; Amaral, L.A.; Glass, L.; Hausdorff, J.M.; Ivanov, P.C.; Mark, R.G.; Mietus, J.E.; Moody, G.B.; Peng, C.K.; Stanley, H.E. PhysioBank, PhysioToolkit, and PhysioNet: Components of a new research resource for complex physiologic signals. Circulation 2000, 101, E215–E220. [Google Scholar] [CrossRef] [PubMed]
  21. The Cardiac Arrhythmia Suppression Trial (CAST) Investigators. Preliminary report: Effect of encainide and flecainide on mortality in a randomized trial of arrhythmia suppression after myocardial infarction. N. Engl. J. Med. 1989, 321, 406–412. [Google Scholar]
  22. Epstein, A.E.; Bigger, J.T.; Wyse, D.G.; Romhilt, D.W.; Reynolds-Haertle, R.A.; Hallstrom, A.P. Events in the Cardiac Arrhythmia Suppression Trial (CAST): Mortality in the entire population enrolled. J. Am. Coll. Cardiol. 1991, 18, 14–19. [Google Scholar] [CrossRef]
  23. Silva, I.; Moody, G. An open-source toolbox for analysing and processing physionet databases in matlab and octave. J. Open Res. Softw. 2014, 2. [Google Scholar] [CrossRef] [PubMed]
  24. Chon, K.; Scully, C.G.; Lu, S. Approximate entropy for all signals. IEEE Eng. Med. Biol. Mag. 2009, 28, 18–23. [Google Scholar] [CrossRef] [PubMed]
  25. Pincus, S.M.; Goldberger, A.L. Physiological time-series analysis: what does regularity quantify? Am. J. Physiol. 1994, 266, H1643–H1656. [Google Scholar] [PubMed]
  26. Yentes, J.M.; Hunt, N.; Schmid, K.; Kaipust, J.; McGrath, D.; Stergiou, N. The Appropriate Use of Approximate Entropy and Sample Entropy with Short Data Sets. Ann. Biomed. Eng. 2013, 41, 349–365. [Google Scholar] [CrossRef] [PubMed]
  27. Alcaraz, R.; Abásolo, D.; Hornero, R.; Rieta, J.J. Optimal parameters study for sample entropy-based atrial fibrillation organization analysis. Comput. Methods Progr. Biomed. 2010, 99, 124–132. [Google Scholar] [CrossRef] [PubMed] [Green Version]
  28. Aktaruzzaman, M.; Sassi, R. Parametric estimation of sample entropy in heart rate variability analysis. Biomed. Signal Process. Control 2014, 14, 141–147. [Google Scholar] [CrossRef]
  29. Cox, D.R.; Oakes, D. Analysis of Survival Data; CRC Press: Boca Raton, FL, USA, 1984; Volume 21. [Google Scholar]
  30. Altman, D.G. Practical Statistics for Medical Research; CRC Press: Boca Raton, FL, USA, 1990. [Google Scholar]
  31. Box, G.E.P.; Cox, D.R. An Analysis of Transformations. J. R. Stat. Soc. Series B Methodol. 1964, 26, 211–252. [Google Scholar]
  32. Sakia, R. The Box–Cox transformation technique: A review. The Statistician 1992, 41, 169–178. [Google Scholar] [CrossRef]
  33. Mantel, N. Evaluation of survival data and two new rank order statistics arising in its consideration. Cancer Chemother. Rep. Part 1 1966, 50, 163–170. [Google Scholar]
  34. Stein, P.K.; Domitrovich, P.P.; Kleiger, R.E. Including patients with diabetes mellitus or coronary artery bypass grafting decreases the association between heart rate variability and mortality after myocardial infarction. Am. Heart J. 2004, 147, 309–316. [Google Scholar] [CrossRef]
  35. Altman, D.G.; Machin, D.; Bryant, T.N.; Gardner, M.J.; Gardner, S.; Bird, S.; Campbell, M.; Daly, L.E.; Morris, J. Statistics with Confidence: Confidence Intervals and Statistical Guidelines; BMJ Books: London, UK, 2000. [Google Scholar]
  36. Echt, D.S.; Liebson, P.R.; Mitchell, L.B.; Peters, R.W.; Obias-Manno, D.; Barker, A.H.; Arensberg, D.; Baker, A.; Friedman, L.; Greene, H.L.; et al. Mortality and morbidity in patients receiving encainide, flecainide, or placebo: The Cardiac Arrhythmia Suppression Trial. N. Engl. J. Med. 1991, 324, 781–788. [Google Scholar] [CrossRef] [PubMed]
  37. The Cardiac Arrhythmia Suppression Trial II Investigators. Effect of the antiarrhythmic agent moricizine on survival after myocardial infarction. N. Engl. J. Med. 1992, 327, 227–233. [Google Scholar]
  38. Lu, S.; Chen, X.; Kanters, J.K.; Solomon, I.C.; Chon, K.H. Automatic selection of the threshold value r for approximate entropy. IEEE Trans. Biomed. Eng. 2008, 55, 1966–1972. [Google Scholar] [PubMed]
  39. Liu, C.; Liu, C.; Shao, P.; Li, L.; Sun, X.; Wang, X.; Liu, F. Comparison of different threshold values r for approximate entropy: Application to investigate the heart rate variability between heart failure and healthy control groups. Physiol. Meas. 2011, 32, 167–180. [Google Scholar] [CrossRef] [PubMed]
  40. Castiglioni, P.; Di Rienzo, M. How the threshold “r” influences approximate entropy analysis of heart-rate variability. In Proceedings of Computers in Cardiology, Bologna, Italy, 14–17 September 2008; pp. 561–564.
  41. Beckers, F.; Verheyden, B.; Aubert, A.E. Aging and nonlinear heart rate control in a healthy population. Am. J. Physiol.-Heart Circulatory Physiol. 2006, 290, H2560–H2570. [Google Scholar] [CrossRef] [PubMed]
  42. Ryan, S.M.; Goldberger, A.L.; Pincus, S.M.; Mietus, J.; Lipsitz, L.A. Gender- and age-related differences in heart rate dynamics: Are women more complex than men? J. Am. Coll. Cardiol. 1994, 24, 1700–1707. [Google Scholar] [CrossRef]
Figure 1. Kaplan–Meier survival curves according to risk groups based on ApEn for post-treatment data (see parameter set No. 1 in Table 2); for all patients (A), for all patients w/o CABG (B) and w/o CABG and DM (C).
Entropy 18 00129 g001
Figure 2. Significance of predictive values of entropy measures for different choices of r (multiples of r Chon ); parameters: m = 2 , N = 1200 , n = n L = 2 , n F = 1 ; HRV data at baseline (A,B,C) and after treatment (D,E,F); for all patients (A,D), for all patients w/o CABG (B,E) and w/o CABG and DM (C,F). p = 0.05 marks the threshold of statistical significance.
Entropy 18 00129 g002
Figure 3. Significance of predictive values of entropy measures for different choices of r (multiples of σ); parameters: m = 2 , N = 1200 , n = n L = 1 , n F = 3 ; HRV data at baseline (A,B,C) and after treatment (D,E,F); for all patients (A,D), for all patients w/o CABG (B,E) and w/o CABG and DM (C,F). p = 0.05 marks the threshold of statistical significance.
Entropy 18 00129 g003
Figure 4. Significance of predictive values of FuzzyMEn for different choices of r L and r F (multiples of r Chon ); parameters: m = 2 , N = 1200 , n = n L = 2 , n F = 1 ; HRV data at baseline (A,B,C) and after treatment (D,E,F); for all patients (A,D), for all patients w/o CABG (B,E) and w/o CABG and DM (C,F).
Entropy 18 00129 g004
Figure 5. Significance of predictive values of FuzzyMEn for different choices of r L and r F (multiples of σ); parameters: m = 2 , N = 1200 , n = n L = 1 , n F = 3 ; HRV data at baseline (A,B,C) and after treatment (D,E,F); for all patients (A,D), for all patients w/o CABG (B,E) and w/o CABG and DM (C,F).
Entropy 18 00129 g005
Table 1. Patient baseline data and number of records before and after treatment (data are stated as mean ± SD or median and 95 % confidence interval (CI)).
Before TreatmentAfter Treatment
Sample size760740
Age (years) 60 . 8 ± 9 . 6 60 . 7 ± 9 . 6
Sex (m/f) 624 / 136 607 / 133
Time after MI (days) 38 ( 35 -- 42 ) 72 ( 68 -- 76 )
CABG141137
DM160155
CABG & DM270262
Follow-up time (days) 333 ( 301 -- 355 ) 291 . 5 ( 268 -- 329 )
Abbreviations: SD = standard deviation; CI = confidence interval; MI = myocardial infarction; CABG = coronary artery bypass grafting; DM = diabetes mellitus.
Table 2. Parameter sets based on literature for template length m, data length N, threshold parameter r, the weighting factor(s) n, n L and n F , and the threshold parameter(s) r, r L and r F .
No.SourcemN n = n L n F r = r L = r F Entropy Type
1Mayer et al. [17]2120021 r Chon all
2Mayer et al. [17]2120013 0 . 2 · σ all
3Zhao et al. [18]21000--0.15 SampEn
4Zhao et al. [18]21000320.15 FuzzyMEn
Table 3. Univariate entropy predictors of mortality in CAST at baseline with parameter sets 1 to 4 as defined in Table 2 (all data ( n = 760 , 70 deaths), w/o CABG ( n = 619 , 63 deaths) and w/o CABG, w/o DM ( n = 490 , 39 deaths).
No.VariableλAllw/o CABGw/o CABG, w/o DM
HR ( 95 % CI ) p HR ( 95 % CI ) p HR ( 95 % CI ) p
1ApEn - 0 . 09 0 . 990 ( 0 . 909 -- 1 . 079 ) 0 . 825 0 . 976 ( 0 . 891 -- 1 . 069 ) 0 . 604 0 . 969 ( 0 . 864 -- 1 . 088 ) 0 . 594
CApEn - 0 . 15 0 . 989 ( 0 . 916 -- 1 . 067 ) 0 . 768 0 . 977 ( 0 . 901 -- 1 . 060 ) 0 . 578 0 . 974 ( 0 . 879 -- 1 . 079 ) 0 . 612
SampEn - 0 . 12 0 . 993 ( 0 . 920 -- 1 . 071 ) 0 . 854 0 . 981 ( 0 . 904 -- 1 . 063 ) 0 . 635 0 . 975 ( 0 . 880 -- 1 . 081 ) 0 . 632
FuzzyEn - 0 . 02 0 . 965 ( 0 . 781 -- 1 . 192 ) 0 . 738 0 . 905 ( 0 . 718 -- 1 . 140 ) 0 . 396 0 . 926 ( 0 . 686 -- 1 . 249 ) 0 . 615
FuzzyMEn 0 . 21 0 . 840 ( 0 . 469 -- 1 . 504 ) 0 . 557 0 . 726 ( 0 . 390 -- 1 . 351 ) 0 . 313 0 . 759 ( 0 . 342 -- 1 . 685 ) 0 . 498
2ApEn 1 . 66 0 . 962 ( 0 . 441 -- 2 . 098 ) 0 . 923 0 . 889 ( 0 . 399 -- 1 . 981 ) 0 . 774 0 . 638 ( 0 . 239 -- 1 . 700 ) 0 . 369
CApEn 0 . 61 0 . 957 ( 0 . 711 -- 1 . 288 ) 0 . 770 0 . 879 ( 0 . 650 -- 1 . 188 ) 0 . 402 0 . 833 ( 0 . 569 -- 1 . 221 ) 0 . 349
SampEn 0 . 88 0 . 911 ( 0 . 566 -- 1 . 464 ) 0 . 699 0 . 818 ( 0 . 506 -- 1 . 323 ) 0 . 413 0 . 674 ( 0 . 368 -- 1 . 235 ) 0 . 202
FuzzyEn 0 . 85 0 . 979 ( 0 . 375 -- 2 . 558 ) 0 . 965 1 . 047 ( 0 . 359 -- 3 . 057 ) 0 . 932 0 . 557 ( 0 . 146 -- 2 . 127 ) 0 . 392
FuzzyMEn 0 . 93 0 . 962 ( 0 . 622 -- 1 . 490 ) 0 . 863 0 . 988 ( 0 . 617 -- 1 . 582 ) 0 . 959 0 . 726 ( 0 . 404 -- 1 . 307 ) 0 . 286
3SampEn 0 . 09 0 . 951 ( 0 . 773 -- 1 . 169 ) 0 . 633 0 . 890 ( 0 . 710 -- 1 . 114 ) 0 . 308 0 . 876 ( 0 . 653 -- 1 . 176 ) 0 . 378
4FuzzyMEn 0 . 08 0 . 965 ( 0 . 740 -- 1 . 259 ) 0 . 795 0 . 889 ( 0 . 669 -- 1 . 180 ) 0 . 415 0 . 887 ( 0 . 615 -- 1 . 281 ) 0 . 523
Abbreviations: CAST = Cardiac Arrhythmia Suppression Trial, w/o = without, CABG = coronary artery bypass grafting, DM = diabetes mellitus, λ = transformation parameter of Box-Cox transformation, HR = hazard ratio, CI = confidence interval.
Table 4. Univariate entropy predictors of mortality in CAST after treatment with parameter sets 1 to 4 as defined in Table 2 (all data ( n = 740 , 69 deaths), w/o CABG ( n = 603 , 62 deaths) and w/o CABG, w/o DM ( n = 478 , 39 deaths).
No.VariableλAllw/o CABGw/o CABG, w/o DM
HR ( 95 % CI ) p HR ( 95 % CI ) p HR ( 95 % CI ) p
1ApEn - 0 . 19 0 . 927 ( 0 . 875 -- 0 . 981 ) 0 . 009 0 . 910 ( 0 . 857 -- 0 . 966 ) 0 . 002 0 . 930 ( 0 . 866 -- 0 . 999 ) 0 . 048
CApEn - 0 . 28 0 . 939 ( 0 . 895 -- 0 . 985 ) 0 . 010 0 . 926 ( 0 . 881 -- 0 . 974 ) 0 . 003 0 . 943 ( 0 . 888 -- 1 . 001 ) 0 . 053
SampEn - 0 . 23 0 . 937 ( 0 . 892 -- 0 . 985 ) 0 . 010 0 . 922 ( 0 . 876 -- 0 . 972 ) 0 . 002 0 . 940 ( 0 . 884 -- 1 . 000 ) 0 . 049
FuzzyEn - 0 . 09 0 . 962 ( 0 . 815 -- 1 . 136 ) 0 . 649 0 . 882 ( 0 . 742 -- 1 . 050 ) 0 . 158 0 . 897 ( 0 . 715 -- 1 . 124 ) 0 . 343
FuzzyMEn 0 . 11 0 . 844 ( 0 . 529 -- 1 . 348 ) 0 . 478 0 . 689 ( 0 . 430 -- 1 . 104 ) 0 . 121 0 . 727 ( 0 . 394 -- 1 . 340 ) 0 . 307
2ApEn 1 . 80 2 . 252 ( 0 . 994 -- 5 . 102 ) 0 . 052 2 . 349 ( 1 . 006 -- 5 . 489 ) 0 . 049 1 . 690 ( 0 . 610 -- 4 . 686 ) 0 . 313
CApEn 0 . 58 1 . 516 ( 1 . 100 -- 2 . 089 ) 0 . 011 1 . 441 ( 1 . 040 -- 1 . 996 ) 0 . 028 1 . 334 ( 0 . 890 -- 1 . 998 ) 0 . 162
SampEn 0 . 92 1 . 713 ( 1 . 023 -- 2 . 869 ) 0 . 041 1 . 705 ( 1 . 008 -- 2 . 884 ) 0 . 046 1 . 367 ( 0 . 720 -- 2 . 597 ) 0 . 340
FuzzyEn 0 . 77 3 . 375 ( 1 . 381 -- 8 . 247 ) 0 . 008 3 . 828 ( 1 . 454 -- 10 . 075 ) 0 . 007 1 . 825 ( 0 . 535 -- 6 . 229 ) 0 . 337
FuzzyMEn 0 . 86 1 . 634 ( 1 . 054 -- 2 . 535 ) 0 . 028 1 . 767 ( 1 . 104 -- 2 . 826 ) 0 . 018 1 . 200 ( 0 . 668 -- 2 . 157 ) 0 . 542
3SampEn 0 . 06 0 . 953 ( 0 . 788 -- 1 . 153 ) 0 . 622 0 . 857 ( 0 . 699 -- 1 . 050 ) 0 . 136 0 . 845 ( 0 . 650 -- 1 . 098 ) 0 . 207
4FuzzyMEn 0 . 02 1 . 124 ( 0 . 881 -- 1 . 435 ) 0 . 347 0 . 980 ( 0 . 758 -- 1 . 269 ) 0 . 880 0 . 967 ( 0 . 690 -- 1 . 356 ) 0 . 846
Table 5. Univariated traditional HRV predictors as reported by Stein et al. [7] using the same dateset (i.e., CAST).
Allw/o CABGw/o CABG, w/o DM
Variable HR ( 95 % CI ) p HR ( 95 % CI ) p HR ( 95 % CI ) p
AVGNN 1 . 001 ( 0 . 999 -- 1 . 002 ) 0 . 36 1 . 000 ( 0 . 998 -- 1 . 002 ) 0 . 77 1 . 000 ( 0 . 998 -- 1 . 003 ) 0 . 77
SDNN 0 . 997 ( 0 . 9991 -- 1 . 003 ) 0 . 36 0 . 994 ( 0 . 987 -- 1 . 001 ) 0 . 09 0 . 992 ( 0 . 982 -- 1 . 001 ) 0 . 07
Ln SDANN 0 . 800 ( 0 . 485 -- 1 . 319 ) 0 . 38 0 . 576 ( 0 . 322 -- 1 . 028 ) 0 . 06 0 . 400 ( 0 . 184 -- 0 . 871 ) 0 . 02
Ln SDNNIDX 0 . 919 ( 0 . 581 -- 1 . 452 ) 0 . 72 0 . 740 ( 0 . 435 -- 1 . 257 ) 0 . 26 0 . 748 ( 0 . 360 -- 1 . 553 ) 0 . 44
LN rMSSD 1 . 271 ( 0 . 803 -- 2 . 010 ) 0 . 31 1 . 127 ( 0 . 683 -- 1 . 860 ) 0 . 64 1 . 371 ( 0 . 735 -- 2 . 557 ) 0 . 32
Abbreviations: CAST = Cardiac Arrhythmia Suppression Trial, w/o = without, CABG = coronary artery bypass grafting, DM = diabetes mellitus, HR = hazard ratio, CI = confidence interval, AVGNN = average NN intervals in ms, SDNN = the standard deviation of NN intervals in ms, Ln = log transformation, SDANN = the standard deviation of 5-min mean NN intervals in ms, SDNNIDX = the average of standard deviations of NN intervals for each 5-min interval in ms, rMSSD = the root mean square successive difference of NN intervals in ms.

