Article

Selecting Video Key Frames Based on Relative Entropy and the Extreme Studentized Deviate Test †

1
School of Computer Science and Technology, Tianjin University, Yaguan Road #135, 300350 Tianjin, China
2
Graphics and Imaging Lab, Universitat de Girona, Campus Montilivi, 17071 Girona, Spain
*
Authors to whom correspondence should be addressed.
This paper is an extended version of the paper entitled “Key Frame Selection Based on KL-Divergence”, presented at IEEE International Conference on Multimedia Big Data (BigMM 2015), Beijing, China, 20–22 April 2015.
Entropy 2016, 18(3), 73; https://doi.org/10.3390/e18030073
Submission received: 11 January 2016 / Revised: 31 January 2016 / Accepted: 15 February 2016 / Published: 9 March 2016

Abstract

:
This paper studies the relative entropy and its square root as distance measures of neighboring video frames for video key frame extraction. We develop a novel approach handling both common and wavelet video sequences, in which the extreme Studentized deviate test is exploited to identify shot boundaries for segmenting a video sequence into shots. Then, video shots can be divided into different sub-shots, according to whether the video content change is large or not, and key frames are extracted from sub-shots. The proposed technique is general, effective and efficient to deal with video sequences of any kind. Our new approach can offer optional additional multiscale summarizations of video data, achieving a balance between having more details and maintaining less redundancy. Extensive experimental results show that the new scheme obtains very encouraging results in video key frame extraction, in terms of both objective evaluation metrics and subjective visual perception.

1. Introduction

In the era of big data, digital video plays an increasingly significant role in many engineering fields and in people’s daily lives [1]. This means that a good and quick way to obtain useful information from video sequences of various kinds is largely needed in practical applications, such as fast video browsing [2], human motion analysis [3], and so on. It is widely accepted that video key frame selection is very important to this issue [4]. Generally, the key frames extracted from a video sequence are of a small number, but can represent most of the video content; thus, key frame extraction is a reasonable and quick abstraction to reflect the original video information [5,6].
In general, due to its fast running and easy implementation, shot-based key frame extraction is probably the most used framework for video summarization in practice [5,7,8]. Needless to say, dealing with video data of any kind is valuable for real applications [9,10]. Notably, information theory tools, which are good at the management of “abstract and general information” embedded in video sequences, are very fit for being deployed in extracting key frames, as has been certified by previous works [11,12,13,14]. Furthermore, wavelet video sequences are popularly used in actual application scenarios [15], and performing key frame selection on wavelet videos directly is undoubtedly worthwhile. As a result, our purpose here is to exploit information theoretic measures to do shot-based video summarization, on both common and wavelet video data.
The topic of this paper is to present a new shot-based approach for the key frame selection, for the sake of efficiently and effectively obtaining representative content of video sequences of any kind. This work improves on and extends our preliminary version [16] with six points. First, the proposed technique extends the utilization of relative entropy (RE) [17] as a distance measure of neighboring video frames. Considering that the utilization of the square root of RE (SRRE), compared to the use of RE, can better discriminate the video content change, which is small, but notable, SRRE is novelly adopted to measure the distance between video images for key frame selection. Second, in order to locate shot boundaries, we propose a new method based on the widely-used extreme Studentized deviate (ESD) test [18] and on an adaptive correction. Third, we propose to use a novel normalization way to finely identify the sub-shots with large content changes. Fourth, our new approach can deal with both common and wavelet video sequences. As for handling wavelet video sequences, shot and sub-shot identifications are respectively recognized by using the coarsest and finest scale coefficients. This is because the shot cut means a video scene change, and the sub-shot location depends on the delicate and complex content variation within a shot. The respective uses of the coarsest and the finest scale coefficients result in good computing efficiency. Fifth, for wavelet video data, a new way is advanced to extract key frames from sub-shots with big content changes satisfactorily. Sixth, we provide a multiscale video summarization, balancing the elimination and maintenance of redundant key frames. In this way, both rich information introduced by the redundancy and compactness of video summarization can be well considered. The experimentation conducted shows that the proposed scheme acts very effectively and very quickly.
This paper is structured as follows. In Section 2, we introduce the related work on key frame selection approaches. Section 3 describes our proposed key frame selection approach in detail, which includes shot boundary detection, sub-shot location and key frame extraction. Section 4 discusses the multiscale video summarizations. Section 5 presents experimental results and the discussion. Finally, Section 6 presents the concluding remarks and future work.

2. Related Work

A vast amount of work has been done on the key frame selection algorithms in the past; the reader can consult the two survey works [5,6] for more details. Generally, shot-based key frame selection methods are the main option for practical use, due to their simple mechanism and good running efficiency [8,19]. It is worth pointing out that the distance between video frames plays a vital role in shot-based video key frame extraction [20]. Additionally, let us remark that information theoretic measures are general enough to be particularly suitable as distance metrics of video frames for key frame selection on video sequences of any kind [9,10], as has been demonstrated by some typical attempts [11,12,13,14].
Mentzelopoulos et al. [11] present a scheme that uses the classical Shannon entropy for the probability histogram of intensities of the video frame. The entropy difference (ED), which is the distance between the Shannon entropies of neighboring video frames, is computed and accumulated in the sequential processing of video frames. A key frame is obtained when the accumulation value of sequential EDs is large enough. This method is simple and efficient. However, the key frames generated are not distributed very well to represent the video content. Černeková et al. [12] exploit the mutual information (MI) to measure the content change between video frames. Then, shot boundaries and also the key frames within a shot are obtained according to whether the video content change is large or not. This scheme can have very encouraging results. Unfortunately, it is necessary for MI to calculate the joint probability distribution of two image intensities. If the video content changes largely, for instance a significant object motion occurs, then the sparse distribution of joint probability causes an incorrect estimation of MI, decreasing the performance of key frame extraction. Interestingly enough, Omidyeganeh et al. [13] utilize the generalized Gaussian density (GGD)-based approximation to greatly compress the pure finer-scale wavelet coefficients of video frames and use the Kullback–Leibler divergence on these compressed frames to obtain the frame-by-frame distance for identifying the shot and sub-shot (where the word “cluster” is used in their paper) boundaries. A key frame is obtained for each sub-shot, being as similar as possible to the images in this sub-shot and, at the same time, as dissimilar as possible to the video frames outside. It ought to be indicated that, although the Kullback–Leibler divergence is the same as the RE, as called in this paper, our proposed technique is significantly different from the method presented in [13]. First, we utilize the coarsest wavelet coefficients for shot division and the finest scale coefficients for sub-shot detection, while the scheme in [13] only applies the finer scale coefficients for the partitioning of both shot and sub-shot. In fact, the only use of the finer scale coefficients is not enough for shot detection, as has been pointed out in Section 1. Second, the adoption of the very large compression of the wavelet coefficients with GGD in [13] worsens the overall performance of the key frame selection. On the other hand, our proposed method does not rely on the compressed wavelet coefficients and achieves better key frame results. Third, the efficiency of the technique in [13] is very low because each key frame candidate has to be compared to all of the video images of the entire video, in contrast to our mechanism of obtaining key frames, which can result in much faster outputs.
Good results on key frame selection based on entropy-based Jensen divergence measures are achieved in [14]. The entropic index free Jensen–Shannon divergence (JSD) works very well for key frame extraction [14]. It is important to emphasize that the Jensen–Rényi divergence (JRD) and Jensen–Tsallis divergence (JTD) have been also employed in [14]. It is true that JRD and JTD can achieve better performance than JSD, but, for the sake of investigating the use of the generalized entropies, such as Rényi and Tsallis, in the real key frame selection tasks, the optimum values for the entropic index for different video sequences are varied [14]. As a result, it is very difficult for users to easily have a good entropic index well applied for all of the videos from the perspective of doing key frame selection. This kind of practical difficulty makes the generalized entropies little useable in real applications (see an example on document processing [21]). In this paper, our attempt focuses more on the execution efficiency. After observing that JSD can be actually considered as an average of two versions of RE [17], we aim to investigate RE and especially SRRE for video key frame selection. Moreover, compared to our previous work [14], this paper proposes six extended improvements, introduced in Section 1.

3. Proposed Approach for Key Frame Selection

Basically, the core computational mechanism of our proposed novel approach for key frame selection is that a video sequence is firstly divided into a sequence of shots by utilizing the ESD test [18], and then, each shot is further segmented into several sub-shots. Within each sub-shot, we select one key frame by different manners according to whether the video content changes largely or not. We are going to focus on studying the key frame selection performance of the proposed approach based on RE and SRRE as the important distance measures for video frames (see Section 3.1). The entire procedure of our key frame extraction algorithm is illustrated in Figure 1, and further details can be seen in Section 3.2, Section 3.3 and Section 3.4. The multiscale summarization, which can be an optional additional part of our proposed approach, is explained in Section 4.
Generally, many key frame selection literature works deal with the common video sequence in which the video frame is organized by pixel values [22]. Actually, in practical applications, wavelet video sequences can be directly obtained and used from wavelet-based compressed data [23], such as the widely-used discrete wavelet transformation coefficients [15], which can significantly reduce the data volume and simultaneously retain most of the original information. Thus, we extend our approach to run on wavelet video sequences. In this case, we propose a new design for choosing a key frame from the sub-shot with a large content change, as explained in Section 3.4.

3.1. Distance Measure

The proposed key frame selection technique utilizes relative entropy (RE), which is indeed one of the best known distance measures between probability distributions from the perspective of information theory [17], to calculate the distance of neighboring video frames to partition a video sequence. As a matter of fact, the valid application of RE has been reliably verified in mathematics and in quite many engineering fields, such as neural information processing [24], due to its theoretical and computational advantages [25]. It is noted that a widely-used information theoretic measure, namely the Jensen–Shannon divergence (JSD) [26], has been demonstrated to evaluate the distance between video images well for selecting key frames [14]. Importantly, two REs are summed to make the average to obtain the JSD [26], and as a result, the distance between video frames calculated by RE is faster than that by JSD. The main motivation of this paper is to take advantage of the classical RE to run the key frame extraction on video sequences of any kind fast enough and meanwhile with few memory costs. Additionally, in this case, the proposed technique can be easily and effectively used for common consumers, for example meeting the requirement of being used on mobile computing platforms.
We adopt RE to measure the distance between the i-th and i + 1 -th frames, f i and f i + 1 ,
d R E f i , f i + 1 = j = 1 m p i j log p i j p i + 1 j
Here, p i = p i 1 , p i 2 , , p i m is the probability distribution function (PDF) of f i , using the normalized intensity histogram with m bins ( m = 256 ). Note that the distance between the two adjacent frames is, in our case, the sum value of the three RGB channels. Additionally, considering that the square root function can “emphasize” the distance between video frames with little content change to have a better ability for recognizing the differences between these small distances, as illustrated in Figure 2, we also propose to utilize the square root of RE, denoted by SRRE, as a distance measure for key frame selection:
d S R R E f i , f i + 1 = j = 1 m p i j log p i j p i + 1 j
Notice that, in fact, SRRE has been successfully used as the distance measure between two probability distributions in the field of statistics by Yang and Barron [27].
Particularly, for the sake of convenient testing, we use Haar transformation (four levels) on common videos as wavelet sequences used in our paper. Given a frame, coefficients in each wavelet transform sub-band of each transformation level are used to build up a PDF (here, the bin number is 10). For each transformation level, the RE or SRRE distance between the two corresponding sub-bands of two adjacent frames is first obtained; then, the sum of all of these distances in all of the levels is taken as the RE or SRRE distance between two frames. It is important to point out that we utilize the coarsest scale coefficients, which embody the basic information of video images, to perform shot detection (Section 3.2). Since the finest scale coefficients mainly describe the details of video frames, we apply them for sub-shot identification (Section 3.3). Notably, the respective uses of two kinds of wavelet coefficients help reduce the computational complexity.

3.2. Shot Boundary Detection

Given a video sequence with n f frames, we first need to find the shot boundaries, each of which indicates a huge difference between two adjacent frames, so as to segment the video stream completely into shots without overlapping. To achieve this goal, we employ the distance ratio, which is the quotient between frame distance and neighbor average, and that has been shown to effectively present the difference of video images [14]. Thus, we firstly obtain the distance ratios for all of the frames of a video sequence. Outliers of these ratios can be considered as possible shot boundaries. Considering that the distance ratios follow a Gaussian distribution, as widely accepted in video summarization works [28], we make use of the powerful ESD test [18] to detect shot boundaries. The ESD test, which is a recursive generalization of the statistical Grubbs test [29], is usually used to detect more than one outlier [18].
Concretely, we compute the distance d between each two adjacent frames by RE Equation (1) or SRRE Equation (2) to obtain a distance ratio for each frame. The distance ratio of the i-th frame is defined as:
δ i = d f i , f i + 1 d ω f i , f i + 1 , i = 1 , 2 , 3 , , n f - 1
where ω is a temporal window containing ω continuous adjacent frames around f i (how to obtain the value of ω will be explained in the next paragraph). Here:
d ω f i , f i + 1 = j = i - ω - 1 / 2 i + ω - 1 / 2 d ( f j , f j + 1 ) ω
is the neighbor average. Then, the ESD test [18] is utilized to detect the outliers with n degrees of freedom and significance level α:
max ( δ - δ ¯ ) σ > n - 1 n t α / n , n - 2 2 n - 2 + t α / n , n - 2 2
where δ ¯ and σ are the mean value and standard deviation of the corresponding testing distance ratios, respectively. t α / n , n - 2 represents the critical value of a t-distribution with a level of significance of α / n . In this paper, the degrees of freedom and significance level are respectively set as n = 100 and α = 0 . 005 , as commonly used for the ESD and Grubbs tests [30].
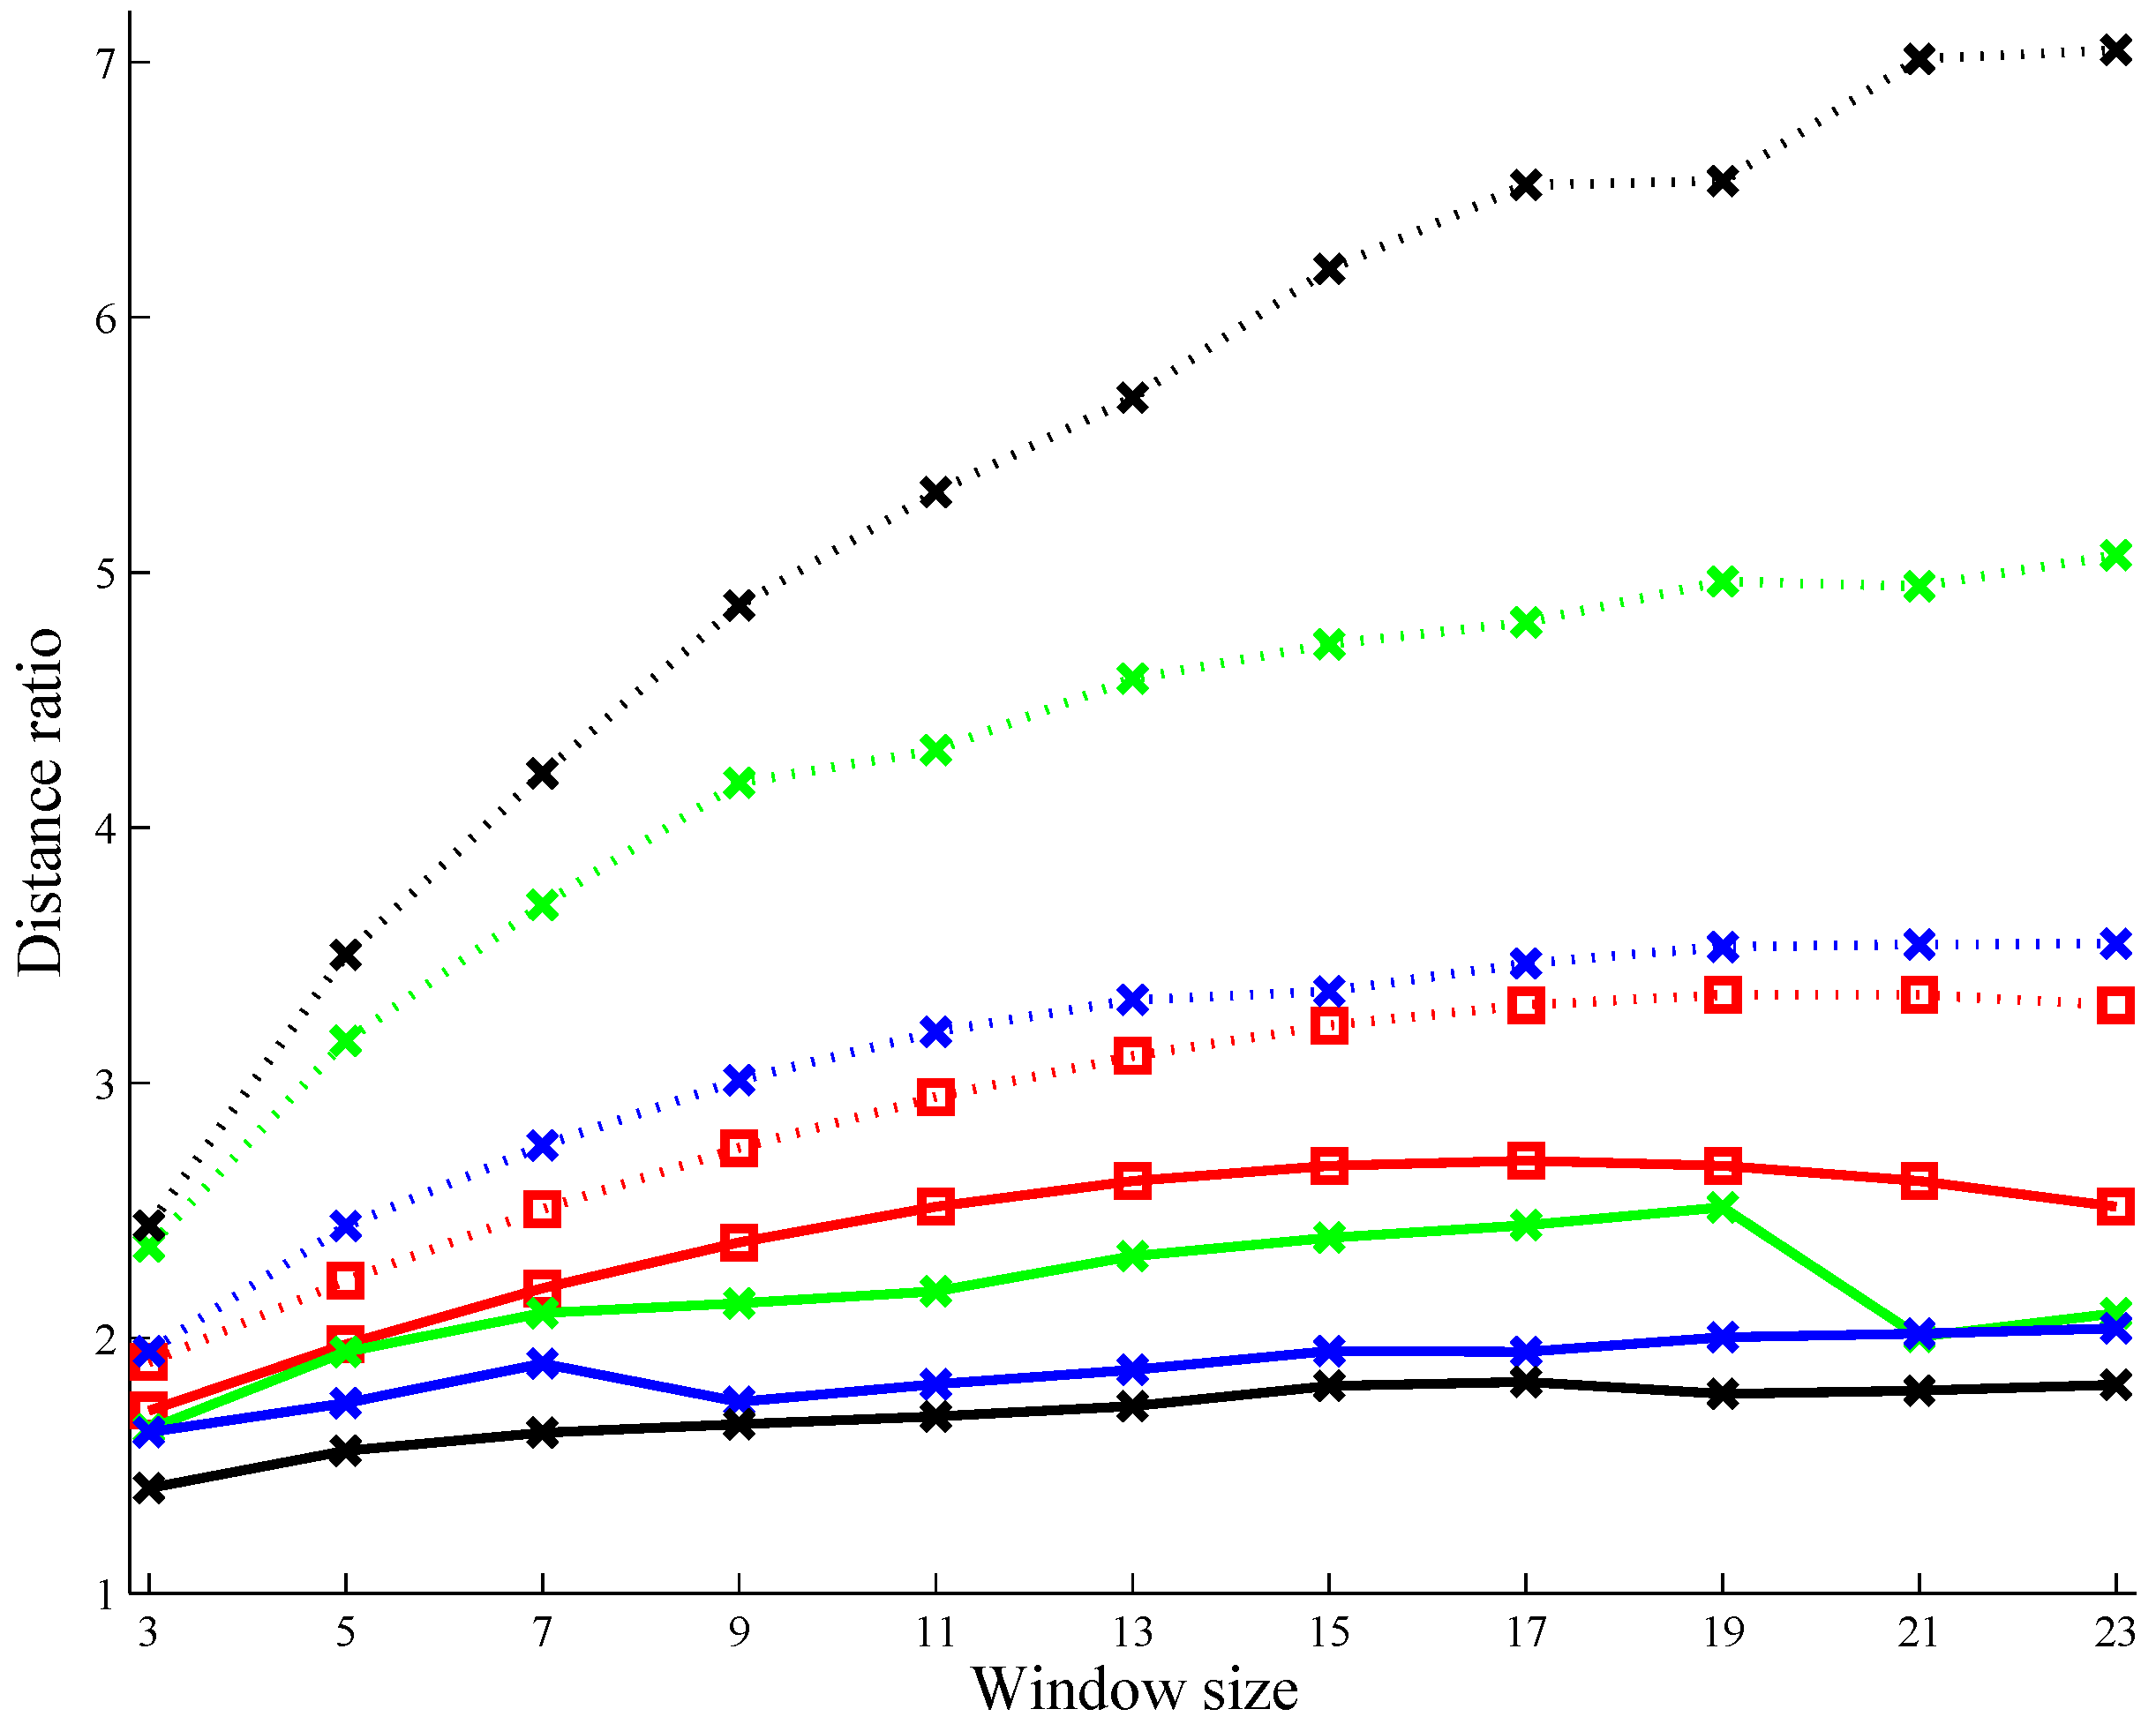
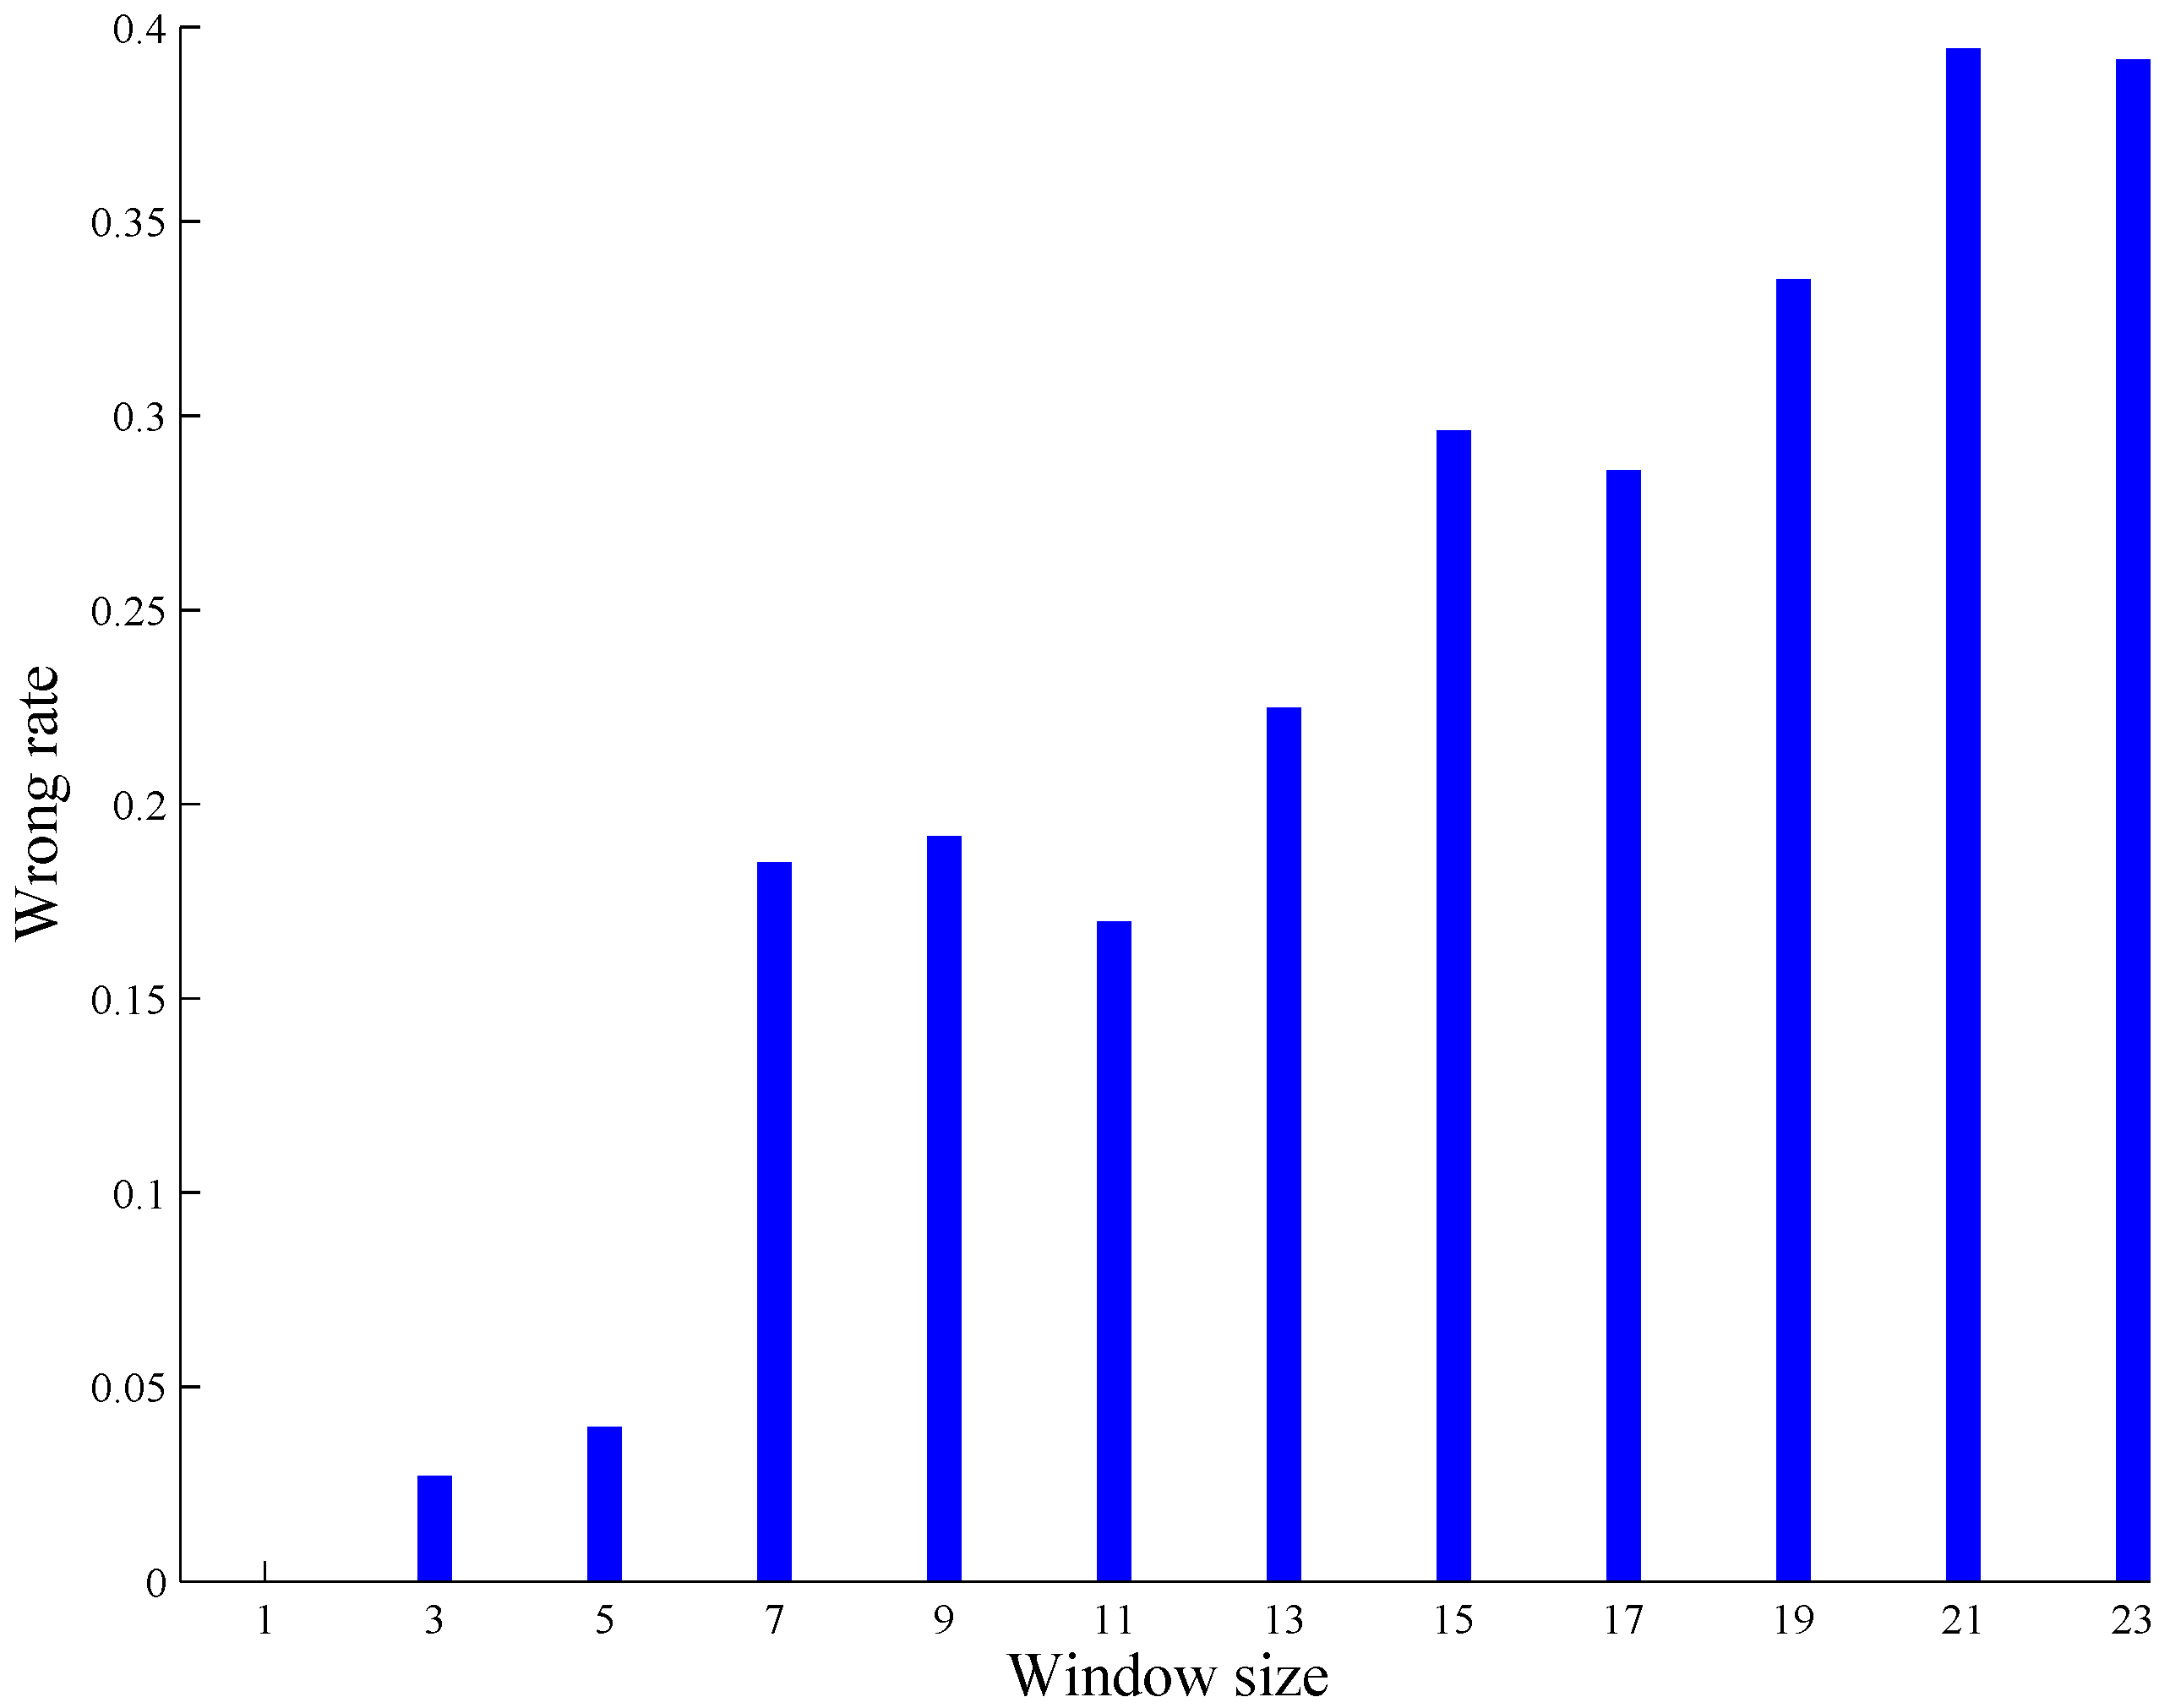
Obviously, some outliers are possibly wrongly identified, since the ESD test is a probabilistic tool, and the confidence level cannot be absolutely 100 % . Therefore, we propose an effective correction strategy to remove wrong outliers by an adaptive threshold λ. If and only if the distance ratio corresponding to an outlier is not lower than λ, then this ratio reflects a true outlier and indicates a valid shot boundary. To determine an appropriate λ, we make use of a regression procedure [31] to operate on the maximum and minimum distance ratios, corresponding to different window sizes, for all of the valid shot boundaries of extensive test video sequences (see Figure 3 as an illustration). Considering that a standard frame rate of a video is 24 frames per second, which means there are generally 24 frames between two shots, as suggested in the literature [32], here, the window size ω takes the odd numbers in 3 , 23 . First, we obtain the global maximum and minimum distance ratios, denoted by A = a ω and B = b ω respectively, for different window sizes. Additionally, an average of A and B, C = ( a i + b i ) / 2 , is computed. Then, a second-order polynomial regression method [31] is used to fit the upper bound of λ based on A and C. Similarly, we obtain the lower bound based on B and C. Finally, in this paper, we use λ - 0 . 005 ω 2 + 0 . 17 ω + 1 . 25 , - 0 . 005 ω 2 + 0 . 2 ω + 1 . 35 . Notably, with larger ω, as a whole, the wrong outliers by the ESD test become more, as demonstrated in Figure 4, and also, the computational cost for shot detection grows higher (see Equation (4)); thus, we encourage the readers to use ω = 3 , and in this case, λ varies in 1 . 715 , 1 . 905 .

3.3. Sub-Shot Location

There may also exist a big content change within a video shot; thus, it is necessary to partition the shot into smaller sub-shots considering the possible object/camera motion [33]. For a given shot, we calculate the gradient of distance on the window of f i by:
Δ f i = d ω f i , f i + 1 - d ω f i - 1 , f i
and then, we make use of an average of the normalized Δ ( f i ) ,
Δ ω f i = j = i - ω - 1 / 2 i + ω - 1 / 2 Δ f j / ω Δ m a x
for sub-shot detection. Here, Δ m a x is the maximum gradient within a shot under consideration. If Δ ω f i is larger than a preset threshold Δ ω * ( Δ ω * = 0 . 5 in this paper), then we deem that there is a big enough content change at the i-th frame, namely the shot ought to be divided around f i . Two frames, with zero-approaching Δ ω ( ) , temporally before and after f i ,
f i b e f o r e = f argmax j | Δ w f j | ω * , for all j < i in this shot
and:
f i a f t e r = f argmin j Δ w f j ω * , for all j > i in this shot
are respectively located to be as the beginning and ending borders of the sub-shot based on f i , and this sub-shot has the large content change. Here, ω * is a predefined threshold ( ω * = 0 . 05 in this paper). As a result, a shot is segmented into consecutive sub-shots based on all of the borders of the sub-shots possessing large content variations. Notice that the shots with small content changes do not need the further subdivision and are regarded as single sub-shots.

3.4. Key Frame Selection

As for the final key frame selection within each sub-shot, we propose two different methods according to the size of the content change. In a sub-shot, it may have either a large content change or not. For the former case, we select the frame that minimizes the sum distance between it and all of the others as the key frame. Additionally, for the second case, we simply choose the center frame.
In particular, for a wavelet video sequence, we propose a new manner to obtain the key frame of a sub-shot with a large content change. Considering that the distance of video frames is computed based on the finest scale wavelet coefficients and accordingly is an approximated calculation, the distance between directly adjacent frames is taken to reduce error in the obtention of key frames. Given such a sub-shot, beginning from f τ and ending at f τ + m , we firstly obtain all of the RE or SRRE distances between each of two consecutive frames, d f τ , f τ + 1 , d f τ + 1 , f τ + 2 , , d f τ + m - 1 , f τ + m , and then, the key frame f k e y is determined as the frame that minimizes the difference between d f k e y , f k e y + 1 and the average of all of the RE or SRRE distances:
f k e y = f argmin j d f j , f j + 1 - l = τ , l j τ + m - 1 d f l , f l + 1 m - 1

4. Multiscale Video Summarizations

Undoubtedly, achieving a set of compact key frames is important, and removing the redundant similar key frames can be used for this purpose [7]. However, a few redundancies may provide richer information on the video context, such as the duration of an important event, to help understand the video content more effectively. As an example, some redundancy of key frames can largely speed up the location of a specific video scene [34]. Considering this, we propose to offer the video key frames with different levels of detail, the so-called multiscale summarizations.
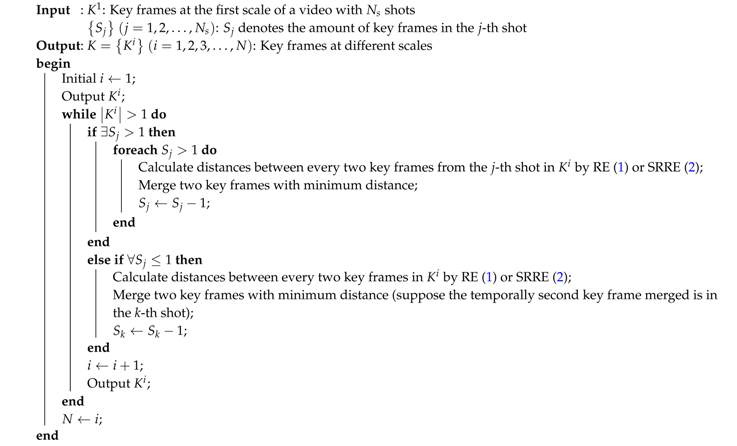
For each shot with more than one key frame, the distances between every two key frames are computed by RE Equation (1) or SRRE Equation (2), and then, the two with minimum distance are merged until only one key frame in this shot is left. Here, the merging rule, which is simple, but effective enough, is to remove the temporally latter key frame in the sequence. Then, for all of the key frames left, each of which corresponds to a shot, a similar merging procedure is used repeatedly, and finally, only one key frame is left for a video sequence. More concretely, given a video sequence V, we obtain its multiscale summarizations, K = K i i = 1 , 2 , , N , by using a hierarchical merging scheme, as shown in Algorithm 1. Here, K i represents the key frames at the i-th scale, and V K 1 K 2 K N . K 1 is generated by the proposed key frame extraction method, and K N contains only one key frame. All of the multiscale summarizations are obtained, and in this case, users can understand the video content very well by observing the overview and details at different scales.
Algorithm 1: Hierarchical merging scheme for obtaining multiscale summarizations.
Entropy 18 00073 i001
Notice that our hierarchical merging uses two treatments to make the procedure efficient, which is quite meaningful when a video sequence is long. First, if there exists a shot having more than one key frame, the distance calculations are limited to the key frames from the same shot, since the distance between the key frames from the same shot must be smaller than that from different shots. Second, when merging two key frames, we remove the temporally latter one to directly reduce the redundancy.
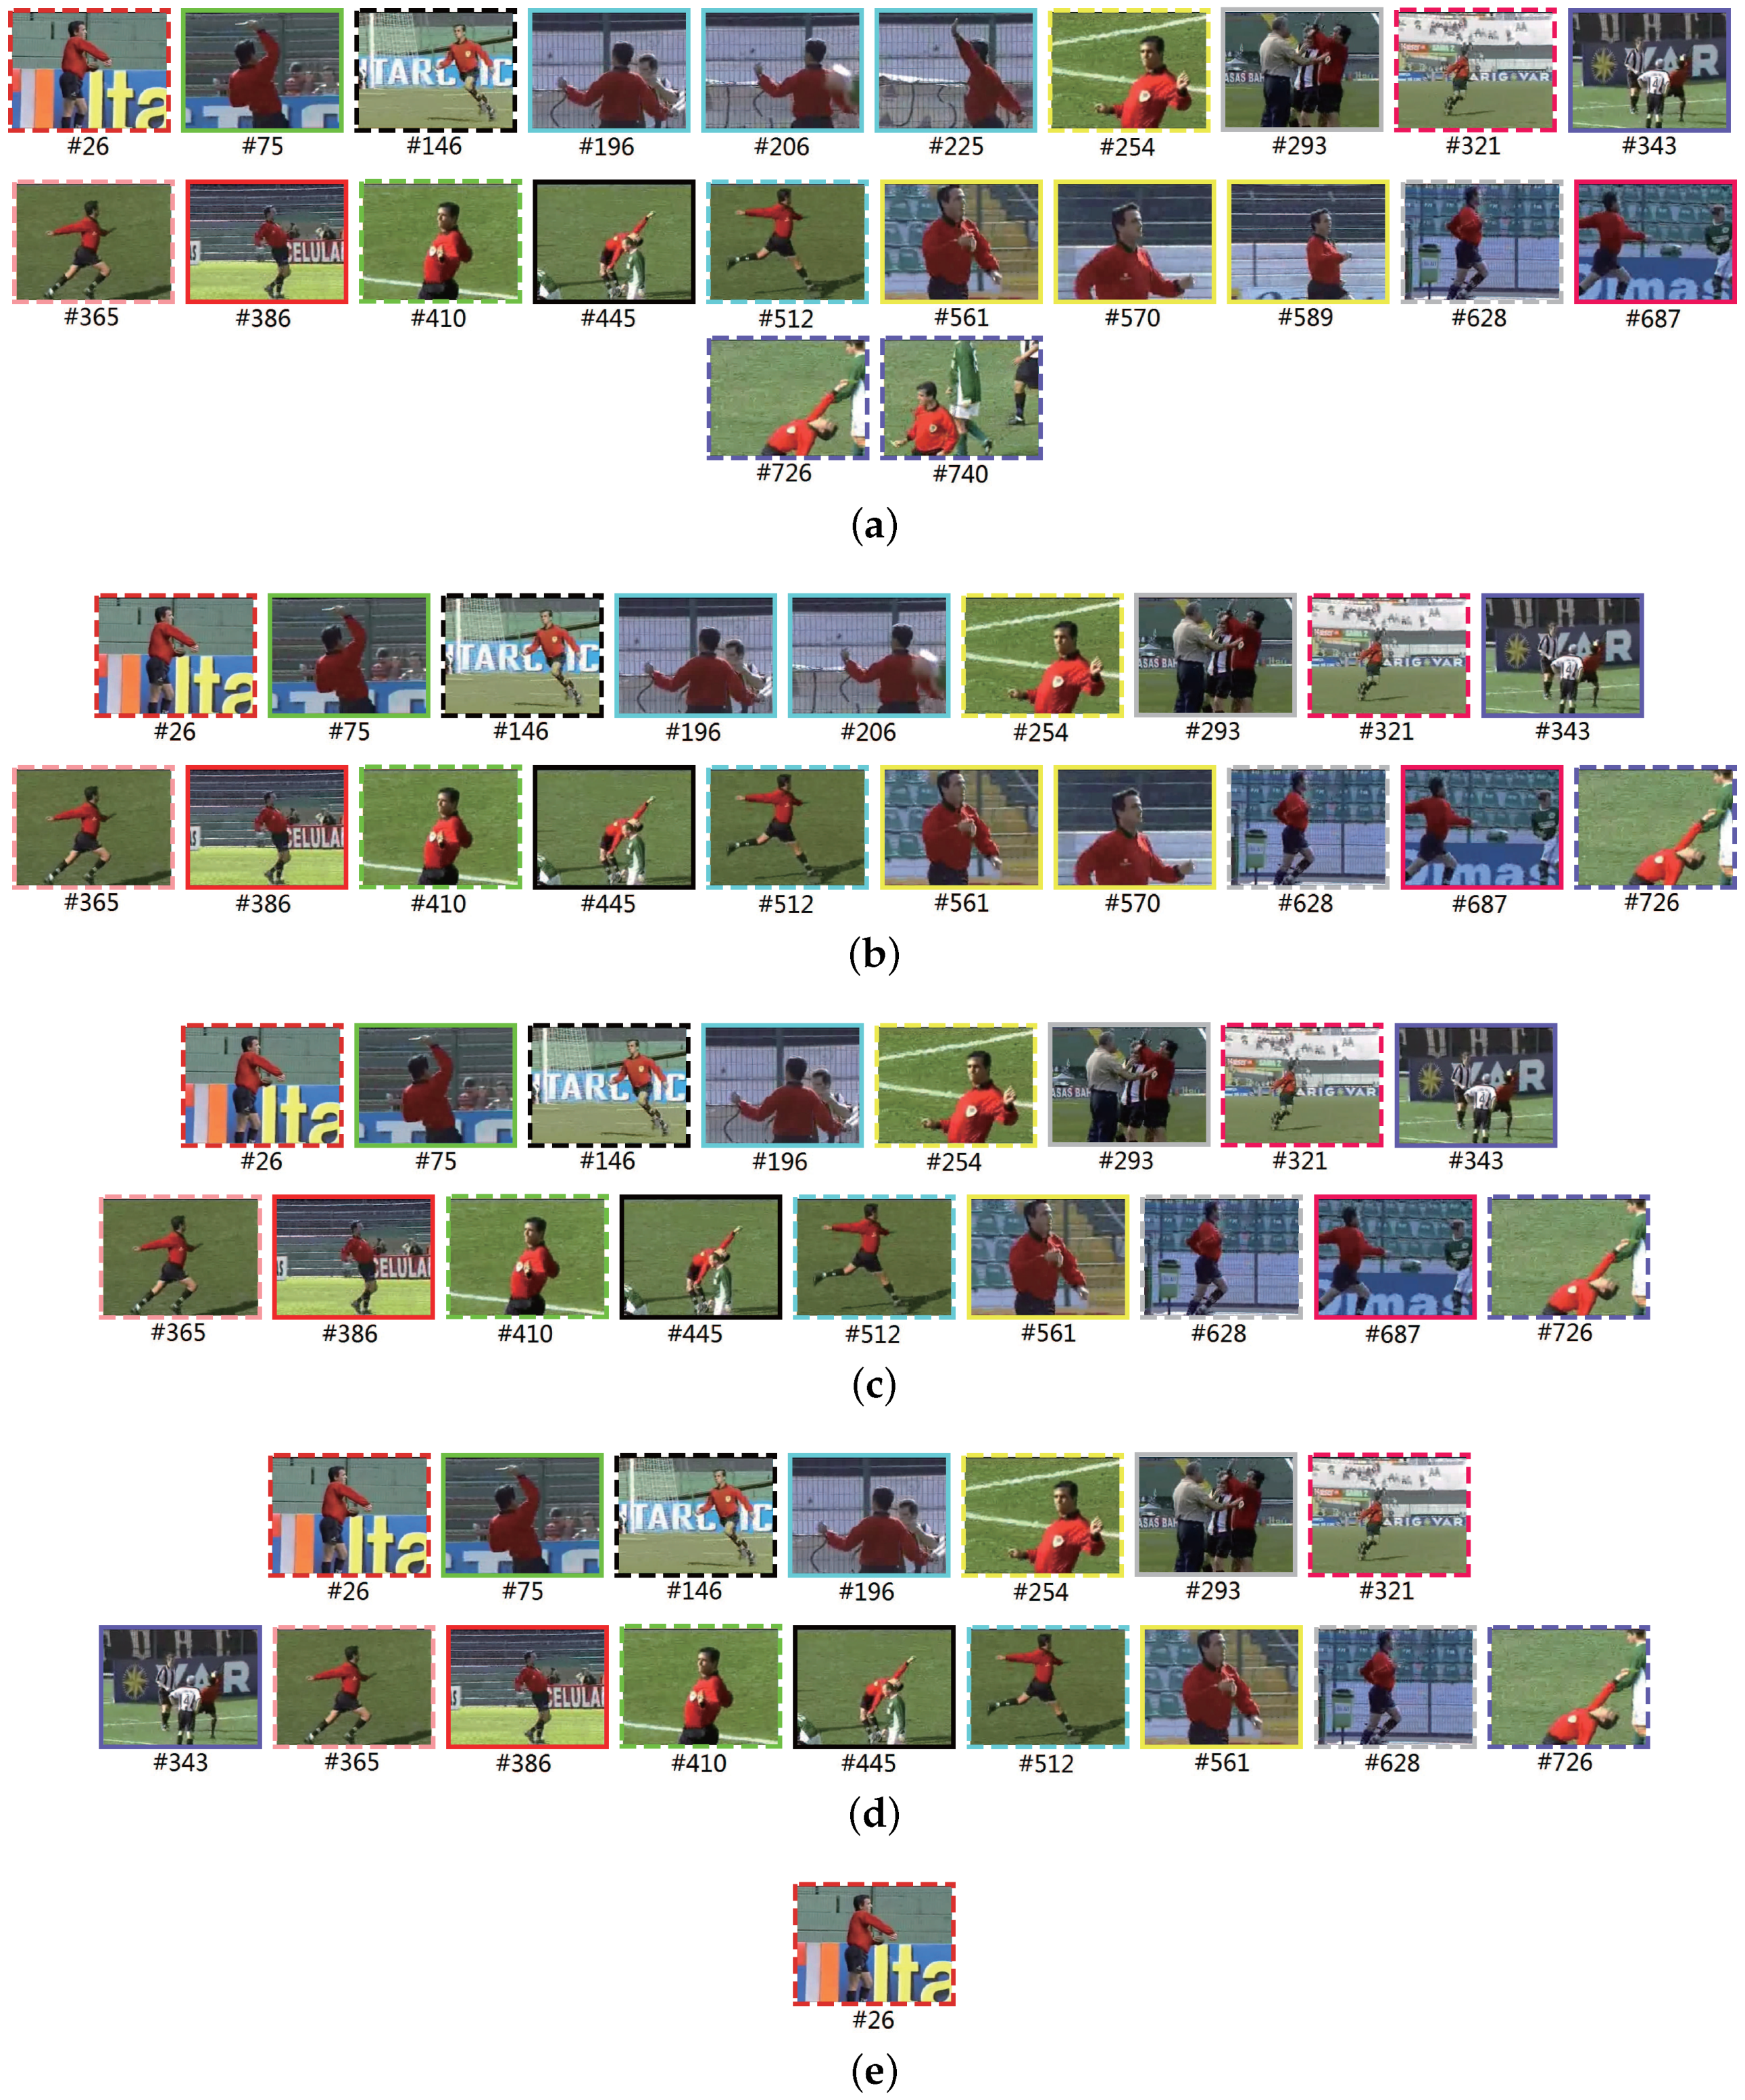
Figure 5 exhibits the key frames at some scales extracted from a test video. The shot boundaries of this video are Frames [ # 51 , # 99 , # 193 , # 231 , # 276 , # 309 , # 332 , # 354 , # 375 , # 397 , # 423 , # 467 , # 556 , # 604 , # 651 , # 722 , # 751 ]. At Scale 19, only one key frame is used to cover the most abstract information of the video content, which can be used, for example, as an icon to search a video from a video library quickly. The key frames at Scale 4 are dissimilar to each other as much as possible and concisely cover the original content of the video sequence very well. At Scale 3, there is only one key frame left for each shot, which represents the video content for all of the shots very well. Compared to Scale 4, the results at Scale 3 have somewhat of a redundancy since the key frames, #628 and #687, of two adjacent shots are similar, but this gives a useful cue/hint of the moving object. Scale 2 has more key frames and provides more information than Scale 3. For example, Scale 3 only outputs the frame #196 in a shot, but Scale 2 provides an additional frame, #206. Apparently, these two frames at Scale 2 can represent an activity more clearly. Besides, Frames #561 and #570 in the same shot at Scale 2 show more of the camera zooming in than by a single frame, #561, at Scale 3. Furthermore, Scale 1 possesses more “repetitive” similar video frames in the same shots than other scales, resulting in a better depiction of the shot content changes. This is obviously exemplified by the comparison between the frames #561, #570, #589 at Scale 1 and #561, #570 at Scale 2. Consequently, although the redundancy of the key frames is traditionally regarded as a performance degradation of the video abstraction, the multiscale outputs of the key frames with some redundancy suggest a balance between providing more video information and reducing similar frames. This gives an opportunity for efficient and effective understanding of the video sequence.

5. Experimental Results and Discussion

In this section, we present extensive tests on different characteristics of videos for the purpose of evaluating the performance of our proposed algorithm for key frame selection. All of the experiments are conducted on a Windows PC with Intel Core i3 CPU at 2.10 GHz and with 8 GB RAM. Notice that, in order to reduce the possible perturbations and noise, all of the key frame and runtime results are the average of five independent experiments.

5.1. A Performance Comparison Based on Common Test Videos

For the sake of a fair benchmark, we consider the methods using information theoretic distance measures in the shot-based computing mechanism. The RE- and SRRE-driven methods are firstly compared to the proposed algorithm using JSD, the approaches based on GGD [13] and MI [12], on the common video sequences. In addition, the algorithm applying the most classical Shannon entropy, namely the so-called ED [11], is introduced for this kind of comparison. All of the parameters associated with the comparing approaches are carefully determined by the trial and error method [35] based on extensive experiments to achieve the best possible performances, and simultaneously, the numbers of key frames issued by different methods are controlled to be as equal as possible. That is, the procedure of parameter tuning here can be considered as being split into training and testing steps, and all of the video sequences used are taken both as training and testing sets.
In tests, the video clips are composed of various contents. Namely, the videos may contain significant object and camera motions or not; they may have the camera moving, such as zooming, tilting and panning; also, they may have a fade in or out, a wipe and a dissolve as gradual transitions. These test videos are provided by “The Open Video Project database” [36]. Table 1 lists the main information on the 46 test video sequences; for convenient use, we rename all of these videos as 1–46.
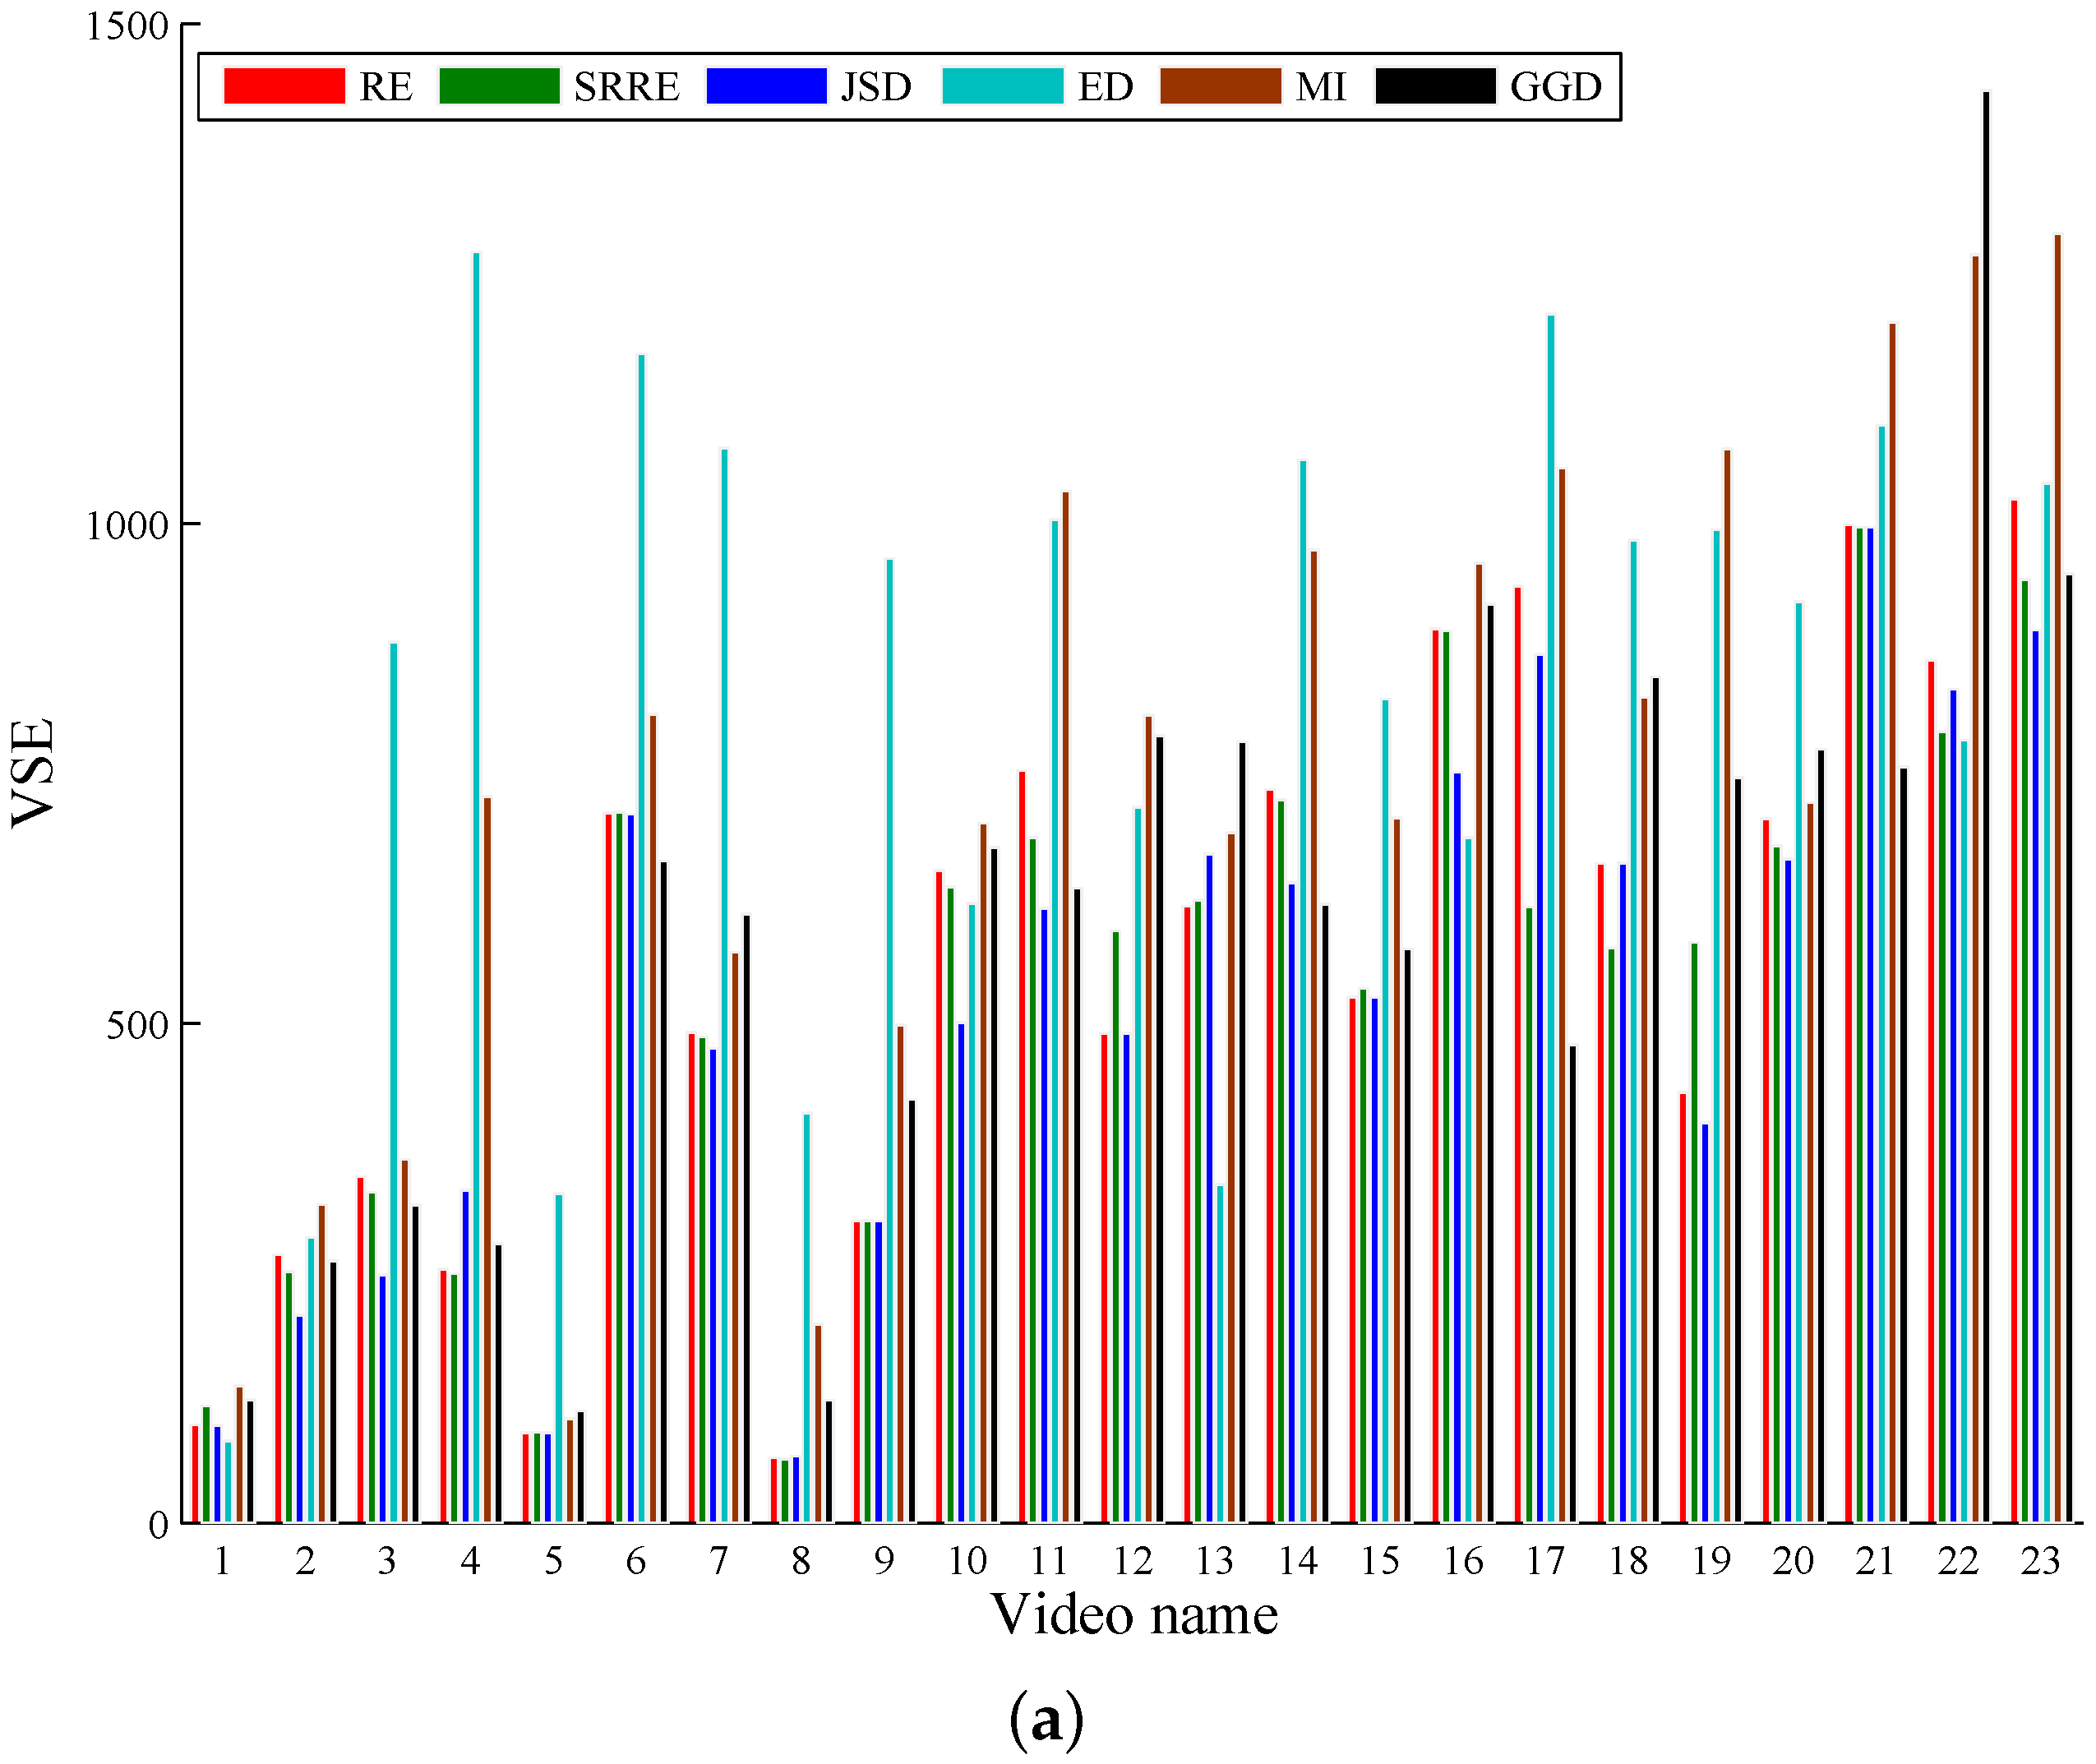
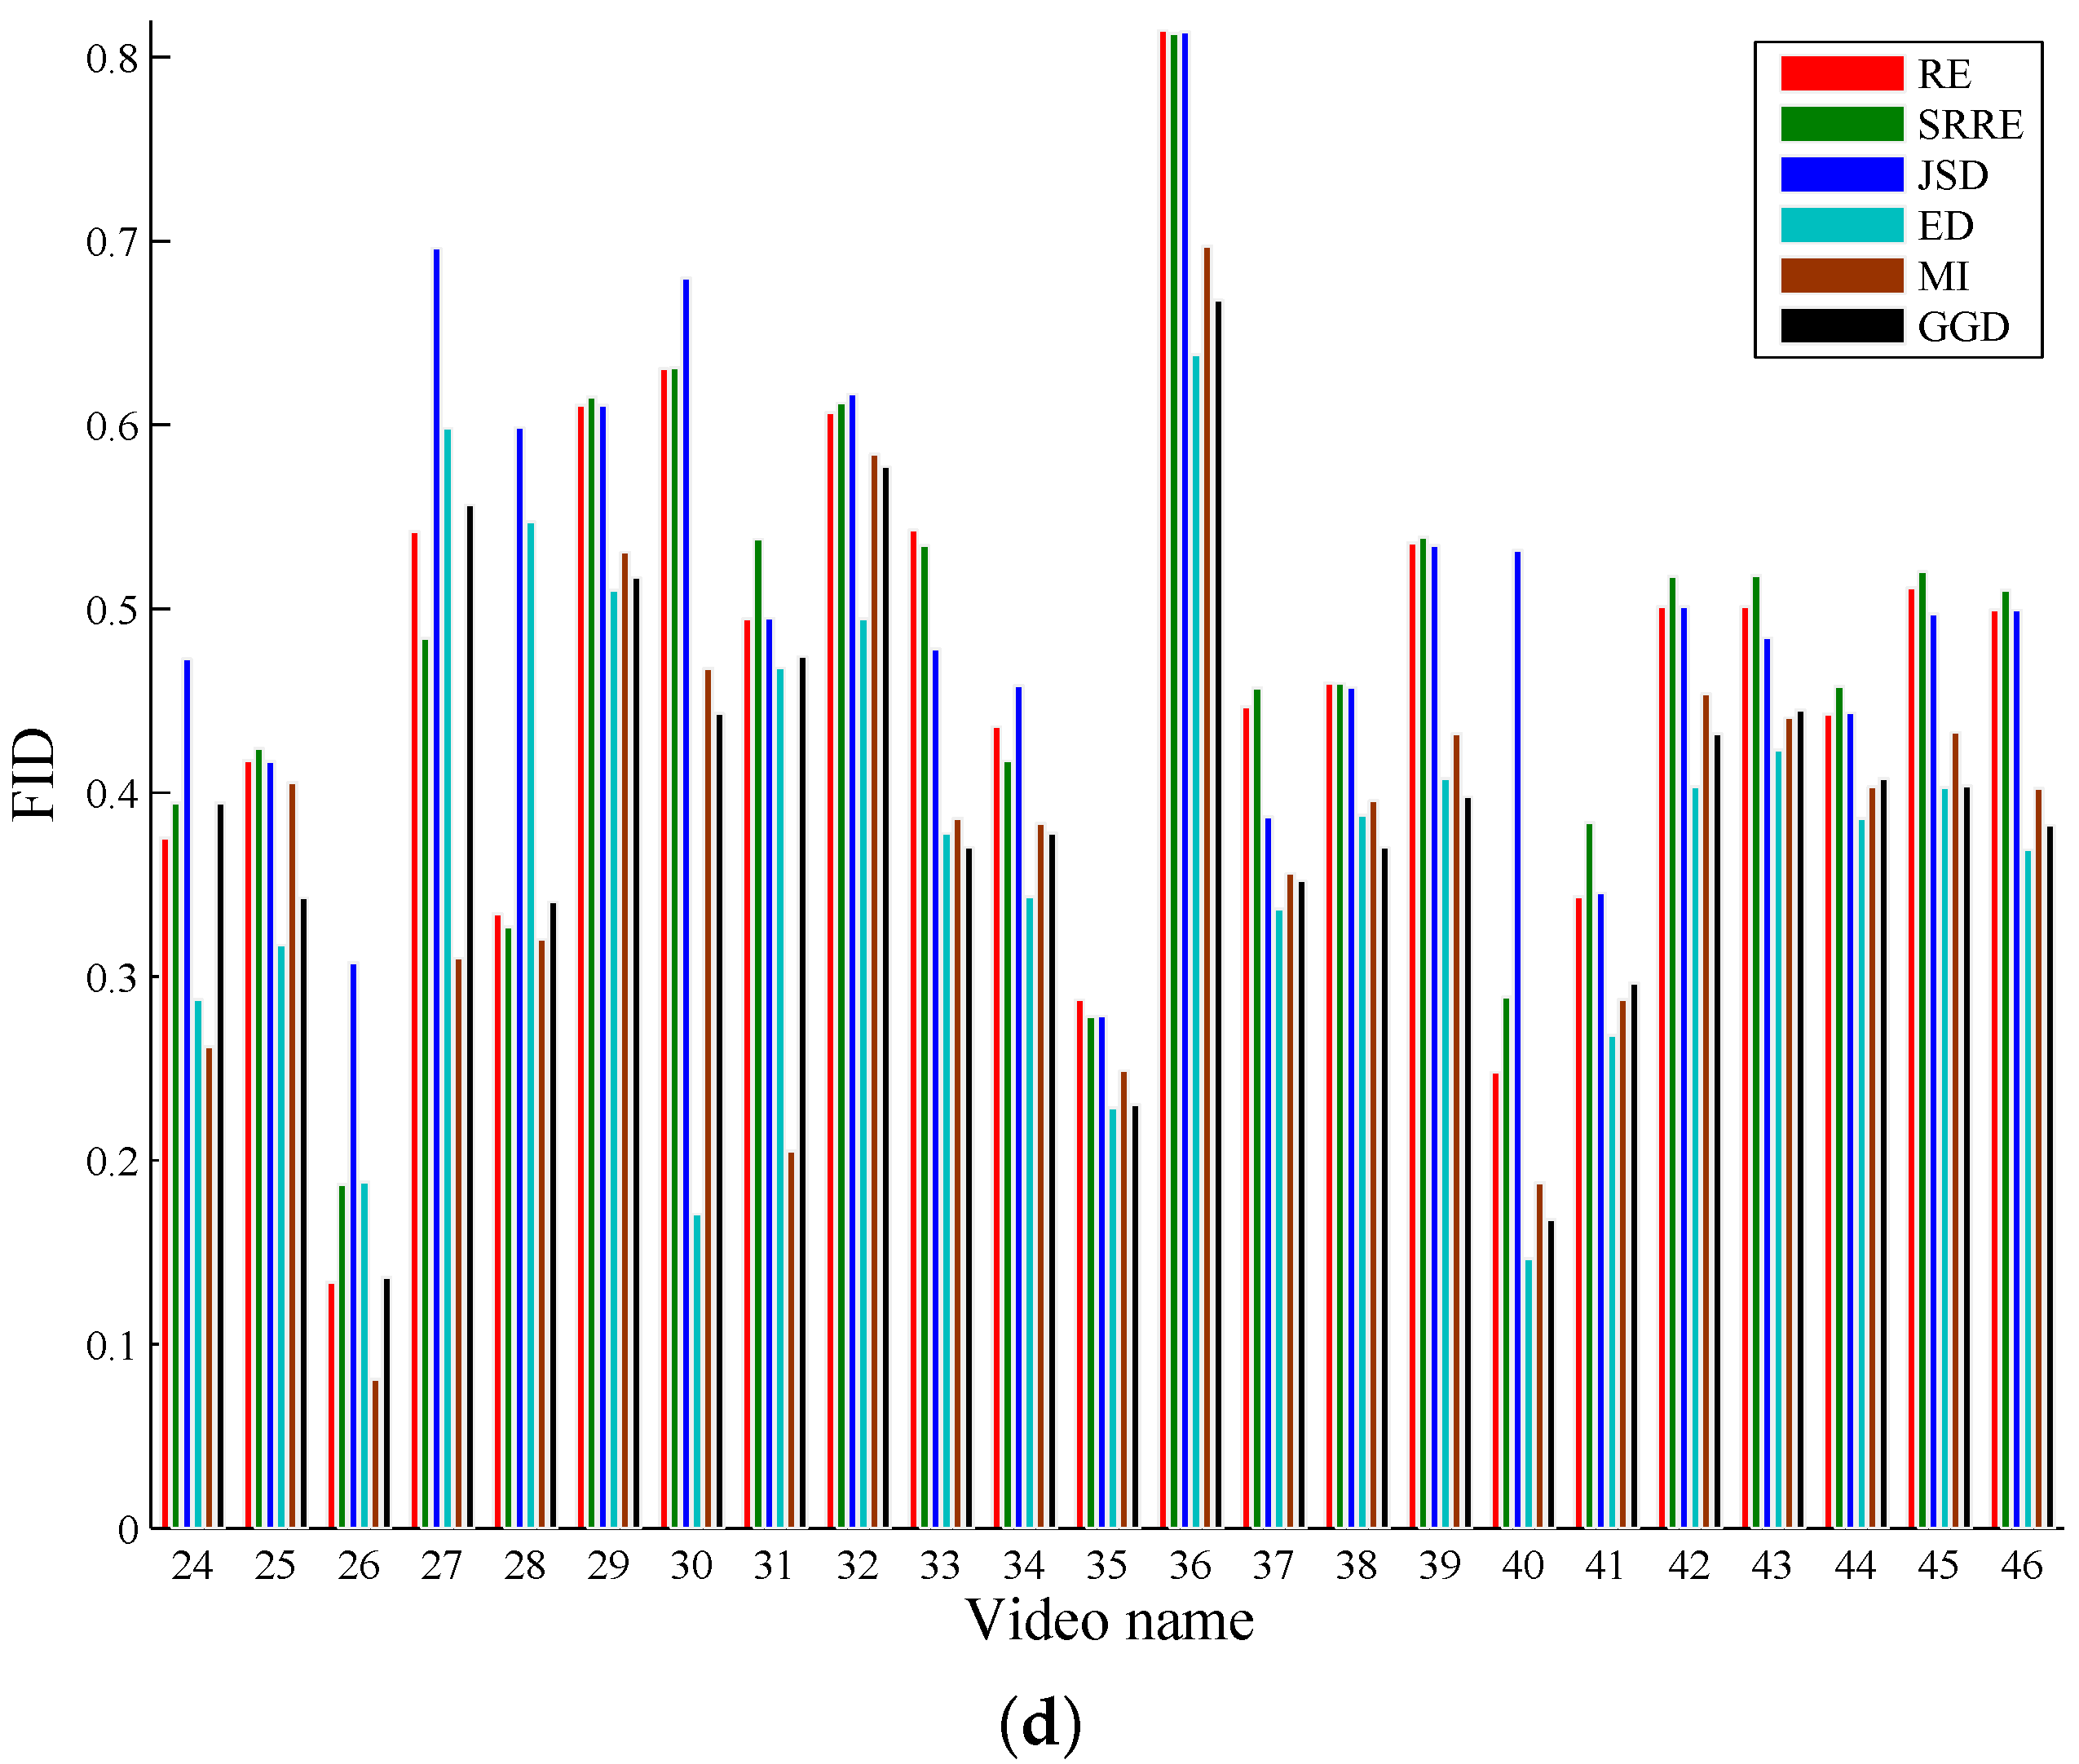
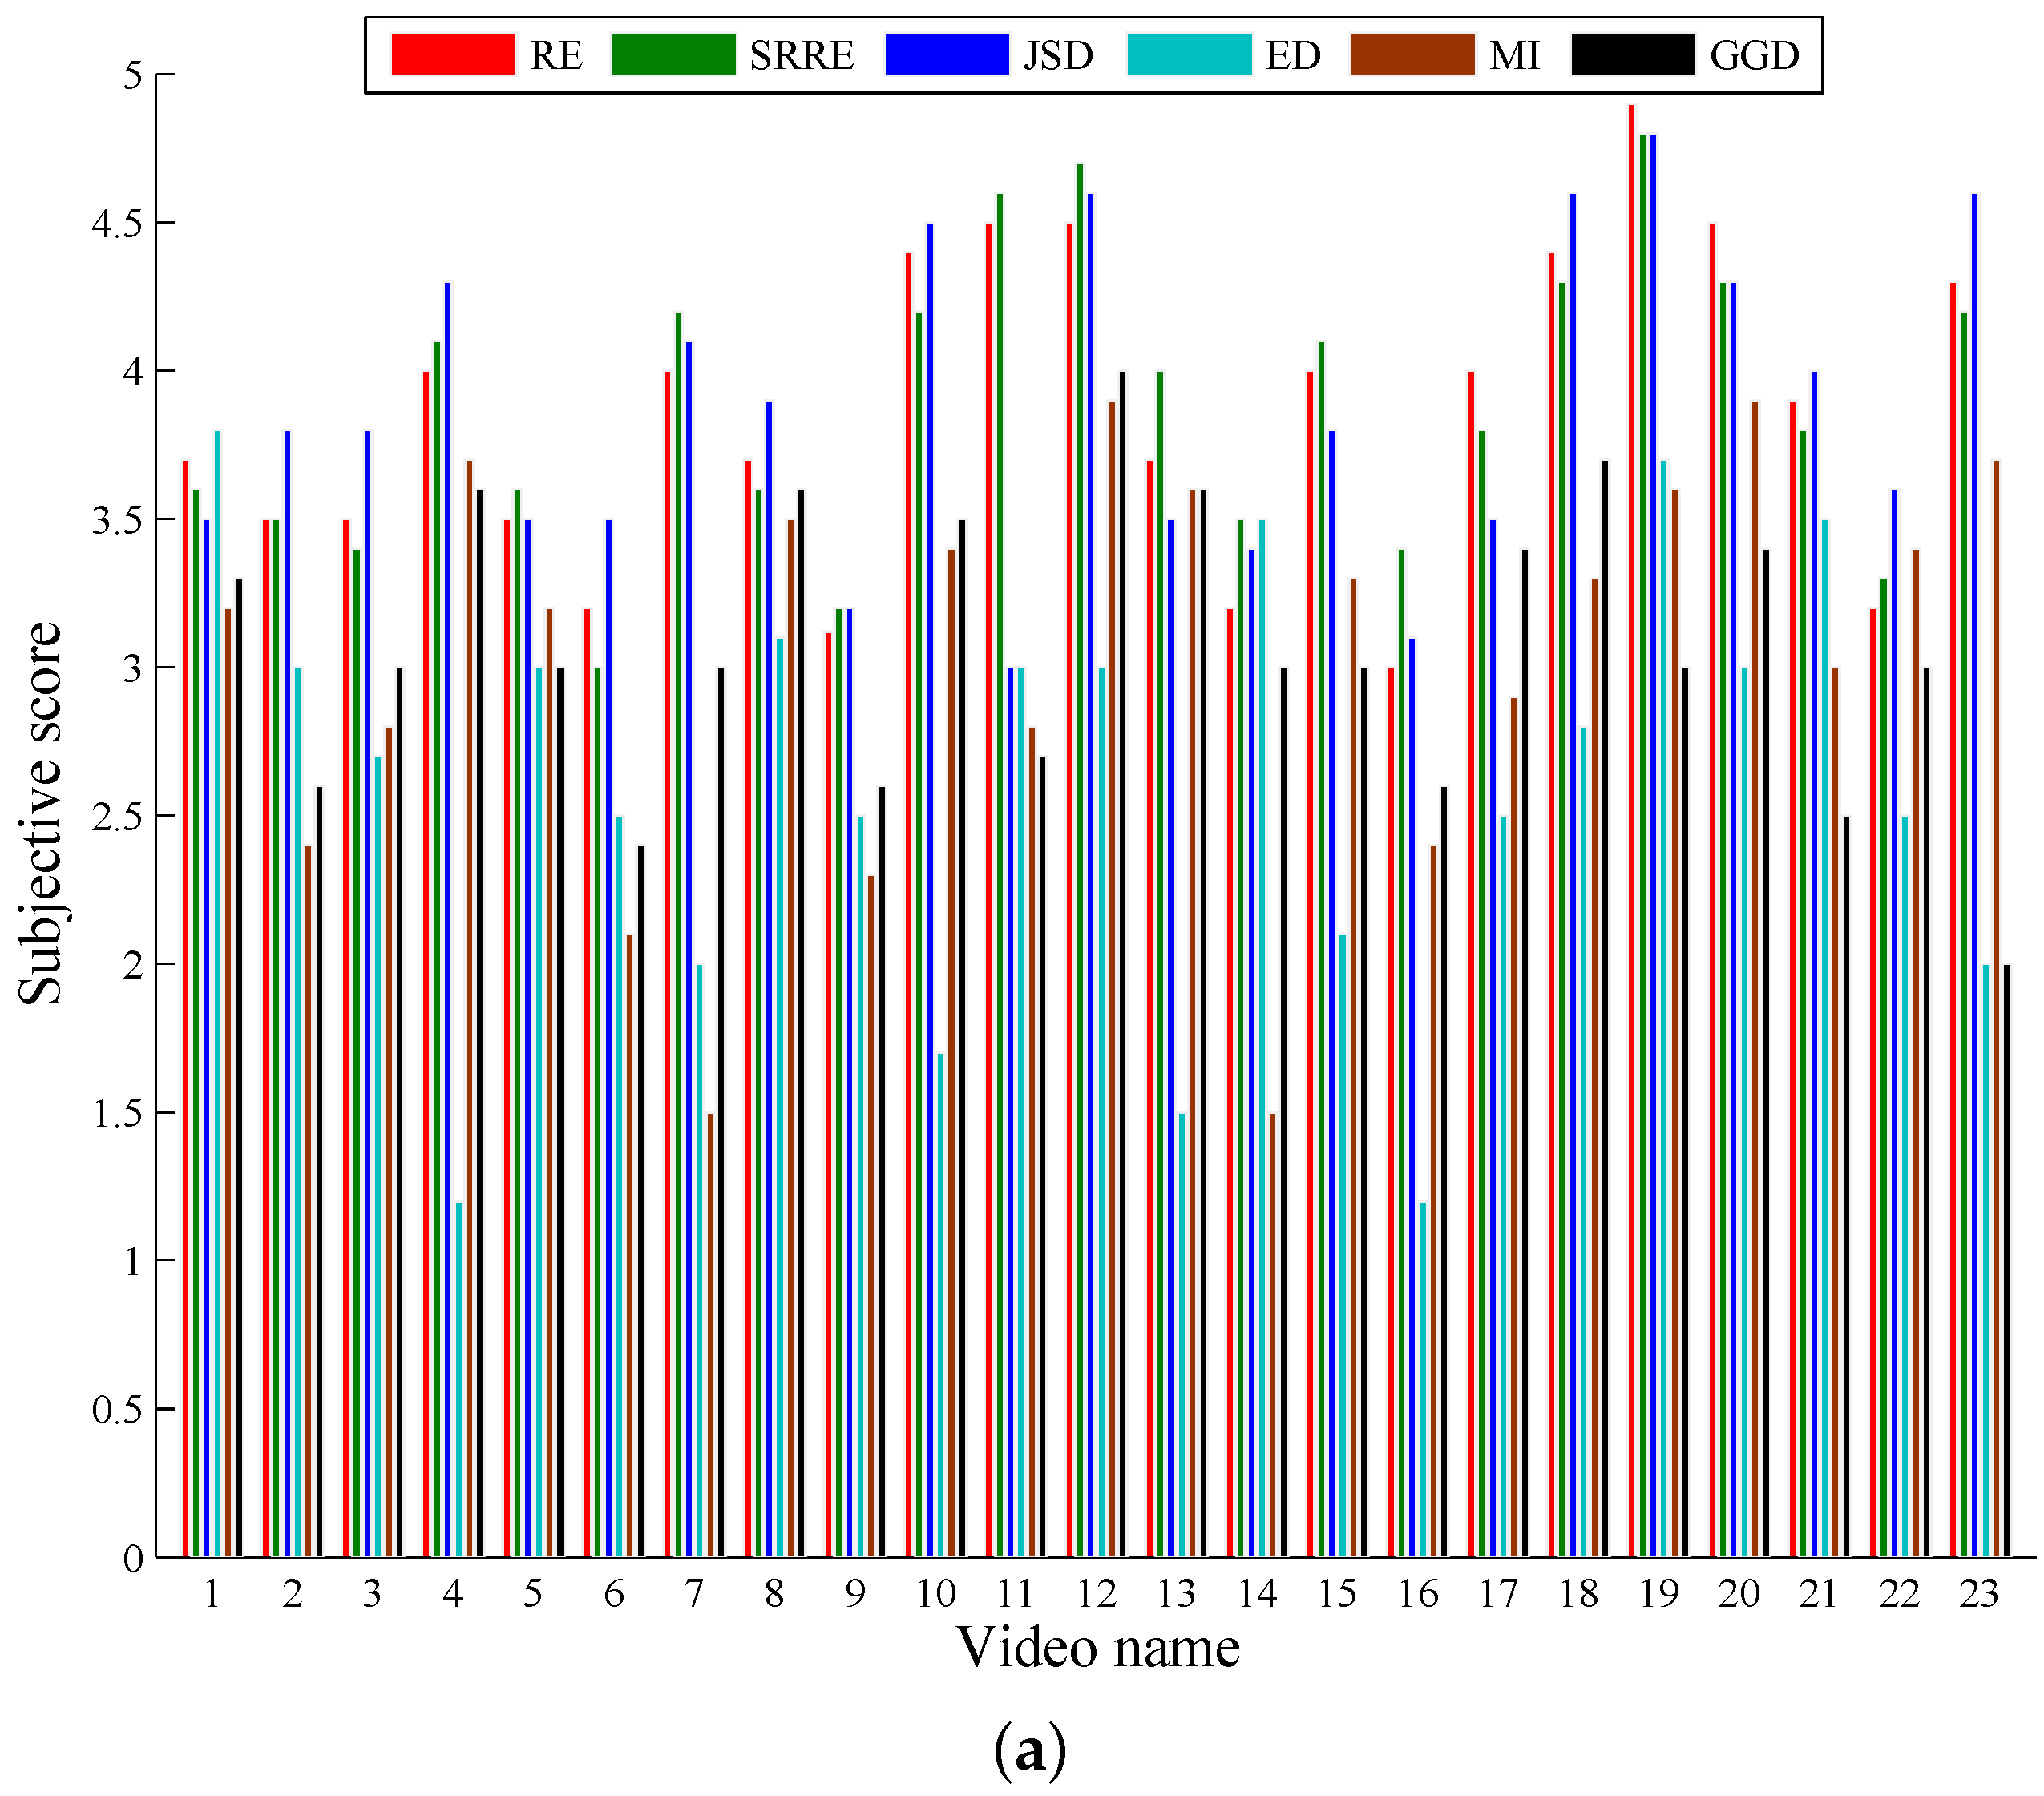
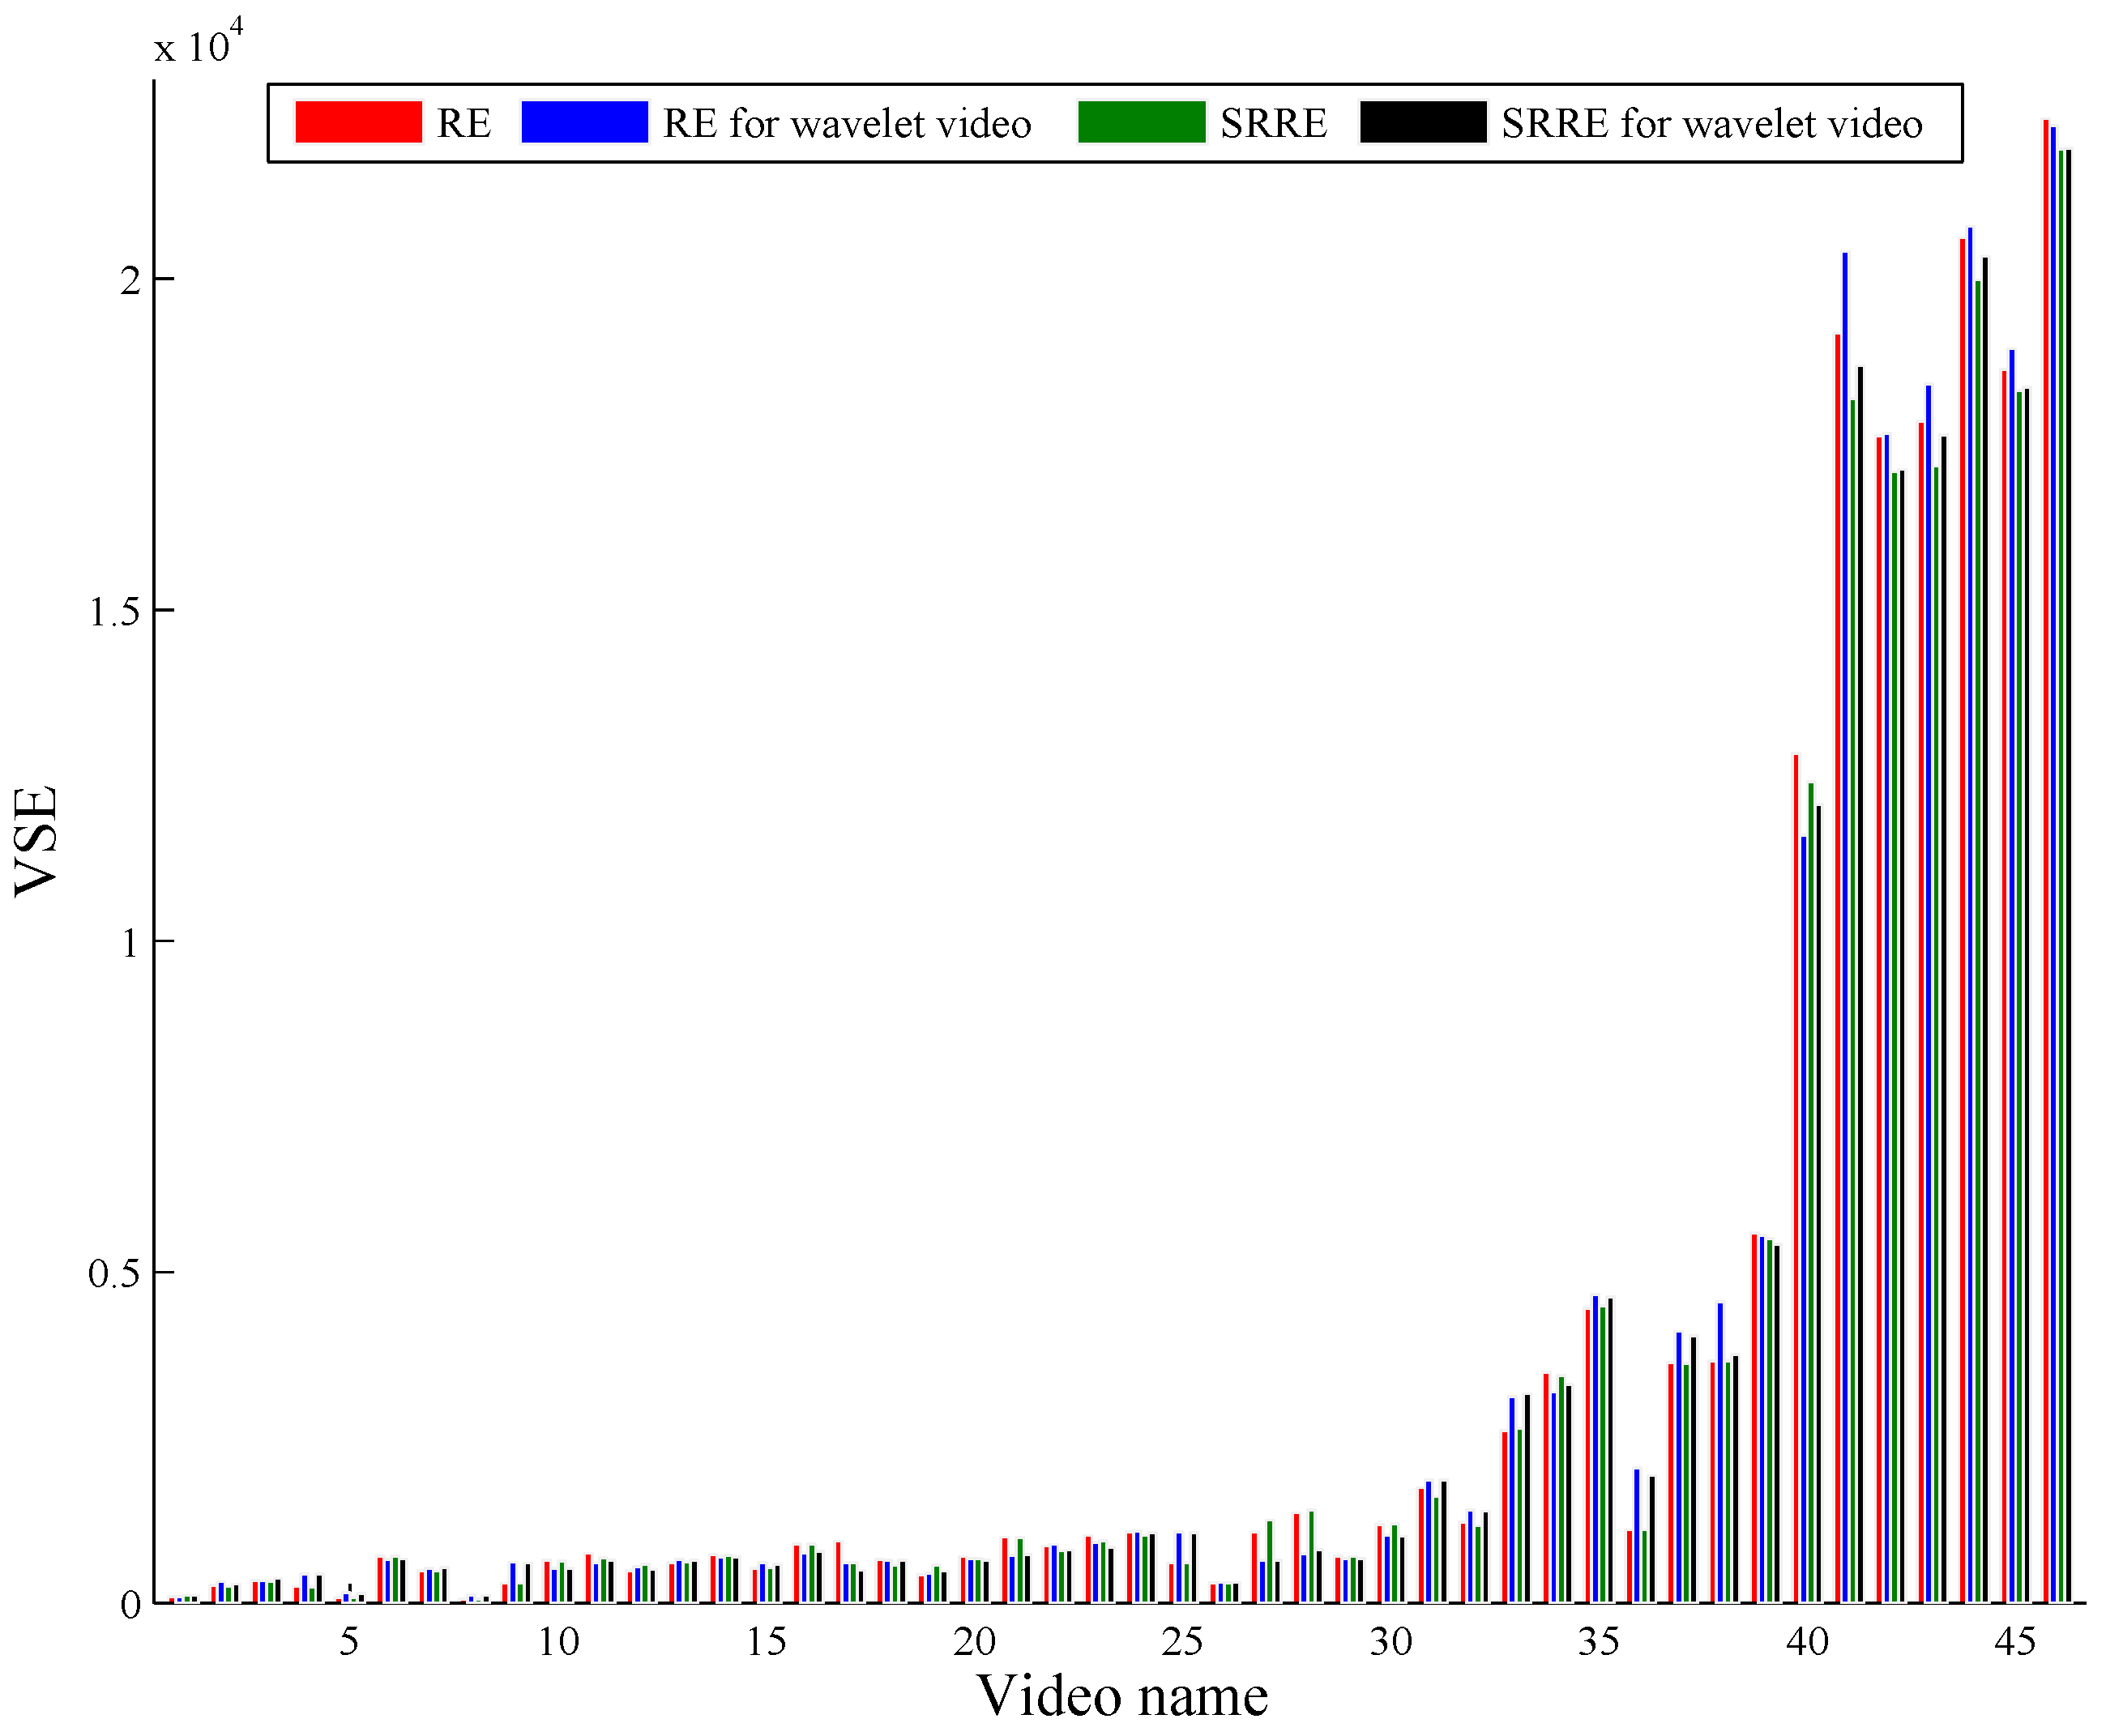
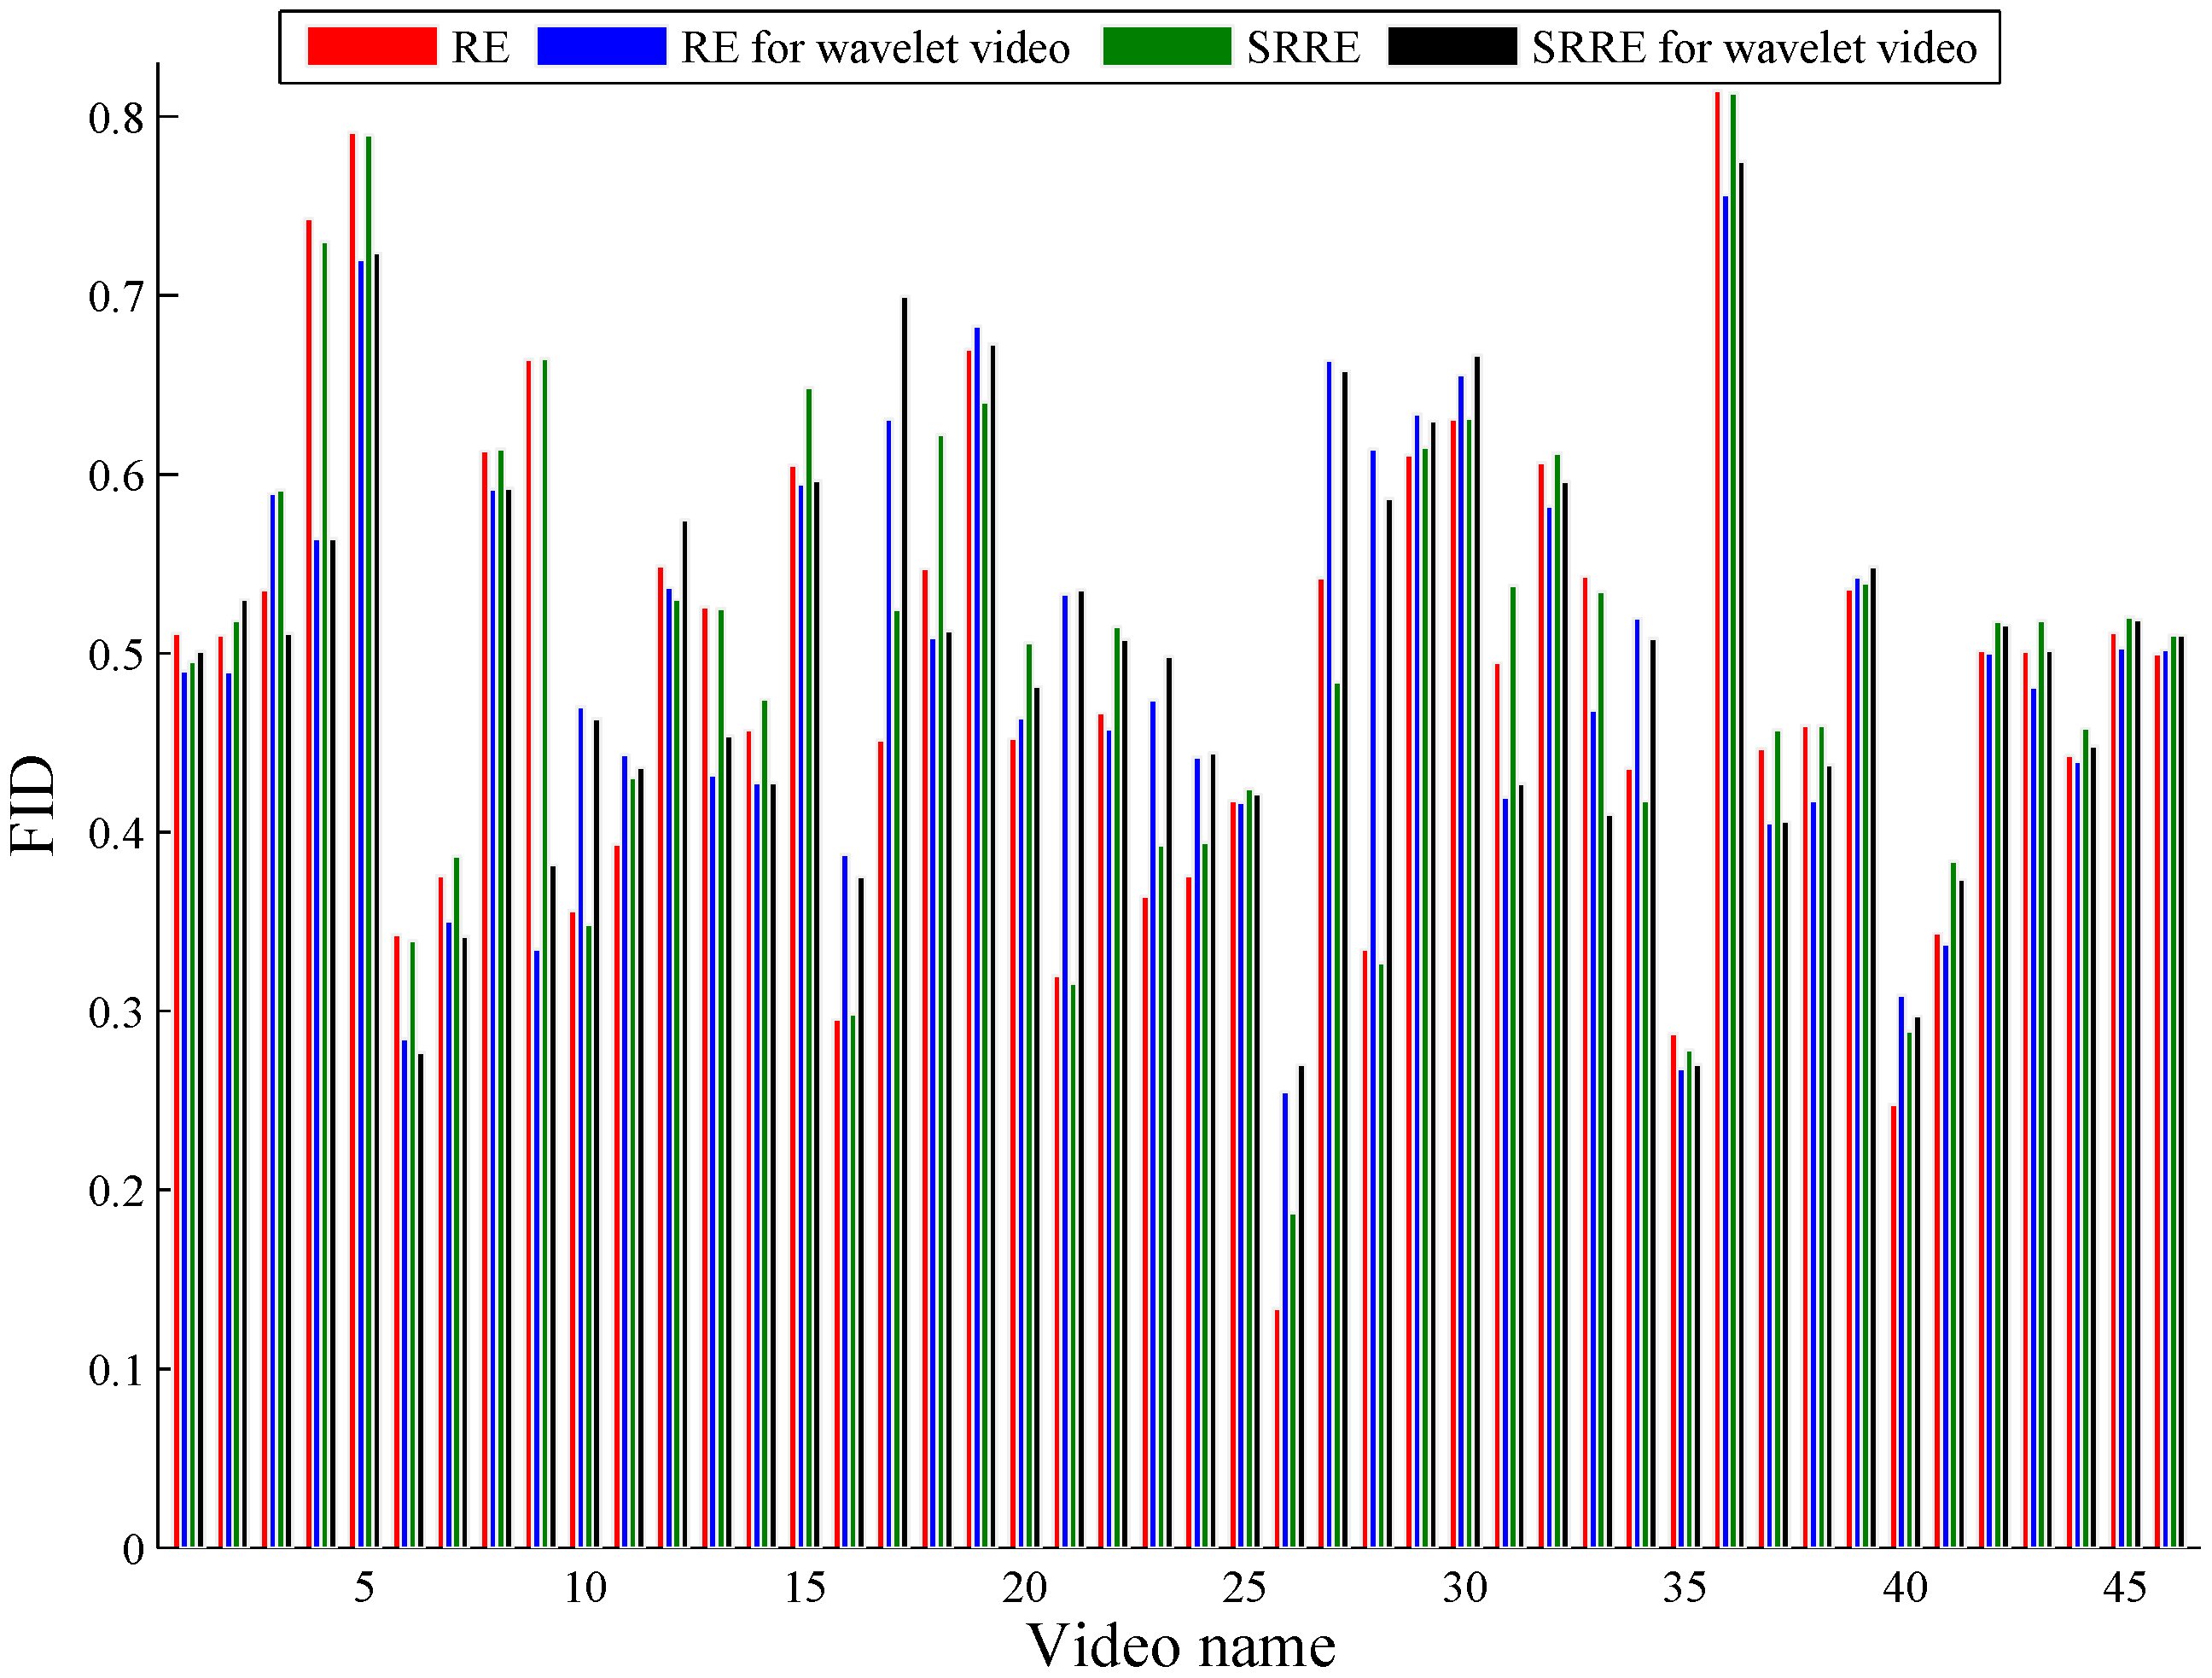
Two commonly-adopted criteria, video sampling error (VSE) [37] and fidelity (FID) [38,39], are applied to evaluate the quality of key frames for representing the original video by different key frame extraction approaches. Notice that we obtain the similarity between two images for calculating VSE and FID according to the second model explained in [40]. This model defines an image as the combination of the average, the standard deviation and the third root of the skewness of the pixel values. In addition, we carry out formal subjective experiments to evaluate the performances by all of the key frame selection algorithms. In this paper, we invite ten totally irrelevant students as referees to conduct a user study by giving ratings on different approaches. The referees are independent during the procedure and are asked to give performance evaluations of all of the methods with the score between one and five. Two major criteria provided for these referees to rank the quality of the key frames are: (1) good coverage of the whole video contents; (2) little redundancy between key frames. The final result is the average on all of the scores of ten referees.
As illustrated by the objective and subjective evaluations respectively shown in Figure 6 and Figure 7 and the average (Avg) and standard error (SE) on the objective and subjective results separately presented in Table 2 and Table 3, RE- and SRRE-based methods perform very close to the JSD-driven scheme, and furthermore, RE and SRRE behave better than JSD on some test videos. In addition, our method using RE and SRRE behaves largely better than the algorithms using ED, GGD and MI, and we analyze the reasons as follows. The coverage of the video content by the ED-based method is not satisfactory due to its computational logic. This method uses the accumulation of the differences of the adjacent video frames. If the video content changes are not evenly distributed over the whole sequence, the key frames by this method cannot cover the content well. The GGD-based technique just considers the finer scale coefficients to measure the distance between adjacent video frames, leading to the inaccuracy of shot detection, especially when the video includes rich content changes. As for the MI-based algorithm, the joint probability distribution needed by MI is sparse if large video content changes occur; then in this case, the distance between video images cannot be estimated satisfactorily.
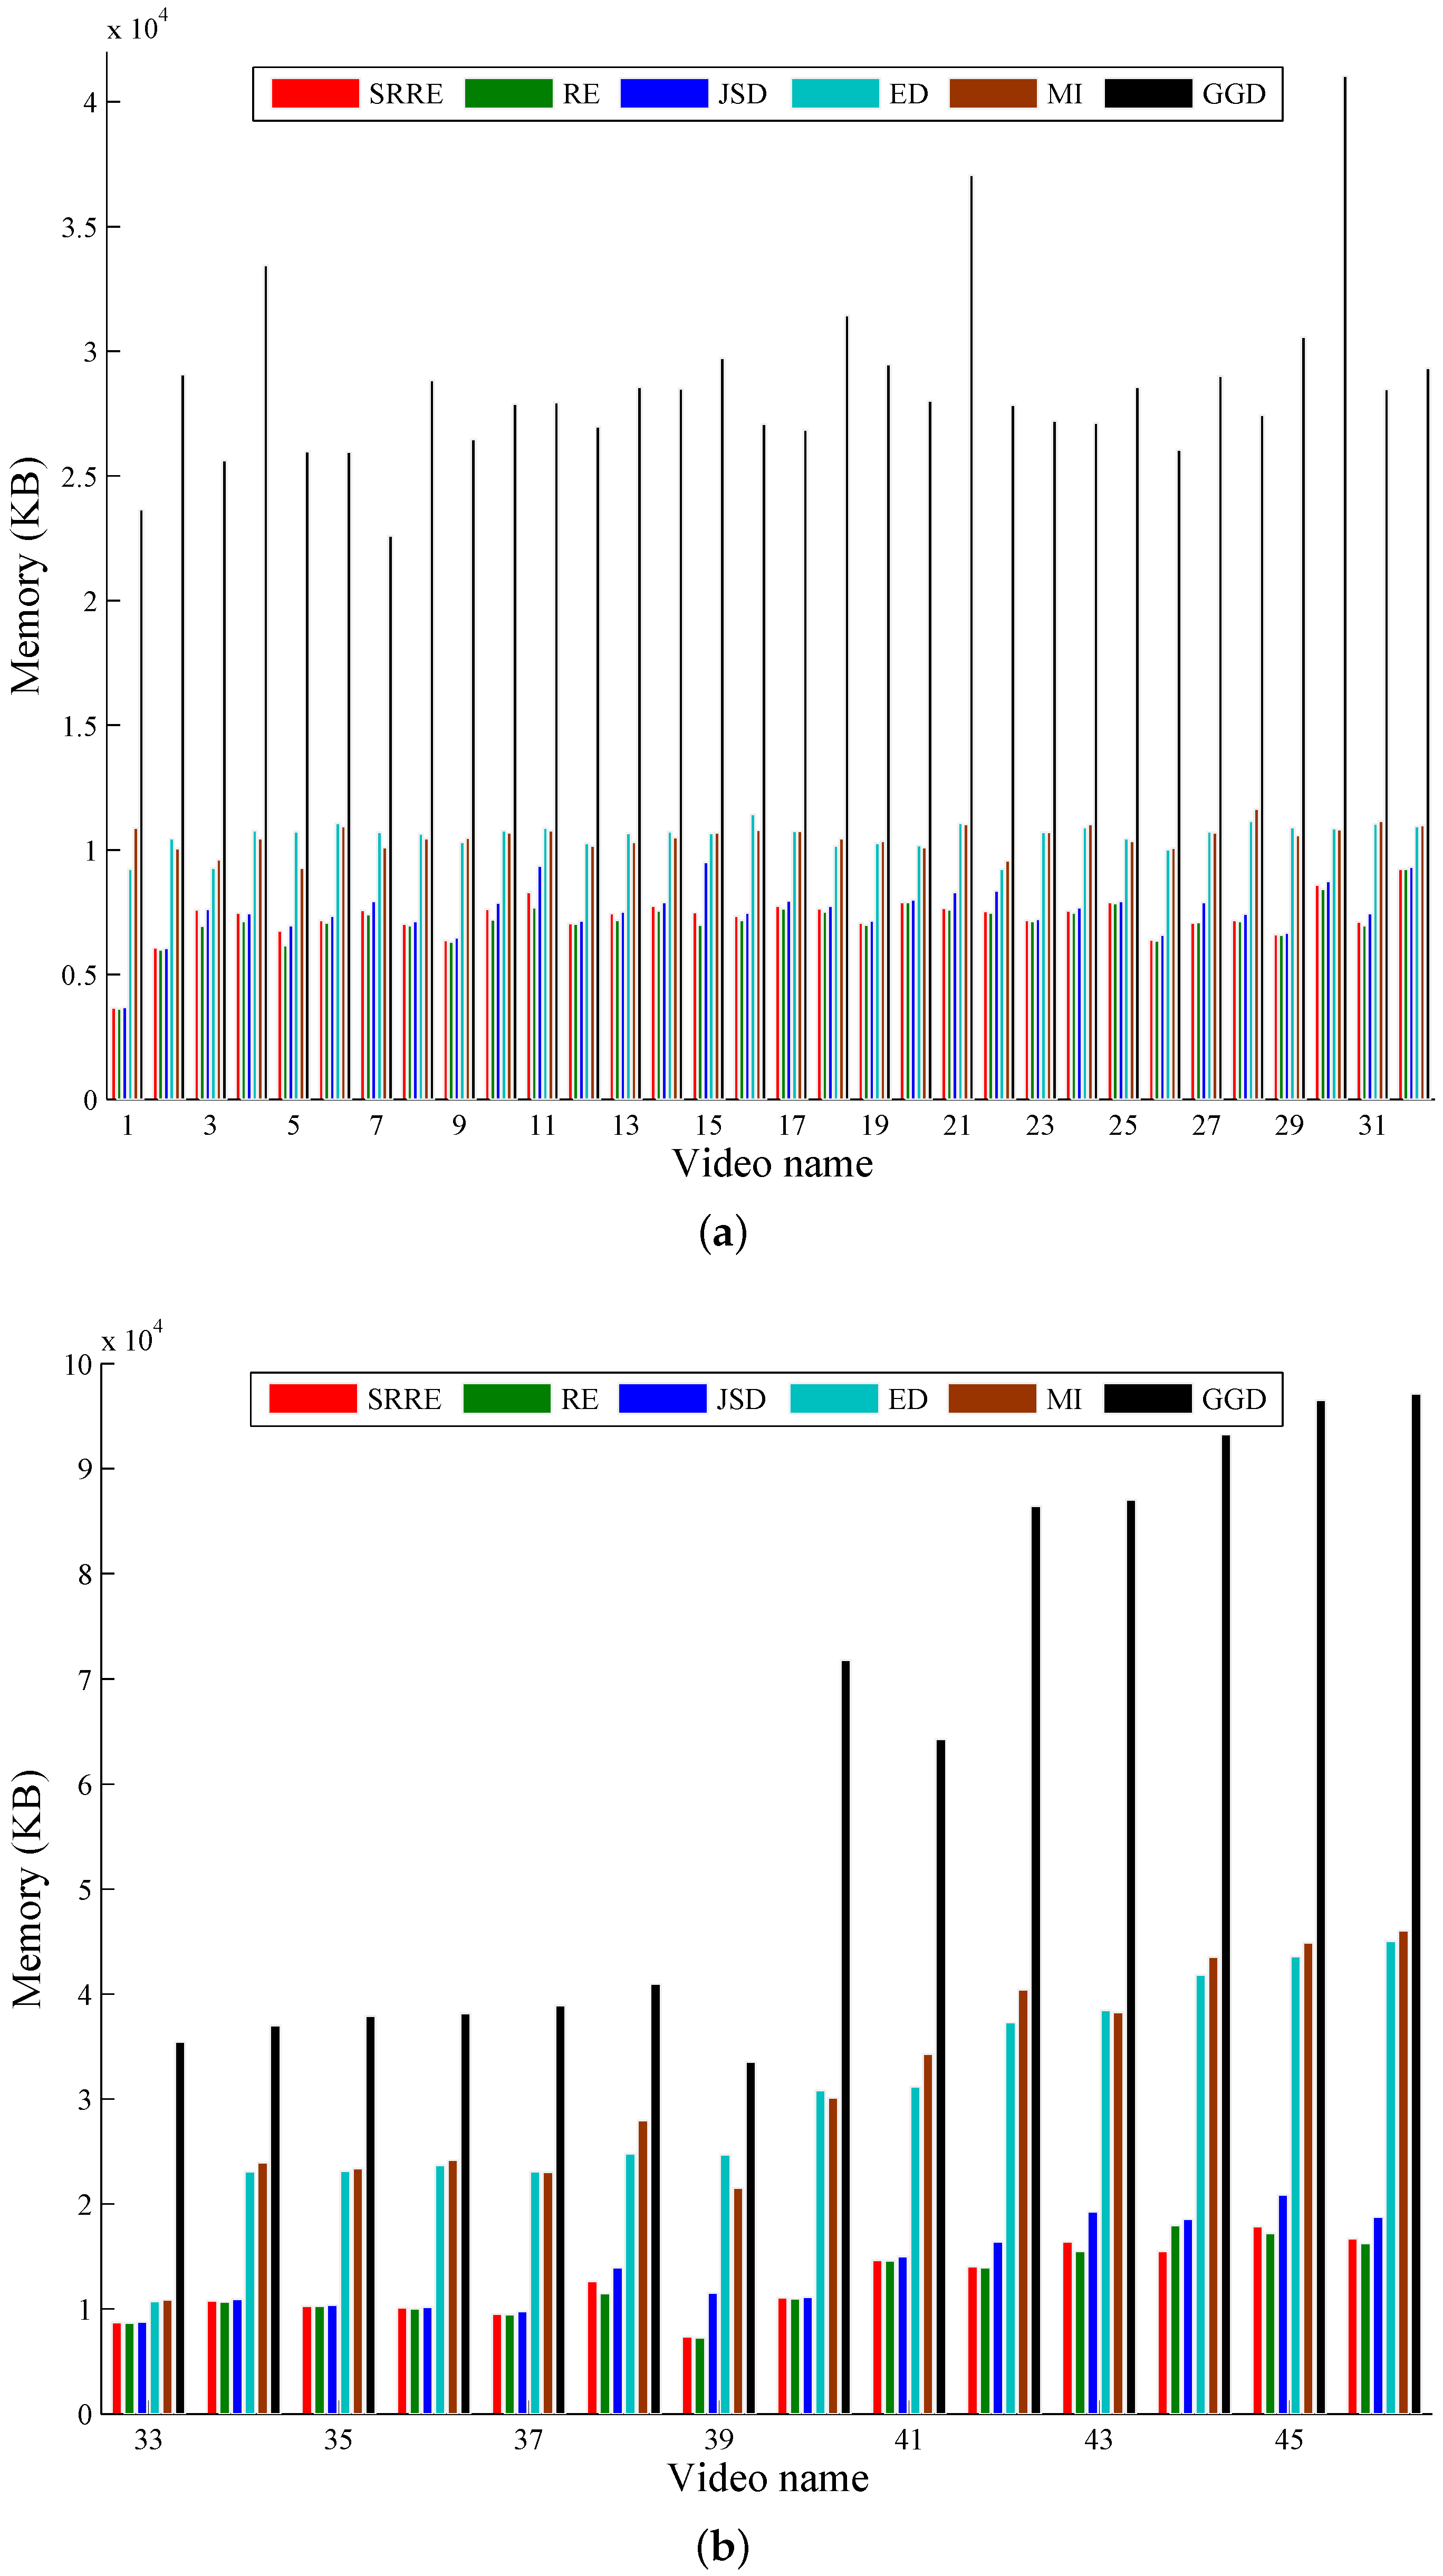
Especially, the proposed approaches using RE and SRRE run faster than the JSD-based technique. Notably, for example, on average, both RE- and SRRE-based methods use six seconds for extracting one key frame from 250 video images, while in this case, the JSD-driven scheme costs eight seconds, and we think this is because JSD needs more time to compute twice the KLD distance when measuring the distance between two frames. Surely, parallelism can be used for the computation of JSD, but unfortunately, the implementation complexity and some additional computational costs for parallelization limit its practical use, particularly considering that the purpose of the proposed technique is to do key frame selection on consumer computing platforms. The execution of other approaches for comparison is several times lower than the proposed technique. Runtime consumptions (in seconds) by different techniques are shown in Figure 8, and the average (Avg) and standard error (SE) on these runtime results are detailed in Table 4. Figure 9 presents the memory usage (in KB) by different methods, and Table 4 also lists the corresponding average (Avg) and standard error (SE) results. The memory cost by the JSD-based scheme is larger than those by the new algorithms using RE and SRRE, and the memory usage resulting from the approaches using ED, MI and GGD is much higher than that by the proposed technique.
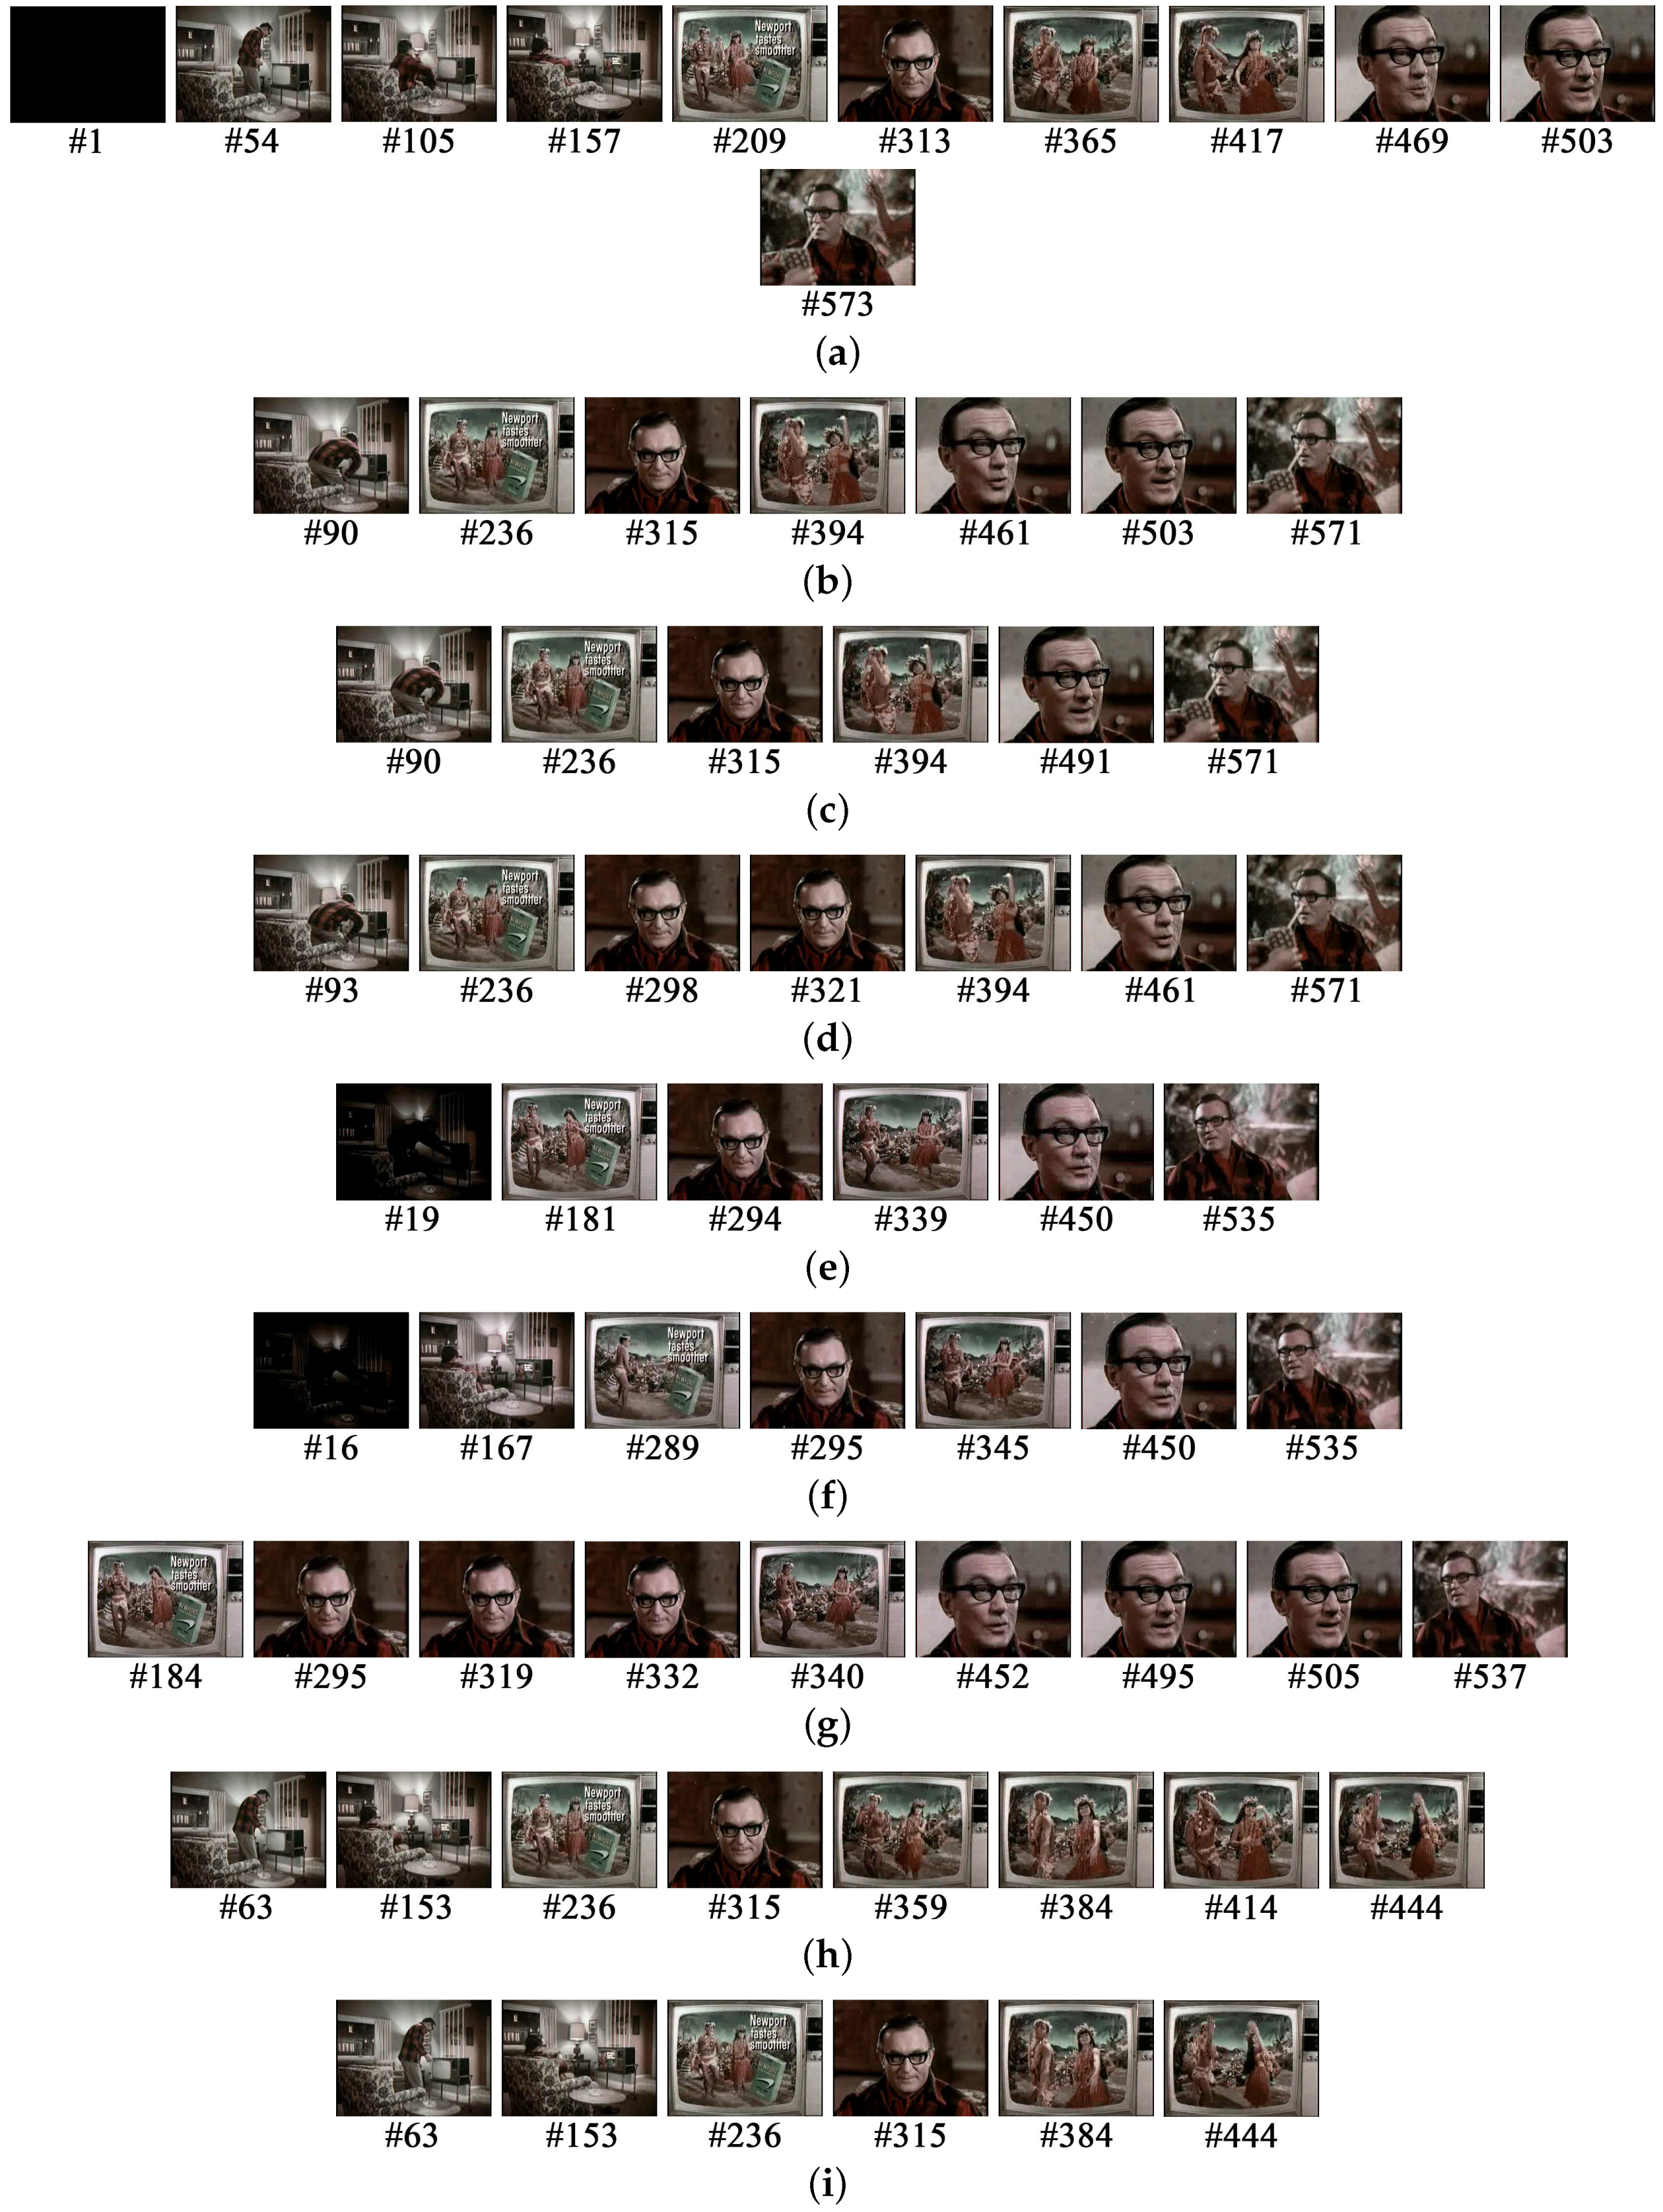
Visual results are compatible with the objective evaluations mentioned above, and Figure 10 gives such an example. It is obviously observable that the key frames obtained by the RE-, SRRE- and JSD-based methods can all represent and cover the original video very well. The visual appearance of the key frames by SRRE is better than that of the RE and JSD outputs, since both RE and JSD produce little repetition of similar key frames. This is exactly because the square root function can better handle the small distance between video images with small content changes. Apparently, the first frame, #19, and the last frame, #535, by the ED-based method cannot be the representatives of the video content. The GGD-based scheme performs unsatisfactorily; for example, the last key frame, #535, does not give the correct representation of the video content. The key frames selected by the algorithm based on MI include unnecessary redundancies, missing some information of the original video.
It should be pointed out that both the proposed RE-/SRRE-driven technique and our JSD-based previous work make use of the same computational logic, namely the shot/sub-shot division, for key frame extraction, because this is for dealing with video sequences of any kind in a simple, but effective way to make our underlying operational mechanism general enough. Please notice that, at first sight, RE/SRRE and JSD act as the distance measure of video frames in the same framework, but in spirit, our approaches respectively based on RE/SRRE and JSD do have significant distinctions from the point of view of algorithmic robustness. In reality, besides the reduced execution complexity by the utilization of RE and SRRE, the proposed key frame selection technique, compared to our previous method using JSD, largely improves its algorithm robustness and, thus, its practical usability for common users. To sum up, the proposed method achieves several important improvements, including the utilization of the extreme Studentized deviate (ESD) test and a corresponding adaptive correction for shot detection, smart ways for identifying sub-shots for both common and wavelet videos and multiscale video summarization for better presenting the video contents. These improvements have been detailed in Section 1.

5.2. A Performance Analysis on the Use of the Square Root Function

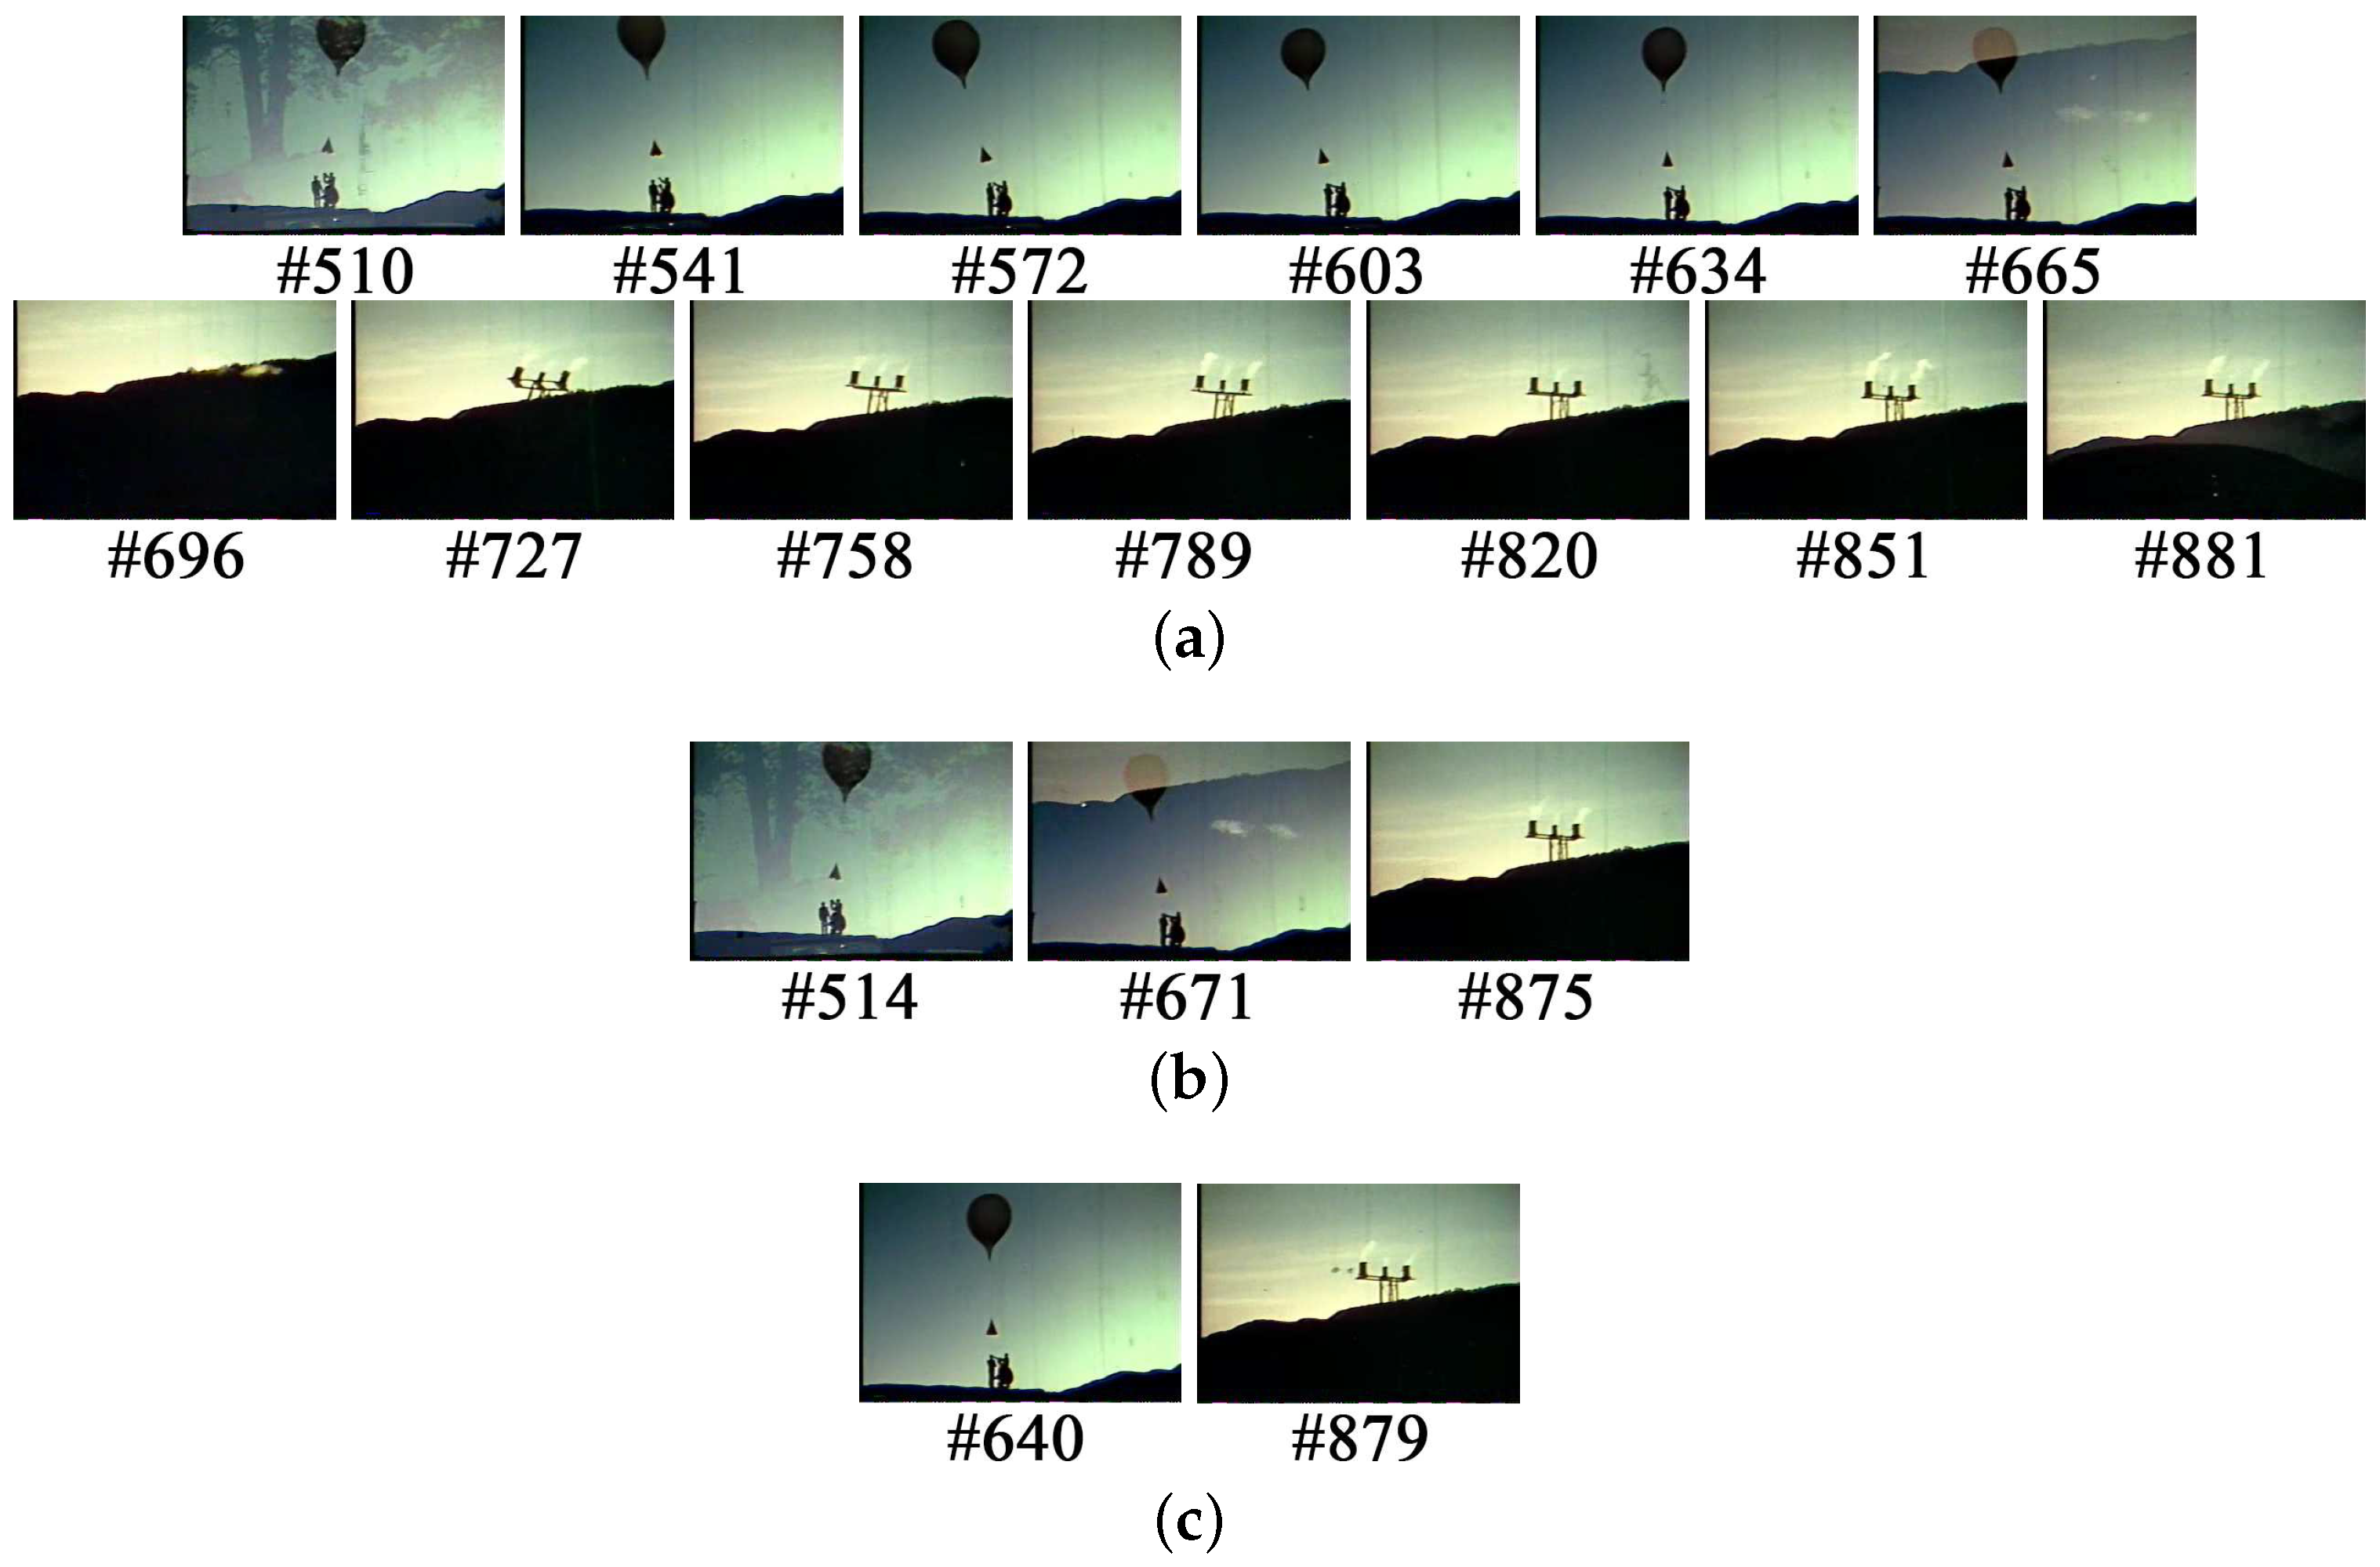
As shown in Figure 11 and Table 5, our proposed method using RE and SRRE performs almost the same in most test videos; whereas, for the video sequences with small content changes, the technique based on SRRE behaves more satisfactorily. This is because the square root “highlights” the distance between the video frames where the content changes by a small quantity. For example, the cloud moving can be clearly provided by the two frames #1097 and #1127 in Figure 12c by SRRE, but this is not supplied by RE. In addition, the frames #640 and #879 in Figure 13c by SRRE distinctly represent two different consecutive scenes, while an unsatisfactory overlapping of the two scenes appears in the results by RE.

5.3. A Discussion on Dealing with Wavelet Video by RE and SRRE

Figure 11 and Table 5 demonstrate that our method using RE and SRRE obtains reasonable key frames for common videos. Furthermore, as for the gradual transitions, both the RE- and SRRE-based algorithms perform better on wavelet video sequences than on common videos. For example, the last three frames in Figure 14b obtained from the common video exhibit an unsatisfactory redundancy for the gradual transition; whereas, for the wavelet video, the gradual transition is demonstrated by Frame #2275 (Figure 14c) only, without any redundancy. Frame #2190 in Figure 14c extracted from the wavelet video presents less scene overlapping compared to #2242 in Figure 14b selected from the common video. Additionally, an apparent content change presented by Frame #594 in Figure 15c from the wavelet video is missed in Figure 15b, indicating that the key frame selection by SRRE operated on the wavelet video is of better content coverage than on the common video. Notably, within a shot, gradual transitions usually make the partition of this shot rather complex. As a matter of fact, gradual transitions can be mainly reflected by the finest scale coefficients. Fortunately, our partitioning of a shot for the wavelet video is based on the pure use of finest scale coefficients. Thus, the proposed technique driven by RE and SRRE achieves more desirable performance for wavelet videos than for common videos. It is additionally worth pointing out that, for shot and sub-shot detections, the respective employments of coarsest and finest scale coefficients lead to a better efficiency than the use of both types of wavelet coefficients. Lastly, but also importantly, because wavelet-based compressed video data can be easily obtained and used in many application scenarios, our effort in using RE and SRRE for wavelet video sequences is obviously beneficial to the wide deployment of the proposed key frame selection approach.

6. Conclusion and Future Work

We have shown, by extensive experimentation, that the relative entropy (RE) and square root of RE (SRRE) perform very efficiently and effectively as measures for evaluating the distance between video frames, both on common and on wavelet video sequences. Based on the distances obtained, the extreme Studentized deviate (ESD) test and the proposed adaptive correction have proven their success in locating shot boundaries. We have also demonstrated that our method using SRRE is more suitable than RE for key frame selection in videos with small content changes. Our proposal of applying the coarsest and the finest scale coefficients, respectively, for shot and sub-shot detections has been proven to faithfully extract key frames from wavelet videos. Besides, our use of RE and SRRE for wavelet video sequences facilitates key frame selection on videos with gradual transitions. Finally, our technique can provide key frames at multiple scales, so that the balance between the redundancy and compactness offered by these key frames helps understand the video contents soundly and quickly.
Several improvements will be carried out in the future. Some measures that can be calculated faster will be explored to compute the distance between video frames. For instance, the maximum mean discrepancy [41] may be exploited for this goal. Image structure [42] can be taken into consideration for the distance calculation of video frames. Visualization and visual analytics [43] on multiscale key frames will be developed to ease the video browsing.

Acknowledgments

This work has been funded by the Natural Science Foundation of China (61471261, 61179067, U1333110) and by Grants TIN2013-47276-C6-1-R from the Spanish Government and 2014-SGR-1232 from the Catalan Government (Spain).

Author Contributions

Qing Xu conceived of and designed the experiments. Shihua Sun performed the experiments. Yuejun Guo, Qing Xu and Xiaoxiao Luo analyzed the data. Yuejun Guo, Qing Xu and Mateu Sbert wrote the paper.

Conflicts of Interest

The authors declare no conflict of interest.

References

  1. Comparison of Video Hosting Services. Available online: http://en.wikipedia.org/wiki/comparison_of_video_hosting_services (accessed on 8 January 2016).
  2. Barnes, C.; Goldman, D.B.; Shechtman, E.; Finkelstein, A. Video tapestries with continuous temporal zoom. ACM Trans. Graph. 2010. [Google Scholar] [CrossRef]
  3. Assa, J.; Caspi, Y.; Cohen-Or, D. Action synopsis: Pose selection and illustration. ACM Trans. Graph. 2005, 24, 667–676. [Google Scholar] [CrossRef]
  4. Schoeffmann, K.; Hudelist, M.A.; Huber, J. Video interaction tools: A survey of recent work. ACM Comput. Surv. 2015. [Google Scholar] [CrossRef]
  5. Truong, B.T.; Venkatesh, S. Video abstraction: A systematic review and classification. ACM Trans. Multimed. Comput. Commun. Appl. 2007. [Google Scholar] [CrossRef]
  6. Money, A.G.; Agius, H. Video summarisation: A conceptual framework and survey of the state of the art. J. Vis. Commun. Image Represent. 2008, 19, 121–143. [Google Scholar] [CrossRef]
  7. Ouellet, J.N.; Randrianarisoa, V. To watch or not to watch: Video summarization with explicit duplicate elimination. In Proceedings of the 2011 Canadian Conference on Computer and Robot Vision, St. John’s, NL, Canada, 25–27 May 2011; pp. 340–346.
  8. Souza, C.L.; Pádua, F.L.C.; Nunes, C.F.G.; Assis, G.T.; Silva, G.D. A unified approach to content-based indexing and retrieval of digital videos from television archives. Artif. Intell. Res. 2014, 3, 49–61. [Google Scholar] [CrossRef]
  9. Escolano, F.; Suau, P.; Bonev, B. Information Theory in Computer Vision and Pattern Recognition; Springer: London, UK, 2009. [Google Scholar]
  10. Feixas, M.; Bardera, A.; Rigau, J.; Xu, Q.; Sbert, M. Information Theory Tools for Image Processing; Morgan & Claypool: San Rafael, CA, USA, 2014. [Google Scholar]
  11. Mentzelopoulos, M.; Psarrou, A. Key-frame extraction algorithm using entropy difference. In Proceedings of the 6th ACM SIGMM International Workshop on Multimedia Information Retrieval, New York, NY, USA, 15–16 October 2004; ACM: New York, NY, USA, 2004; pp. 39–45. [Google Scholar]
  12. C̆erneková, Z.; Pitas, I.; Nikou, C. Information theory-based shot cut/fade detection and video summarization. IEEE Trans. Circuits Syst. Video Technol. 2006, 16, 82–91. [Google Scholar] [CrossRef]
  13. Omidyeganeh, M.; Ghaemmaghami, S.; Shirmohammadi, S. Video keyframe analysis using a segment-based statistical metric in a visually sensitive parametric space. IEEE Trans. Image Process. 2011, 20, 2730–2737. [Google Scholar] [CrossRef] [PubMed]
  14. Xu, Q.; Liu, Y.; Li, X.; Yang, Z.; Wang, J.; Sbert, M.; Scopigno, R. Browsing and exploration of video sequences: A new scheme for key frame extraction and 3D visualization using entropy based Jensen divergence. Inf. Sci. 2014, 278, 736–756. [Google Scholar] [CrossRef]
  15. Chen, W.; Chang, S.F. Motion trajectory matching of video objects. Proc. SPIE 1999. [Google Scholar] [CrossRef]
  16. Li, L.; Xu, Q.; Luo, X.; Sun, S. Key frame selection based on KL-divergence. In Proceedings of the 2015 IEEE International Conference on Multimedia Big Data, Beijing, China, 20–22 April 2015; pp. 337–341.
  17. Cover, T.M.; Thomas, J.A. Elements of Information Theory, 2nd ed.; John Wiley & Sons: Hoboken, NJ, USA, 2012. [Google Scholar]
  18. Rosner, B. On the detection of many outliers. Technometrics 1975, 17, 221–227. [Google Scholar] [CrossRef]
  19. Lienhart, R.; Pfeiffer, S.; Effelsberg, W. Video abstracting. Commun. ACM 1997, 40, 54–62. [Google Scholar] [CrossRef]
  20. Cotsaces, C.; Nikolaidis, N.; Pitas, I. Video shot detection and condensed representation: A review. IEEE Signal Process. Mag. 2006, 23, 28–37. [Google Scholar] [CrossRef]
  21. Vila, M.; Bardera, A.; Feixas, M.; Sbert, M. Tsallis mutual information for document classification. Entropy 2011, 13, 1694–1707. [Google Scholar] [CrossRef]
  22. Li, Y.; Lee, S.H.; Yeh, C.H.; Kuo, C.J. Techniques for movie content analysis and skimming: Tutorial and overview on video abstraction techniques. IEEE Signal Process. Mag. 2006, 23, 79–89. [Google Scholar]
  23. Liang, K.C.; Kuo, C.J. Retrival and progressive transmission of wavelet compressed images. In Proceedings of the 1997 IEEE International Symposium on Circuits and Systems, Hong Kong, China, 9–12 June 1997; Volume 2, pp. 1467–1467.
  24. Johnson, D.H. Information Theory and Neural Information Processing. IEEE Trans. Inf. Theory 2010, 56, 653–666. [Google Scholar] [CrossRef]
  25. Johnson, D.H.; Gruner, C.M.; Baggerly, K.; Seshagiri, C. Information-theoretic analysis of neural coding. J. Comput. Neurosci. 2001, 10, 47–69. [Google Scholar] [CrossRef] [PubMed]
  26. Lin, J. Divergence Measures Based on the Shannon Entropy. IEEE Trans. Inf. Theory 1991, 37, 145–151. [Google Scholar] [CrossRef]
  27. Yang, Y.; Barron, A. Information theoretic determination of minimax rates of convergence. Ann. Stat. 1999, 27, 1546–1599. [Google Scholar]
  28. Hanjalic, A. Shot-boundary detection: Unraveled and resolved? IEEE Trans. Circuits Syst. Video Technol. 2002, 12, 90–105. [Google Scholar] [CrossRef]
  29. Grubbs, F.E. Sample Criteria for Testing Outlying Observations. Ann. Math. Stat. 1950, 21, 27–58. [Google Scholar] [CrossRef]
  30. Verma, S.P.; Quiroz-Ruiz, A. Critical values for six Dixon tests for outliers in normal samples up to sizes 100, and applications in science and engineering. Rev. Mex. Cienc. Geol. 2006, 23, 133–161. [Google Scholar]
  31. Stigler, S.M. Gergonne’s 1815 paper on the design and analysis of polynomial regression experiments. Hist. Math. 1974, 1, 431–439. [Google Scholar] [CrossRef]
  32. Yeo, B.L.; Liu, B. Rapid Scene Analysis on Compressed Video. IEEE Trans. Circuits Syst. Video Technol. 1995, 5, 533–544. [Google Scholar]
  33. Koprinska, I.; Carrato, S. Video segmentation of MPEG compressed data. In Proceedings of the IEEE International Conference on Electronics, Circuits and Systems, Lisboa, Portugal, 7–10 September 1998; Volume 2, pp. 243–246.
  34. Hürst, W.; Hoet, M. Sliders versus storyboards—Investigating interaction design for mobile video browsing. In MultiMedia Modeling; Springer International Publishing: Cham, Switzerland, 2015; Volume 8936, pp. 123–134. [Google Scholar]
  35. Starch, D. A demonstration of the trial and error method of learning. Psychol. Bull. 1910, 7, 20–23. [Google Scholar] [CrossRef]
  36. Open-Video. Available online: http://www.open-video.org/index.php (accessed on 10 October 2012).
  37. Liu, T.; Kender, J.R. Computational Approaches to Temporal Sampling of Video Sequences. ACM Trans. Multimed. Comput. Commun. Appl. 2007, 3, 217–218. [Google Scholar] [CrossRef]
  38. Chang, H.S.; Sull, S.; Lee, S.U. Efficient video indexing scheme for content-based retrieval. IEEE Trans. Circuits Syst. Video Technol. 1999, 9, 1269–1279. [Google Scholar] [CrossRef]
  39. Gianluigi, C.; Raimondo, S. An innovative algorithm for key frame extraction in video summarization. J. Real-Time Image Process. 2006, 1, 69–88. [Google Scholar] [CrossRef]
  40. Stricker, M.A.; Orengo, M. Similarity of color images. In Proceedings of the IS&T/SPIE’s Symposium on Electronic Imaging: Science & Technology; International Society for Optics and Photonics, San Jose, CA, 27 January–2 February 1996; Volume 2420, pp. 381–392.
  41. Gangeh, M.J.; Sadeghi-Naini, A.; Diu, M.; Tadayyon, H.; Kamel, M.S.; Czarnota, G.J. Categorizing Extent of Tumour Cell Death Response to Cancer Therapy Using Quantitative Ultrasound Spectroscopy and Maximum Mean Discrepancy. IEEE Trans. Med. Imaging 2014, 33, 1390–1400. [Google Scholar] [CrossRef] [PubMed]
  42. Geusebroek, J.M.; van den Boomgaard, R.; Smeulders, A.W.M.; Dev, A. Color and scale: The spatial structure of color images. In Computer Vision-ECCV 2000; Springer: Berlin, Germany, 2000; Volume 1842, pp. 331–341. [Google Scholar]
  43. May, R.; Hanrahan, P.; Keim, D.A.; Shneiderman, B.; Card, S. The state of visual analytics: Views on what visual analytics is and where it is going. In Proceedings of the 2010 IEEE Symposium on Visual Analytics Science and Technology (VAST), Salt Lake City, UT, USA, 25–26 October 2010; pp. 257–259.
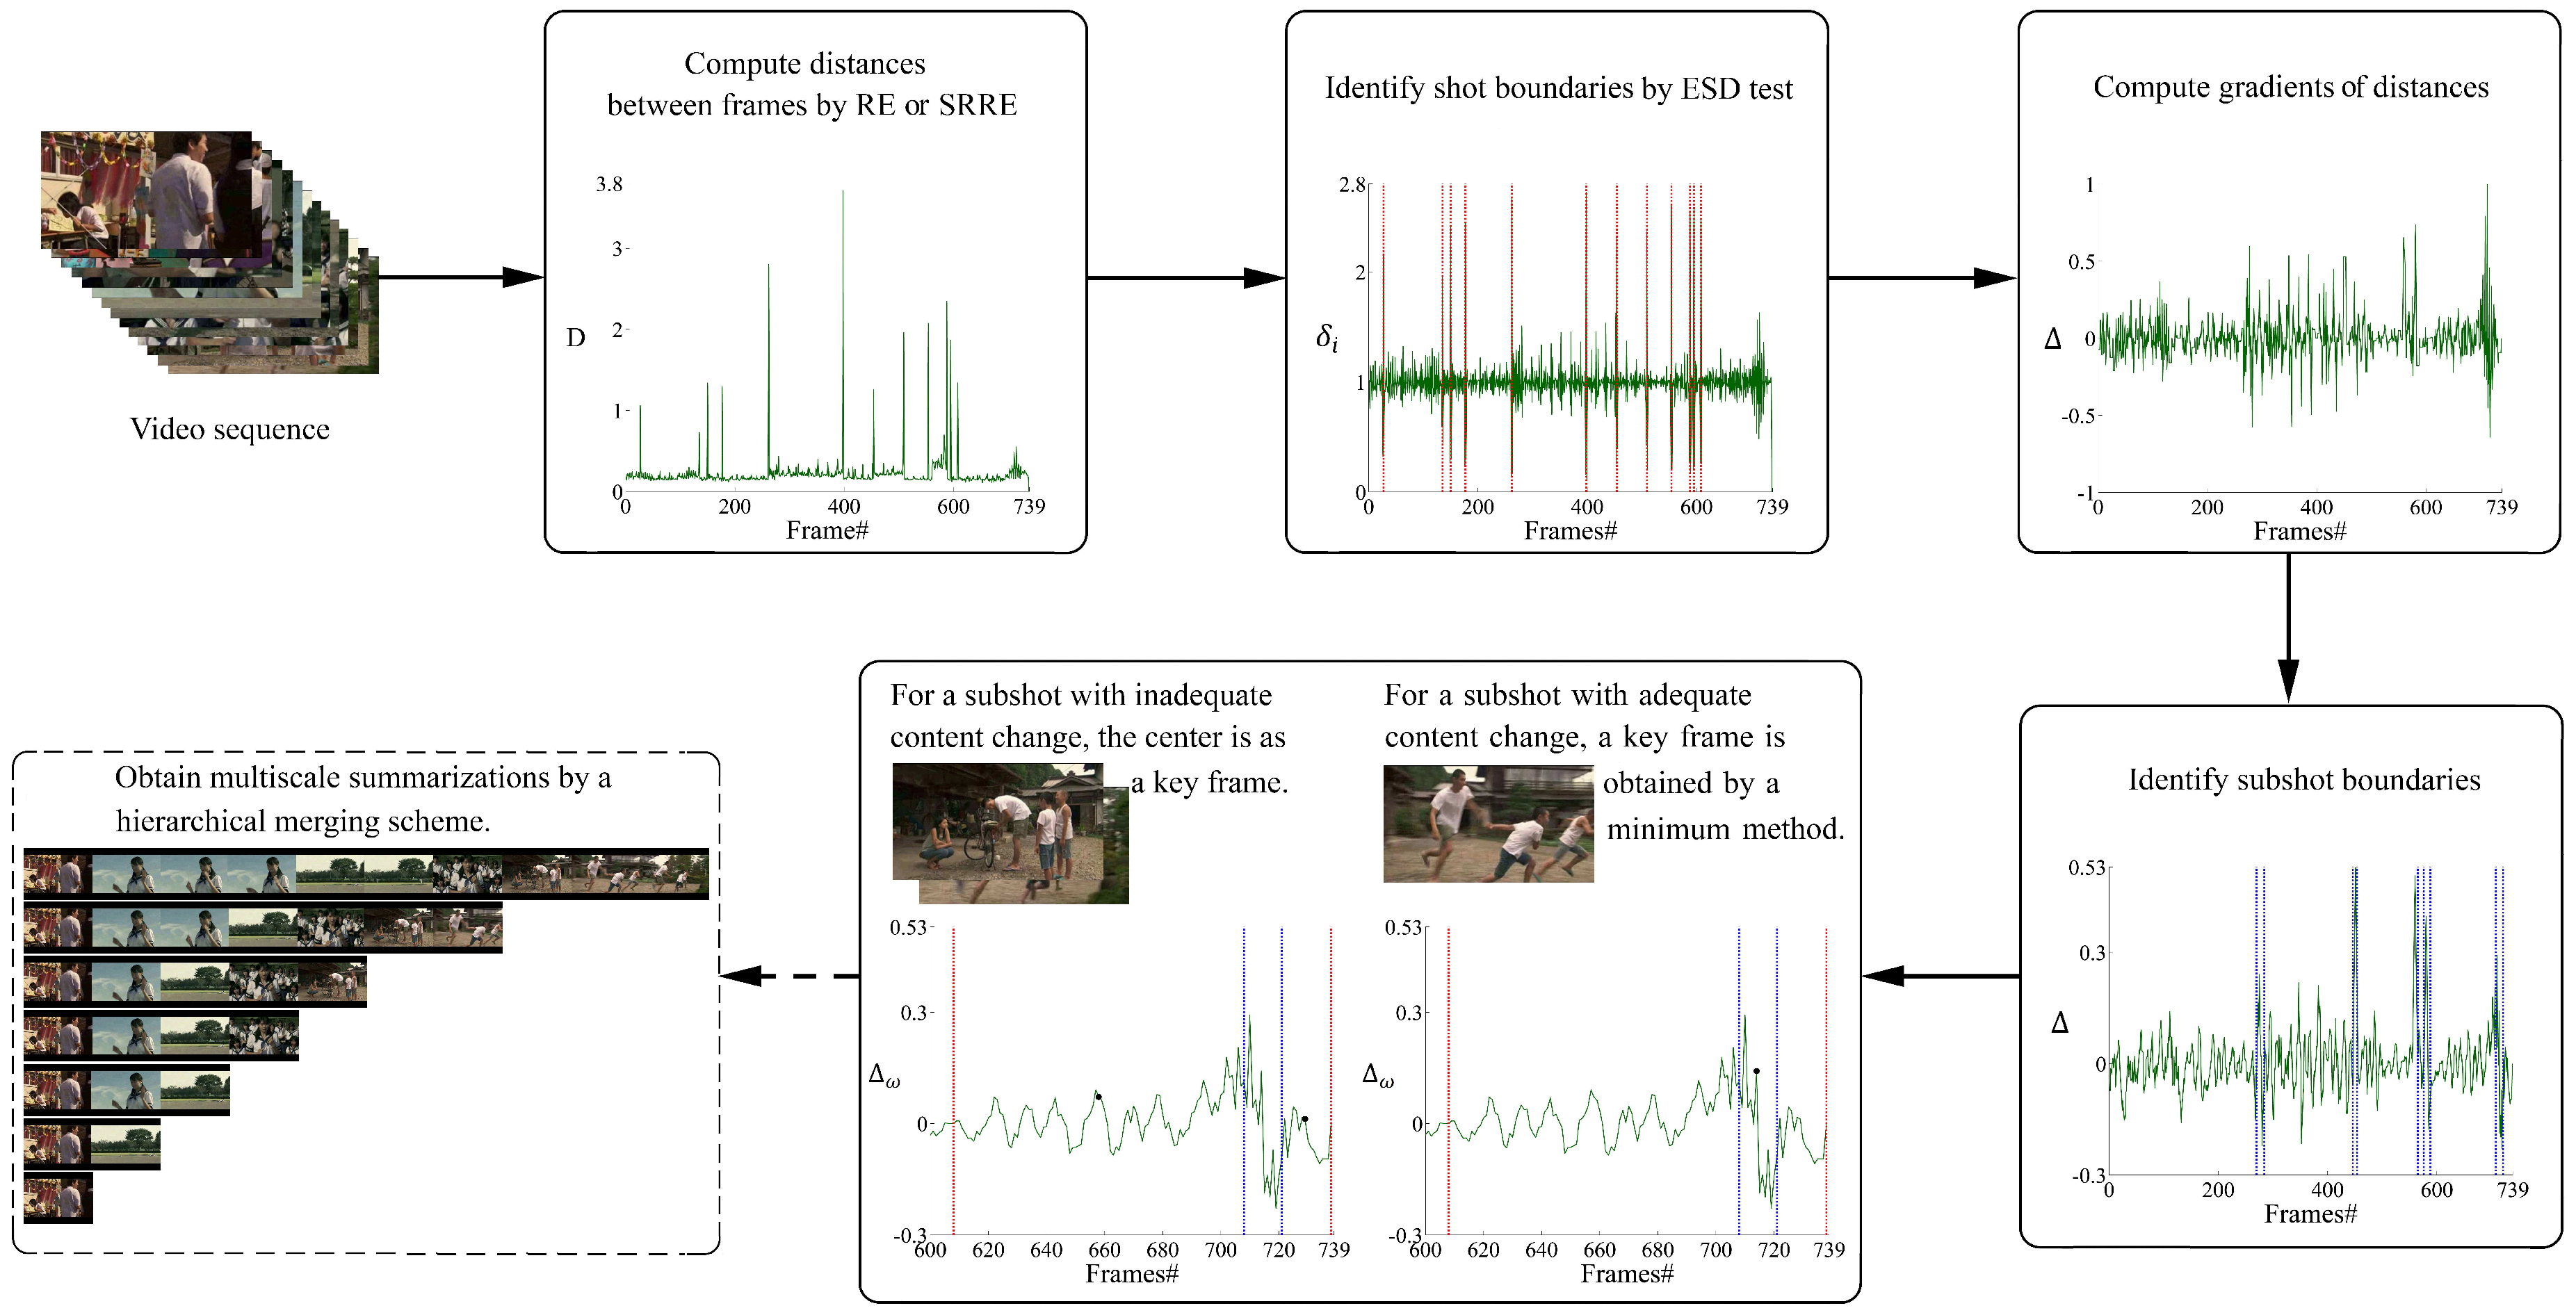
Figure 1. An overview of our proposed key frame extraction method. Here, the red dotted line, the blue dotted line and the bold black point indicate the shot boundary, sub-shot boundary and key frame, respectively. RE, relative entropy; SRRE, square root of RE; ESD, extreme Studentized deviate.
Entropy 18 00073 g001
Figure 2. The square root function on RE “amplifies” the distance between Frames #492 and #493, where the content changes little.
Entropy 18 00073 g002
Figure 3. An example of obtaining a range of adaptive thresholds used for the ESD-based shot detection. Due to the space limitation, the maximum and minimum ratio values versus window size for only three of all of the test videos are shown (black, green and blue colors correspond to the three videos). The “×” markers respectively on the dashed and solid lines shows the maximum and minimum distance ratios for the valid shot boundaries. The upper and lower bounds of the threshold, corresponding to the red dashed and solid lines, respectively, are also displayed.
Entropy 18 00073 g003
Figure 4. The wrong rate (number of wrong outliers/number of outliers) increases consistently when the window size becomes bigger.
Entropy 18 00073 g004
Figure 5. Multiscale key frames of Video Clip “7”. Scale 5–18 are skipped. The key frames with the same outlines in color and line style are from the same shot. (a) Scale 1; (b) Scale 2; (c) Scale 3; (d) Scale 4; (e) Scale 19.
Entropy 18 00073 g005
Figure 6. Objective comparisons of different methods. (a) Video sampling error (VSE) results from Videos 1–23; (b) VSE results from Videos 24–46; (c) fidelity (FID) results from Videos 1–23; (d) FID results from Videos 24–46. JSD, Jensen–Shannon divergence; ED, entropy difference; MI, mutual information; GGD, generalized Gaussian density.
Entropy 18 00073 g006aEntropy 18 00073 g006bEntropy 18 00073 g006c
Figure 7. Subjective comparisons on different methods. (a) Subjective scores from Videos 1–23; (b) subjective scores from Videos 24–46.
Entropy 18 00073 g007aEntropy 18 00073 g007b
Figure 8. Runtime consumptions by different methods. (a) Runtimes from Videos 1–32; (b) runtimes from Videos 33–46.
Entropy 18 00073 g008
Figure 9. Memory usage consumptions by different methods. (a) Memory usage from Video 1–32; (b) memory usage from Video 33–46.
Entropy 18 00073 g009
Figure 10. Comparison of different methods on Video “25”. (a) Uniformly down-sampled images; (b) RE; (c) SRRE; (d) JSD; (e) ED; (f) GGD; (g) MI; (h) RE for wavelet video; (i) SRRE for wavelet video.
Entropy 18 00073 g010
Figure 11. Objective comparisons of RE and SRRE.
Entropy 18 00073 g011aEntropy 18 00073 g011b
Figure 12. Key frames selected by our methods using RE and SRRE on common Video “15”. (a) Uniformly down-sampled images; (b) RE; (c) SRRE.
Entropy 18 00073 g012
Figure 13. Key frames selected by our methods using RE and SRRE on wavelet Video “15”. (a) Uniformly down-sampled images; (b) RE; (c) SRRE.
Entropy 18 00073 g013
Figure 14. Key frames selected by our methods using RE on wavelet Video “30”. (a) Uniformly down-sampled images; (b) RE for common video; (c) RE for wavelet video.
Entropy 18 00073 g014
Figure 15. Key frames selected by our methods using SRRE on wavelet Video “30”. (a) Uniformly down-sampled images; (b) SRRE for common video; (c) SRRE for wavelet video.
Entropy 18 00073 g015
Table 1. Test videos.
No.Length(s)Frame AmountResolutionNo.Length(s)Frame AmountResolution
18192240 × 18024551673352 × 240
216502320 × 24025581052320 × 240
324720352 × 2402658871176 × 144
428850352 × 24027591798320 × 240
529436320 × 24028591796320 × 240
630913320 × 24029601181368 × 480
730751320 × 24030872308352 × 240
830738320 × 24031972917352 × 240
930901368 × 480321202881176 × 144
1031930352 × 240331554650352 × 240
11351049352 × 240341895688352 × 264
12351056352 × 240351955856352 × 264
13361097352 × 240361965878352 × 264
14361097320 × 240371995991352 × 240
15391186352 × 240382136388352 × 264
16391169320 × 2403938011388352 × 264
17391169352 × 2404051315400320 × 240
18391186352 × 2404187126114352 × 240
19411237368 × 48042141934027512 × 384
20421288352 × 26443143134311512 × 384
21481460320 × 24044147935461512 × 384
22491491352 × 24045152036504512 × 384
23501097320 × 24046177842635512 × 384
Table 2. Average and standard error on the objective results by 6 key frame selection approaches.
RESRREJSDEDMIGGD
FIDVSEFIDVSEFIDVSEFIDVSEFIDVSEFIDVSE
Avg0.48383824.80.49583724.70.51453719.60.37544998.30.37484421.90.43114643.8
SE0.0204953.48820.0198923.66890.0181950.7070.01971188.30.01961074.30.01941192.1
Table 3. Average and standard error on subjective results by 6 key frame selection approaches.
RESRREJSDEDMIGGD
AvgSEAvgSEAvgSEAvgSEAvgSEAvgSE
Score3.85910.07133.85870.06583.89570.07262.66960.10463.10650.09173.15650.0761
Table 4. Average and standard error on runtimes and memory usage by 6 approaches.
RESRREJSDEDMIGGD
AvgSEAvgSEAvgSEvgSEAvgSEAvgSE
Runtime56.319917.605257.896617.979663.644218.7679787.1878237.6665838.5448251.6437103.861330.0365
Memory8742.7466.81848891.6460.27589513.3562.736416,5131556.3167181630.338,5293094.1
Table 5. Average and standard error on objective results based on RE and SRRE.
RERE for Wavelet VideoSRRESRRE for Wavelet Video
FIDVSEFIDVSEFIDVSEFIDVSE
Avg0.48383824.80.4913889.10.49583724.70.49733775.4
SE0.0204953.48820.0174965.1250.0198923.66890.0175932.663