
Feature Selection of Power Quality Disturbance Signals with an Entropy-Importance-Based Random Forest


 ,
,
Abstract
:1. Introduction
2. Classification by Random Forest
2.1. RF Classification Capability Analysis
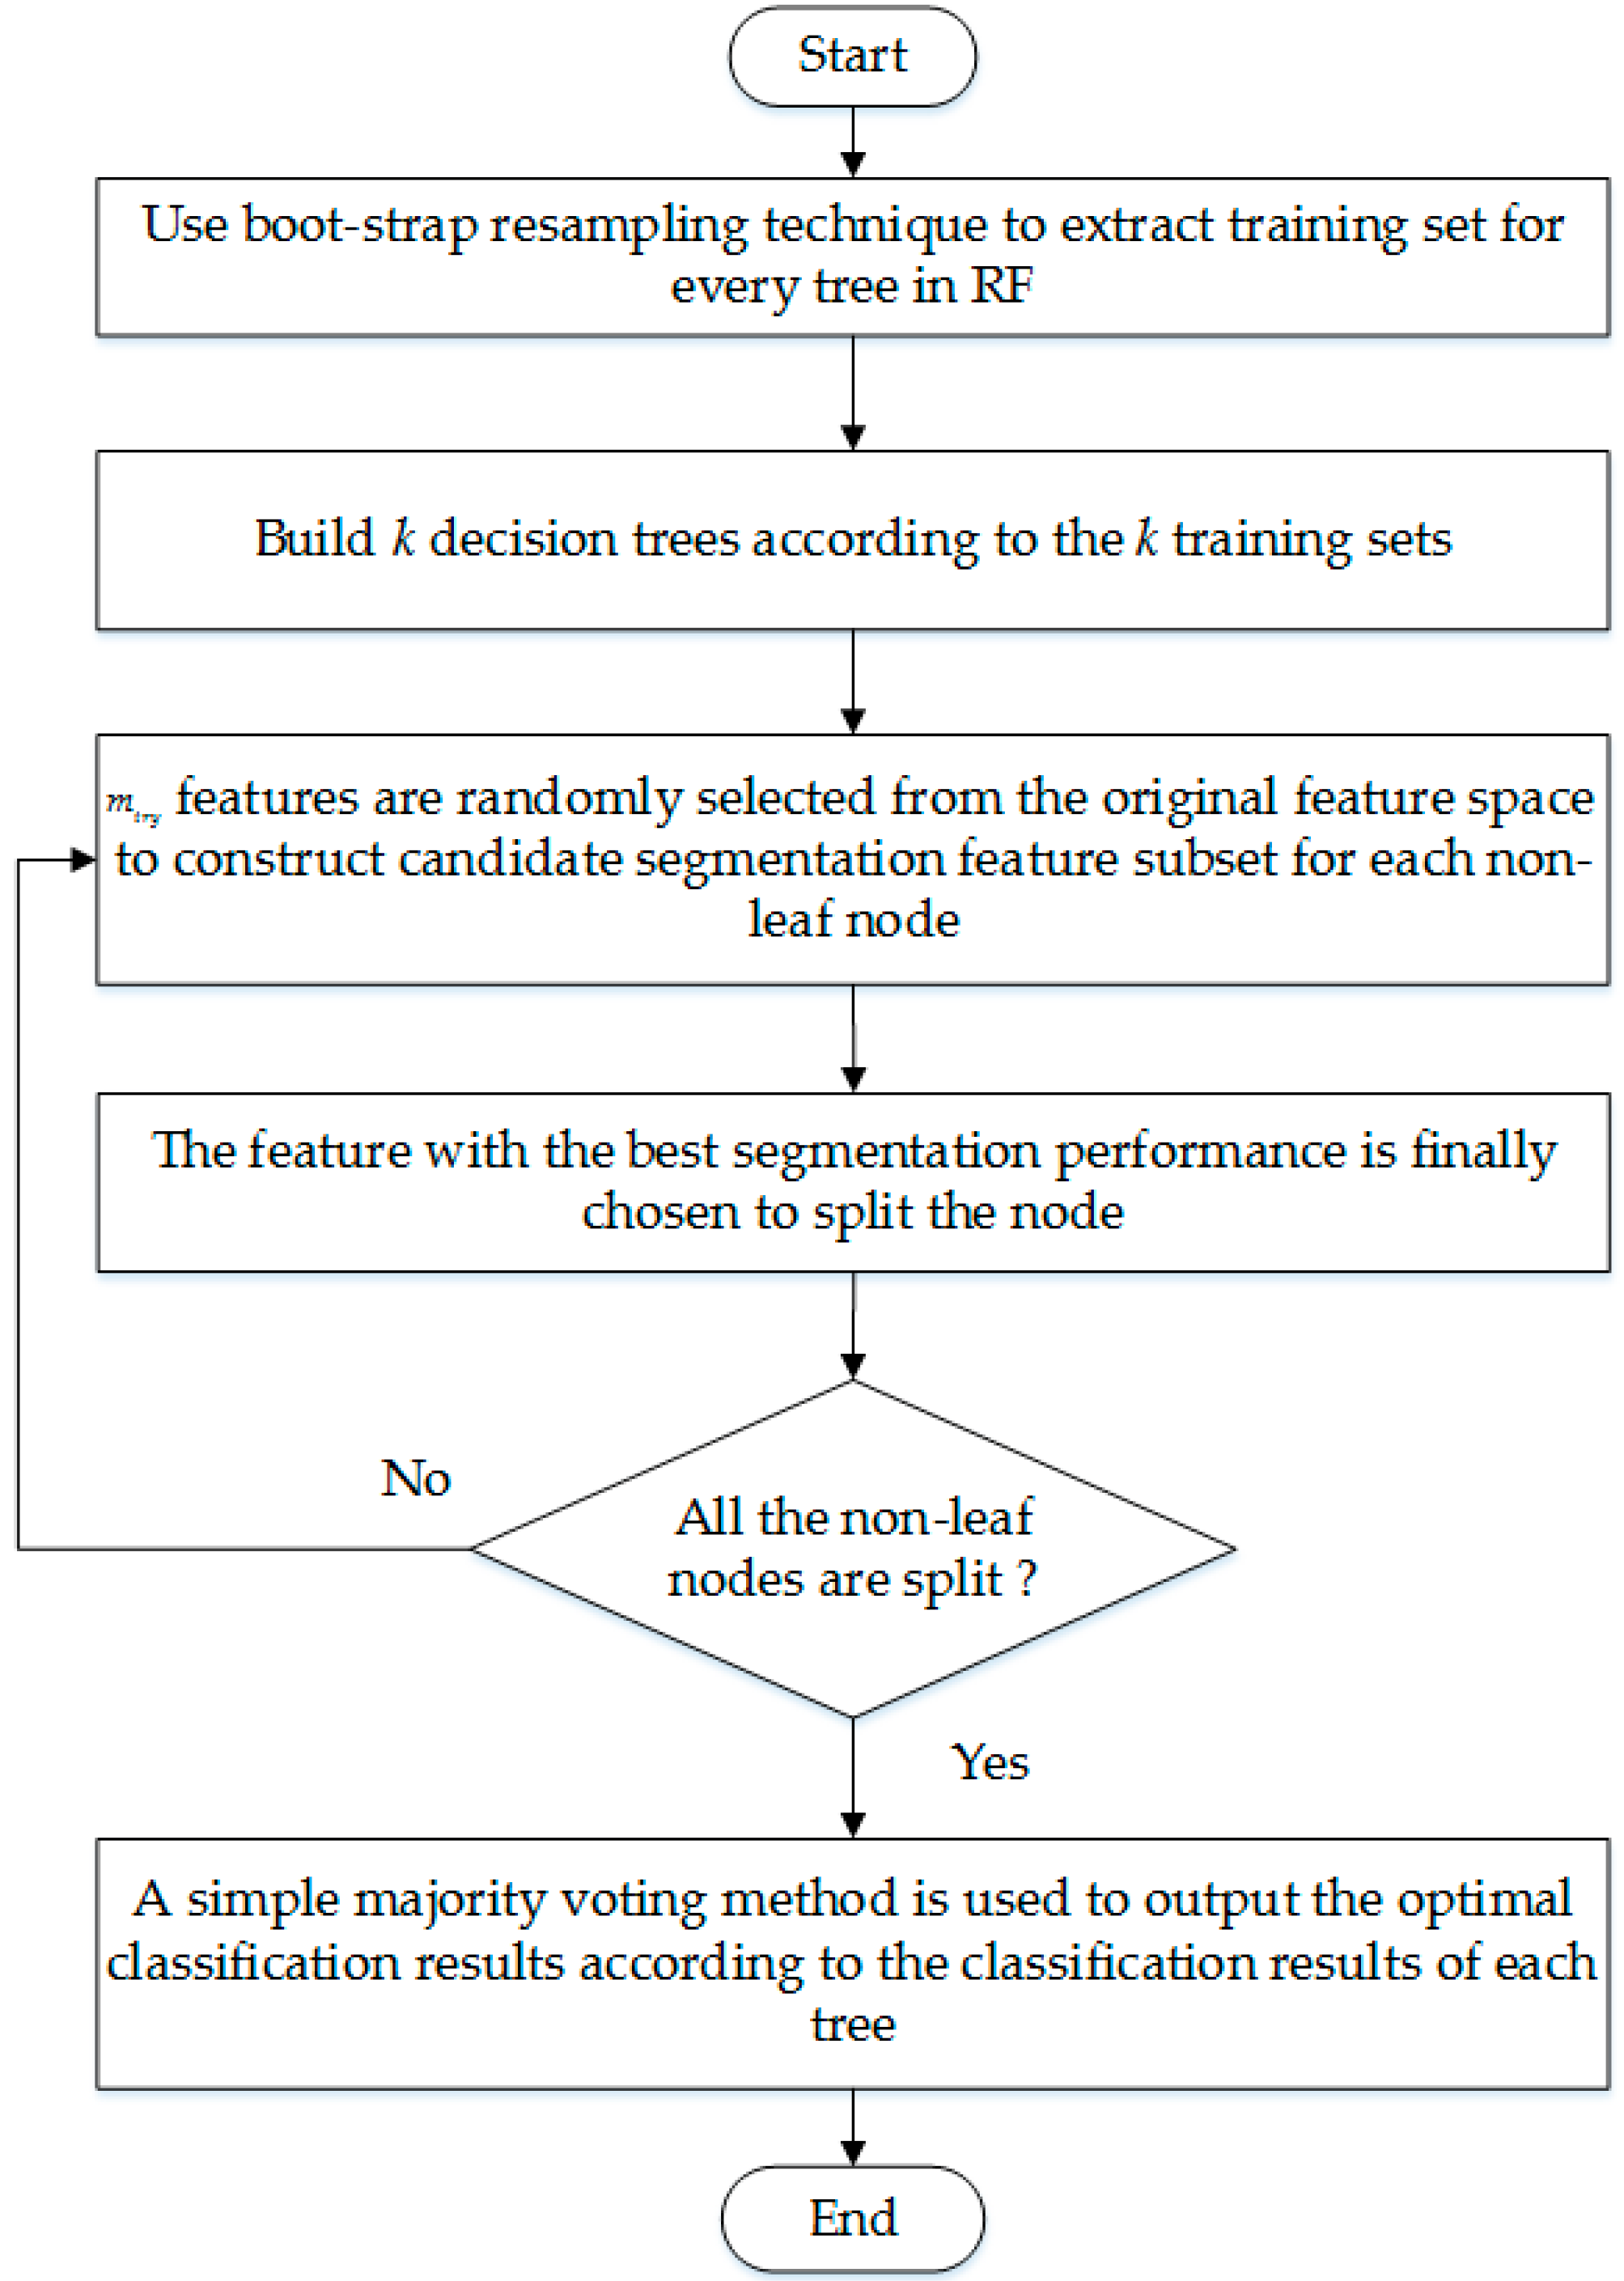
2.2. The Classification Process of RF
- The boot-strap resampling technique is used to extract the training set for every tree in RF, and the size of training set is equal to the original data set. Samples that haven’t been extracted are composed of out-of-bag data set. K training sets and out-of-bag data sets will be extracted by repeating the above process k times.
- K decision trees are built according to the k training sets to construct a RF.
- During the training process, features are randomly selected from the original feature space to construct candidate segmentation feature subset for each non-leaf node. Most studies let , where t is the number of original features.
- Each feature in the candidate segmentation feature subset is used to split the node, and the feature with the best segmentation performance is finally chosen as the segmentation feature of the node.
- Repeat step 3 and step 4 until all non-leaf nodes segmented, then the training process is over.
- When using RF to classify PQ signals, a simple majority voting method is used to output the optimal classification results according to the classification results of each classifier.

3. Construction of RF and Feature Selection of PQ Signals Based on EnI
3.1. EnI Calculation and Node Segmentation
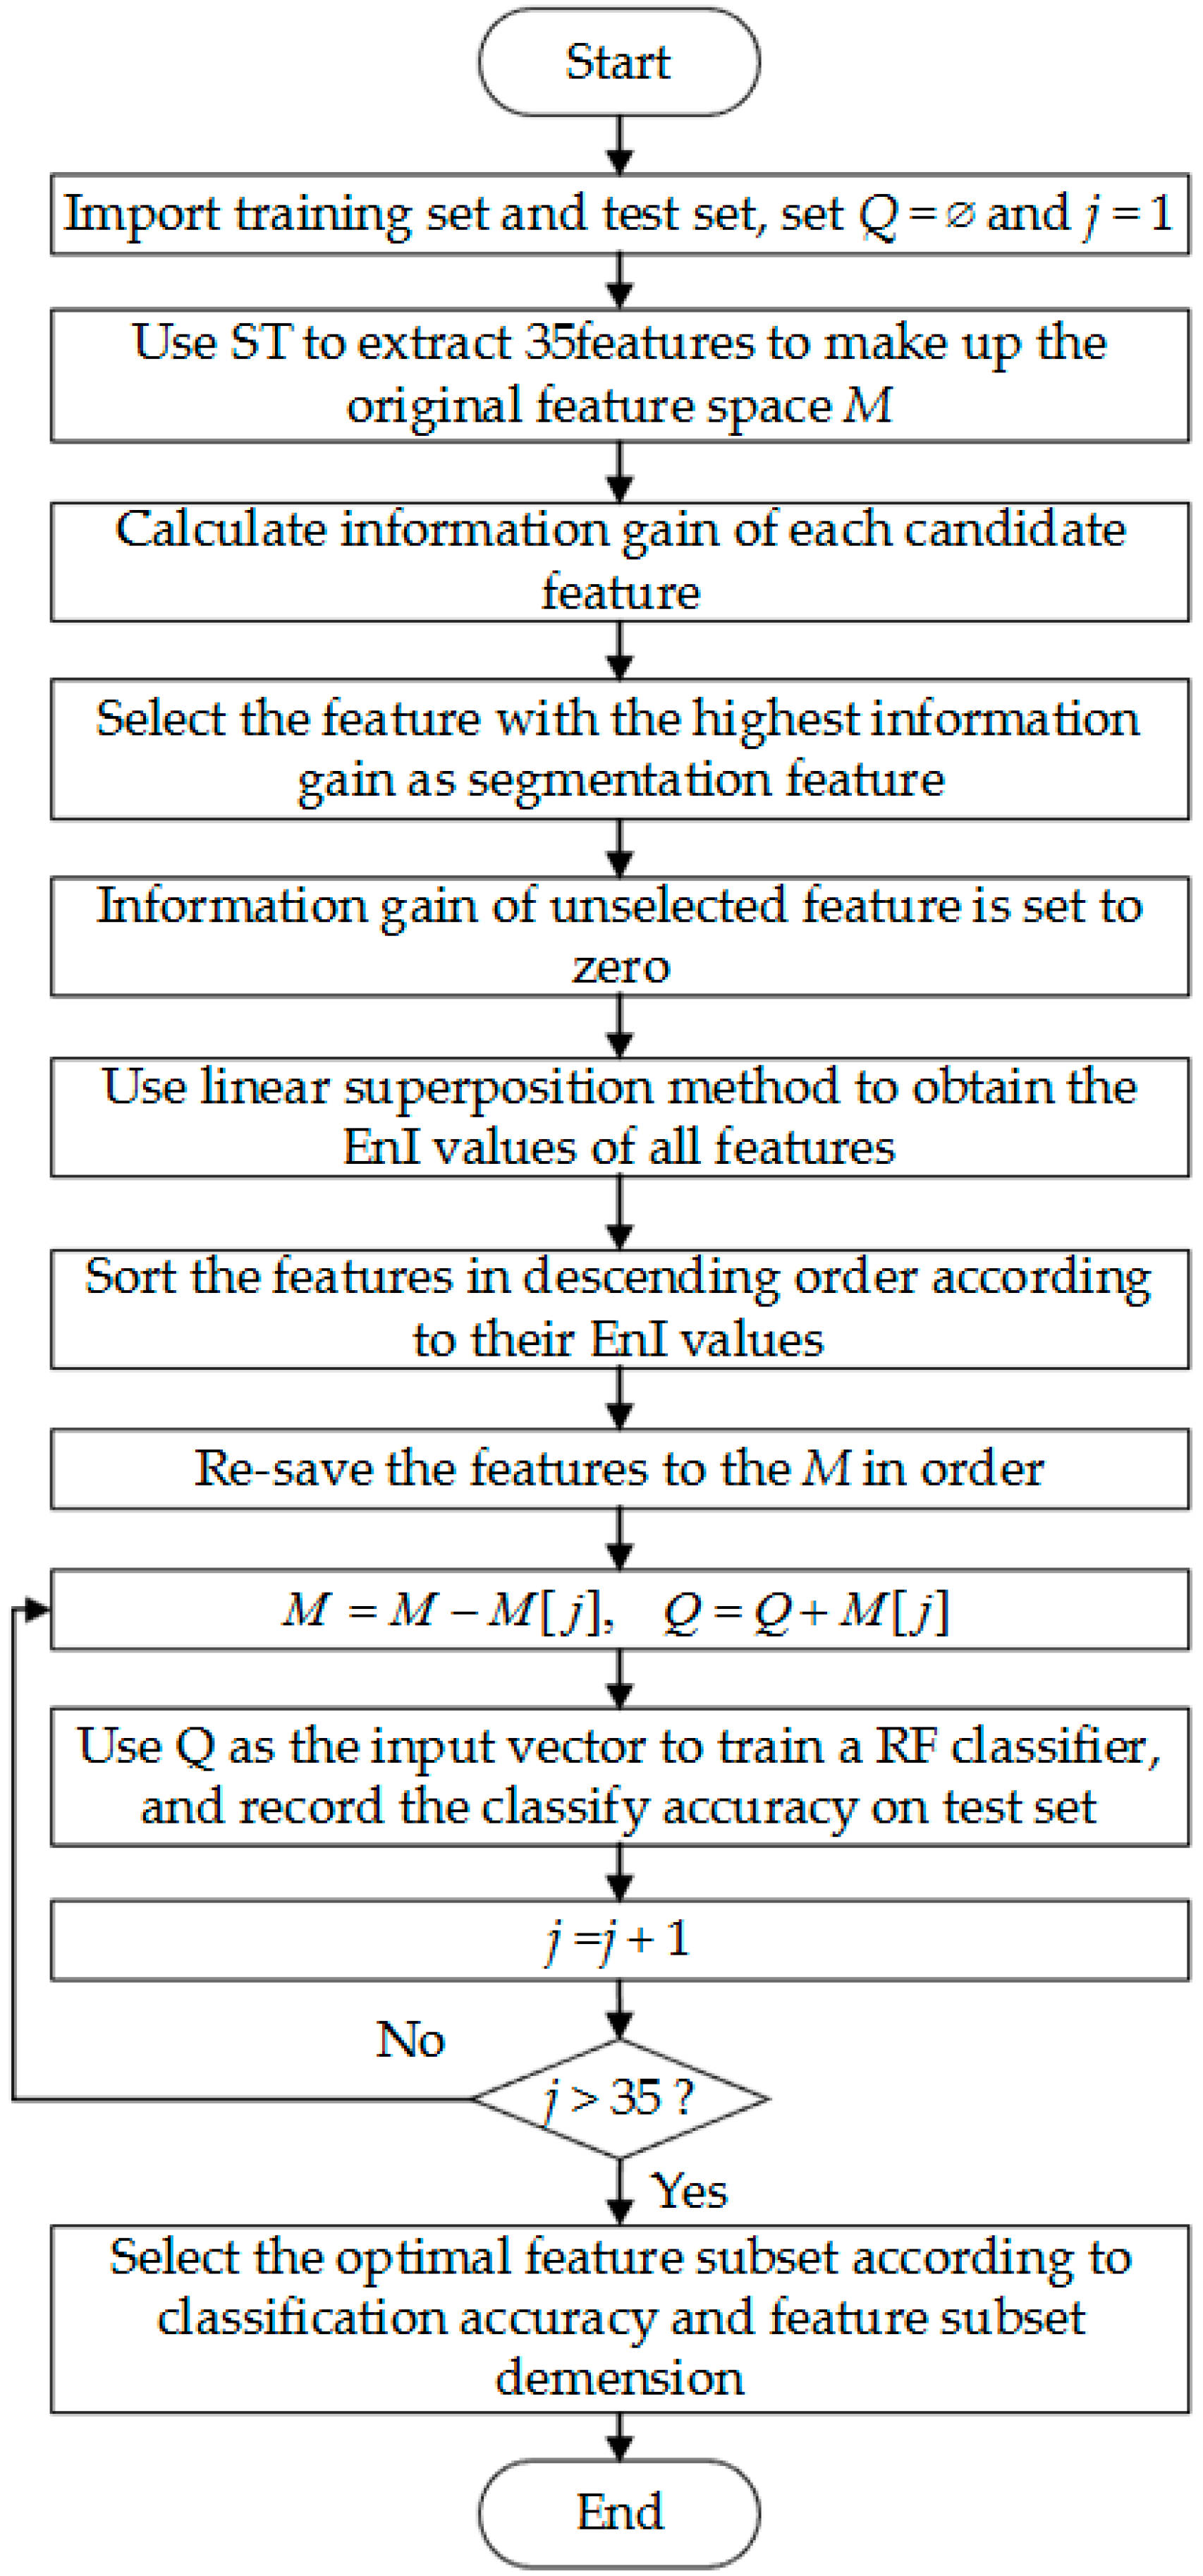
3.2. Forward Search Strategy of PQ Feature Selection Based on EnI
4. Experimental Results and Analysis
4.1. Feature Extraction of PQ Signals
- Feature 1 (F1): the maximum value of the maximum amplitude of each column in STMM (Amax).
- Feature 2 (F2): the minimum value of the maximum amplitude of each column in STMM (Amin).
- Feature 3 (F3): the mean value of the maximum amplitude of each column in STMM (Mean).
- Feature 4 (F4): the standard deviation (STD) of the maximum amplitude of each column in STMM (STD).
- Feature 5 (F5): the amplitude factor () of the maximum amplitude of each column in STMM, defined as in the range .
- Feature 6 (F6): the STD of the maximum amplitude in the high frequency area above 100 Hz.
- Feature 7 (F7): the maximum value of the maximum amplitude in the high frequency area above 100 Hz (AHFmax).
- Feature 8 (F8): the minimum value of the maximum amplitude in the high frequency area above 100 Hz (AHFmin).
- Feature 9 (F9): .
- Feature 10 (F10): the Skewness of the high frequency area.
- Feature 11 (F11): the kurtosis of the high frequency area.
- Feature 12 (F12): the standard deviation of the maximum amplitude of each frequency.
- Feature 13 (F13): the mean value of the maximum amplitude of each frequency.
- Feature 14 (F14): the mean value of the standard deviation of the amplitude of each frequency.
- Feature 15 (F15): the STD of the STD of the amplitude of each frequency.
- Feature 16 (F16): the STD of the STD of the amplitude of the low frequency area below 100 Hz.
- Feature 17 (F17): the STD of the STD of the amplitude of the high frequency area above 100 Hz.
- Feature 18 (F18): the total harmonic distortion (THD).
- Feature 19 (F19): the energy drop amplitude of 1/4 cycle of the original signal.
- Feature 20 (F20): the energy rising amplitude of 1/4 cycle of the original signal.
- Feature 21 (F21): the standard deviation of the amplitude of fundamental frequency.
- Feature 22 (F22): the maximum value of the intermediate frequency area.
- Feature 23 (F23): energy of the high frequency area from 700 Hz to 1000 Hz.
- Feature 24 (F24): energy of the high frequency area after morphological de-noising.
- Feature 25 (F25): energy of local matrix.
- Feature 26 (F26): the summation of maximum value and minimum value of the amplitude of STMM.
- Feature 27 (F27): the summation of the maximum value and minimum value of the maximum amplitude of each column in STMM.
- Feature 28 (F28): the root mean square of the mean value of the amplitude of each column in STMM.
- Feature 29 (F29): the summation of the maximum value and minimum value of the standard deviation of the amplitude of each column in STMM.
- Feature 30 (F30): the STD of the STD of the amplitude of each column in STMM.
- Feature 31 (F31): the mean value of the minimum value of the amplitude of each line in STMM.
- Feature 32 (F32): the STD of the minimum value of the amplitude of each line in STMM.
- Feature 33 (F33): the root mean square of the minimum value of the amplitude of each line in STMM.
- Feature 34 (F34): the STD of the STD of the amplitude of each line in STMM.
- Feature 35 (F35): the root mean square of the standard deviation of the amplitude of each line in STMM.
- The amplitude of voltage of a sampling point is , where , and M is the number of all sampling points. Then the relevant calculation formulas of features are described as follow:
- Mean: .
- STD: .
- Skewness: .
- Kurtosis: .
- And the calculation formulas of F19 and F20 are given by:
- .
- .
- where is the root mean square (RMS) of each cycles of the original signal, and is the RMS of standard PQ signal with no noise.
- (1)
- Using the maximum of the summation of amplitudes of each row in oscillation frequency domain, and the maximum of the summation of amplitudes of each column in the full time domain, to locate the possible time-frequency center point of oscillation.
- (2)
- The local energy of the final 1/4 cycle and the 150 Hz range of this time-frequency center point is calculated as F25.
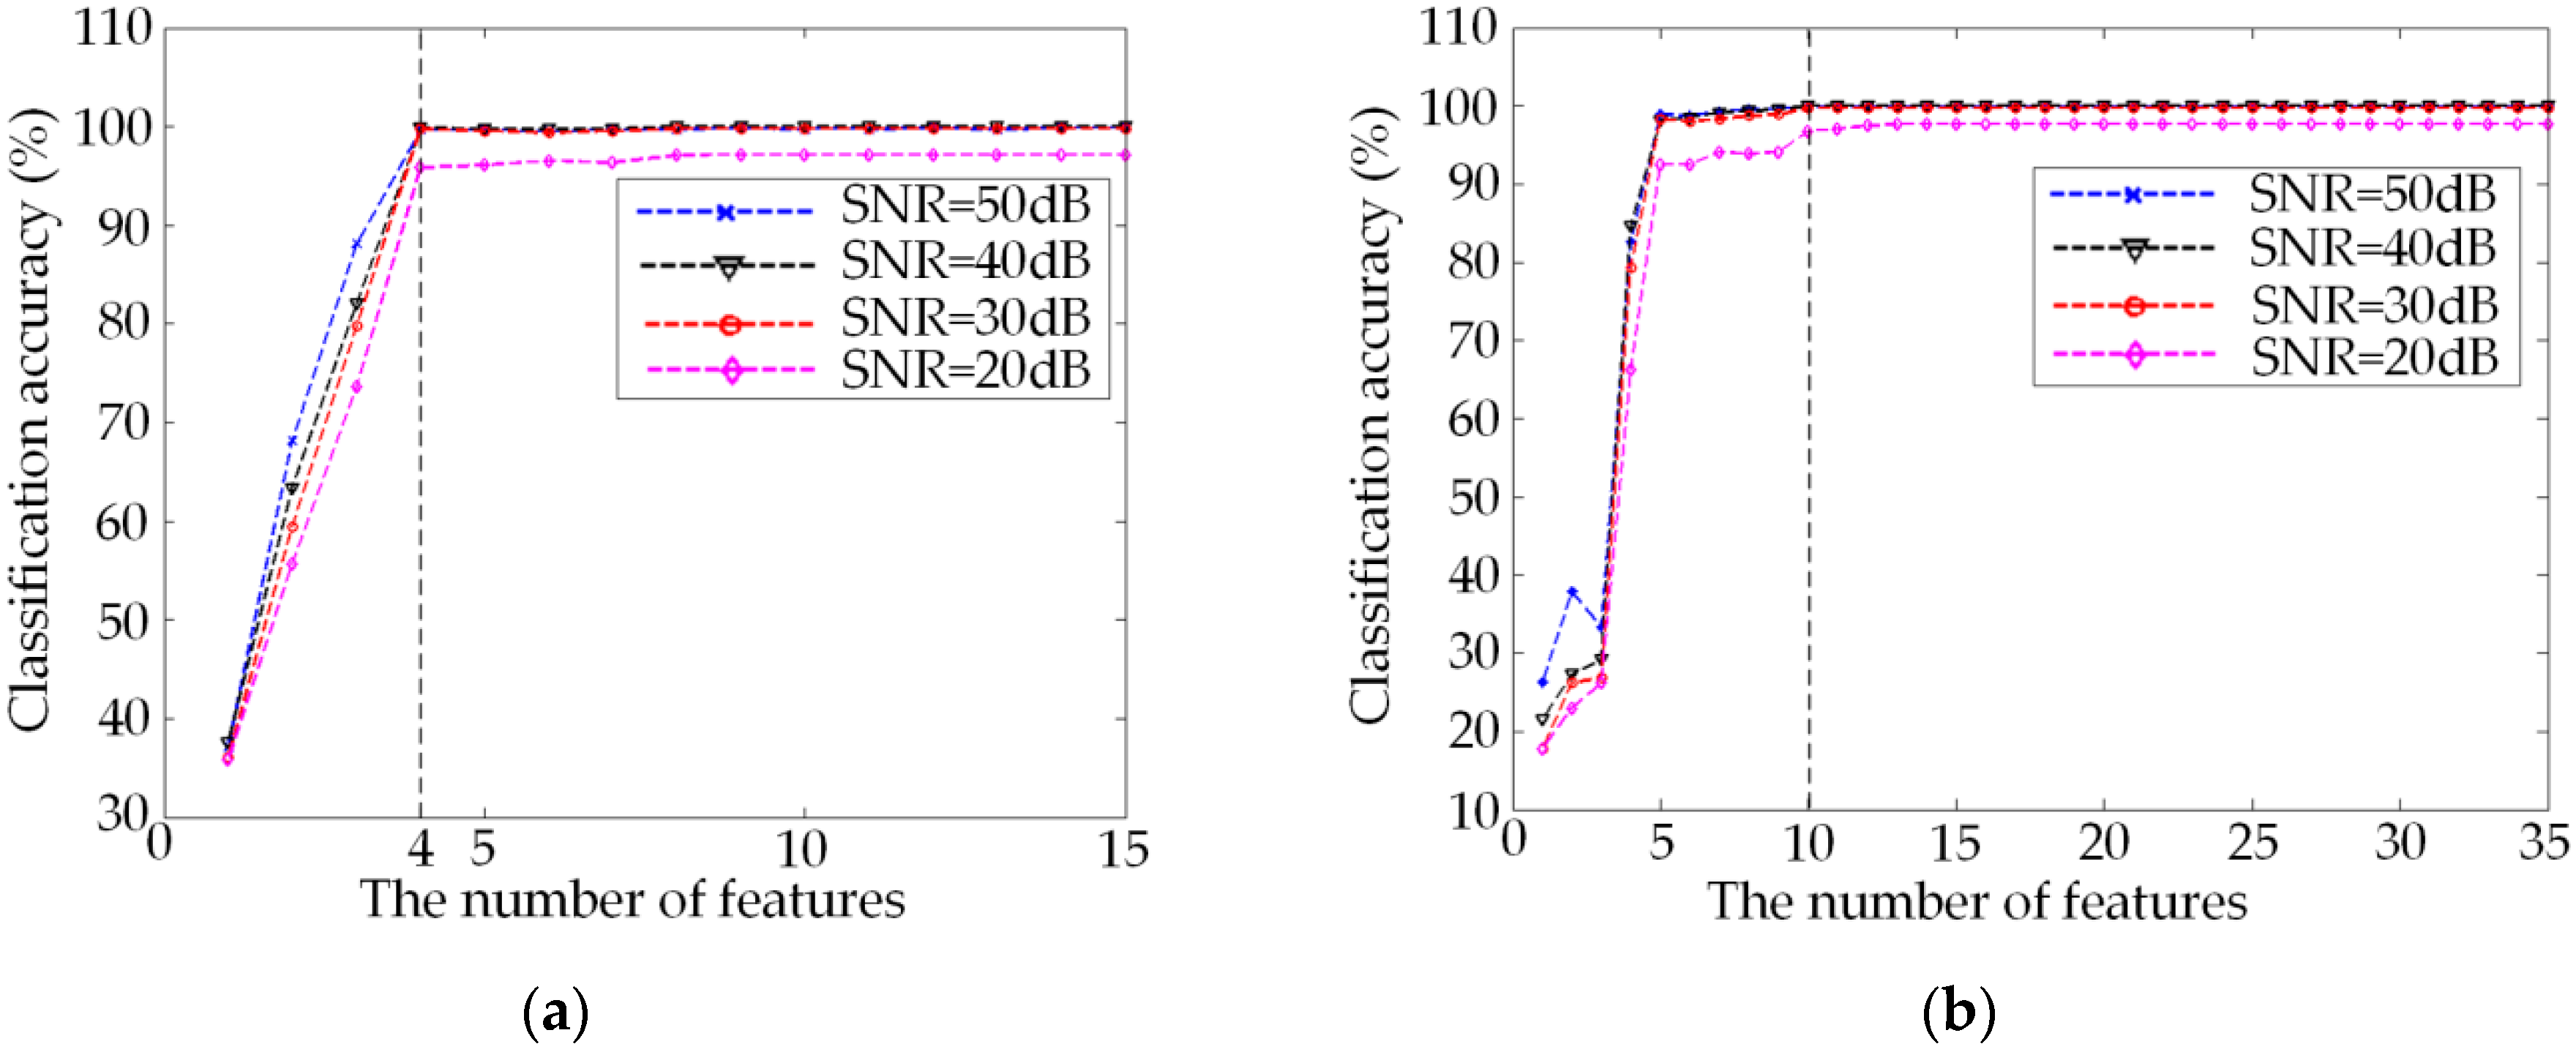
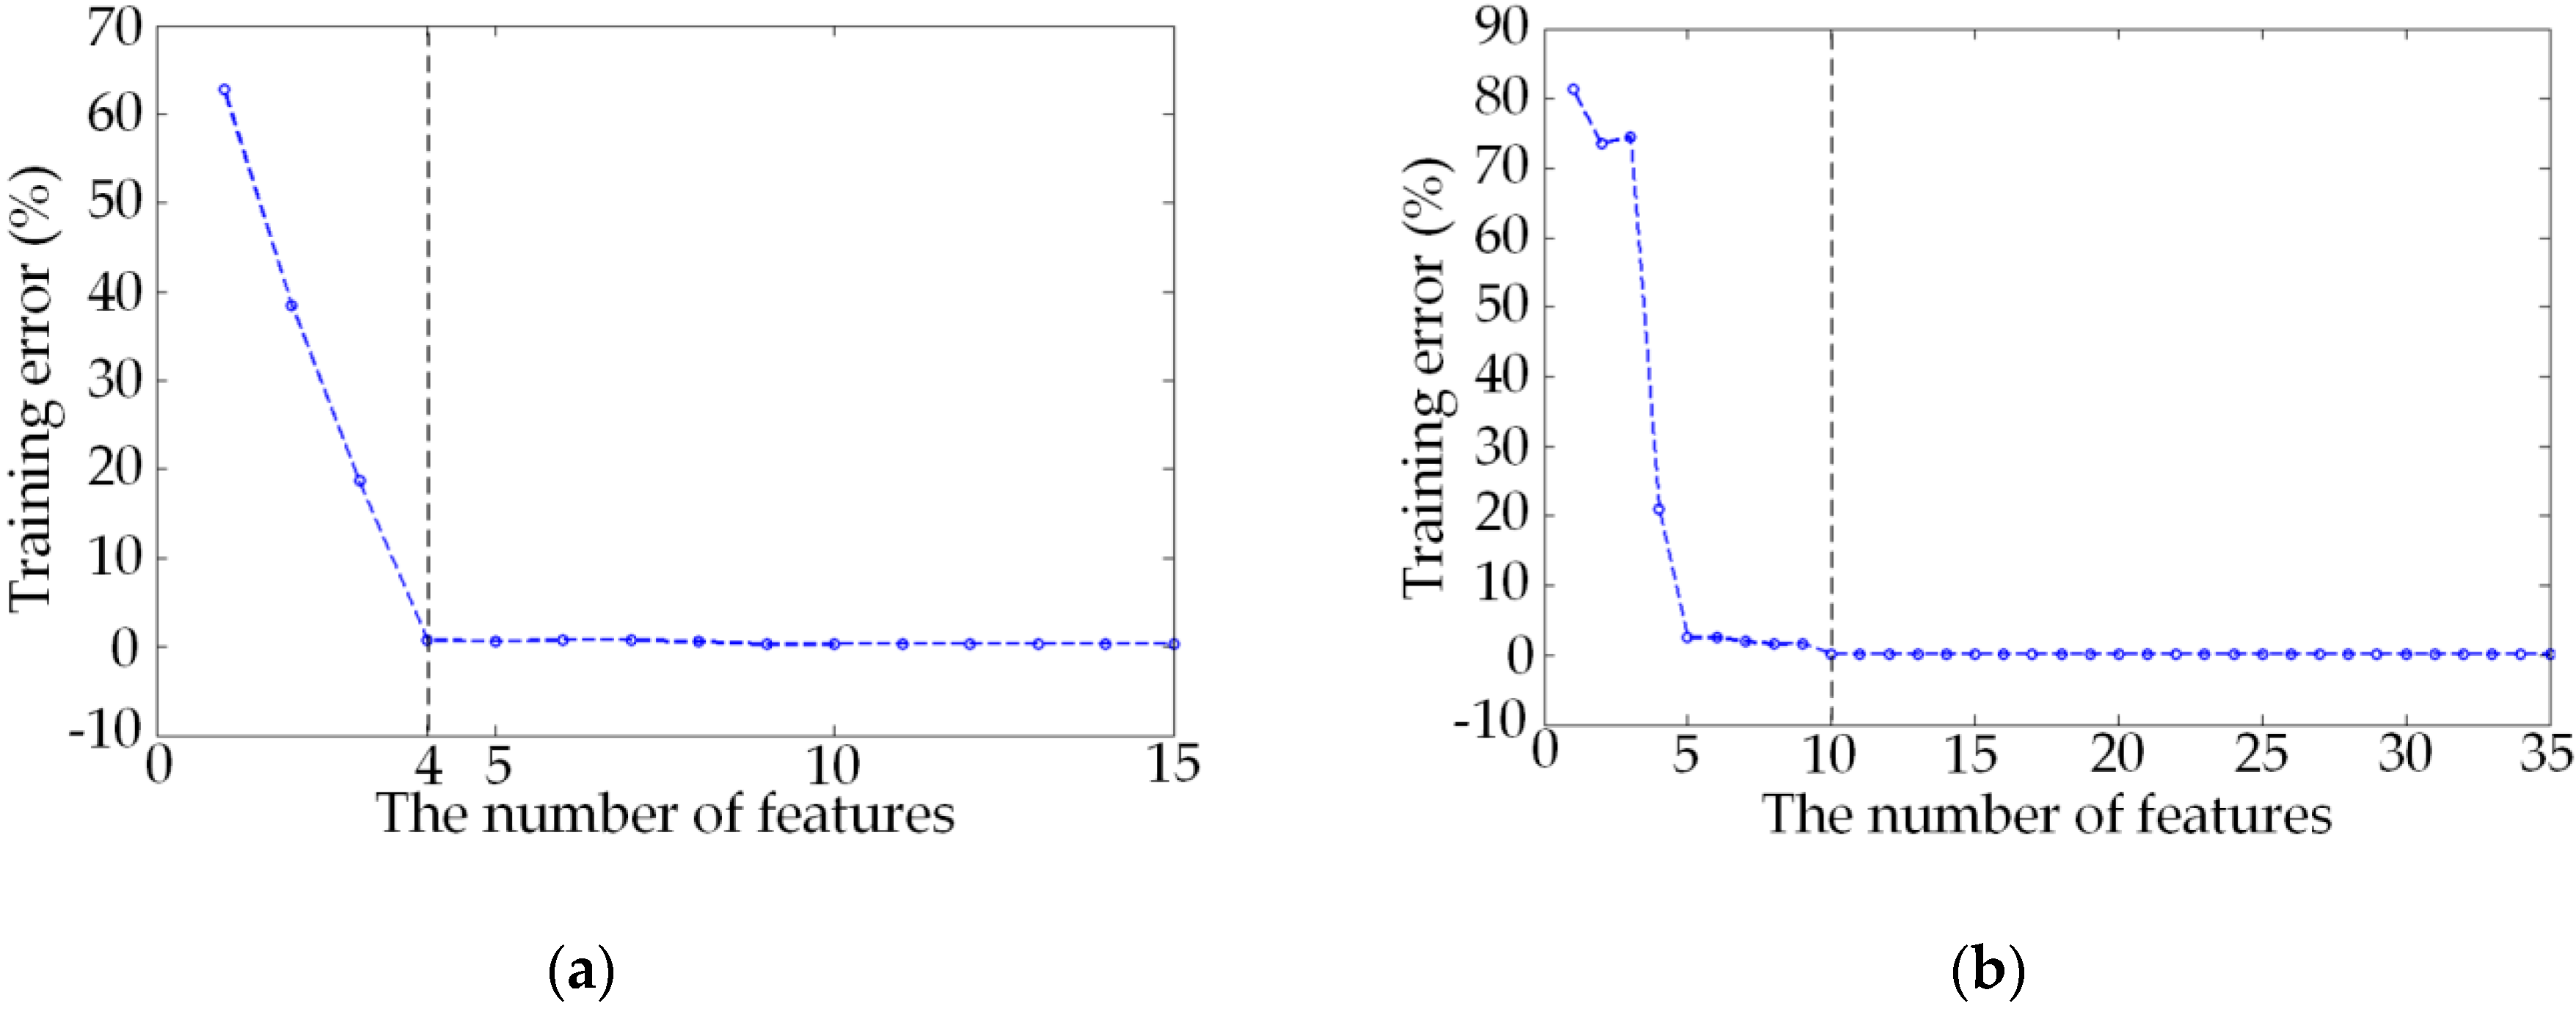
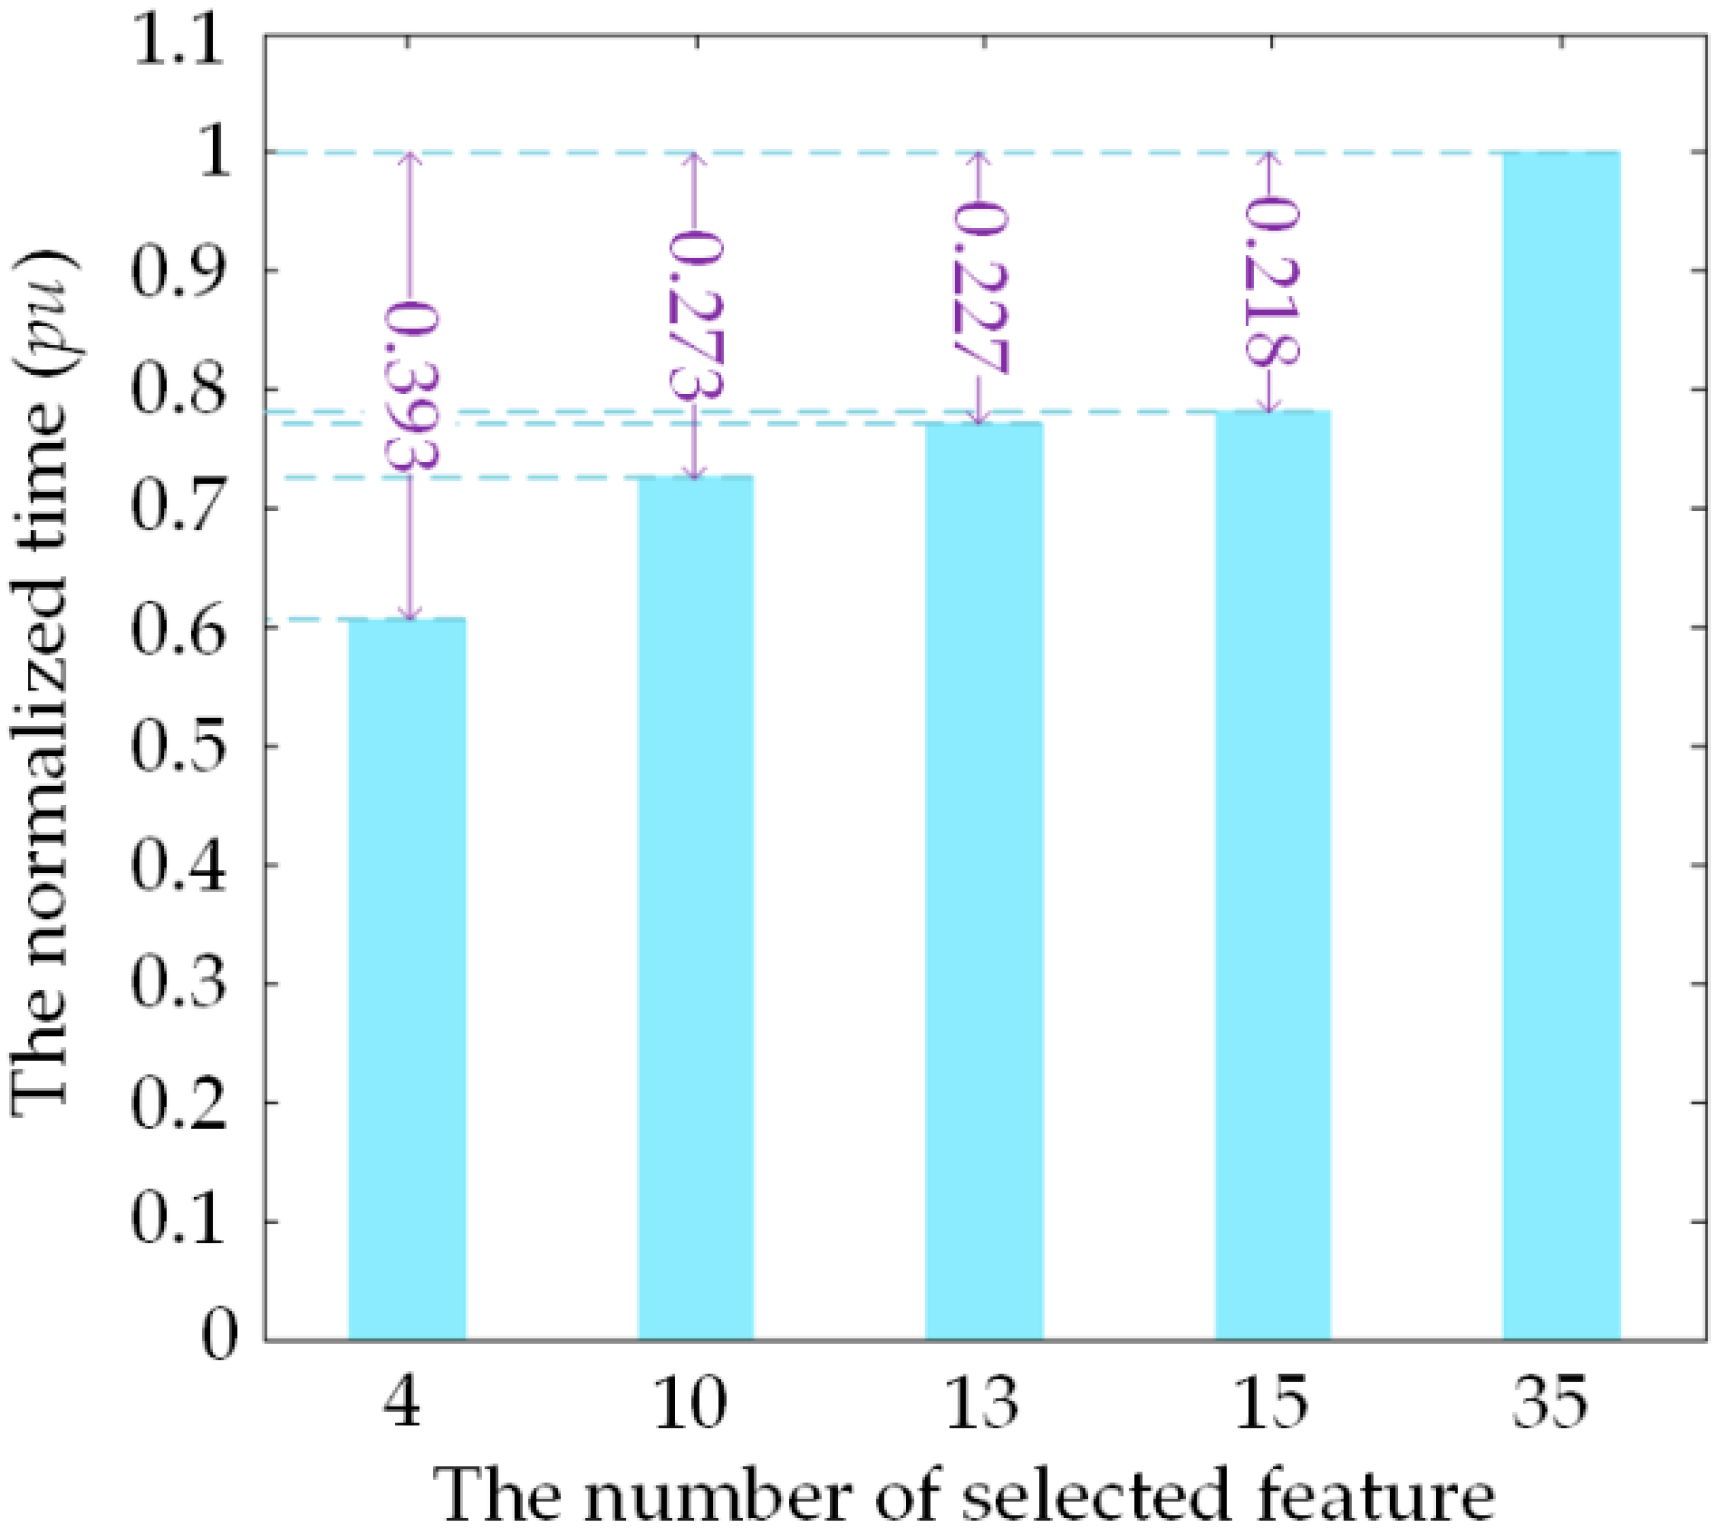
4.2. Feature Selection and Classification Effect Analysis of the New Method


| Class | C0 | C1 | C2 | C3 | C4 | C5 | C6 | C7 | C8 | C9 | C10 | C11 | C12 | C13 | C14 |
|---|---|---|---|---|---|---|---|---|---|---|---|---|---|---|---|
| C0 | 86 | 0 | 0 | 0 | 1 | 9 | 0 | 0 | 4 | 0 | 0 | 0 | 0 | 0 | 0 |
| C1 | 0 | 87 | 0 | 5 | 0 | 0 | 0 | 0 | 0 | 0 | 0 | 0 | 8 | 0 | 0 |
| C2 | 0 | 0 | 94 | 0 | 0 | 0 | 0 | 0 | 0 | 0 | 0 | 0 | 0 | 6 | 0 |
| C3 | 0 | 5 | 0 | 94 | 0 | 0 | 0 | 0 | 0 | 0 | 0 | 0 | 1 | 0 | 0 |
| C4 | 0 | 0 | 0 | 0 | 86 | 0 | 0 | 0 | 0 | 0 | 0 | 0 | 0 | 0 | 14 |
| C5 | 0 | 0 | 0 | 0 | 0 | 99 | 0 | 1 | 0 | 0 | 0 | 0 | 0 | 0 | 0 |
| C6 | 0 | 0 | 0 | 0 | 0 | 0 | 96 | 0 | 3 | 0 | 0 | 1 | 0 | 0 | 0 |
| C7 | 0 | 0 | 0 | 0 | 0 | 0 | 0 | 100 | 0 | 0 | 0 | 0 | 0 | 0 | 0 |
| C8 | 1 | 0 | 0 | 0 | 0 | 0 | 0 | 0 | 96 | 0 | 3 | 0 | 0 | 0 | 0 |
| C9 | 0 | 0 | 0 | 0 | 0 | 0 | 0 | 0 | 0 | 100 | 0 | 0 | 0 | 0 | 0 |
| C10 | 0 | 0 | 0 | 0 | 0 | 0 | 0 | 0 | 0 | 0 | 100 | 0 | 0 | 0 | 0 |
| C11 | 0 | 0 | 0 | 0 | 0 | 0 | 0 | 0 | 0 | 0 | 0 | 100 | 0 | 0 | 0 |
| C12 | 0 | 0 | 0 | 0 | 0 | 0 | 0 | 0 | 0 | 0 | 0 | 0 | 100 | 0 | 0 |
| C13 | 0 | 0 | 0 | 0 | 0 | 0 | 0 | 0 | 0 | 0 | 0 | 0 | 0 | 100 | 0 |
| C14 | 0 | 0 | 0 | 0 | 0 | 0 | 0 | 0 | 0 | 0 | 0 | 0 | 0 | 0 | 100 |
| Comprehensive accuracy: 95.9% | |||||||||||||||
| Class | C0 | C1 | C2 | C3 | C4 | C5 | C6 | C7 | C8 | C9 | C10 | C11 | C12 | C13 | C14 |
|---|---|---|---|---|---|---|---|---|---|---|---|---|---|---|---|
| C0 | 37 | 0 | 57 | 0 | 0 | 3 | 0 | 0 | 1 | 0 | 0 | 0 | 0 | 2 | 0 |
| C1 | 0 | 63 | 0 | 22 | 7 | 0 | 0 | 0 | 0 | 0 | 0 | 0 | 8 | 0 | 0 |
| C2 | 10 | 0 | 82 | 0 | 0 | 1 | 0 | 2 | 0 | 0 | 0 | 0 | 0 | 5 | 0 |
| C3 | 0 | 1 | 0 | 98 | 0 | 0 | 0 | 0 | 0 | 0 | 0 | 0 | 1 | 0 | 0 |
| C4 | 0 | 1 | 0 | 0 | 84 | 0 | 0 | 0 | 0 | 0 | 0 | 0 | 0 | 0 | 15 |
| C5 | 0 | 0 | 0 | 0 | 0 | 51 | 0 | 0 | 0 | 0 | 0 | 0 | 0 | 49 | 0 |
| C6 | 0 | 0 | 0 | 0 | 0 | 0 | 33 | 3 | 0 | 0 | 32 | 32 | 0 | 0 | 0 |
| C7 | 0 | 0 | 0 | 0 | 0 | 0 | 0 | 80 | 0 | 2 | 0 | 17 | 0 | 1 | 0 |
| C8 | 1 | 0 | 1 | 0 | 0 | 0 | 4 | 64 | 28 | 0 | 0 | 2 | 0 | 0 | 0 |
| C9 | 0 | 0 | 0 | 0 | 0 | 0 | 0 | 0 | 0 | 86 | 0 | 14 | 0 | 0 | 0 |
| C10 | 0 | 0 | 0 | 0 | 0 | 0 | 30 | 6 | 0 | 0 | 29 | 35 | 0 | 0 | 0 |
| C11 | 0 | 0 | 0 | 0 | 0 | 0 | 3 | 1 | 0 | 16 | 6 | 74 | 0 | 0 | 0 |
| C12 | 0 | 0 | 0 | 0 | 0 | 0 | 0 | 0 | 0 | 0 | 0 | 0 | 85 | 0 | 15 |
| C13 | 0 | 0 | 0 | 0 | 0 | 33 | 0 | 0 | 0 | 0 | 0 | 0 | 0 | 67 | 0 |
| C14 | 0 | 0 | 0 | 0 | 0 | 0 | 0 | 0 | 0 | 0 | 0 | 0 | 2 | 0 | 98 |
| Comprehensive accuracy: 66.3% | |||||||||||||||
| Class | C0 | C1 | C2 | C3 | C4 | C5 | C6 | C7 | C8 | C9 | C10 | C11 | C12 | C13 | C14 |
|---|---|---|---|---|---|---|---|---|---|---|---|---|---|---|---|
| C0 | 91 | 0 | 0 | 0 | 0 | 9 | 0 | 0 | 0 | 0 | 0 | 0 | 0 | 0 | 0 |
| C1 | 0 | 87 | 0 | 5 | 0 | 0 | 0 | 0 | 0 | 0 | 0 | 0 | 8 | 0 | 0 |
| C2 | 0 | 0 | 94 | 0 | 0 | 0 | 0 | 0 | 0 | 0 | 0 | 0 | 0 | 6 | 0 |
| C3 | 0 | 1 | 0 | 98 | 0 | 0 | 0 | 0 | 0 | 0 | 0 | 0 | 1 | 0 | 0 |
| C4 | 0 | 0 | 0 | 0 | 86 | 0 | 0 | 0 | 0 | 0 | 0 | 0 | 0 | 0 | 14 |
| C5 | 0 | 0 | 0 | 0 | 0 | 100 | 0 | 0 | 0 | 0 | 0 | 0 | 0 | 0 | 0 |
| C6 | 0 | 0 | 0 | 0 | 0 | 0 | 100 | 0 | 0 | 0 | 0 | 0 | 0 | 0 | 0 |
| C7 | 0 | 0 | 0 | 0 | 0 | 0 | 0 | 100 | 0 | 0 | 0 | 0 | 0 | 0 | 0 |
| C8 | 0 | 0 | 0 | 0 | 0 | 0 | 0 | 0 | 100 | 0 | 0 | 0 | 0 | 0 | 0 |
| C9 | 0 | 0 | 0 | 0 | 0 | 0 | 0 | 0 | 0 | 100 | 0 | 0 | 0 | 0 | 0 |
| C10 | 0 | 0 | 0 | 0 | 0 | 0 | 0 | 0 | 0 | 0 | 100 | 0 | 0 | 0 | 0 |
| C11 | 0 | 0 | 0 | 0 | 0 | 0 | 0 | 0 | 0 | 0 | 0 | 100 | 0 | 0 | 0 |
| C12 | 0 | 0 | 0 | 0 | 0 | 0 | 0 | 0 | 0 | 0 | 0 | 0 | 100 | 0 | 0 |
| C13 | 0 | 0 | 0 | 0 | 0 | 0 | 0 | 0 | 0 | 0 | 0 | 0 | 0 | 100 | 0 |
| C14 | 0 | 0 | 0 | 0 | 0 | 0 | 0 | 0 | 0 | 0 | 0 | 0 | 0 | 0 | 100 |
| Comprehensive accuracy: 97.1% | |||||||||||||||
| Class | C0 | C1 | C2 | C3 | C4 | C5 | C6 | C7 | C8 | C9 | C10 | C11 | C12 | C13 | C14 |
|---|---|---|---|---|---|---|---|---|---|---|---|---|---|---|---|
| C0 | 90 | 0 | 0 | 0 | 0 | 7 | 0 | 0 | 3 | 0 | 0 | 0 | 0 | 0 | 0 |
| C1 | 0 | 90 | 0 | 4 | 0 | 0 | 0 | 0 | 0 | 0 | 0 | 0 | 6 | 0 | 0 |
| C2 | 0 | 0 | 94 | 0 | 0 | 0 | 0 | 0 | 0 | 0 | 0 | 0 | 0 | 6 | 0 |
| C3 | 0 | 3 | 0 | 97 | 0 | 0 | 0 | 0 | 0 | 0 | 0 | 0 | 0 | 0 | 0 |
| C4 | 0 | 0 | 0 | 0 | 91 | 0 | 0 | 0 | 0 | 0 | 0 | 0 | 0 | 0 | 9 |
| C5 | 0 | 0 | 0 | 0 | 0 | 100 | 0 | 0 | 0 | 0 | 0 | 0 | 0 | 0 | 0 |
| C6 | 0 | 0 | 0 | 0 | 0 | 0 | 94 | 0 | 1 | 0 | 0 | 5 | 0 | 0 | 0 |
| C7 | 0 | 0 | 0 | 0 | 0 | 0 | 0 | 100 | 0 | 0 | 0 | 0 | 0 | 0 | 0 |
| C8 | 1 | 0 | 0 | 0 | 0 | 0 | 0 | 0 | 99 | 0 | 0 | 0 | 0 | 0 | 0 |
| C9 | 0 | 0 | 0 | 0 | 0 | 0 | 0 | 1 | 0 | 99 | 0 | 0 | 0 | 0 | 0 |
| C10 | 0 | 0 | 0 | 0 | 0 | 0 | 0 | 0 | 0 | 0 | 100 | 0 | 0 | 0 | 0 |
| C11 | 0 | 0 | 0 | 0 | 0 | 0 | 0 | 0 | 0 | 2 | 0 | 98 | 0 | 0 | 0 |
| C12 | 0 | 0 | 0 | 0 | 0 | 0 | 0 | 0 | 0 | 0 | 0 | 0 | 100 | 0 | 0 |
| C13 | 0 | 0 | 0 | 0 | 0 | 0 | 0 | 0 | 0 | 0 | 0 | 0 | 0 | 100 | 0 |
| C14 | 0 | 0 | 0 | 0 | 0 | 0 | 0 | 0 | 0 | 0 | 0 | 0 | 0 | 0 | 100 |
| Comprehensive accuracy: 96.8% | |||||||||||||||
4.3. Comparison Experiment and Analysis
| SNR | Feature Selection Method | The Number of Features | Classification Accuracy(%) | |||
|---|---|---|---|---|---|---|
| RF | SVM | NN | DT | |||
| 50 dB | EnI + SFS | 4 | 99.7 | 95.5 | 98.9 | 98.1 |
| GiI + SFS | 4 | 82.6 | 74.6 | 76.1 | 75.3 | |
| EnI + SFS | 10 | 99.9 | 98.6 | 99.6 | 99.0 | |
| GiI + SFS | 10 | 99.9 | 98.5 | 99.7 | 98.9 | |
| SFS | 13 | 99.4 | 98.3 | 99.5 | 98.3 | |
| SBS | 15 | 99.8 | 98.7 | 99.5 | 99.2 | |
| ALL | 35 | 99.9 | 98.9 | 97.6 | 99.5 | |
| 40 dB | EnI + SFS | 4 | 99.9 | 96.1 | 99.2 | 99.4 |
| GiI + SFS | 4 | 84.7 | 72.1 | 77.2 | 76.7 | |
| EnI + SFS | 10 | 100 | 96.8 | 99.8 | 99.7 | |
| GiI + SFS | 10 | 100 | 98.4 | 99.8 | 99.4 | |
| SFS | 13 | 99.6 | 98.4 | 99.6 | 98.7 | |
| SBS | 15 | 99.9 | 98.5 | 99.7 | 99.6 | |
| ALL | 35 | 100 | 99.3 | 98.2 | 99.9 | |
| 30 dB | EnI + SFS | 4 | 99.7 | 95.8 | 99.1 | 98.5 |
| GiI + SFS | 4 | 79.3 | 70.1 | 71.9 | 72.1 | |
| EnI + SFS | 10 | 99.7 | 96.2 | 99.6 | 99.0 | |
| GiI + SFS | 10 | 99.7 | 97.9 | 99.5 | 99.0 | |
| SFS | 13 | 98.8 | 97.7 | 99.1 | 98.0 | |
| SBS | 15 | 99.7 | 97.9 | 99.5 | 99.1 | |
| ALL | 35 | 99.7 | 98.2 | 97.6 | 99.6 | |
| 20 dB | EnI + SFS | 4 | 95.9 | 94.8 | 94.2 | 92.5 |
| GiI + SFS | 4 | 66.3 | 59.5 | 63.5 | 60.9 | |
| EnI + SFS | 10 | 97.1 | 95.9 | 95.2 | 93.9 | |
| GiI + SFS | 10 | 96.8 | 90.3 | 95.0 | 85.5 | |
| SFS | 13 | 90.3 | 90.7 | 88.7 | 80.5 | |
| SBS | 15 | 98.5 | 88.6 | 94.8 | 94.2 | |
| ALL | 35 | 97.6 | 90.9 | 94.5 | 95.0 | |
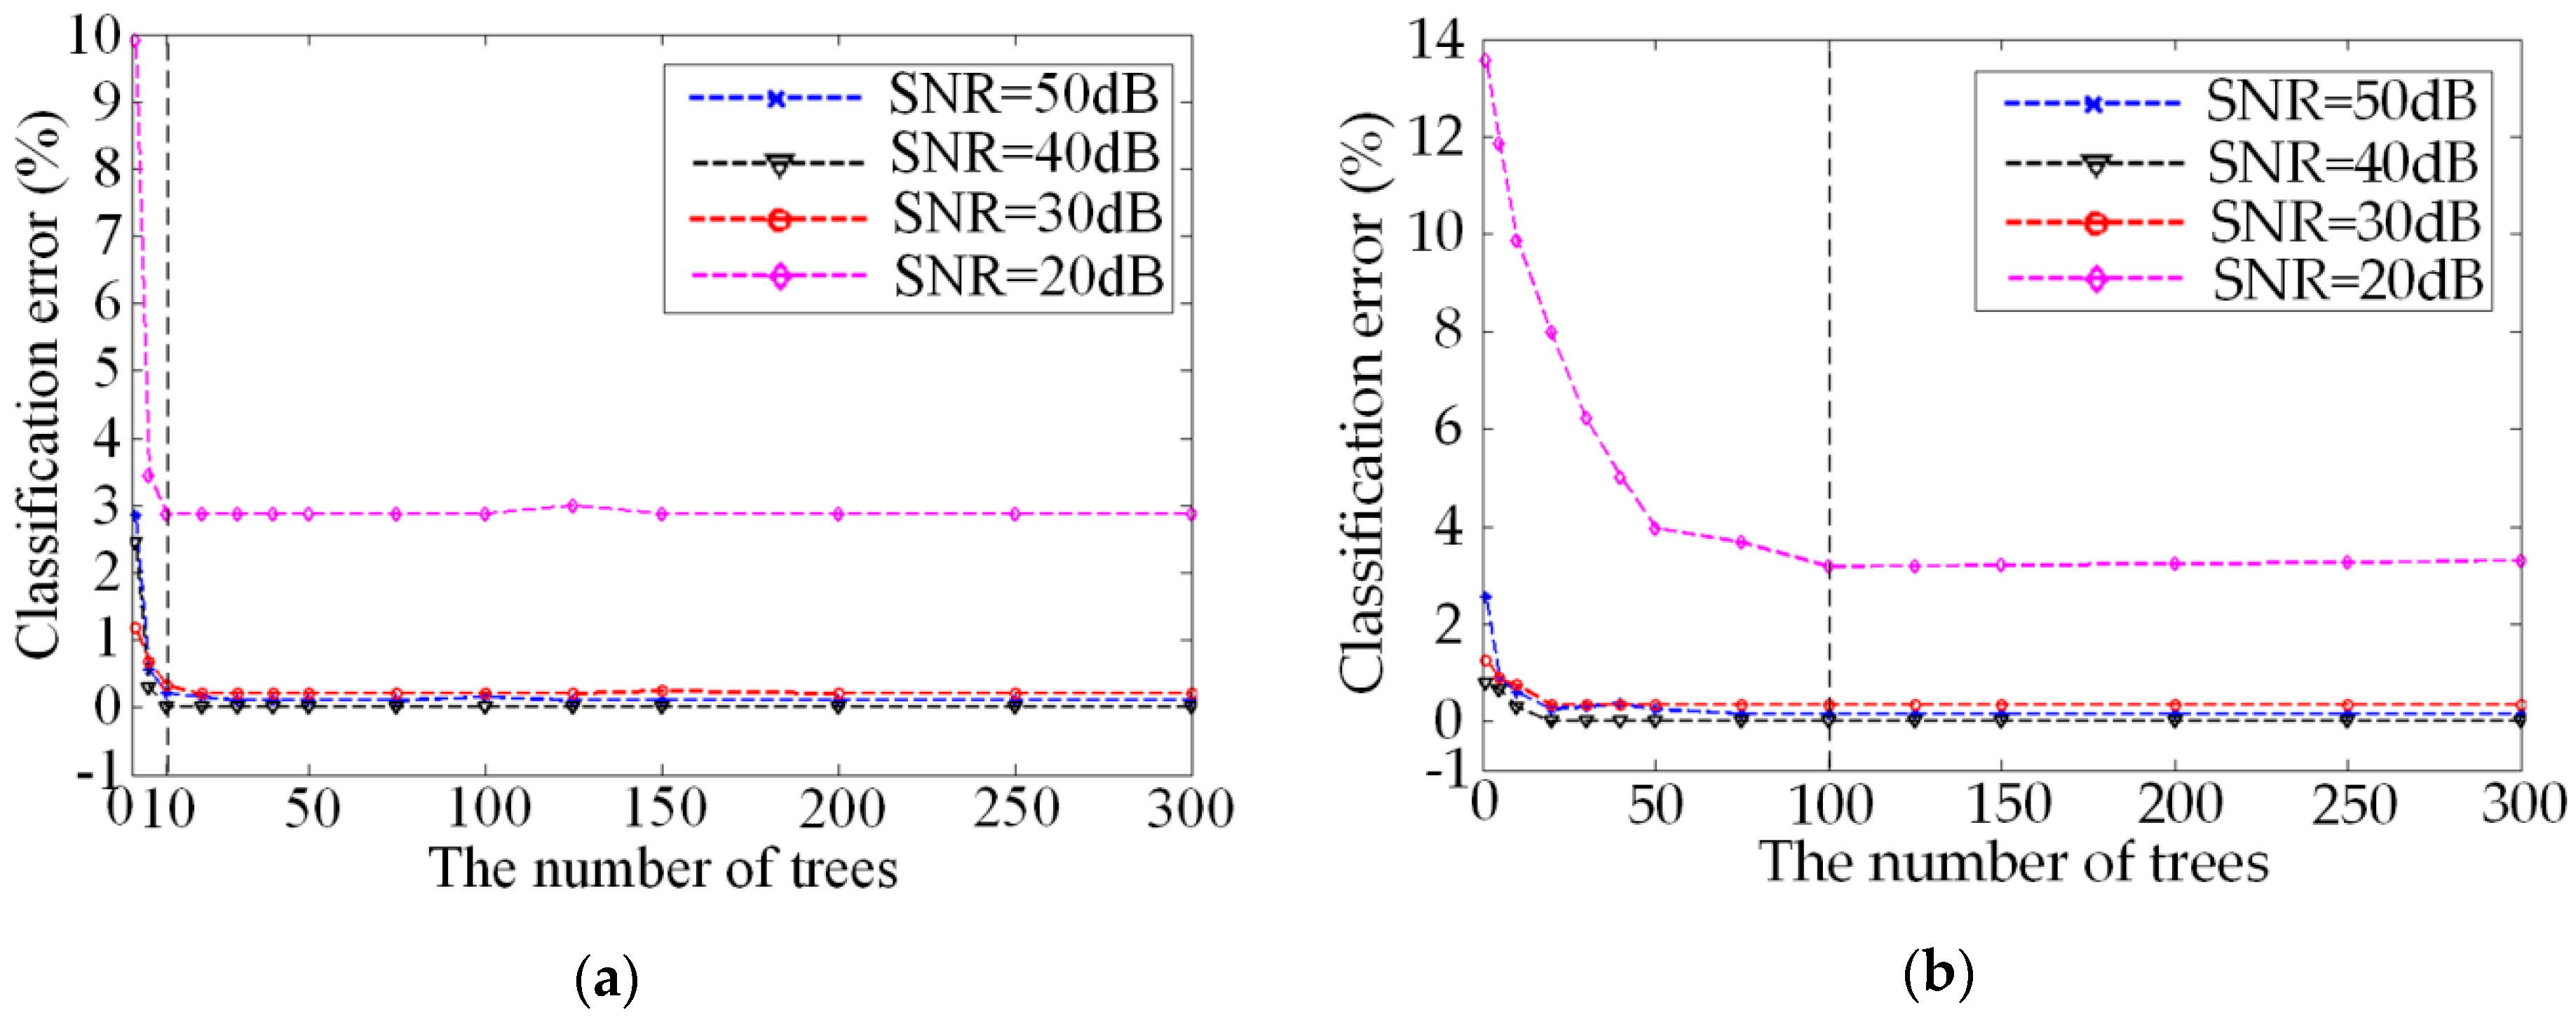
4.4. The Determination of Tree Number of RF Classifier
4.5. Affection of Signal Processing Method on Classification Accuracy
| Feature Extraction Methods Based on DWT | |||
|---|---|---|---|
| Mean | Energy | ||
| Standard deviation | Shannon entropy | ||
| Skewness | Log energy entropy | ||
| Kurtosis | Norm entropy | ||
| RMS | |||
| Feature Extraction Methods Based on WPT | |||
|---|---|---|---|
| Mean | Kurtosis | ||
| Standard deviation | Energy | ||
| Skewness | Entropy | ||
| The Numbers and Names of the Selected Features Extracted from DWT Method | |||||
|---|---|---|---|---|---|
| 7 | 7th level of mean | 37 | 7th level of kurtosis | 65 | 5th level of Shannon entropy |
| 9 | 9th level of mean | 44 | 4th level of RMS | 67 | 7th level of Shannon entropy |
| 14 | 4th level of Std. Deviation | 45 | 5th level of RMS | 84 | 4th level of norm entropy |
| 15 | 5th level of Std. Deviation | 48 | 8th level of RMS | 85 | 5th level of norm entropy |
| 20 | App. level of Std. deviation | 54 | 4th level of energy | 86 | 6th level of norm entropy |
| 27 | 7th level of Skewness | 55 | 5th level of energy | 87 | 7th level of norm entropy |
| 32 | 2th level of kurtosis | 58 | 8th level of energy | 90 | App. level of norm entropy |
| 35 | 5th level of kurtosis | 64 | 4th level of Shannon entropy | ||
| The Numbers and Names of the Selected Features Extracted from WPT Method | |||||
|---|---|---|---|---|---|
| 1 | Mean of 1st node | 49 | kurtosis of 1st node | 61 | kurtosis of 13th node |
| 2 | Mean of 2nd node | 50 | kurtosis of 2nd node | 62 | kurtosis of 14th node |
| 4 | Mean of 4th node | 51 | kurtosis of 3rd node | 64 | kurtosis of 16th node |
| 7 | Mean of 7th node | 52 | kurtosis of 4th node | 65 | energy of 1st node |
| 17 | Std. deviation of 1st node | 53 | kurtosis of 5th node | 66 | energy of 2ndnode |
| 18 | Std. deviation of 2nd node | 54 | kurtosis of 6th node | 68 | energy of 4th node |
| 20 | Std. deviation of 4th node | 55 | kurtosis of 7th node | 81 | entropy of 1st node |
| 33 | skewness of 1st node | 56 | kurtosis of 8th node | 82 | entropy of 2nd node |
| 34 | skewness of 2nd node | 58 | kurtosis of 10th node | 84 | entropy of 4th node |
| SNR | Feature Selection | Classification Accuracy with Different Signal Processing Method(%) | ||
|---|---|---|---|---|
| ST | DWT | WPT | ||
| 50 dB | No | 99.7 | 98.4 | 95.5 |
| Yes | 99.9 | 97.5 | 94.2 | |
| 40 dB | No | 100 | 98.8 | 96.4 |
| Yes | 100 | 98.9 | 94.8 | |
| 30 dB | No | 99.7 | 97.1 | 94.0 |
| Yes | 99.7 | 96.7 | 91.5 | |
| 20 dB | No | 97.6 | 83.5 | 82.9 |
| Yes | 97.1 | 85.8 | 82.6 | |
5. Conclusions
- (1)
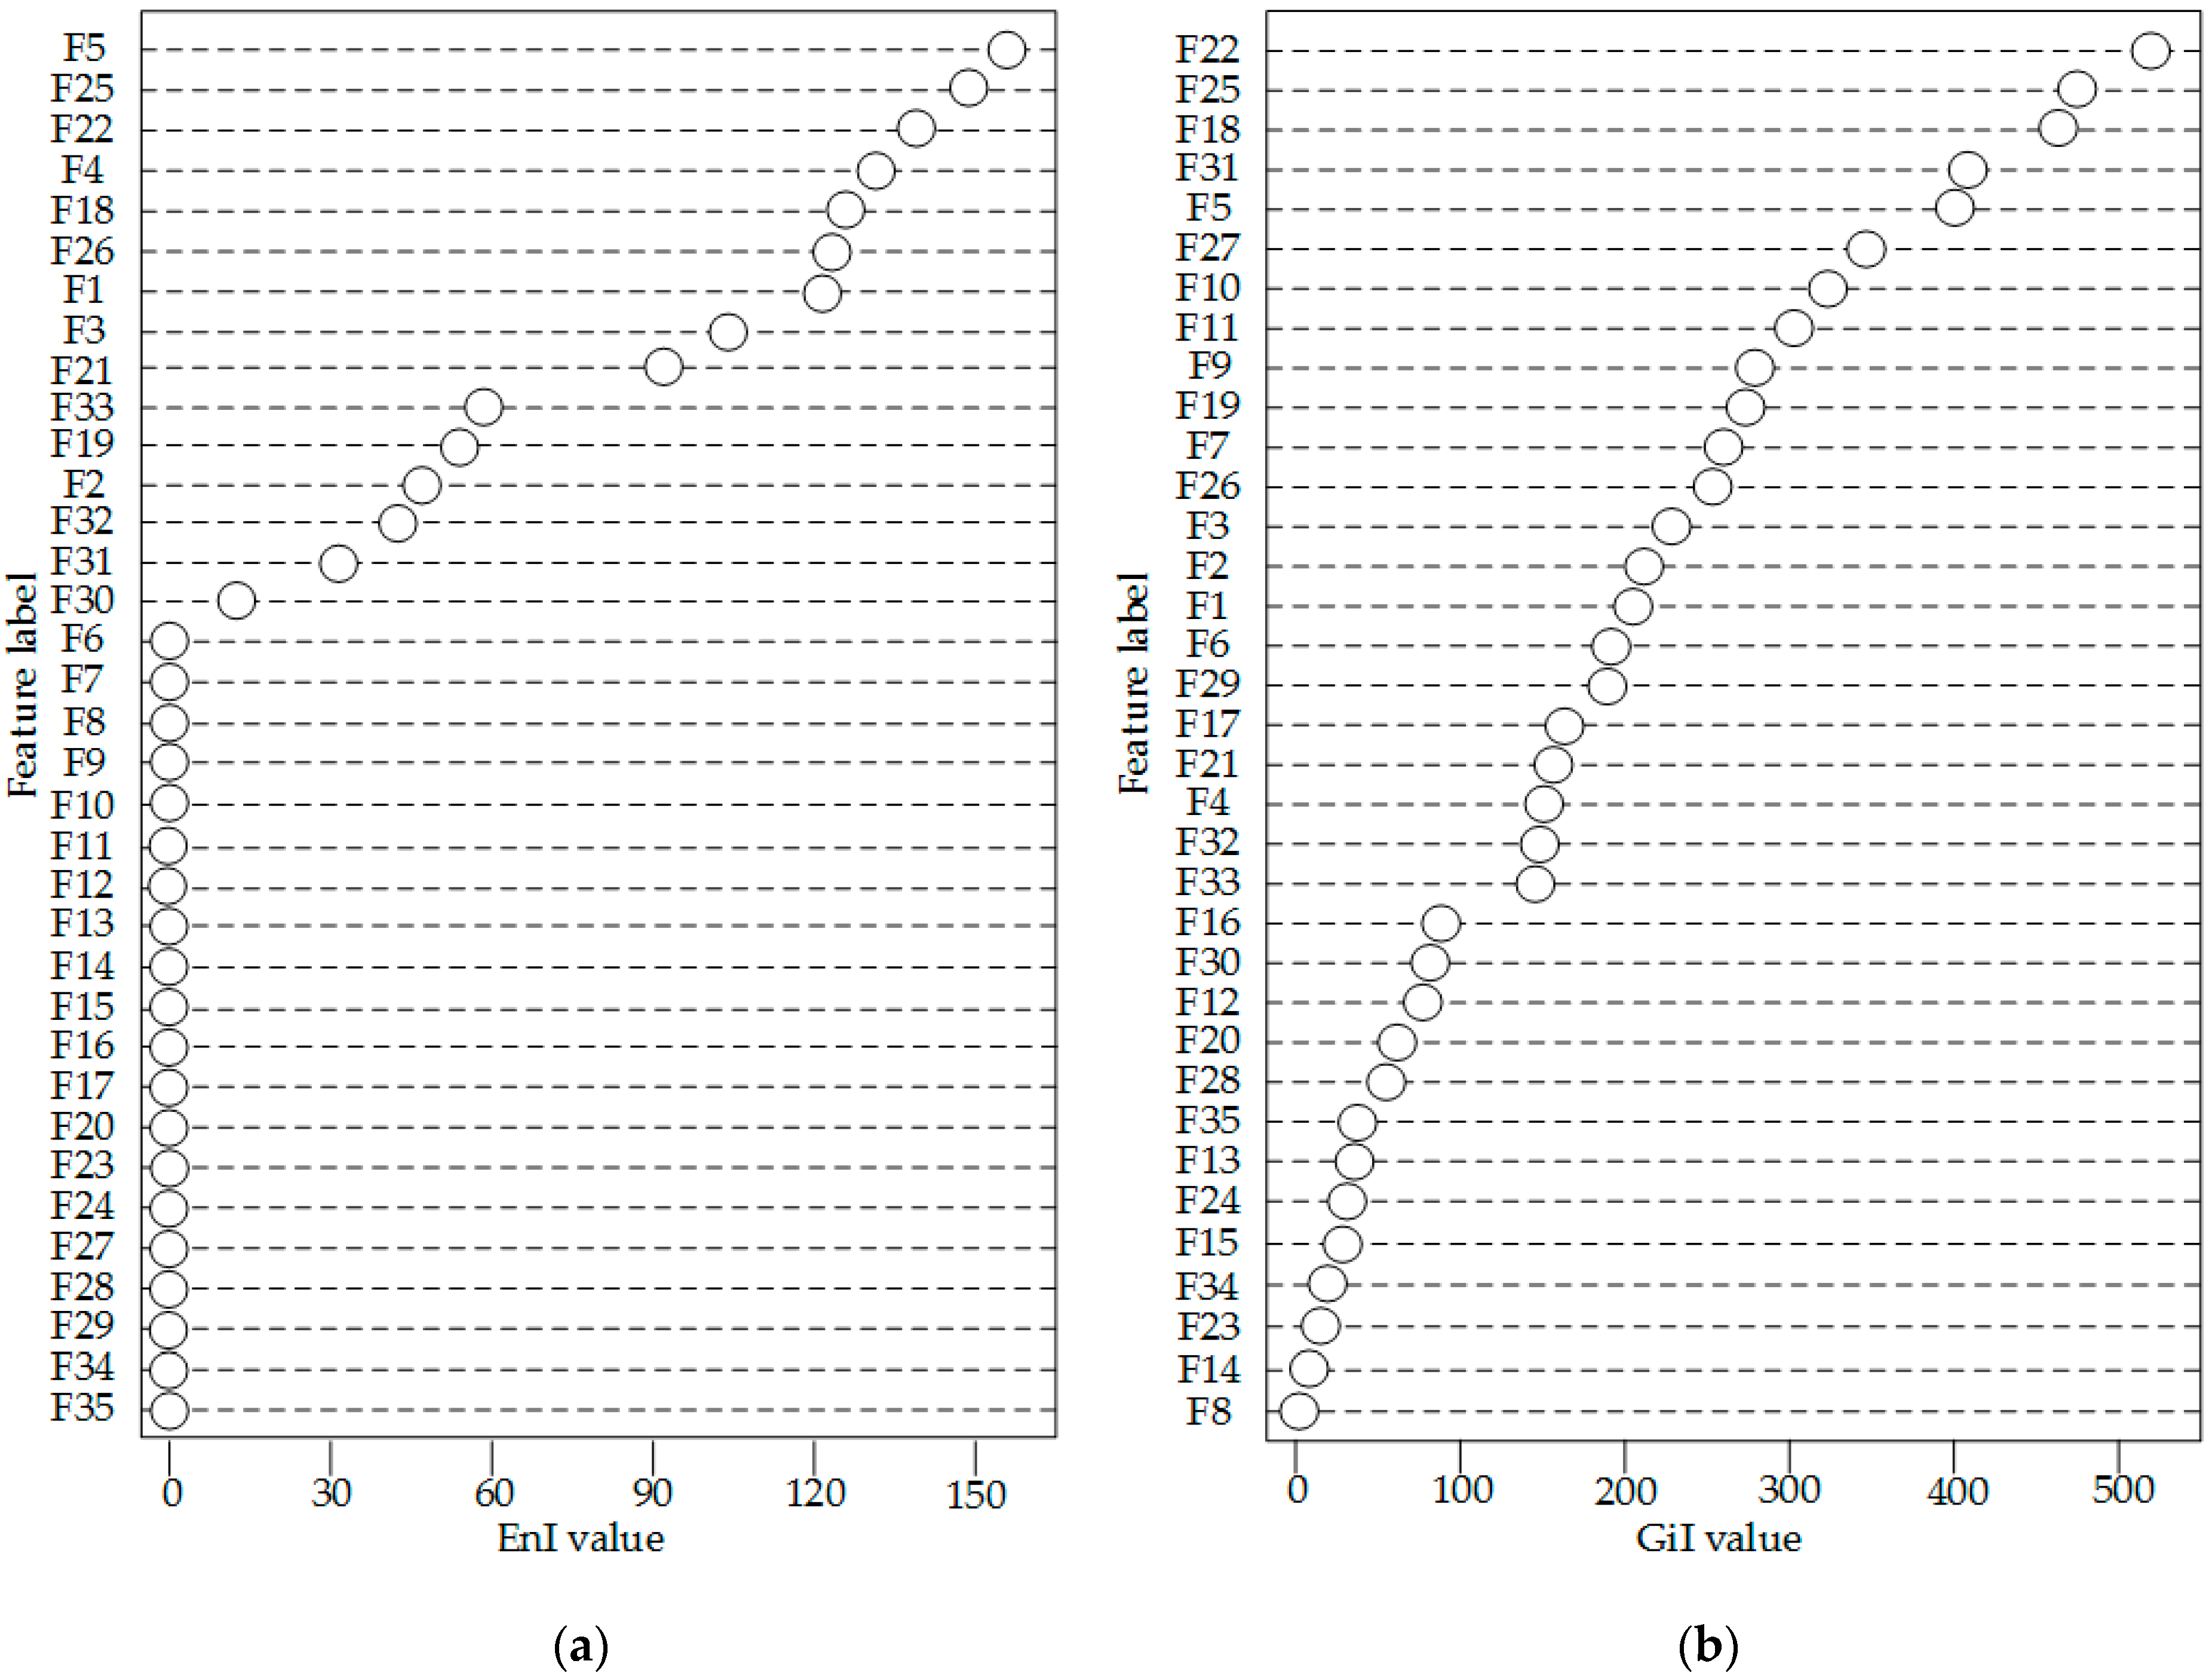
- The EnI based feature selection method used in the new approach calculated the EnI value during the training process of RF. These values provide the theoretical basis for SFS search strategy and improve the efficiency of feature search strategy than GiI based method.
- (2)
- RF is used for disturbance identification. While remains the classification accuracy and efficiency as DT method, RF also increases the generalization ability of the PQ classifier.
- (3)
- The new method has good anti-noise ability. It can use the same feature subset and RF structure to achieve satisfying classification accuracy under different noise environments.
Acknowledgments
Author Contributions
Conflicts of Interest
Abbreviations
| PQ | Power quality |
| RF | Random forest |
| ST | S-transform |
| EnI | Entropy-importance |
| GiI | Gini-importance |
| SFS | Sequential forward search |
| SBS | Sequential backward search |
| DGs | Distributed generators |
| TFA | Time-frequency analysis |
| HHT | Hilbert–Huang transform |
| WT | Wavelet transform |
| NN | Neural network |
| SVM | Support vector machine |
| FR | Fuzzy rule |
| DT | Decision tree |
| ELM | Extreme learning machine |
| STMM | ST modular matrix |
| STD | The standard deviation |
| THD | The total harmonic distortion |
| RMS | The root mean square |
| SNR | Signal-to-noise ratio |
| DWT | Discrete wavelet transform |
| WPT | Wavelet package transform |
References
- Saini, M.K.; Kapoor, R. Classification of power quality events—A review. Int. J. Electr. Power Energy Syst. 2012, 43, 11–19. [Google Scholar] [CrossRef]
- Saqib, M.A.; Saleem, A.Z. Power-quality issues and the need for reactive-power compensation in the grid integration of wind power. Renew. Sustain. Energy Rev. 2015, 43, 51–64. [Google Scholar] [CrossRef]
- Honrubia-Escribano, A.; García-Sánchez, T.; Gómez-Lázaro, E.; Muljadi, E.; Molina-García, A. Power quality surveys of photovoltaic power plants: Characterisation and analysis of grid-code requirements. IET Renew. Power Gener. 2015, 9, 466–473. [Google Scholar] [CrossRef]
- Mahela, O.P.; Shaik, A.G.; Gupta, N. A critical review of detection and classification of power quality events. Renew. Sustain. Energy Rev. 2015, 41, 495–505. [Google Scholar] [CrossRef]
- Afroni, M.J.; Sutanto, D.; Stirling, D. Analysis of Nonstationary Power-Quality Waveforms Using Iterative Hilbert Huang Transform and SAX Algorithm. IEEE Trans. Power Deliv. 2013, 28, 2134–2144. [Google Scholar] [CrossRef]
- Ozgonenel, O.; Yalcin, T.; Guney, I.; Kurt, U. A new classification for power quality events in distribution systems. Electr. Power Syst. Res. 2013, 95, 192–199. [Google Scholar] [CrossRef]
- He, S.; Li, K.; Zhang, M. A real-time power quality disturbances classification using hybrid method based on s-transform and dynamics. IEEE Trans. Instrum. Meas. 2013, 62, 2465–2475. [Google Scholar] [CrossRef]
- Babu, P.R.; Dash, P.K.; Swain, S.K.; Sivanagaraju, S. A new fast discrete S-transform and decision tree for the classification and monitoring of power quality disturbance waveforms. Int. Trans. Electr. Energy Syst. 2014, 24, 1279–1300. [Google Scholar] [CrossRef]
- Rodríguez, A.; Aguado, J.A.; Martín, F.; López, J.J.; Muñoz, F.; Ruiz, J.E. Rule-based classification of power quality disturbances using s-transform. Electr. Power Syst. Res. 2012, 86, 113–121. [Google Scholar] [CrossRef]
- Yong, D.D.; Bhowmik, S.; Magnago, F. An effective power quality classifier using wavelet transform and support vector machines. Expert Syst. Appl. 2015, 42, 6075–6081. [Google Scholar] [CrossRef]
- Zafar, T.; Morsi, W.G. Power quality and the un-decimated wavelet transform: An analytic approach for time-varying disturbances. Electr. Power Syst. Res. 2013, 96, 201–210. [Google Scholar] [CrossRef]
- Dehghani, H.; Vahidi, B.; Naghizadeh, R.A.; Hosseinian, S.H. Power quality disturbance classification using a statistical and wavelet-based hidden markov model with dempster–shafer algorithm. Int. J. Electr. Power Energy Syst. 2012, 47, 368–377. [Google Scholar] [CrossRef]
- Huang, N.; Xu, D.; Liu, X.; Lin, L. Power quality disturbances classification based on s-transform and probabilistic neural network. Neurocomputing 2012, 98, 12–23. [Google Scholar] [CrossRef]
- Erişti, H.; Demir, Y. Automatic classification of power quality events and disturbances using wavelet transform and support vector machines. IET Gener. Transm. Distrib. 2012, 6, 968–976. [Google Scholar] [CrossRef]
- Lee, C.Y.; Shen, Y.X. Optimal feature selection for power-quality disturbances classification. IEEE Trans. Power Deliv. 2011, 26, 2342–2351. [Google Scholar] [CrossRef]
- Sánchez, P.; Montoya, F.G.; Manzano-Agugliaro, F.; Gil, C. Genetic algorithm for s-transform optimisation in the analysis and classification of electrical signal perturbations. Expert Syst. Appl. 2013, 40, 6766–6777. [Google Scholar] [CrossRef]
- Dalai, S.; Chatterjee, B.; Dey, D.; Chakravorti, S.; Bhattacharya, K. Rough-set-based feature selection and classification for power quality sensing device employing correlation techniques. IEEE Sens. J. 2013, 13, 563–573. [Google Scholar] [CrossRef]
- Valtierra-Rodriguez, M.; Romero-Troncoso, R.J.; Osornio-Rios, R.A.; Garcia-Perez, A. Detection and Classification of Single and Combined Power Quality Disturbances Using Neural Networks. IEEE Trans. Ind. Electron. 2014, 61, 2473–2482. [Google Scholar] [CrossRef]
- Seera, M.; Lim, C.P.; Chu, K.L.; Singh, H. A modified fuzzy min–max neural network for data clustering and its application to power quality monitoring. Appl. Soft Comput. 2015, 28, 19–29. [Google Scholar] [CrossRef]
- Kanirajan, P.; Kumar, V.S. Power quality disturbance detection and classification using wavelet and RBFNN. Appl. Soft Comput. 2015, 35, 470–481. [Google Scholar] [CrossRef]
- Manimala, K.; David, I.G.; Selvi, K. A novel data selection technique using fuzzy c-means clustering to enhance SVM-based power quality classification. Soft Comput. 2015, 19, 3123–3144. [Google Scholar] [CrossRef]
- Liu, Z.; Cui, Y.; Li, W. A classification method for complex power quality disturbances using EEMD and rank wavelet SVM. IEEE Trans. Smart Grid 2015, 6, 1678–1685. [Google Scholar] [CrossRef]
- Biswal, B.; Biswal, M.K.; Dash, P.K.; Mishra, S. Power quality event characterization using support vector machine and optimization using advanced immune algorithm. Neurocomputing 2013, 103, 75–86. [Google Scholar] [CrossRef]
- Huang, N.; Zhang, S.; Cai, G.; Xu, D. Power Quality Disturbances Recognition Based on a Multiresolution Generalized S-Transform and a Pso-Improved Decision Tree. Energies 2015, 8, 549–572. [Google Scholar] [CrossRef]
- Kumar, R.; Singh, B.; Shahani, D.T.; Chandra, A.; Al-Haddad, K. Recognition of Power-Quality Disturbances Using S-transform-Based ANN Classifier and Rule-Based Decision Tree. IEEE Trans. Ind. Appl. 2015, 51, 1249–1258. [Google Scholar] [CrossRef]
- Liu, Z.G.; Cui, Y.; Li, W.H. Combined Power Quality Disturbances Recognition Using Wavelet Packet Entropies and S-Transform. Entropy 2015, 17, 5811–5828. [Google Scholar] [CrossRef]
- Ray, P.K.; Mohanty, S.R.; Kishor, N.; Catalao, J. Optimal feature and decision tree-based classification of power quality disturbances in distributed generation systems. IEEE Trans. Sustain. Energy 2014, 5, 200–208. [Google Scholar] [CrossRef]
- Erişti, H.; Yıldırım, Ö.; Erişti, B.; Demir, Y. Automatic recognition system of underlying causes of power quality disturbances based on S-Transform and Extreme Learning Machine. Int. J. Electr. Power Energy Syst. 2014, 61, 553–562. [Google Scholar] [CrossRef]
- Breiman, L. Random Forests. Mach. Learn. 2001, 45, 5–32. [Google Scholar] [CrossRef]
- Fernández-Delgado, M.; Cernadas, E.; Barro, S.; Amorim, D. Do we need hundreds of classifiers to solve real world classification problems? J. Mach. Learn. Res. 2014, 15, 3133–3181. [Google Scholar]
- Li, T.; Ni, B.; Wu, X.; Gao, Q.; Li, Q.; Sun, D. On random hyper-class random forest for visual classification. Neurocomputing 2016, 172, 281–289. [Google Scholar] [CrossRef]
- Borland, L.; Plastino, A.R.; Tsallis, C. Information gain within nonextensive thermostatistics. J. Math. Phys. 1998, 39, 6490–6501. [Google Scholar] [CrossRef]
- Lerman, R.I.; Yitzhaki, S. A note on the calculation and interpretation of the gini index. Econ. Lett. 1984, 15, 363–368. [Google Scholar] [CrossRef]
- Zheng, Y.; Kwoh, C.K. A feature subset selection method based on high-dimensional mutual information. Entropy 2011, 13, 860–901. [Google Scholar] [CrossRef]
- Gunal, S.; Gerek, O.N.; Ece, D.G.; Edizkan, R. The search for optimal feature set in power quality event classification. Expert Syst. Appl. 2009, 36, 10266–10273. [Google Scholar] [CrossRef]
- Whitney, W. A direct method of nonparametric measurement selection. IEEE Trans. Comput. 1971, 20, 1100–1103. [Google Scholar] [CrossRef]
- Erişti, H.; Yıldırım, Ö.; Erişti, B.; Demir, Y. Optimal feature selection for classification of the power quality events using wavelet transform and least squares support vector machines. Int. J. Electr. Power Energy Syst. 2013, 49, 95–103. [Google Scholar] [CrossRef]
- Panigrahi, B.K.; Pandi, V.R. Optimal feature selection for classification of power quality disturbances using wavelet packet-based fuzzy k-nearest neighbour algorithm. IET Gener. Transm. Distrib. 2009, 3, 296–306. [Google Scholar] [CrossRef]
© 2016 by the authors; licensee MDPI, Basel, Switzerland. This article is an open access article distributed under the terms and conditions of the Creative Commons by Attribution (CC-BY) license (http://creativecommons.org/licenses/by/4.0/).
Share and Cite
Huang, N.; Lu, G.; Cai, G.; Xu, D.; Xu, J.; Li, F.; Zhang, L. Feature Selection of Power Quality Disturbance Signals with an Entropy-Importance-Based Random Forest. Entropy 2016, 18, 44. https://doi.org/10.3390/e18020044
Huang N, Lu G, Cai G, Xu D, Xu J, Li F, Zhang L. Feature Selection of Power Quality Disturbance Signals with an Entropy-Importance-Based Random Forest. Entropy. 2016; 18(2):44. https://doi.org/10.3390/e18020044
Chicago/Turabian StyleHuang, Nantian, Guobo Lu, Guowei Cai, Dianguo Xu, Jiafeng Xu, Fuqing Li, and Liying Zhang. 2016. "Feature Selection of Power Quality Disturbance Signals with an Entropy-Importance-Based Random Forest" Entropy 18, no. 2: 44. https://doi.org/10.3390/e18020044
APA StyleHuang, N., Lu, G., Cai, G., Xu, D., Xu, J., Li, F., & Zhang, L. (2016). Feature Selection of Power Quality Disturbance Signals with an Entropy-Importance-Based Random Forest. Entropy, 18(2), 44. https://doi.org/10.3390/e18020044