Article

A Novel Sequence-Based Feature for the Identification of DNA-Binding Sites in Proteins Using Jensen–Shannon Divergence

1
Institute of Computer Science, University of Göttingen, Göttingen 37077, Germany
2
Institute of Bioinformatics, University Medical Center Göttingen, Göttingen 37077, Germany
*
Author to whom correspondence should be addressed.
Entropy 2016, 18(10), 379; https://doi.org/10.3390/e18100379
Submission received: 30 July 2016 / Revised: 19 October 2016 / Accepted: 20 October 2016 / Published: 24 October 2016
(This article belongs to the Special Issue Entropy on Biosignals and Intelligent Systems)

Abstract

:
The knowledge of protein-DNA interactions is essential to fully understand the molecular activities of life. Many research groups have developed various tools which are either structure- or sequence-based approaches to predict the DNA-binding residues in proteins. The structure-based methods usually achieve good results, but require the knowledge of the 3D structure of protein; while sequence-based methods can be applied to high-throughput of proteins, but require good features. In this study, we present a new information theoretic feature derived from Jensen–Shannon Divergence (JSD) between amino acid distribution of a site and the background distribution of non-binding sites. Our new feature indicates the difference of a certain site from a non-binding site, thus it is informative for detecting binding sites in proteins. We conduct the study with a five-fold cross validation of 263 proteins utilizing the Random Forest classifier. We evaluate the functionality of our new features by combining them with other popular existing features such as position-specific scoring matrix (PSSM), orthogonal binary vector (OBV), and secondary structure (SS). We notice that by adding our features, we can significantly boost the performance of Random Forest classifier, with a clear increment of sensitivity and Matthews correlation coefficient (MCC).

1. Introduction

Interactions between proteins and DNA play essential roles for controlling of several biological processes such as transcription, translation, DNA replication, and gene regulation [1,2,3]. An important step to understand the underlying molecular mechanisms of these interactions is the identification of DNA-binding residues in proteins. These residues can provide a great insight into the protein function which leads to gene expression and could also facilitate the generation of new drugs [4,5].
Until now, several groups have published different studies based on either experimental or computational identification of DNA-binding proteins [1,6,7,8,9,10,11] as well as residues in these proteins [12,13,14,15,16,17,18,19,20,21,22,23]. However, the usage of experimental approaches for the determination of binding sites is still challenging since they are often demanding, relatively expensive, and time-consuming. To overcome the difficulty of experimental approaches, it is highly desired to develop fast and reliable computational methods for the prediction of DNA-binding residues. For this purpose, several state-of-the-art prediction methods have been developed for the automated identification of those residues. Such methods can be assigned into two main categories: (i) based on the information observed from structure and sequence in a collective manner; (ii) based on the features derived directly from the amino acid sequence alone (for more detail see reviews [24] and [25]). Although the first type of approaches provides promising information about DNA-binding residues in proteins, their application is difficult due to the limited number of experimentally determined protein structures. In contrast to structure-based approaches, sequence-based methods have been developed by extracting different sequence information features, like amino acid frequency, position-specific scoring matrix (PSSM), BLOSUM62 matrix, sequence conservation, etc. [3,4,18,19,26,27]. Using these features, several machine learning techniques have been applied to construct the classifiers for the prediction of binding residues in proteins. To this end, a variety of support vector machine (SVM) classifiers have been developed in recent studies [2,17,18,19,23,26,28]. For example, Westhof et al. have recently used an SVM classifier approach in their study, named RBscore (http://ahsoka.u-strasbg.fr/rbscore/), by using the physicochemical and evolutionary features that are linearly combined with a residue neighboring network [2]. Further, SVM algorithms were also applied for the models proposed in BindN [18], DISIS [19], BindN+ [23], DP-Bind [27] using different sequence information features including the biochemical property of amino acids, sequence conservation, evolutionary information in terms of PSSM, the side chain pKa value, hydrophobicity index, molecular mass and BLOSUM62 matrix. In addition, other machine learning classifiers such as neural network models [13,15], naive Bayes classifier [26], Random Forest classifiers (RF) [4,29,30] have been developed based on the features derived from protein sequences. For example, Wong et al. [29] have recently developed a successful method using RF classifier with both DNA and protein derived features to predict the specific residue-nucleotide interactions for different DNA-binding domain families.
Despite the rich literature on the sequence-based methods as mentioned above, to date there is still a need to find suitable feature extraction approaches that can enhance the characteristics of DNA-binding residues and thus help to improve the performance of existing methods for identification of DNA-binding residues in proteins. For this aim, we introduce and evaluate a new information theory-based method for the prediction of these residues using Jensen–Shannon divergence (𝕁𝕊𝔻). As a divergence measure based on the Shannon entropy, 𝕁𝕊𝔻 is a symmetrized and smoothed version of the Kullback-Leibler divergence and is often used for different problems in the field of bioinformatics [31,32,33,34,35]. In this study, following the line of Capra et al. [34] we first quantify the divergence between the observed amino acid distribution of a site in a protein and the background distribution of non-binding sites by using 𝕁𝕊𝔻. After that, in analogy to our previous studies QCMF [32] and CMF [36], we incorporate biochemical signals of binding residues in the calculation of 𝕁𝕊𝔻 that results in the intensification of the DNA-binding residue signals from the non-binding signals.
To demonstrate the performance and functionality of our proposed approach, we apply Random Forest (RF) classifier using our new 𝕁𝕊𝔻 based features together with three widely used machine learning features, namely position-specific scoring matrix (PSSM), secondary structure (SS) information, and orthogonal binary vector (OBV) information (see review [24]). Our results show that using 𝕁𝕊𝔻 based features, RF classifier reaches an improved performance in identifying DNA-binding residues with a significantly higher Matthews correlation coefficient (MCC) value in comparison to using previous features alone. Although we only applied RF classifier in this study, both of our sequence-based features could be used in other classifiers such as SVM, neural networks, or decision trees.

2. Results

In this study, we introduce new sequence-based features using 𝕁𝕊𝔻 to improve the performance of previous machine learning approaches in identification of DNA-binding residues in proteins. For this purpose, we propose new sequence-based features ( f 𝕁 𝕊 𝔻 and f 𝕁 𝕊 𝔻 t ) using 𝕁𝕊𝔻 in two different ways. First, using 𝕁𝕊𝔻, we calculate the divergences between observed amino acid distributions in multiple sequence alignments (MSAs) of proteins under study and the background distribution which is calculated according to amino acid counts at non-binding residue positions in MSAs. In the second step, we transform the observed amino acid distributions with a doubly stochastic matrix (DSM) to enhance the weak signal of binding sites in proteins which could not be predicted in the first step. Finally, we calculate for each residue in proteins 𝕁𝕊𝔻-based scores and use them for the improvement of the performance of machine learning approaches.
To evaluate our new features, we use two frequently considered cut-off distances of 3.5 Å and 5 Å and thus define a residue in a protein as DNA-binding if the distance between at least one atom on its backbone or side chain and the DNA molecule is smaller than the considered cut-off.
The Results section of this study comprises of two parts. First, we investigate the functionality of our new features combining them in Random Forest (RF) classifier with three previous features. The RF classifier is constructed from 4298 positive and 44,805 negative instances extracted from 263 proteins. The performance of the classifier is evaluated using a five-fold cross validation procedure in which we randomly divided the samples into five parts. The assessment is performed by choosing each of these parts as a test set and the remaining four parts as a training set for model selection. Second, to illustrate the usefulness of our new approach for the prediction of DNA-binding residues, we analyzed the proto-oncogenic transcription factor MYC-MAX (PDB-ID: 1NKP) which is a heterodimer protein complex of two proteins. It is important to note that this protein complex is not included in the training dataset.

2.1. Random Forest Classifier

To apply the Random Forest (RF) classifier, we combine our new features ( f 𝕁 𝕊 𝔻 and f 𝕁 𝕊 𝔻 t ) with the features f PSSM , f OBV , and f SS which are widely used for the prediction of DNA-binding residues. Our results show that using our features RF classifier reaches an improved performance in identifying DNA-binding sites with clearly higher statistical values (see Table 1 and Table 2). Moreover, we individually evaluated the combination of our features with existing features. The results suggest that the classifier with f 𝕁 𝕊 𝔻 t feature has provided better sensitivity and comparable Matthews correlation coefficient (MCC) values in comparison to f 𝕁 𝕊 𝔻 feature. However, its specificity is moderately decreased. A further comparison reveals that the usage of our both features together with other features does not affect the performance of the classifier. The details are presented for 3.5 Å in Table 1 and for 5 Å in Table 2 and in Appendix A with the standard error of each of the performance measures over the values obtained in the five iterations (see Table A1 and Table A2).
To further investigate the performance of 𝕁𝕊𝔻-based features proposed in this study, we analyzed two additional datasets, namely RBscore [2] and PreDNA datasets [37]. Although the RBscore and PreDNA datasets initially contain 381 and 224 DNA-binding proteins, respectively, we have eliminated a few proteins since they are either included in our training dataset or ineligible due to their MSAs. Consequently, we constructed RF classifier using 263 proteins (which were also used for cross-validation) and randomly selecting 60 proteins from each dataset for testing, respectively. The results of these analyses consistently suggest that our new features show great complementary effect to the previous features which often leads to clear improvement of the classification performance (see Table 3 and Table 4). The detailed performance of classifier on different features using different cut-offs for each dataset can be found in Appendix A (see Table A3, Table A4, Table A5 and Table A6).
Considering the AUC-ROC and AUC-PR as the only evaluation factor, results indicate that the RF classifier often achieved its best performance based on both cut-off distances if we combine our new f 𝕁 𝕊 𝔻 t feature together with the existing three features (see Table 1, Table 2 and Table 3). Interestingly, by analyzing the PreDNA dataset we observed that RF classifier with f 𝕁 𝕊 𝔻 or f 𝕁 𝕊 𝔻 t features for the cut-off of 3 . 5 Å showed similar performance. However, regarding to the distance cut-off of 5 Å, the classifier with f 𝕁 𝕊 𝔻 feature reached slightly better performance than those with f 𝕁 𝕊 𝔻 t feature (see Table 4). After looking at the overall performances, it is inferred that adding our new features can boost the performance of the RF classifier in terms of AUC-ROC and AUC-PR.

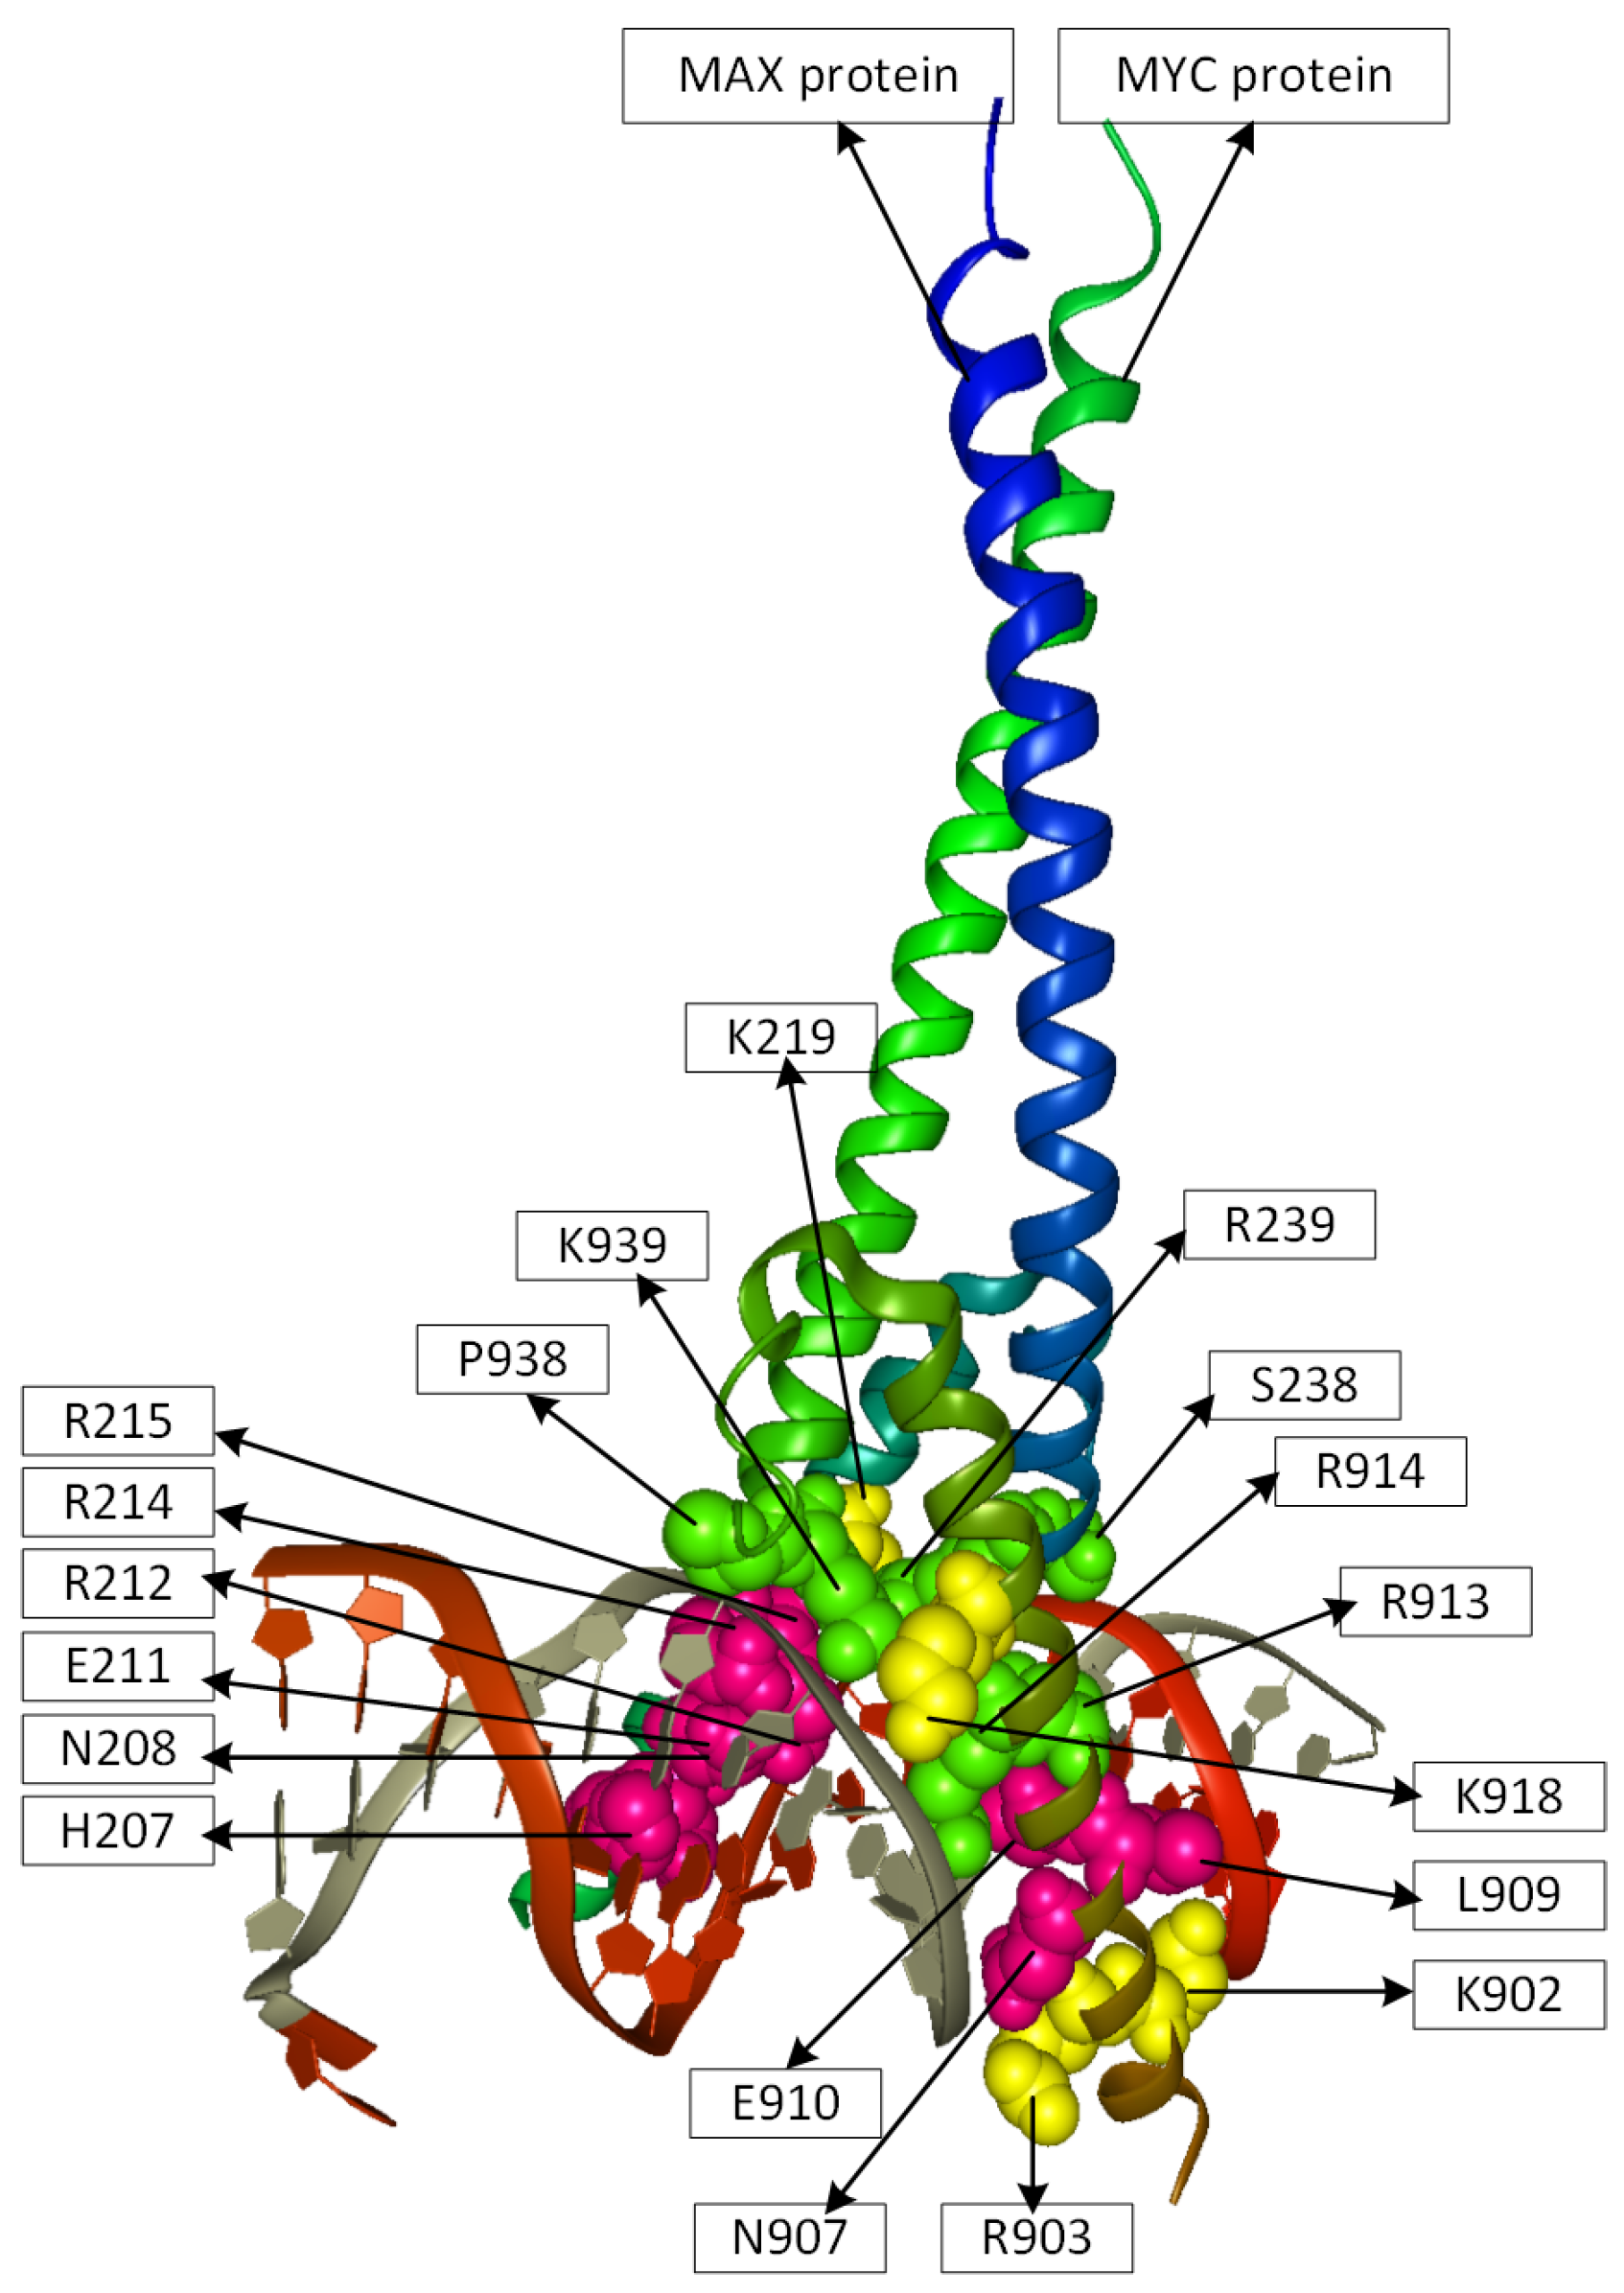
2.2. Position Analysis of the MYC-MAX Protein

The proto-oncobenic transcription factor MYC-MAX (PDB-Entry 1NKP) is a heterodimer protein complex that is active in cell proliferation and is over-expressed in many different cancer types [38]. MYC-MAX transcription factors bind to Enhancer boxes (a core element of the promoter that consists of six nucleotides) and activate transcription of the underlying genes [39].
The amino acid chain of MYC protein consists of 88 residues, ten of which are known DNA-binding sites indicating that their distances to DNA are less than 3.5 Å. Applying RF classifier, which takes a majority vote among the random tree classifiers, with our first feature ( f 𝕁 𝕊 𝔻 ) combined with existing features, we predicted in total 17 residue positions to be DNA-binding in MYC protein. Seven out of these positions (H906, N907, E910, R913, R914, P938, K939) correspond to the true DNA-binding sites of this protein. While the sites R913, R914, P938, and K939 could also be identified by RF classifier without using our new 𝕁𝕊𝔻-based features, the remaining three binding sites could only be detected using our features (for details see Table 5 and Figure 1). Interestingly, using f 𝕁 𝕊 𝔻 t together with f PSSM , f OBV , and f SS , the RF classifier correctly predicted these seven positions again as binding sites.
The second protein in the proto-oncobenic transcription factor complex is the MAX protein which consists of 83 residues including nine DNA-binding sites. Using f 𝕁 𝕊 𝔻 or f 𝕁 𝕊 𝔻 t together with existing features individually, we observed 14 and 13 residue positions to be DNA-binding in MAX protein, respectively. Eight of the predicted positions (H207, N208, E211, R212, R214, R215, S238, R239) found by using either of our both features are true DNA-binding sites in MAX protein. However, without using our new features the RF classifier could only identify two (S238, R239) out of nine true DNA-binding sites in MAX protein (for details see Table 5 and Figure 1). Further, we observed that, the usage of f 𝕁 𝕊 𝔻 t leads to the reduction of false positive predictions in identifying DNA-binding sites in MAX protein.
Moreover, when statistically evaluating both of our features, we observed that using our sequence-based features RF classifier reaches a significantly improved performance in identifying DNA-binding sites of both proteins with significantly higher sensitivity and MCC values whereas the specificity is moderately decreased. The simultaneous usage of both of our features together with f PSSM , f OBV , and f SS could result in the decrement of specificity or MCC values. The details are presented in Table 5.

3. Materials and Methods

In this section, we describe in particular the data we have used and our new residue-wise features designed to predict DNA-binding sites in proteins.

3.1. Materials

To compile our data needed for training and test, we started with the DBP-374 data set of representative protein-DNA complexes from the Protein Data Bank (PDB) [40] published by Wu et al. [5]. Having performed a comparison with the new PDB version, we calculate for every remaining protein a multiple sequence alignment (MSA) using HHblits and the UniProt20 database (version from June 2015) [41]. We eliminated all proteins, the MSA of which has less than 125 rows, so that we finally ended up with a dataset of 263 protein-DNA complexes and associated MSAs. To obtain our results we perform a five-fold cross validation.
As in [5], an amino acid residue is regarded as a binding site, if it contains at least one atom at distance of less than or equal to 3 . 5 Å or 5 Å from any atom of DNA molecule in the DNA-protein complex. Otherwise it is treated as non-binding site. For the distance cut-off of 3 . 5 Å, our set contains 4298 binding sites and 44 , 805 non-binding sites. For the distance cut-off of 5 Å, however, our data set contains 7211 binding sites and 41 , 892 non-binding sites.

3.2. Methods

Let M be a multiple sequence alignment, where its first row represents the protein under study. Every residue of that protein is then uniquely determined by its column. In what follows, we identify the residues of the protein with their columns of the MSA.
Grosse et al. [35] pointed out that the Jensen–Shannon divergence (𝕁𝕊𝔻) is extremely useful when it comes to discriminate between two (or more) sources. Capra and Singh [34] carefully discussed several information theoretic measures like Shannon entropy, von Neumann entropy, relative entropy, and sum-of-pair measures to assess sequence conservation. They were the first using 𝕁𝕊𝔻 in this context and stated its superiority. Gültas et al. [32] showed that the Jensen–Shannon divergence in the context of quantum information theory is of remarkable power. These three articles encouraged us to use 𝕁𝕊𝔻 in this study. Our first idea is to design a new feature for the prediction of DNA-binding sites in proteins which leverages the Jensen–Shannon divergence
𝕁 𝕊 𝔻 p k p n d : = p k + p n d / 2 p k + p n d / 2 .
Therein, p k is the empirical amino acid distribution of the k-th column of the query MSA M, and p n d is the null distribution taken over all non-binding sites of our training data.
More precisely, we represent every column k of every MSA M considered by a 20 × 20 counting matrix C M k . The matrix C is symmetric and its rows as well as columns are indexed by the 20 amino acids. For every ordered pair of amino acids a , a , the matrix coefficient C M k a a is equal to the number of ordered pairs ( i , j ) ( i j ) of row indices of M such that M i k = a and M j k = a .
To compute the null distribution p n d , we first set up the 20 × 20 counting matrix C n d using our training data. C n d is the sum over all matrices C M k , where M ranges over all training MSAs and k ranges over all non-binding site columns of M. Next, the rows of C n d are added up. Finally, the resulting row vector is normalized to obtain p n d .
There is nothing wrong with the idea that a large value 𝕁 𝕊 𝔻 p k p n d indicates that k is a DNA-binding residue. However, no information on binding sites is integrated. Only the non-binding sites of our training data are used to compute p n d . As we have seen in [32] and [36], transforming empirical amino acid distributions of MSA columns by a carefully designed doubly stochastic matrix is an effective way to integrate the binding site signals. To this end, we first set up a counting matrix C b i n d in a way similar to that of calculating the matrix C n d . The difference is that the variable column index k now ranges over all binding site columns of the training MSAs. Taking the counting matrix C b i n d as input, the doubly stochastic matrix D is computed by means of the canonical row-column normalization procedure [42].
Let M be the query MSA having columns. Compared with [32] and [36], we enhance the effect of transforming M’s empirical column distributions by means of the doubly stochastic matrix D just defined. Let k be a column index of M. First, we compute the matrix product C ( t ) M k : = C M k · D . Second, we add up all of C ( t ) M k ’s rows. Finally, we normalize the resulting row to obtain the transformed empirical row distribution p k ( t ) .
We define two window scores score 𝕁 𝕊 𝔻 , M k and score 𝕁 𝕊 𝔻 t , M k of residue k w.r.t. query MSA M, where the window w ( k ) surrounding k formally equals { k 3 , k 2 , k 1 , k , k + 1 , k + 2 , k + 3 } { 1 , 2 , , } . Clearly, if k { 4 , 5 , , 3 } , | w ( k ) | = 7 . Otherwise | w ( k ) | { 4 , 5 , 6 } . Recapitulate that for any real x the binomial coefficient x 2 equals x ( x 1 ) / 2 . We define the scores as follows.
score 𝕁 𝕊 𝔻 , M k : = ι w ( k ) ( 4 | k ι | ) 𝕁 𝕊 𝔻 p k + ι p n d 16 8 | w ( k ) | 2
score 𝕁 𝕊 𝔻 t , M k : = ι w ( k ) ( 4 | k ι | ) 𝕁 𝕊 𝔻 p k + ι ( t ) p n d 16 8 | w ( k ) | 2
The preceding two score definitions are motivated as follows. Bartlett et al. [43] and Panchenko et al. [44] pointed out that exploiting conservation properties of spatial neighbors is useful to predict a residue as functionally important. Since the 3D structures are often unavailable, Capra and Singh [34] developed a window score for such predictions. The concrete shape of our scores takes pattern form Janda et al. [45], who in turn refer to Fischer et al. [33]. Our scores are convex combinations of the Jensen–Shannon terms associated with the residues belonging to the surrounding window w ( k ) . The weights fall linearly in the distance from k.
In a last step, we transform two window scores according to Equations (2) and (3) with respect to the query MSA M into final scores using the Equations (4) and (5), respectively. To this end, for every column index k { 1 , 2 , , } of M we define:
f 𝕁 𝕊 𝔻 , M k : = { k | 1 k , score 𝕁 𝕊 𝔻 , M k score 𝕁 𝕊 𝔻 , M k }
f 𝕁 𝕊 𝔻 t , M k : = { k | 1 k , score 𝕁 𝕊 𝔻 t , M k score 𝕁 𝕊 𝔻 t , M k } .
The Equations (4) and (5) are basically the determination of the percentage of scores below the current one at index k. This transformation procedure is essential because it converts MSA-dependent window scores to MSA-independent scores.
To demonstrate the benefit of our new features, we adopt the features f PSSM , f OBV and f SS devised in [5]. Together with our two new features f 𝕁 𝕊 𝔻 and f 𝕁 𝕊 𝔻 t , we plugged them into the Random Forest (RF) classifier [46] (see Table 1 and Table 2 for the combinations we used). For the RF implementation we used the WEKA data mining software [47].
To deal with the imbalanced data problem, we applied bagging techniques suggested in [48]. Since we make use of five-fold cross validation, we randomly split the dataset into 5 roughly equal-sized parts. Every training phase performed on 4 parts consists of 11 sub-phases. In each such sub-phase we randomly draw twice as many non-binding sites as there are binding sites. We then construct a Random Forest (RF) taking those non-binding sites and all binding sites of the 4 parts as input. Finally, for each instance of the validation part the majority vote of above 11 RF classifiers was taken.

4. Discussion

Our results show that combining either feature f 𝕁 𝕊 𝔻 t or feature f 𝕁 𝕊 𝔻 with the three features f PSSM , f OBV and f SS we have adopted from [5] clearly boosts the performance of the RF-based classifier in identifying the DNA-binding sites in proteins, where feature f 𝕁 𝕊 𝔻 t generally reaches a slightly better performance than feature f 𝕁 𝕊 𝔻 .
Although our two new features and PSSMs are derived from MSAs, Table 1 and Table 2 clearly demonstrate that these approaches carry distinct information. Thus they capture different kinds of evolutionary information. The reason for this essential difference can be explained based on the underlying algorithms. While the PSSM approach consists of statistic which indicates how likely a certain amino acids occurs at a certain position, our 𝕁𝕊𝔻-based approach measures the divergence of a certain distribution to a known non-binding site distribution.
The superiority of feature f 𝕁 𝕊 𝔻 t to feature f 𝕁 𝕊 𝔻 deserves an explanation attempt. Feature f 𝕁 𝕊 𝔻 does not integrate any information on DNA-binding sites. Only training non-binding sites are used. In contrast, feature f 𝕁 𝕊 𝔻 t additionally uses a doubly stochastic matrix gained from the training binding sites. The effect on empirical amino acid column distributions of the transformation we have devised using that matrix is the following. The empirical column probabilities of amino acids are merged, if it is very likely to co-observe them in a binding site column. Since the amino acid content of binding site columns and non-binding site columns differ, the distance between f 𝕁 𝕊 𝔻 t , M k and f 𝕁 𝕊 𝔻 t , M k is larger and more significant than the distance between f 𝕁 𝕊 𝔻 , M k and f 𝕁 𝕊 𝔻 , M k , where k is a binding site column of MSA M, and k is a non-binding site column.
At first glance it is surprising that adding both feature f 𝕁 𝕊 𝔻 t and feature f 𝕁 𝕊 𝔻 to the feature triplet f PSSM , f OBV , f SS is worse than adding feature f 𝕁 𝕊 𝔻 t alone. Taking into account what we have mentioned in the preceding paragraph, it turns out that if feature f 𝕁 𝕊 𝔻 t is already there, feature f 𝕁 𝕊 𝔻 may increase the noise.

5. Conclusions

In this work, we report a new sequence-based feature extraction method for the identification of DNA binding sites in proteins. For this purpose, we adopt the ideas from Capra et al. [34] and our previous studies CMF [36] and QCMF [32]. Our approach is an information theoretic method that applies the Jensen–Shannon divergence (𝕁𝕊𝔻) for amino acid distributions of each site in a protein in two different ways. First, the 𝕁𝕊𝔻 is applied to quantify the differences between observed amino acid distributions of sites and the background distribution of non-binding sites. Second, we transform the observed distributions of sites through a doubly stochastic matrix to incorporate biochemical signals of binding residues in the calculation of 𝕁𝕊𝔻 that results in the intensification of the DNA-binding residue signals from the non-binding signals. The results of our study show that the additional usage of our new features ( f 𝕁 𝕊 𝔻 t or feature f 𝕁 𝕊 𝔻 ) in combination with existing features is significantly boosts the performance of RF classifier in identifying DNA binding sites in proteins. Our results further indicate the importance of our second feature ( f 𝕁 𝕊 𝔻 t ) since taking into account the binding site signals in the calculation of 𝕁𝕊𝔻 metric, the characteristics of DNA binding residues are enhanced. As a consequence, an intensification of the signal caused by DNA binding sites from non-binding sites occurs and thus the classifier achieves its improved performance.
multiple

Acknowledgments

We thank our colleagues Edgar Wingender, Martin Haubrock and Sebastian Zeidler for their helpful advice and insights at early stages of this project. We acknowledge support by the German Research Foundation and the Open Access Publication Funds of the Göttingen University.

Author Contributions

Mehmet Gültas developed the model. Stephan Waack adjusted the model together with Mehmet Gültas. Truong Khanh Linh Dang developed the model together with Mehmet Gültas, designed and implemented the tool and interpreted the results together with Cornelia Meckbach, Rebecca Tacke and Mehmet Gültas. Cornelia Meckbach and Rebecca Tacke studied the DNA binding sites in MYC-MAX protein complex. Mehmet Gültas conceived of and managed the project and wrote the final version of the manuscript. All authors have read and approved the final manuscript.

Conflicts of Interest

The authors declare no conflict of interest.

Appendix A

The detailed performance of the RF classifier on different features using different cut-offs for RBscore and PreDNA datasets.

Appendix A.1. Performance Measures with Standard Error

Table A1. Prediction performance of Random Forest (RF) classifier on different features using a cut-off of 3.5 Å. The prediction system was evaluated by five-fold cross validation.
FeatureSensitivity ± SE(%)Specificity ± SE(%)MCC ± SE(%)
f PSSM 29.2 ± 2.2096.3 ± 0.4630.7 ± 0.95
f PSSM + f 𝕁 𝕊 𝔻 38.5 ± 3.0494.9 ± 0.5734.9 ± 1.7
f PSSM + f 𝕁 𝕊 𝔻 t 41.0 ± 3.2393.9 ± 0.5735.0 ± 1.85
f PSSM + f 𝕁 𝕊 𝔻 + f 𝕁 𝕊 𝔻 t 41.4 ± 3.4294.0 ± 0.5134.8 ± 2.07
f PSSM + f SS 33.9 ± 2.3295.8 ± 0.3733.4 ± 1.36
f PSSM + f SS + f 𝕁 𝕊 𝔻 41.6 ± 3.0595.0 ± 0.4637.8 ± 2.19
f PSSM + f SS + f 𝕁 𝕊 𝔻 t 44.1 ± 3.1294.0 ± 0.4337.2 ± 2.37
f PSSM + f SS + f 𝕁 𝕊 𝔻 + f 𝕁 𝕊 𝔻 t 43.9 ± 3.1494.0 ± 0.4037.0 ± 2.25
f PSSM + f OBV + f SS 36.7 ± 2.0796.8 ± 0.2739.8 ± 1.58
f PSSM + f OBV + f SS + f 𝕁 𝕊 𝔻 42.2 ± 2.7095.8 ± 0.4240.9 ± 1.95
f PSSM + f OBV + f SS + f 𝕁 𝕊 𝔻 t 44.7 ± 3.0595.0 ± 0.3840.3 ± 1.98
f PSSM + f OBV + f SS + f 𝕁 𝕊 𝔻 + f 𝕁 𝕊 𝔻 t 44.4 ± 3.1294.7 ± 0.3939.3 ± 2.02
Table A2. Prediction performance of Random Forest (RF) classifier on different features using a cut-off of 5.0 Å. The prediction system was evaluated by five-folds cross validation.
FeatureSensitivity ± SE(%)Specificity ± SE(%)MCC ± SE(%)
f PSSM 28.6 ± 2.5696.6 ± 0.4735.0 ± 1.43 5
f PSSM + f 𝕁 𝕊 𝔻 39.5 ± 2.8995.0 ± 0.5540.7 ± 1.99
f PSSM + f 𝕁 𝕊 𝔻 t 41.8 ± 3.0294.3 ± 0.6241.1 ± 2.05
f PSSM + f 𝕁 𝕊 𝔻 + f 𝕁 𝕊 𝔻 t 42.6 ± 3.2594.2 ± 0.5441.4 ± 2.37
f PSSM + f SS 33.4 ± 2.3496.3 ± 0.3838.6 ± 1.90
f PSSM + f SS + f 𝕁 𝕊 𝔻 42.4 ± 2.9795.1 ± 0.6143.6 ± 2.43
f PSSM + f SS + f 𝕁 𝕊 𝔻 t 44.8 ± 2.9994.4 ± 0.5643.8 ± 2.45
f PSSM + f SS + f 𝕁 𝕊 𝔻 + f 𝕁 𝕊 𝔻 t 44.5 ± 3.0494.4 ± 0.5043.4 ± 2.35
f PSSM + f OBV + f SS 33.7 ± 2.4897.5 ± 0.3543.1 ± 2.05
f PSSM + f OBV + f SS + f 𝕁 𝕊 𝔻 41.9 ± 2.8995.8 ± 0.5545.0 ± 2.39
f PSSM + f OBV + f SS + f 𝕁 𝕊 𝔻 t 43.9 ± 2.8995.2 ± 0.4845.3 ± 2.32
f PSSM + f OBV + f SS + f 𝕁 𝕊 𝔻 + f 𝕁 𝕊 𝔻 t 44.2 ± 2.9194.9 ± 0.5444.5 ± 2.24

Appendix A.2. RBscore Dataset Analysis

Table A3. The detailed prediction performance of Random Forest (RF) classifier on different features using a cut-off of 3.5 Å.
FeatureSensitivitySpecificityMCCAUC-ROCAUC-PR
f PSSM 0.4580.9740.4760.8660.460
f PSSM + f 𝕁 𝕊 𝔻 0.560.9650.5140.8940.518
f PSSM + f 𝕁 𝕊 𝔻 t 0.5970.9570.5110.8990.523
f PSSM + f 𝕁 𝕊 𝔻 + f 𝕁 𝕊 𝔻 t 0.5910.9580.5110.900.526
f PSSM + f SS 0.5120.970.5010.8780.476
f PSSM + f SS + f 𝕁 𝕊 𝔻 0.5810.960.5110.8990.520
f PSSM + f SS + f 𝕁 𝕊 𝔻 t 0.6110.9530.5080.9030.526
f PSSM + f SS + f 𝕁 𝕊 𝔻 + f 𝕁 𝕊 𝔻 t 0.6130.9530.5090.9020.528
f PSSM + f OBV + f SS 0.5170.9760.5340.8960.528
f PSSM + f OBV + f SS + f 𝕁 𝕊 𝔻 0.580.9670.540.9070.543
f PSSM + f OBV + f SS + f 𝕁 𝕊 𝔻 t 0.6120.9630.5460.9100.551
f PSSM + f OBV + f SS + f 𝕁 𝕊 𝔻 + f 𝕁 𝕊 𝔻 t 0.6010.9620.5310.9090.546
MCC: Matthews correlation coefficient; AUC-ROC: area under the receiver operating characteristics (ROC) curve; AUC-PR: area under the precision-recall curve.
Table A4. The detailed prediction performance of Random Forest (RF) classifier on different features using a cut-off of 5.0 Å.
FeatureSensitivitySpecificityMCCAUC-ROCAUC-PR
f PSSM 0.4450.9770.5280.8730.589
f PSSM + f 𝕁 𝕊 𝔻 0.5530.9680.5790.8990.643
f PSSM + f 𝕁 𝕊 𝔻 t 0.570.9620.5720.9000.642
f PSSM + f 𝕁 𝕊 𝔻 + f 𝕁 𝕊 𝔻 t 0.5690.9630.5740.8950.642
f PSSM + f SS 0.490.9730.5470.8800.602
f PSSM + f SS + f 𝕁 𝕊 𝔻 0.5780.9630.5830.9020.648
f PSSM + f SS + f 𝕁 𝕊 𝔻 t 0.6050.9580.5870.9040.652
f PSSM + f SS + f 𝕁 𝕊 𝔻 + f 𝕁 𝕊 𝔻 t 0.6030.9590.5870.9020.653
f PSSM + f OBV + f SS 0.4990.980.5840.8950.641
f PSSM + f OBV + f SS + f 𝕁 𝕊 𝔻 0.570.9680.5950.9080.661
f PSSM + f OBV + f SS + f 𝕁 𝕊 𝔻 t 0.5920.9650.600.9080.665
f PSSM + f OBV + f SS + f 𝕁 𝕊 𝔻 + f 𝕁 𝕊 𝔻 t 0.5940.9640.5970.9070.663
MCC: Matthews correlation coefficient; AUC-ROC: area under the receiver operating characteristics (ROC) curve; AUC-PR: area under the precision-recall curve.

Appendix A.3. PreDNA Dataset Analysis

Table A5. The detailed prediction performance of Random Forest (RF) classifier on different features using a cut-off of 3.5 Å.
FeatureSensitivitySpecificityMCCAUC-ROCAUC-PR
f PSSM 0.3780.9770.410.8400.391
f PSSM + f 𝕁 𝕊 𝔻 0.4980.9630.4480.8650.453
f PSSM + f 𝕁 𝕊 𝔻 t 0.5430.9530.4450.8690.451
f PSSM + f 𝕁 𝕊 𝔻 + f 𝕁 𝕊 𝔻 t 0.5380.9560.4530.8690.455
f PSSM + f SS 0.3930.9750.4170.8470.402
f PSSM + f SS + f 𝕁 𝕊 𝔻 0.5010.9660.4610.8720.463
f PSSM + f SS + f 𝕁 𝕊 𝔻 t 0.5450.9590.4650.8760.468
f PSSM + f SS + f 𝕁 𝕊 𝔻 + f 𝕁 𝕊 𝔻 t 0.5230.9580.4490.8750.465
f PSSM + f OBV + f SS 0.4280.9770.4580.8670.451
f PSSM + f OBV + f SS + f 𝕁 𝕊 𝔻 0.5110.970.4880.8850.488
f PSSM + f OBV + f SS + f 𝕁 𝕊 𝔻 t 0.5390.9620.4750.8880.488
f PSSM + f OBV + f SS + f 𝕁 𝕊 𝔻 + f 𝕁 𝕊 𝔻 t 0.5390.9610.470.8860.488
MCC: Matthews correlation coefficient; AUC-ROC: area under the receiver operating characteristics (ROC) curve; AUC-PR: area under the precision-recall curve.
Table A6. The detailed prediction performance of Random Forest (RF) classifier on different features using a cut-off of 5.0 Å.
FeatureSensitivitySpecificityMCCAUC-ROCAUC-PR
f PSSM 0.3730.9790.4630.8330.496
f PSSM + f 𝕁 𝕊 𝔻 0.4850.9620.4950.8580.540
f PSSM + f 𝕁 𝕊 𝔻 t 0.4960.9530.4750.8580.534
f PSSM + f 𝕁 𝕊 𝔻 + f 𝕁 𝕊 𝔻 t 0.4950.9550.4790.8570.535
f PSSM + f SS 0.3890.9770.470.8390.501
f PSSM + f SS + f 𝕁 𝕊 𝔻 0.490.9630.5010.8630.550
f PSSM + f SS + f 𝕁 𝕊 𝔻 t 0.5030.9570.4920.8650.547
f PSSM + f SS + f 𝕁 𝕊 𝔻 + f 𝕁 𝕊 𝔻 t 0.5040.9580.4970.8650.550
f PSSM + f OBV + f SS 0.3950.980.4880.8580.530
f PSSM + f OBV + f SS + f 𝕁 𝕊 𝔻 0.480.9680.5110.8740.563
f PSSM + f OBV + f SS + f 𝕁 𝕊 𝔻 t 0.5060.9620.510.8730.560
f PSSM + f OBV + f SS + f 𝕁 𝕊 𝔻 + f 𝕁 𝕊 𝔻 t 0.4990.960.4980.8710.555
MCC: Matthews correlation coefficient; AUC-ROC: area under the receiver operating characteristics (ROC) curve; AUC-PR: area under the precision-recall curve.

References

  1. Liu, B.; Wang, S.; Wang, X. DNA binding protein identification by combining pseudo amino acid composition and profile-based protein representation. Sci. Rep. 2015, 5, 15479. [Google Scholar] [CrossRef] [PubMed]
  2. Miao, Z.; Westhof, E. Prediction of nucleic acid binding probability in proteins: A neighboring residue network based score. Nucleic Acids Res. 2015, 43, 5340–5351. [Google Scholar] [CrossRef] [PubMed]
  3. Si, J.; Zhang, Z.; Lin, B.; Schroeder, M.; Huang, B. MetaDBSite: A meta approach to improve protein DNA-binding sites prediction. BMC Syst. Biol. 2011, 5 (Suppl. S1), S7. [Google Scholar] [CrossRef] [PubMed]
  4. Ma, X.; Guo, J.; Liu, H.D.; Xie, J.M.; Sun, X. Sequence-based prediction of DNA-binding residues in proteins with conservation and correlation information. IEEE/ACM Trans. Comput. Biol. Bioinform. 2012, 9, 1766–1775. [Google Scholar] [CrossRef] [PubMed]
  5. Wu, J.; Liu, H.; Duan, X.; Ding, Y.; Wu, H.; Bai, Y.; Sun, X. Prediction of DNA-binding residues in proteins from amino acid sequences using a random forest model with a hybrid feature. Bioinformatics 2009, 25, 30–35. [Google Scholar] [CrossRef] [PubMed]
  6. Liu, B.; Xu, J.; Fan, S.; Xu, R.; Zhou, J.; Wang, X. PseDNA-Pro: DNA-Binding Protein Identification by Combining Chou’s PseAAC and Physicochemical Distance Transformation. Mol. Inform. 2015, 34, 8–17. [Google Scholar] [CrossRef] [PubMed]
  7. Xu, R.; Zhou, J.; Wang, H.; He, Y.; Wang, X.; Liu, B. Identifying DNA-binding proteins by combining support vector machine and PSSM distance transformation. BMC Syst. Biol. 2015, 9 (Suppl. S1), S10. [Google Scholar] [CrossRef] [PubMed]
  8. Dong, Q.; Wang, S.; Wang, K.; Liu, X.; Liu, B. Identification of DNA-binding proteins by auto-cross covariance transformation. In Proceedings of the 2015 IEEE International Conference on Bioinformatics and Biomedicine (BIBM), Washington, DC, USA, 9–12 November 2015; pp. 470–475.
  9. Wei, L.; Tang, J.; Zou, Q. Local-DPP: An improved DNA-binding protein prediction method by exploring local evolutionary information. Inf. Sci. 2016, in press. [Google Scholar] [CrossRef]
  10. Waris, M.; Ahmad, K.; Kabir, M.; Hayat, M. Identification of DNA binding proteins using evolutionary profiles position specific scoring matrix. Neurocomputing 2016, 199, 154–162. [Google Scholar] [CrossRef]
  11. Zhou, J.; Xu, R.; He, Y.; Lu, Q.; Wang, H.; Kong, B. PDNAsite: Identification of DNA-binding Site from Protein Sequence by Incorporating Spatial and Sequence Context. Sci. Rep. 2016, 6, 27653. [Google Scholar] [CrossRef] [PubMed]
  12. Jones, S.; Shanahan, H.P.; Berman, H.M.; Thornton, J.M. Using electrostatic potentials to predict DNA-binding sites on DNA-binding proteins. Nucleic Acids Res. 2003, 31, 7189–7198. [Google Scholar] [CrossRef] [PubMed]
  13. Ahmad, S.; Gromiha, M.M.; Sarai, A. Analysis and prediction of DNA-binding proteins and their binding residues based on composition, sequence and structural information. Bioinformatics 2004, 20, 477–486. [Google Scholar] [CrossRef] [PubMed]
  14. Bhardwaj, N.; Langlois, R.E.; Zhao, G.; Lu, H. Structure based prediction of binding residues on DNA-binding proteins. In Proceedings of the IEEE 27th Annual International Conference of the Engineering in Medicine and Biology Society (IEEE-EMBS 2005), Shanghai, China, 1–4 September 2005; pp. 2611–2614.
  15. Ahmad, S.; Sarai, A. PSSM-based prediction of DNA binding sites in proteins. BMC Bioinform. 2005, 6, 33. [Google Scholar] [CrossRef] [PubMed] [Green Version]
  16. Kuznetsov, I.B.; Gou, Z.; Li, R.; Hwang, S. Using evolutionary and structural information to predict DNA-binding sites on DNA-binding proteins. Proteins 2006, 64, 19–27. [Google Scholar] [CrossRef] [PubMed]
  17. Wang, L.; Brown, S.J. Prediction of DNA-binding residues from sequence features. J. Bioinform. Comput. Biol. 2006, 4, 1141–1158. [Google Scholar] [CrossRef] [PubMed]
  18. Wang, L.; Brown, S.J. BindN: A web-based tool for efficient prediction of DNA and RNA binding sites in amino acid sequences. Nucleic Acids Res. 2006, 34, W243–W248. [Google Scholar] [CrossRef] [PubMed]
  19. Ofran, Y.; Mysore, V.; Rost, B. Prediction of DNA-binding residues from sequence. Bioinformatics 2007, 23, i347–i353. [Google Scholar] [CrossRef] [PubMed]
  20. Siggers, T.W.; Honig, B. Structure-based prediction of C2H2 zinc-finger binding specificity: Sensitivity to docking geometry. Nucleic Acids Res. 2007, 35, 1085–1097. [Google Scholar] [CrossRef] [PubMed]
  21. Tjong, H.; Zhou, H.X. DISPLAR: An accurate method for predicting DNA-binding sites on protein surfaces. Nucleic Acids Res. 2007, 35, 1465–1477. [Google Scholar] [CrossRef] [PubMed]
  22. Nimrod, G.; Schushan, M.; Szilágyi, A.; Leslie, C.; Ben-Tal, N. iDBPs: A web server for the identification of DNA binding proteins. Bioinformatics 2010, 26, 692–693. [Google Scholar] [CrossRef] [PubMed]
  23. Wang, L.; Huang, C.; Yang, M.Q.; Yang, J.Y. BindN+ for accurate prediction of DNA and RNA-binding residues from protein sequence features. BMC Syst. Biol. 2010, 4 (Suppl. S1), S3. [Google Scholar] [CrossRef] [PubMed]
  24. Miao, Z.; Westhof, E. A Large-Scale Assessment of Nucleic Acids Binding Site Prediction Programs. PLoS Comput. Biol. 2015, 11, e1004639. [Google Scholar] [CrossRef] [PubMed]
  25. Yan, J.; Friedrich, S.; Kurgan, L. A comprehensive comparative review of sequence-based predictors of DNA-and RNA-binding residues. Brief. Bioinform. 2015, 17, 88–105. [Google Scholar] [CrossRef] [PubMed]
  26. Yan, C.; Terribilini, M.; Wu, F.; Jernigan, R.L.; Dobbs, D.; Honavar, V. Predicting DNA-binding sites of proteins from amino acid sequence. BMC Bioinform. 2006, 7, 262. [Google Scholar] [CrossRef] [PubMed]
  27. Hwang, S.; Gou, Z.; Kuznetsov, I.B. DP-Bind: A web server for sequence-based prediction of DNA-binding residues in DNA-binding proteins. Bioinformatics 2007, 23, 634–636. [Google Scholar] [CrossRef] [PubMed]
  28. Huang, Y.F.; Huang, C.C.; Liu, Y.C.; Oyang, Y.J.; Huang, C.K. DNA-binding residues and binding mode prediction with binding-mechanism concerned models. BMC Genom. 2009, 10 (Suppl. S3), S23. [Google Scholar] [CrossRef] [PubMed]
  29. Wong, K.C.; Li, Y.; Peng, C.; Moses, A.M.; Zhang, Z. Computational learning on specificity-determining residue-nucleotide interactions. Nucleic Acids Res. 2015, 43, 10180–10189. [Google Scholar] [CrossRef] [PubMed]
  30. Wang, L.; Yang, M.Q.; Yang, J.Y. Prediction of DNA-binding residues from protein sequence information using random forests. BMC Genom. 2009, 10 (Suppl. S1), S1. [Google Scholar] [CrossRef] [PubMed]
  31. Eggeling, R.; Roos, T.; Myllymäki, P.; Grosse, I. Inferring intra-motif dependencies of DNA binding sites from ChIP-seq data. BMC Bioinform. 2015, 16. [Google Scholar] [CrossRef] [PubMed]
  32. Gültas, M.; Düzgün, G.; Herzog, S.; Jäger, S.J.; Meckbach, C.; Wingender, E.; Waack, S. Quantum coupled mutation finder: Predicting functionally or structurally important sites in proteins using quantum Jensen–Shannon divergence and CUDA programming. BMC Bioinform. 2014, 15, 96. [Google Scholar] [CrossRef] [PubMed]
  33. Fischer, J.; Mayer, C.E.; Söding, J. Prediction of protein functional residues from sequence by probability density estimation. Bioinformatics 2008, 24, 613–620. [Google Scholar] [CrossRef] [PubMed]
  34. Capra, J.A.; Singh, M. Predicting functionally important residues from sequence conservation. Bioinformatics 2007, 23, 1875–1882. [Google Scholar] [CrossRef] [PubMed]
  35. Grosse, I.; Bernaola-Galván, P.; Carpena, P.; Román-Roldán, R.; Oliver, J.; Stanley, H.E. Analysis of symbolic sequences using the Jensen–Shannon divergence. Phys. Rev. E 2002, 65, 041905. [Google Scholar] [CrossRef] [PubMed]
  36. Gültas, M.; Haubrock, M.; Tüysüz, N.; Waack, S. Coupled mutation finder: A new entropy-based method quantifying phylogenetic noise for the detection of compensatory mutations. BMC Bioinform. 2012, 13, 225. [Google Scholar] [CrossRef] [PubMed]
  37. Li, T.; Li, Q.Z.; Liu, S.; Fan, G.L.; Zuo, Y.C.; Peng, Y. PreDNA: Accurate prediction of DNA-binding sites in proteins by integrating sequence and geometric structure information. Bioinformatics 2013, 29, 678–685. [Google Scholar] [CrossRef] [PubMed]
  38. Krall, A.; Brunn, J.; Kankanala, S.; Peters, M.H. A simple contact mapping algorithm for identifying potential peptide mimetics in protein–protein interaction partners. Proteins 2014, 82, 2253–2262. [Google Scholar] [CrossRef] [PubMed]
  39. Nair, S.K.; Burley, S.K. X-ray structures of Myc-Max and Mad-Max recognizing DNA: Molecular bases of regulation by proto-oncogenic transcription factors. Cell 2003, 112, 193–205. [Google Scholar] [CrossRef]
  40. Berman, H.M.; Westbrook, J.; Feng, Z.; Gilliland, G.; Bhat, T.N.; Weissig, H.; Shindyalov, I.N.; Bourne, P.E. The protein data bank. Nucleic Acids Res. 2000, 28, 235–242. [Google Scholar] [CrossRef] [PubMed]
  41. Remmert, M.; Biegert, A.; Hauser, A.; Söding, J. HHblits: Lightning-fast iterative protein sequence searching by HMM-HMM alignment. Nat. Methods 2012, 9, 173–175. [Google Scholar] [CrossRef] [PubMed]
  42. Cappellini, V.; Sommer, H.J.; Bruzda, W.; Zyczkowski, K. Random bistochastic matrices. J. Phys. A Math. Theor. 2009, 42, 36. [Google Scholar] [CrossRef]
  43. Bartlett, G.J.; Porter, C.T.; Borkakoti, N.; Thornton, J.M. Analysis of catalytic residues in enzyme active sites. J. Mol. Biol. 2002, 324, 105–121. [Google Scholar] [CrossRef]
  44. Panchenko, A.R.; Kondrashov, F.; Bryant, S. Prediction of functional sites by analysis of sequence and structure conservation. Protein Sci. 2004, 13, 884–892. [Google Scholar] [CrossRef] [PubMed]
  45. Janda, J.O.; Busch, M.; Kück, F.; Porfenenko, M.; Merkl, R. CLIPS-1D: Analysis of multiple sequence alignments to deduce for residue-positions a role in catalysis, ligand-binding, or protein structure. BMC Bioinform. 2012, 13, 55. [Google Scholar] [CrossRef] [PubMed] [Green Version]
  46. Breiman, L. Random forests. Mach. Learn. 2001, 45, 5–32. [Google Scholar] [CrossRef]
  47. Hall, M.; Frank, E.; Holmes, G.; Pfahringer, B.; Reutemann, P.; Witten, I.H. The WEKA data mining software: An update. ACM SIGKDD Explor. Newsl. 2009, 11, 10–18. [Google Scholar] [CrossRef]
  48. Breiman, L. Bagging predictors. Mach. Learn. 1996, 24, 123–140. [Google Scholar] [CrossRef]
Figure 1. DNA-binding sites in proto-oncobenic transcription factor MYC-MAX protein complex (PDB-Entry 1NKP). Green spheres denote positions of the DNA-binding sites in both proteins which are detected by RF classifier either using the existing features ( f PSSM , f OBV , and f SS ) alone or combining our new features with these existing features together. Purple spheres show the localization of additional binding sites which were only found by RF classifier using our new features with existing features. Moreover, there are further three binding sites in MYC protein and one binding site in MAX protein, shown with yellow spheres, that could not be identified by the classifier.
Entropy 18 00379 g001
Table 1. Prediction performance of Random Forest (RF) classifier on different features using a cut-off of 3.5 Å. The prediction system was evaluated by five-fold cross validation.
FeatureSensitivitySpecificityMCCAUC-ROCAUC-PR
f PSSM 0.2920.9630.3070.7770.313
f PSSM + f 𝕁 𝕊 𝔻 0.3850.9490.3490.7950.369
f PSSM + f 𝕁 𝕊 𝔻 t 0.410.9390.350.8020.377
f PSSM + f 𝕁 𝕊 𝔻 + f 𝕁 𝕊 𝔻 t 0.4140.940.3480.8000.376
f PSSM + f SS 0.3390.9580.3340.7940.338
f PSSM + f SS + f 𝕁 𝕊 𝔻 0.4160.950.3780.8080.390
f PSSM + f SS + f 𝕁 𝕊 𝔻 t 0.4410.940.3720.8170.401
f PSSM + f SS + f 𝕁 𝕊 𝔻 + f 𝕁 𝕊 𝔻 t 0.4390.940.370.8140.399
f PSSM + f OBV + f SS 0.3670.9680.3980.8380.413
f PSSM + f OBV + f SS + f 𝕁 𝕊 𝔻 0.4220.9580.4090.8370.425
f PSSM + f OBV + f SS + f 𝕁 𝕊 𝔻 t 0.4470.950.4030.8410.431
f PSSM + f OBV + f SS + f 𝕁 𝕊 𝔻 + f 𝕁 𝕊 𝔻 t 0.4440.9470.3930.8350.423
MCC: Matthews correlation coefficient; AUC-ROC: area under the receiver operating characteristics (ROC) curve; AUC-PR: area under the precision-recall curve.
Table 2. Prediction performance of Random Forest (RF) classifier on different features using a cut-off of 5.0 Å. The prediction system was evaluated by five-fold cross validation.
FeatureSensitivitySpecificityMCCAUC-ROCAUC-PR
f PSSM 0.2860.9660.3500.7780.425
f PSSM + f 𝕁 𝕊 𝔻 0.3950.950.4070.8010.487
f PSSM + f 𝕁 𝕊 𝔻 t 0.4180.9430.4110.8070.494
f PSSM + f 𝕁 𝕊 𝔻 + f 𝕁 𝕊 𝔻 t 0.4260.9420.4140.8070.497
f PSSM + f SS 0.3340.9630.3860.7960.455
f PSSM + f SS + f 𝕁 𝕊 𝔻 0.4240.9510.4360.8140.513
f PSSM + f SS + f 𝕁 𝕊 𝔻 t 0.4480.9440.4380.8200.520
f PSSM + f SS + f 𝕁 𝕊 𝔻 + f 𝕁 𝕊 𝔻 t 0.4450.9440.4340.8190.521
f PSSM + f OBV + f SS 0.3370.9750.4310.8300.517
f PSSM + f OBV + f SS + f 𝕁 𝕊 𝔻 0.4190.9580.4500.8320.535
f PSSM + f OBV + f SS + f 𝕁 𝕊 𝔻 t 0.4390.9520.4530.8360.539
f PSSM + f OBV + f SS + f 𝕁 𝕊 𝔻 + f 𝕁 𝕊 𝔻 t 0.4420.9490.4450.8320.535
MCC: Matthews correlation coefficient; AUC-ROC: area under the receiver operating characteristics (ROC) curve; AUC-PR: area under the precision-recall curve.
Table 3. Prediction performance of Random Forest (RF) classifier on RBscore dataset using different distance cut-offs.
Cut-OffFeatureSensitivitySpecificityMCCAUC-ROCAUC-PR
3.5 Å f PSSM + f OBV + f SS 0.5170.9760.5340.8960.528
f PSSM + f OBV + f SS + f 𝕁 𝕊 𝔻 0.580.9670.540.9070.543
f PSSM + f OBV + f SS + f 𝕁 𝕊 𝔻 t 0.6120.9630.5460.9100.551
f PSSM + f OBV + f SS + f 𝕁 𝕊 𝔻 + f 𝕁 𝕊 𝔻 t 0.6010.9620.5310.9090.546
5.0 Å f PSSM + f OBV + f SS 0.4990.980.5840.8950.641
f PSSM + f OBV + f SS + f 𝕁 𝕊 𝔻 0.570.9680.5950.9080.661
f PSSM + f OBV + f SS + f 𝕁 𝕊 𝔻 t 0.5920.9650.600.9080.665
f PSSM + f OBV + f SS + f 𝕁 𝕊 𝔻 + f 𝕁 𝕊 𝔻 t 0.5940.9640.5970.9070.663
MCC: Matthews correlation coefficient; AUC-ROC: area under the receiver operating characteristics (ROC) curve; AUC-PR: area under the precision-recall curve.
Table 4. Prediction performance of RF classifier on PreDNA dataset using different distance cut-offs.
Cut-OffFeatureSensitivitySpecificityMCCAUC-ROCAUC-PR
3.5 Å f PSSM + f OBV + f SS 0.4280.9770.4580.8670.451
f PSSM + f OBV + f SS + f 𝕁 𝕊 𝔻 0.5110.970.4880.8850.488
f PSSM + f OBV + f SS + f 𝕁 𝕊 𝔻 t 0.5390.9620.4750.8880.488
f PSSM + f OBV + f SS + f 𝕁 𝕊 𝔻 + f 𝕁 𝕊 𝔻 t 0.5390.9610.470.8860.488
5.0 Å f PSSM + f OBV + f SS 0.3950.980.4880.8580.530
f PSSM + f OBV + f SS + f 𝕁 𝕊 𝔻 0.480.9680.5110.8740.563
f PSSM + f OBV + f SS + f 𝕁 𝕊 𝔻 t 0.5060.9620.510.8730.560
f PSSM + f OBV + f SS + f 𝕁 𝕊 𝔻 + f 𝕁 𝕊 𝔻 t 0.4990.960.4980.8710.555
MCC: Matthews correlation coefficient; AUC-ROC: area under the receiver operating characteristics (ROC) curve; AUC-PR: area under the precision-recall curve.
Table 5. Prediction performance of RF classifier on different features using a cut-off of 3.5 Å for MYC-MAX protein complex (Protein Data Bank (PDB)-Entry 1NKP).
ProteinFeatureSensitivitySpecificityMCC
MYC f PSSM + f OBV + f SS 0.300.9410.282
f PSSM + f OBV + f SS + f 𝕁 𝕊 𝔻 0.700.8530.448
f PSSM + f OBV + f SS + f 𝕁 𝕊 𝔻 t 0.700.8530.448
f PSSM + f OBV + f SS + f 𝕁 𝕊 𝔻 + f 𝕁 𝕊 𝔻 t 0.700.8680.470
MAX f PSSM + f OBV + f SS 0.2221.00.447
f PSSM + f OBV + f SS + f 𝕁 𝕊 𝔻 0.8880.9060.664
f PSSM + f OBV + f SS + f 𝕁 𝕊 𝔻 t 0.8880.9220.697
f PSSM + f OBV + f SS + f 𝕁 𝕊 𝔻 + f 𝕁 𝕊 𝔻 t 0.8890.9220.697
MCC: Matthews correlation coefficient.

