Article

Fuzzy Shannon Entropy: A Hybrid GIS-Based Landslide Susceptibility Mapping Method

by
Majid Shadman Roodposhti
1,
Jagannath Aryal
1,*,
Himan Shahabi
2 and
Taher Safarrad
3
1
Discipline of Geography and Spatial Sciences, School of Land & Food, University of Tasmania, Hobart 7001, Australia
2
Department of Geomorphology, Faculty of Natural Resources, University of Kurdistan, Sanandaj 66177-15175, Iran
3
Department of Geography and Urban Planning, Faculty of Humanities and Social Science, University of Mazandaran, Babolsar 47416-13534, Iran
*
Author to whom correspondence should be addressed.
Entropy 2016, 18(10), 343; https://doi.org/10.3390/e18100343
Submission received: 1 August 2016 / Revised: 14 September 2016 / Accepted: 19 September 2016 / Published: 27 September 2016
(This article belongs to the Special Issue Applications of Information Theory in the Geosciences)

Abstract

:
Assessing Landslide Susceptibility Mapping (LSM) contributes to reducing the risk of living with landslides. Handling the vagueness associated with LSM is a challenging task. Here we show the application of hybrid GIS-based LSM. The hybrid approach embraces fuzzy membership functions (FMFs) in combination with Shannon entropy, a well-known information theory-based method. Nine landslide-related criteria, along with an inventory of landslides containing 108 recent and historic landslide points, are used to prepare a susceptibility map. A random split into training (≈70%) and testing (≈30%) samples are used for training and validation of the LSM model. The study area—Izeh—is located in the Khuzestan province of Iran, a highly susceptible landslide zone. The performance of the hybrid method is evaluated using receiver operating characteristics (ROC) curves in combination with area under the curve (AUC). The performance of the proposed hybrid method with AUC of 0.934 is superior to multi-criteria evaluation approaches using a subjective scheme in this research in comparison with a previous study using the same dataset through extended fuzzy multi-criteria evaluation with AUC value of 0.894, and was built on the basis of decision makers’ evaluation in the same study area.

1. Introduction

A landslide is either geophysical or climate-related disaster that is described as a mass movement of earth surface material. This usually involves shear displacement of soil and/or rock masses along one or several slip surfaces [1]. A landslide susceptibility map (LSM) is a promising solution for both understanding and predicting probable future landslides. It assists planners in decision-making phase aimed for further mitigation of landslide consequences. Accordingly, a LSM depicts areas likely to have landslides in the future by correlating some of the principal factors that contribute to landslides with the past distribution of slope failures [2]. In this respect, production of LSM at the early stage of landslide assessments is of crucial importance for safe economic planning, such as urbanization activities and the engineering of structures. However, a standard procedure for the production of landslide susceptibility maps does not exist [3].Thus, LSM can be accomplished by providing risk managers with easily accessible, continuous, and accurate information about landslide occurrence. The predictive capacity is poorly understood in LSM and is vague. In general, the spatial prediction of landslides is not easy due to the complex nature of landslides [4]. LSM provide important information for predicting landslides hazards which include an indication of the time scale within which particular landslides are likely to occur [5]. The associated vagueness can be dealt using fuzzy sets theory.
Introduced by Zadeh, fuzzy set theory handles indefiniteness arising from intrinsic ambiguity than from a statistical variation [6]. A functional defined on the class of generalised characteristic functions (fuzzy sets), called “entropy”, is introduced using no probabilistic concepts in order to obtain a global measure of the indefiniteness connected with the situations described by fuzzy sets [7]. The meaning of this quantity is quite different from the one of classical entropy because no probabilistic concept is needed in order to define it. This function gives a global measure of the “indefiniteness” of the situation of the problem at hand [8]. Although there is a well-defined mathematical theory of probability, there is no universal agreement about the meaning of probability. Thus, for example, there is the view that probability is an objective property of a system and another view that it describes a subjective state of belief of a person. Then there is the frequentist view that the probability of an event is the relative frequency of its occurrence in a long or infinite sequence of trials. Thus, entropy is often used as a characterization of the information content of a data source, this information content is not absolute: it depends crucially on the probabilistic model [9].
Effective LSMs could provide a proper understanding of “susceptible regions” [10]. In order to better assist planners in understanding landslide hazard, a variety of GIS-based susceptibility mapping techniques are employed and developed [11]. These approaches can be classified into three main groups: subjective, objective and hybrid methods. The subjective methods typically include inventory mapping and decision makers’ (DMs) evaluation in both standardisation and weighting of selected criteria [12]. There are various GIS-based studies on LSM through the use of subjective approaches. Some of them used multi-criteria evaluation (MCE) techniques including: simple additive weighting [13], ordered weighted average [14], analytical hierarchy process [15], analytical network process [16], PROMETHEE [17], etc. and some used different heuristic and knowledge driven techniques in order to assess landslide susceptibility mapping [18,19,20]. Other studies, on the other hand, have shown a variety of objective methods in the assessment of the landslide susceptibility because of some limitations such as insufficient knowledge about the area of interest. The objective methods mostly rely on statistical [21,22,23,24,25,26,27], soft computing [4,28,29], deterministic analysis [30], neuro-fuzzy [4,31], artificial neural network [32,33,34], decision trees [35,36], and index of entropy [37,38,39,40,41], which are more rigorous and mostly relying on objective assessments. On the other hand, there are various hybrid GIS-based LSM methods which are both subjective and objective. In other words, some hybrid GIS-based LSM methods used subjective standardisation and an objective weighing technique [42,43,44], and vice versa.
The accuracy of LSM mostly depends on the amount and quality of available data, the working scale and the selection of the appropriate methodology for analysis and modelling [17]. In methodology implementation and its assessment, landslide casual criteria play a key role. In this study, we decipher the optimality of predictive solutions for objective criteria weighting. In an attempt to find an optimal solution, we show how modified Shannon entropy algorithm in association with fuzzy set theory can be successfully applied to the numerical solution of the LSM while there is no sufficient knowledge about the area of interest. In other words, the main objective of the present study is to extend a hybrid GIS-based LSM method within which fuzzy membership functions (FMFs) have been applied for criteria standardisation using “global knowledge” about landslides, while no “local knowledge” is utilised for criteria weighting. In literature, although different GIS-based models have been used for landslide susceptibility mapping, however, LSM map extracted from modified Shannon entropy algorithm in association with fuzzy set theory has seldom been carried out. Therefore, this study aims to fill this identified gap in the relevant literature.
Since the LSM deals with a various sets of criteria it can be assumed that integration of fuzzy set theory with information theory, and in particular with Shannon entropy, will assist in performing accurate landslide susceptibility mapping. This accurate LSM is due to the flexibility of fuzzy membership functions and objective evaluation of criteria weights. Based on this assumption, the present research is an attempt to propose a novel hybrid method, which contributes to the objective decision making for regional landslide management. In other words, by using only the entropy values of previous landslide events for each criterion and regardless of experts’ opinions, we intend to facilitate criteria weighting process while improving or preserving LSM predictive accuracy compared with accurate subjective methods.
The paper is organized as follows: after a description of the study area in Section 2, a detailed definition of the material and methods of the research is described in Section 3. Section 4 presents results while Section 5 discusses the achieved results and contributions, respectively. At the end, we provide the conclusions of this research in Section 6.

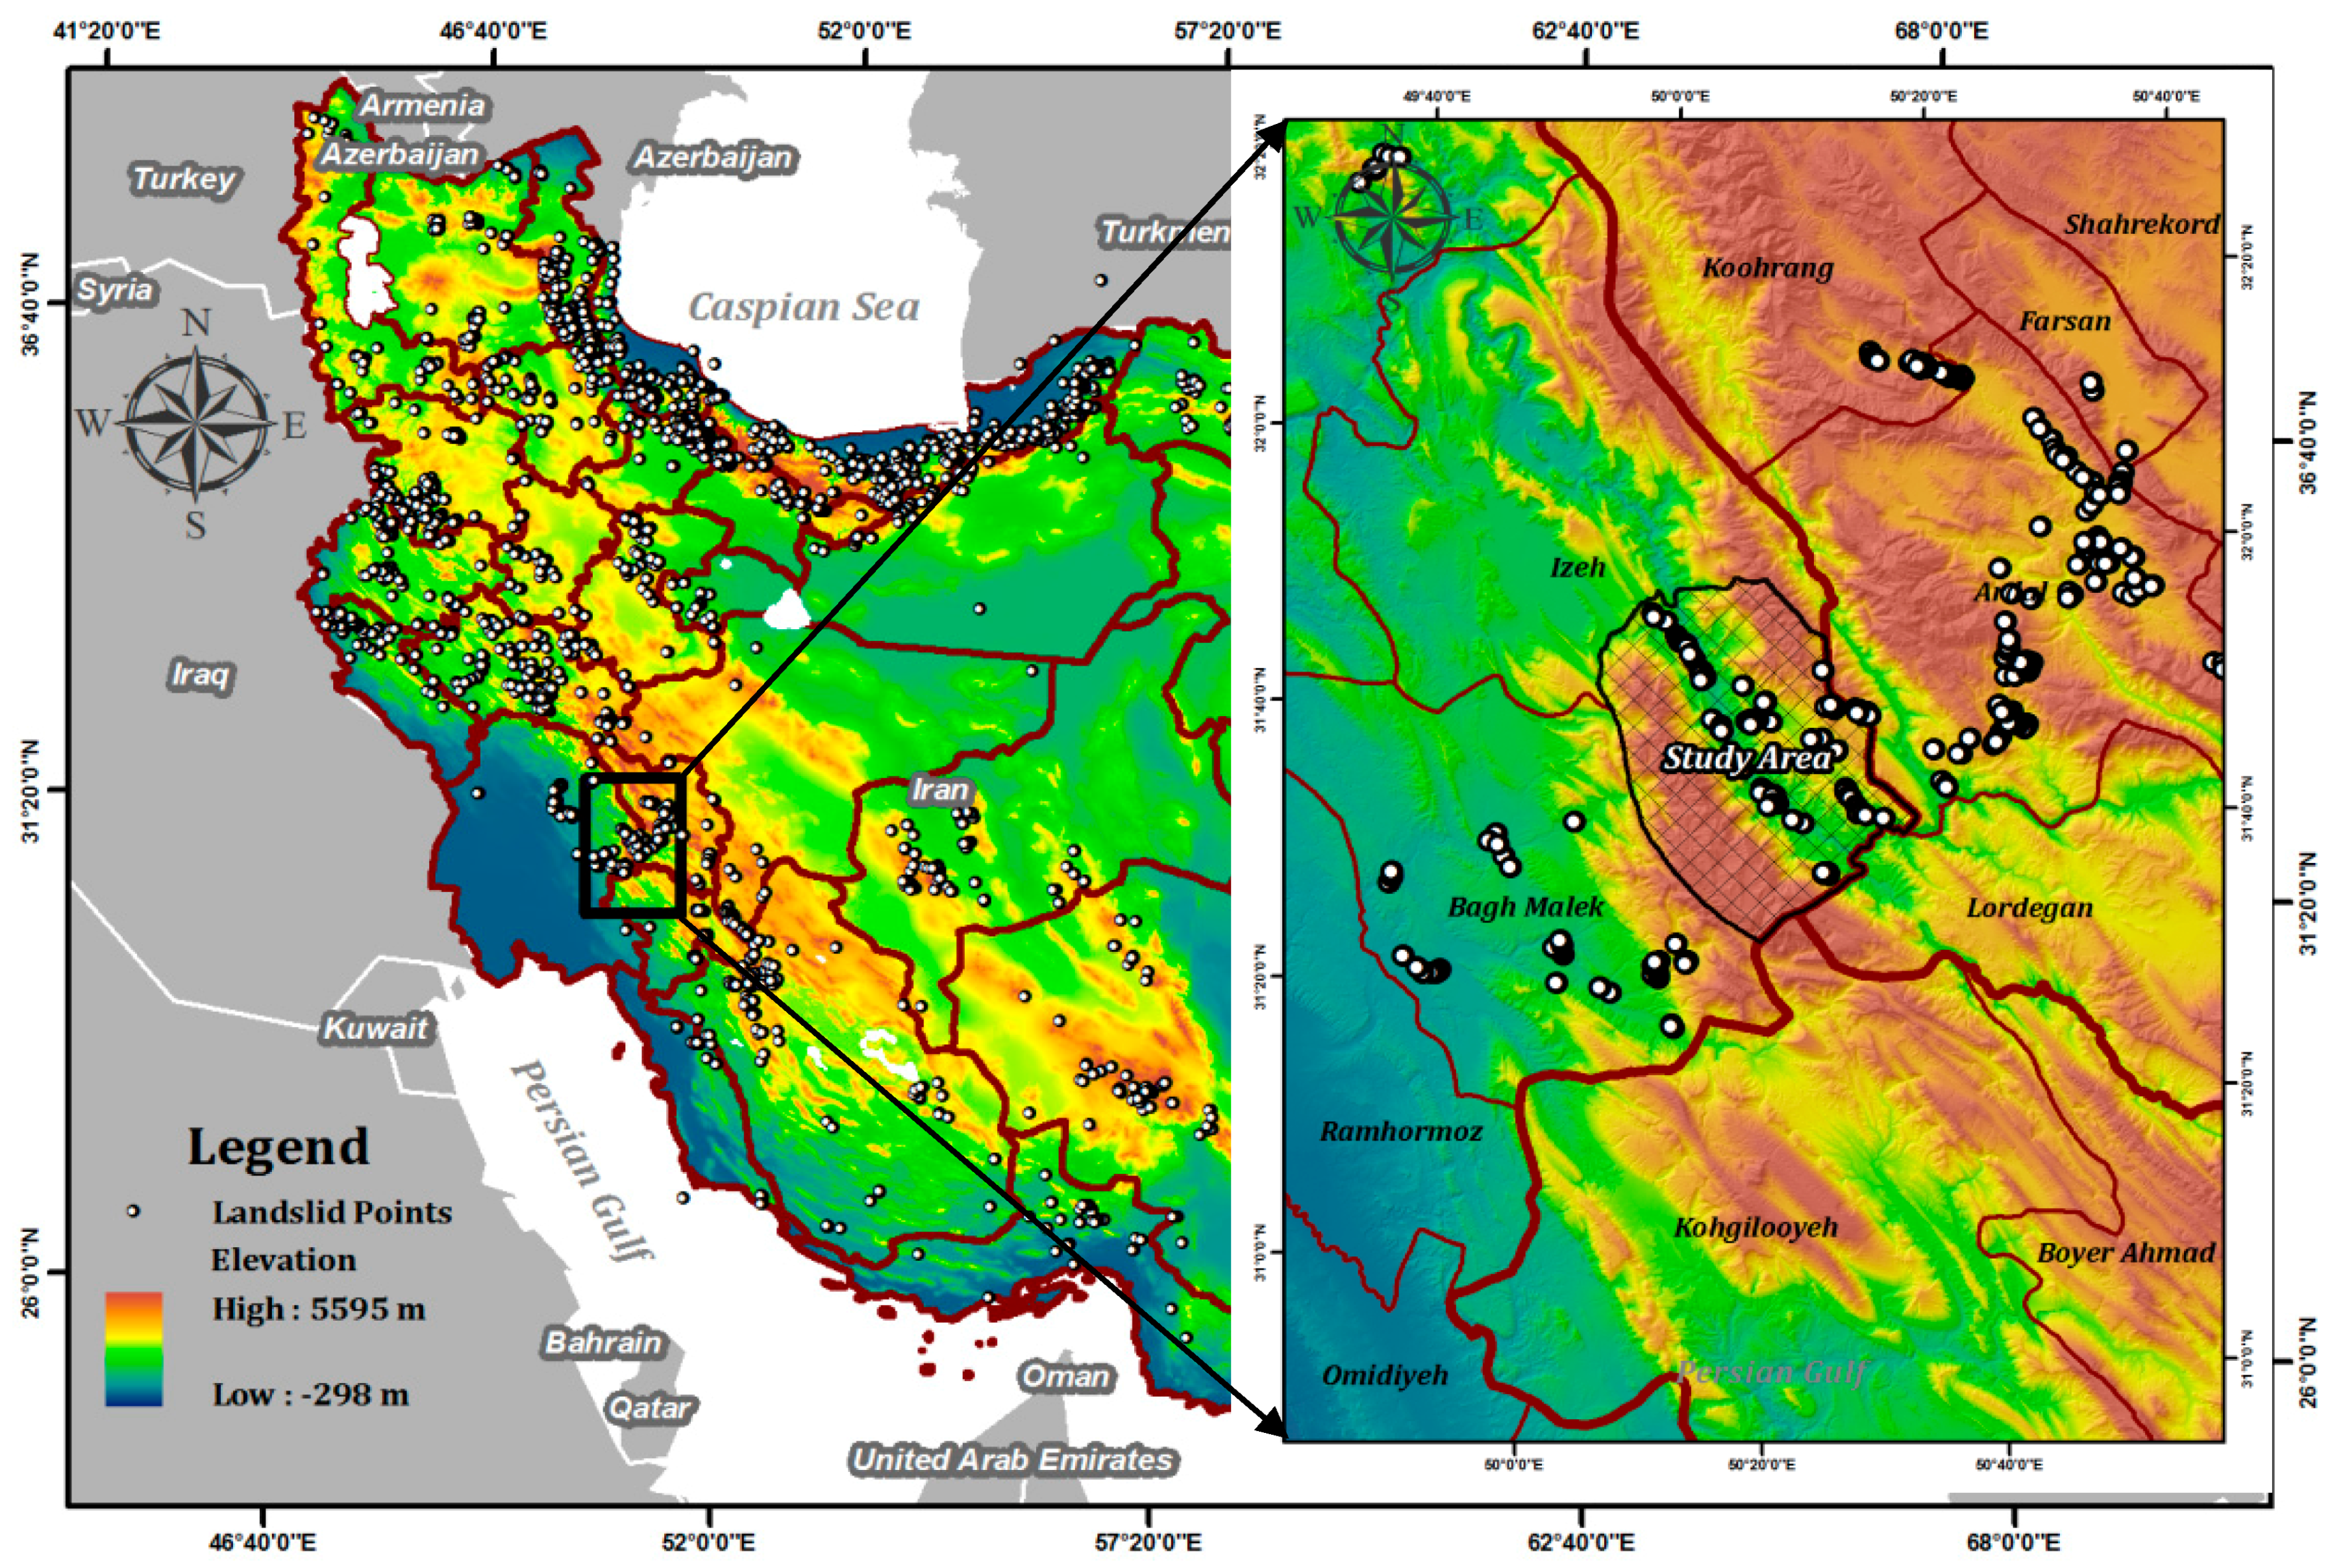
2. Description of the Study Region

Izeh is located in the eastern part of Khuzestan province, in south-western Iran (see Figure 1), where the high susceptibility for a mass movement and in particular landslides is considered as a potential natural hazard for human society and their activities such as the hydropower plants in Izeh. According to the inventory of landslides compiled by the Ministry of Natural Resources [45], there are 108 recorded landslide events in the region.
The climate is a temperate in north, while in south a warm climate prevails. Similarly, mean annual precipitation within the study area varies from 450 to 700 mm. The region is important in terms of the agricultural activities and in particular hydropower plants. The Karun River, the main and longest river in all of Iran, passes through this area. The suitable topography of Karun canyon provides the possibility of constructing hydropower plants and three main dams have been constructed so far on different branches of the Karun River [44].
Geologically, there are several minor faults and one major thrust in the region along with the 13 types of geologic formations cropping out in the region. The Izeh fault zone is a transverse fault zone with right-lateral strike slip (and some reverse component) in the Zagros Mountains, south-western Iran. That is majority controlled by the subsidence and sedimentation of the embayment. In terms of 13 types of geologic formations, nearly all of them composed of sedimentary rocks including, marl, shale, limestone, gypsum, siltstone and other Quaternary deposits. It also should be mentioned that in the case of any triggering cause, there will be a significant chance of landslide occurrence within the south and south-east where the rough topography coincides with major thrust fault, Karun canyon and susceptible lithology. In other words, where there is susceptible lithology, proximity to faults contributes to slope instability, affecting not just surface structures but also terrain permeability. Eventually, the erosion associated with Karun River in nearby areas further leads to slope instability and generally increases the rate of subsequent slope failure. This is considered another prominent reason for the notable landslide recurrence in the region [44].

3. Materials and Methods

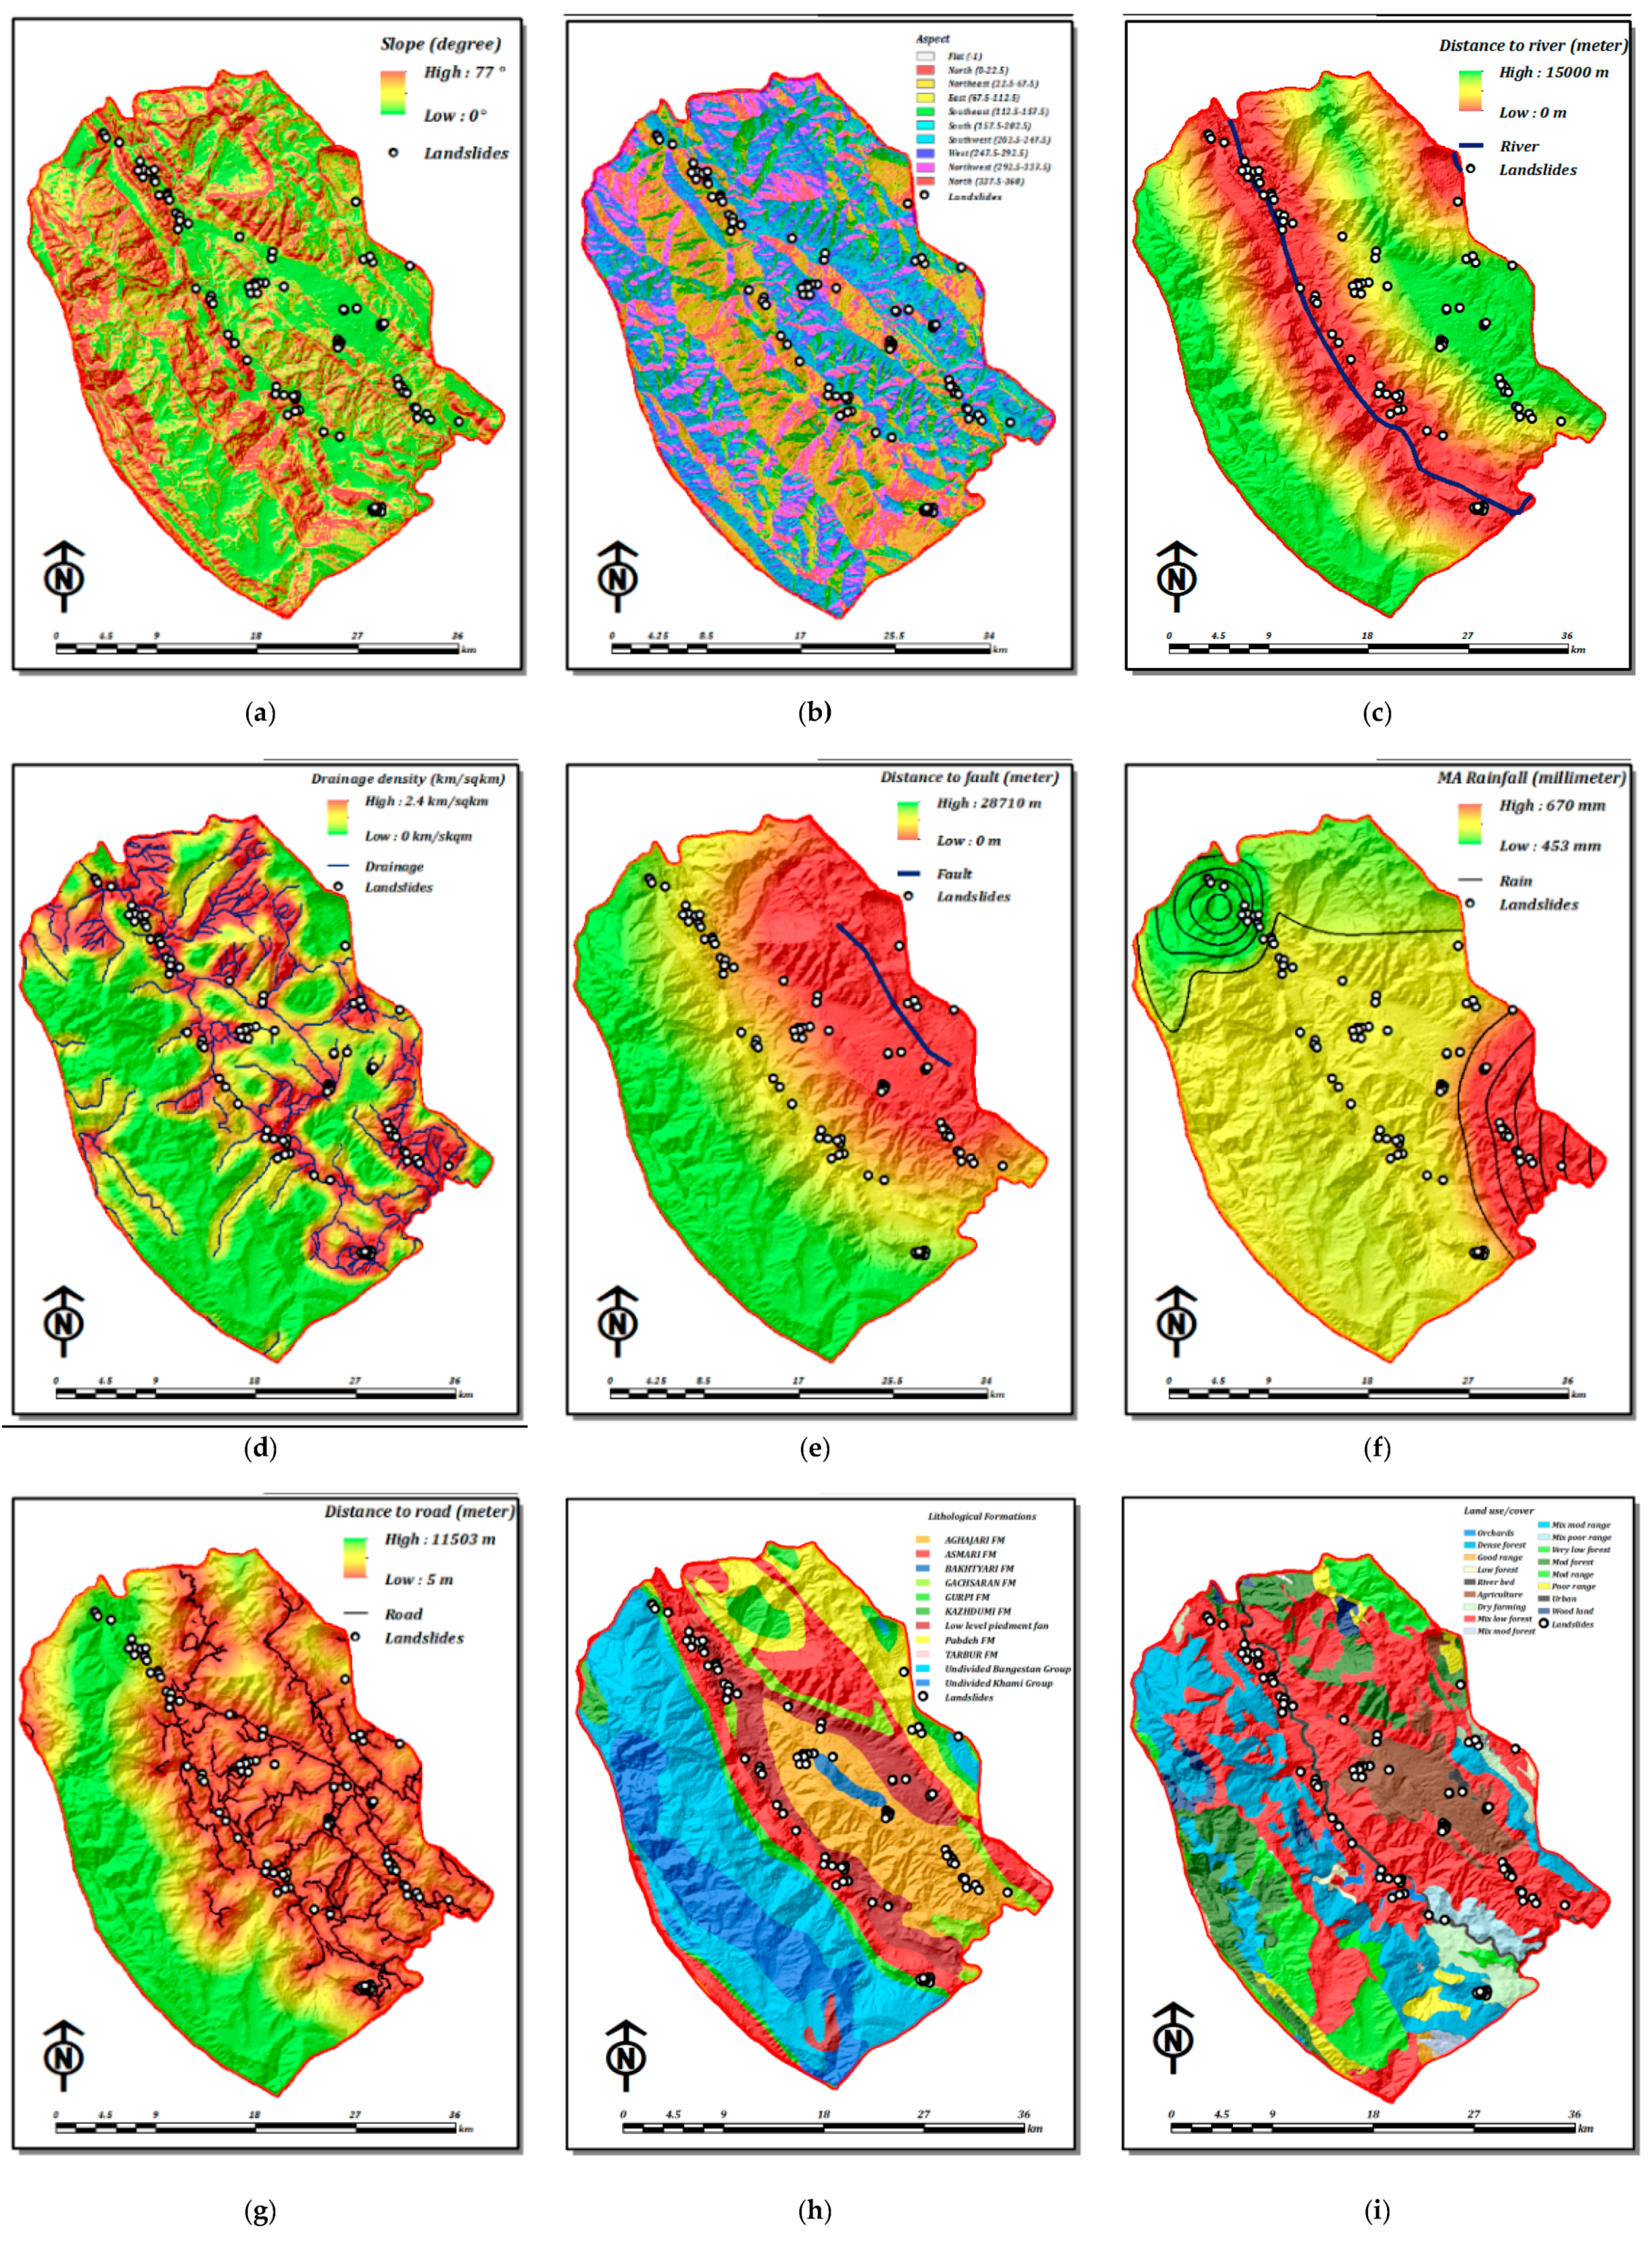
3.1. Landslide Influencing Data Layers

First of all, with respect to the available peer-reviewed GIS-based LSM research, nine criteria of the study area have been employed and prepared (Table 1 and Figure 2).
It must be noted that landslide susceptibility map of the study area has been derived from landslide related criteria mentioned in above Table 1. Road, river and drainage input maps were extracted from the topographical map (1:50,000) of the study area, while the fault and lithology maps were obtained from geologic maps (1:100,000). In addition, the slope and aspect criteria were derived from 30 m shuttle radar topography mission (SRTM) digital elevation model (DEM). Land use/cover maps were derived from Landsat ETM+ satellite images with 30 m spatial resolution employing image analysis methods [66].
The average of 30 years mean annual rainfall data from the Iran Meteorological Organization (IMO) was used to create mean annual rainfall map using kriging interpolation methods in the ArcGIS environment. Finally, we also used an inventory of landslides containing 108 recent and historic landslide points which were recorded by GPS in field survey [45] for both geo-data layer weight evaluation and further validation of proposed LSM. The recorded landslides points are centroids of of each landslide polygon. Almost all of these landslides belong to slide-type landslides which are down-slope movement of material along a distinctive surface of weakness such as a fault, joint or bedding plane. In terms of landslide inventory, it was randomly split into a train (≈70%) and test (≈30%) samples for training the proposed hybrid model and subsequent validation purpose, prior and posterior map elaboration, respectively.

3.2. Proposed Methodology

In order to depict the proposed methodology, it is best to consider a three-step procedure: in step 1, using fuzzy sets theory, data standardisation has been implemented in ArcGIS environment. To this end, a proper FMF is fitted on each selected criterion posterior to preprocessing phase. These FMFs has been selected according to peer literature review of similar LSM studies and local expert opinions. Accordingly, in step 2, the Shannon entropy is used for further evaluation of criteria weights, which determines the subsequent contribution of each landslide related criteria in overall susceptibility. This phase is implemented in MATLAB. Here, Shannon entropy technique is used as an objective-weighting scheme in LSM process. Finally, in the third step, results from above two steps are integrated using ArcGIS software (Figure 3). Further, results were validated using receiver operating characteristics (ROC) curves and simple overlay technique using MATLAB and ArcGIS environments, respectively. Each step is explained as below:

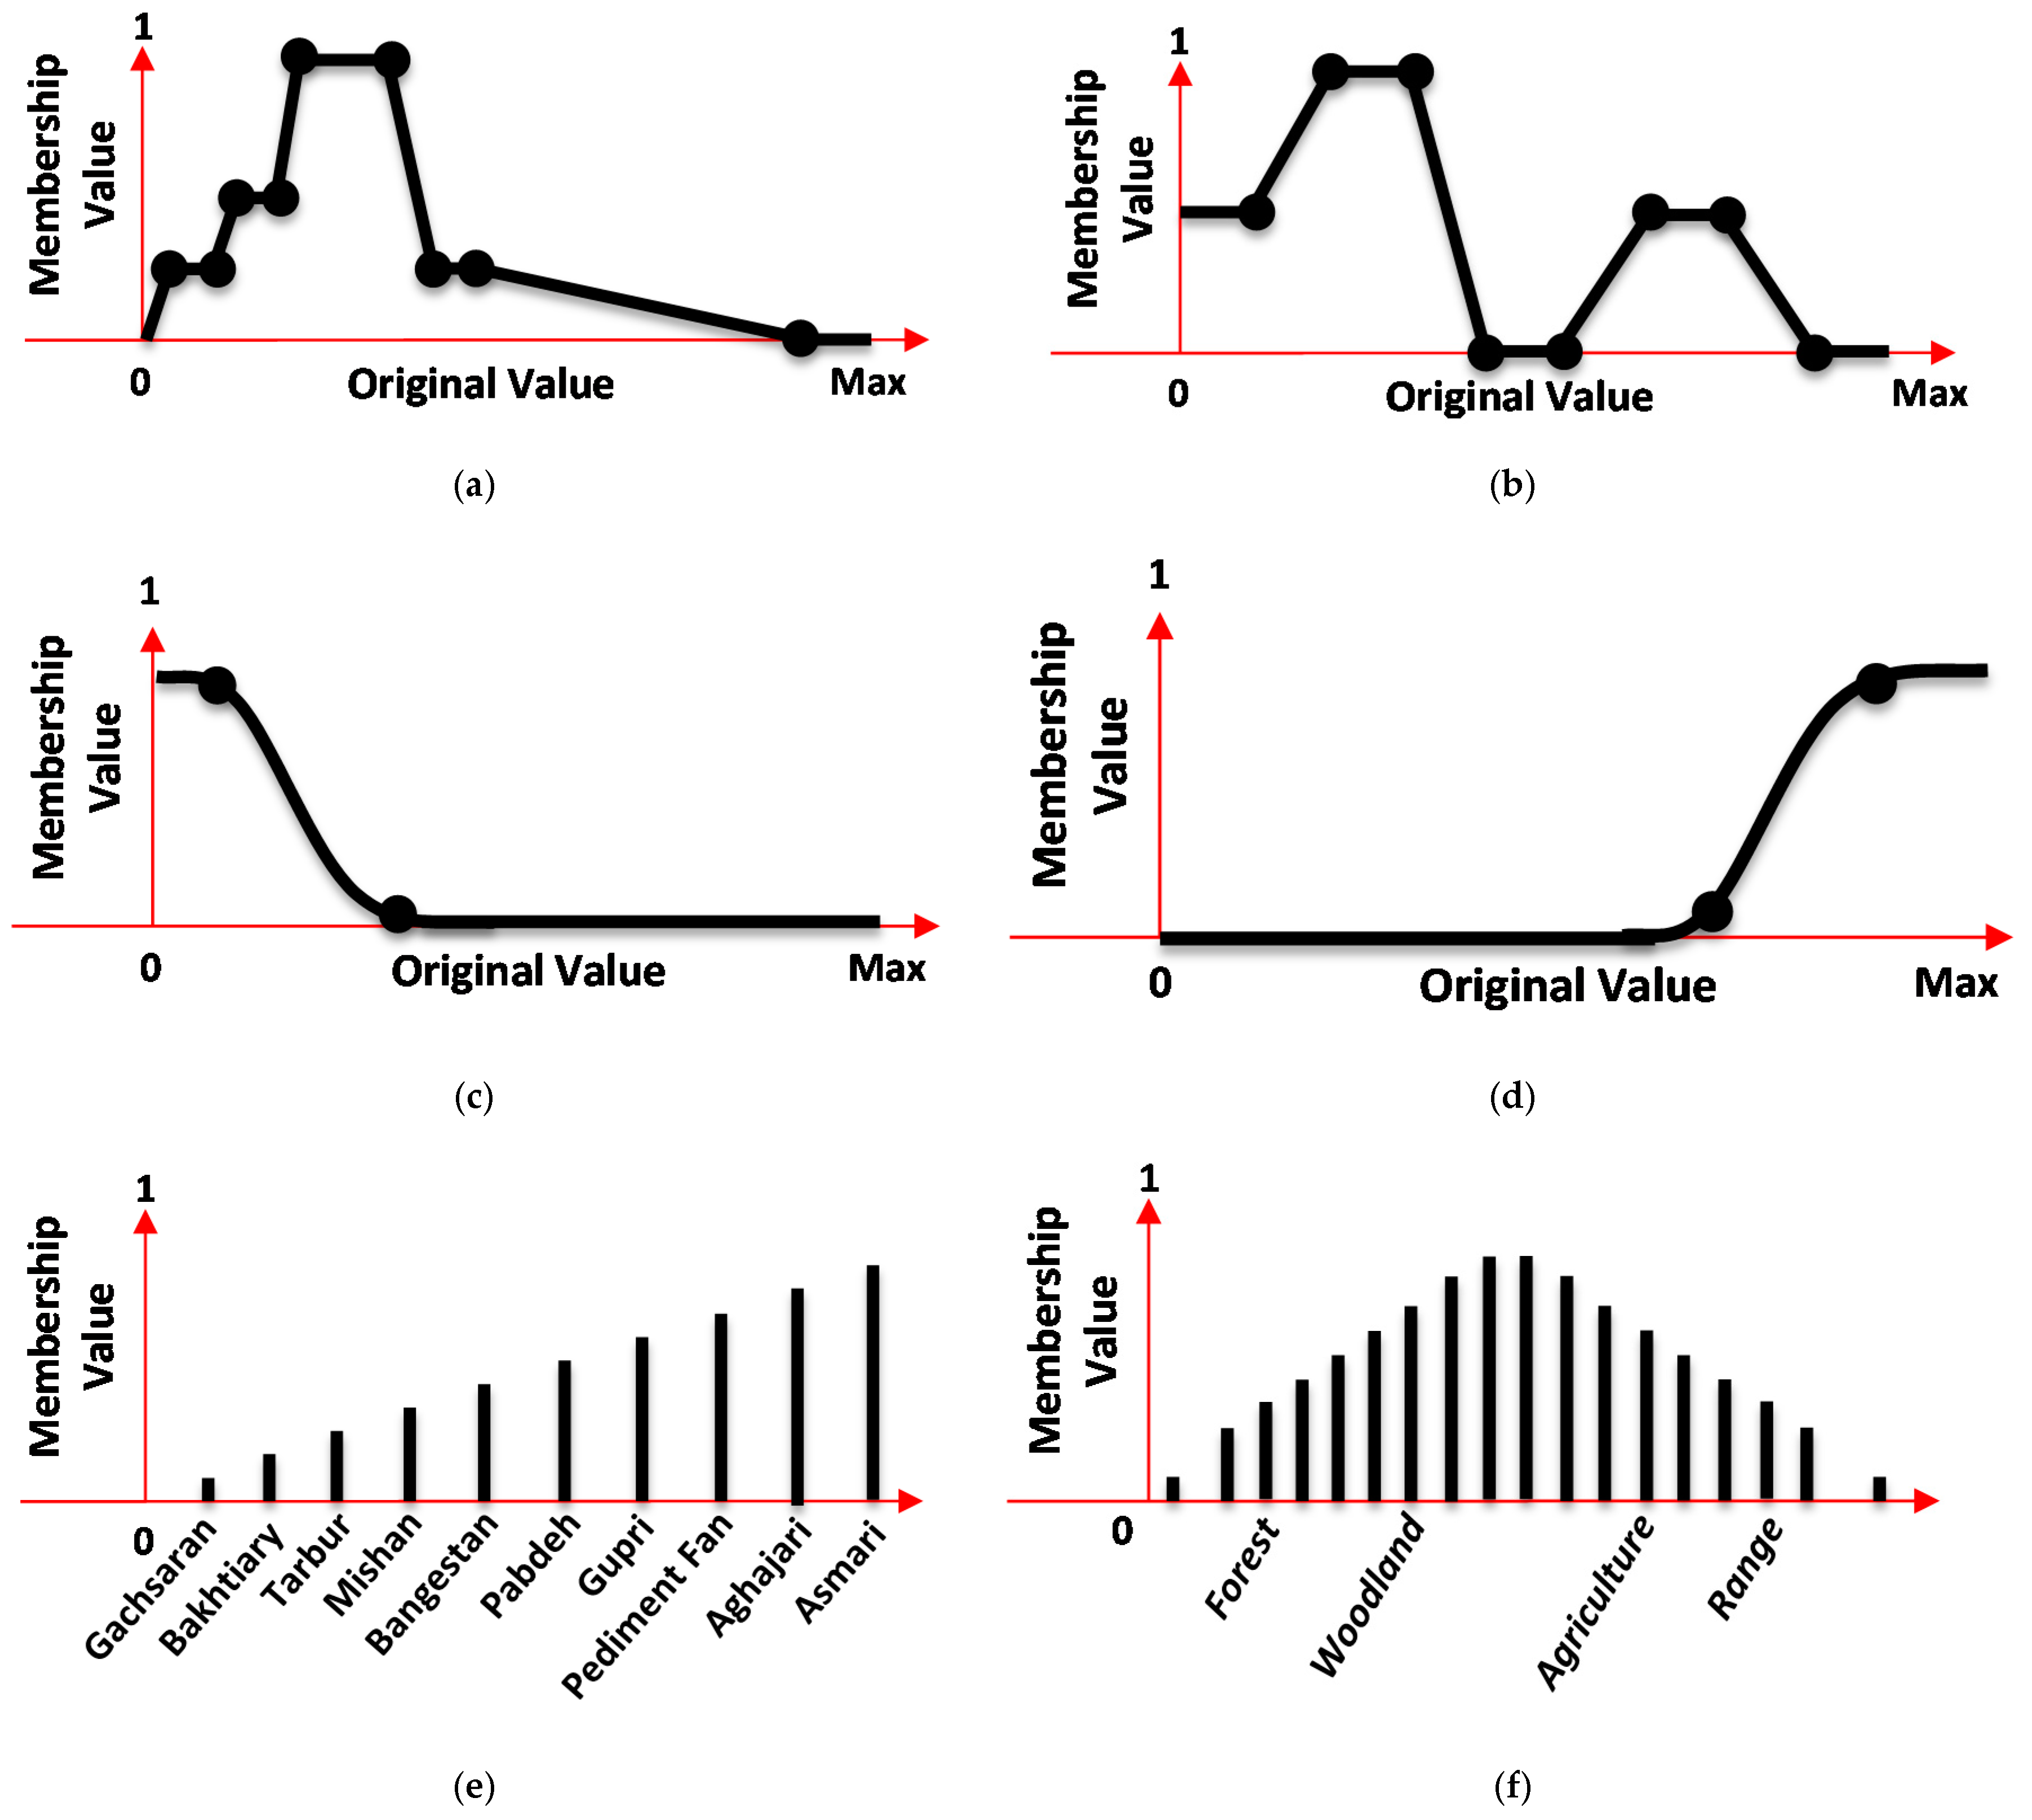
3.2.1. Fuzzy Membership Function (FMF)

A major contribution of fuzzy set theory and related fuzzy membership functions (FMFs) is its capability of representing vague data. The theory also allows mathematical operators and programming to apply to the fuzzy domain. A fuzzy set is a class of objects with a continuum of grades of membership [6]. Such a set is mainly characterised by a membership function, which designates a membership value to every single object ranging from 0 and 1 and vice versa. In terms of LSM, fuzzy sets approve the possibility of partial membership of a considered geographic location to more than one susceptibility class. FMFs accordingly, were used to determine pattern variation forming a gradual class boundaries between each susceptibility class. The shape of each applied FMF determines how the transition between 0 and 1 takes place.

3.2.2. Shannon Entropy

The information theory application, originated from thermodynamics in 1948 [42], is used in diverse disciplines and application areas. In information theory, entropy is the quantitative measure of system disorder, instability, imbalance, and uncertainty and can forecast development trend of specified system [42,54,67,68]. The Shannon entropy usually indicates to quantification of the expected amount of information enclosed by a message. At present, it has been widely used to determine the weighted index in natural hazards, and in integrated assessment of natural-environmental processes such as debris flows, droughts, sandstorms, etc. [69,70].
In the case of landslides, it measures the dissimilarity or diversity in the environment, indicating the potential of each factor in causing landslides. In other words, the entropy of landslides refers to the extent the various factors influence landslide. Greater is the entropy index, greater is the influence of the factor in causing landslide [68]. Finally, it also should be mentioned that various landslide related criteria are not the same regarding their attributes and dimension. Therefore, it is not possible to conduct a direct comparison between those mentioned criteria which are applied in a LSM process. In order to construct proper comparison, it is necessary to conduct standardisation process in the first step (see Equations (1) and (2)).
Positive effect = { 1 x = x max 0.5 ( 1 C O S ( π x x min x m a c x min ) ) x min x x max 0 x = x min }
Negative effect = { 1 x = x min 0.5 ( 1 + C O S ( π x m a c x x m a c x min ) ) x min x x max 0 x = x max }
Equation (1) is applicable for specific criteria with positive effect on probability of landslide occurrence (such as drainage density and mean annual rainfall). It means the more the value of the considered criteria is, the more the probability of landslide is as a simple rule. However, for some other criteria (viz. distance to river, distance to faults and distance to road) Equation (2) is well-suited, where the reverse condition exists. Then, landslide entropy matrix R is formed by m landslide samples and n geo-data layer:
R = { r 1 , 1 r 1 , 2 r 1 , n r 2 , 1 r 2 , 2 r 2 , n r m , 1 r m , 2 r m , n }
Accordingly, Shannon entropy is defined by [42]:
E j = k i = 1 m p i , j   ln   p i , j
where Ej is entropy value, pi,j is value of ith landslide in jth criteria and k is a positive constant, essentially a choice of unit of measure which is given by:
k = ( ln   m ) 1
where m is number of occurred landslide events. Accordingly, normalized decision matrix pi,j for each landslide criteria can be defined by:
p i , j = r i , j i = 1 m r i , j
The weights have attributed the role the factors play in the synthesis assessment, and the bigger value indicates that the factor’s function is more important in this index system.
w j = v j i = 1 m v j
where Wj is weight of jth geo-data layer and Vj is defined by:
v j = 1 E j

3.2.3. Hybrid Landslide Susceptibility Mapping Model

The proposed hybrid model of landslide susceptibility mapping can be defined as:
S = i = 1 n w i x i
where S is a degree of landslide susceptibility, Wi stands for the weight of each criterion and Xi is standardised landslide criteria.

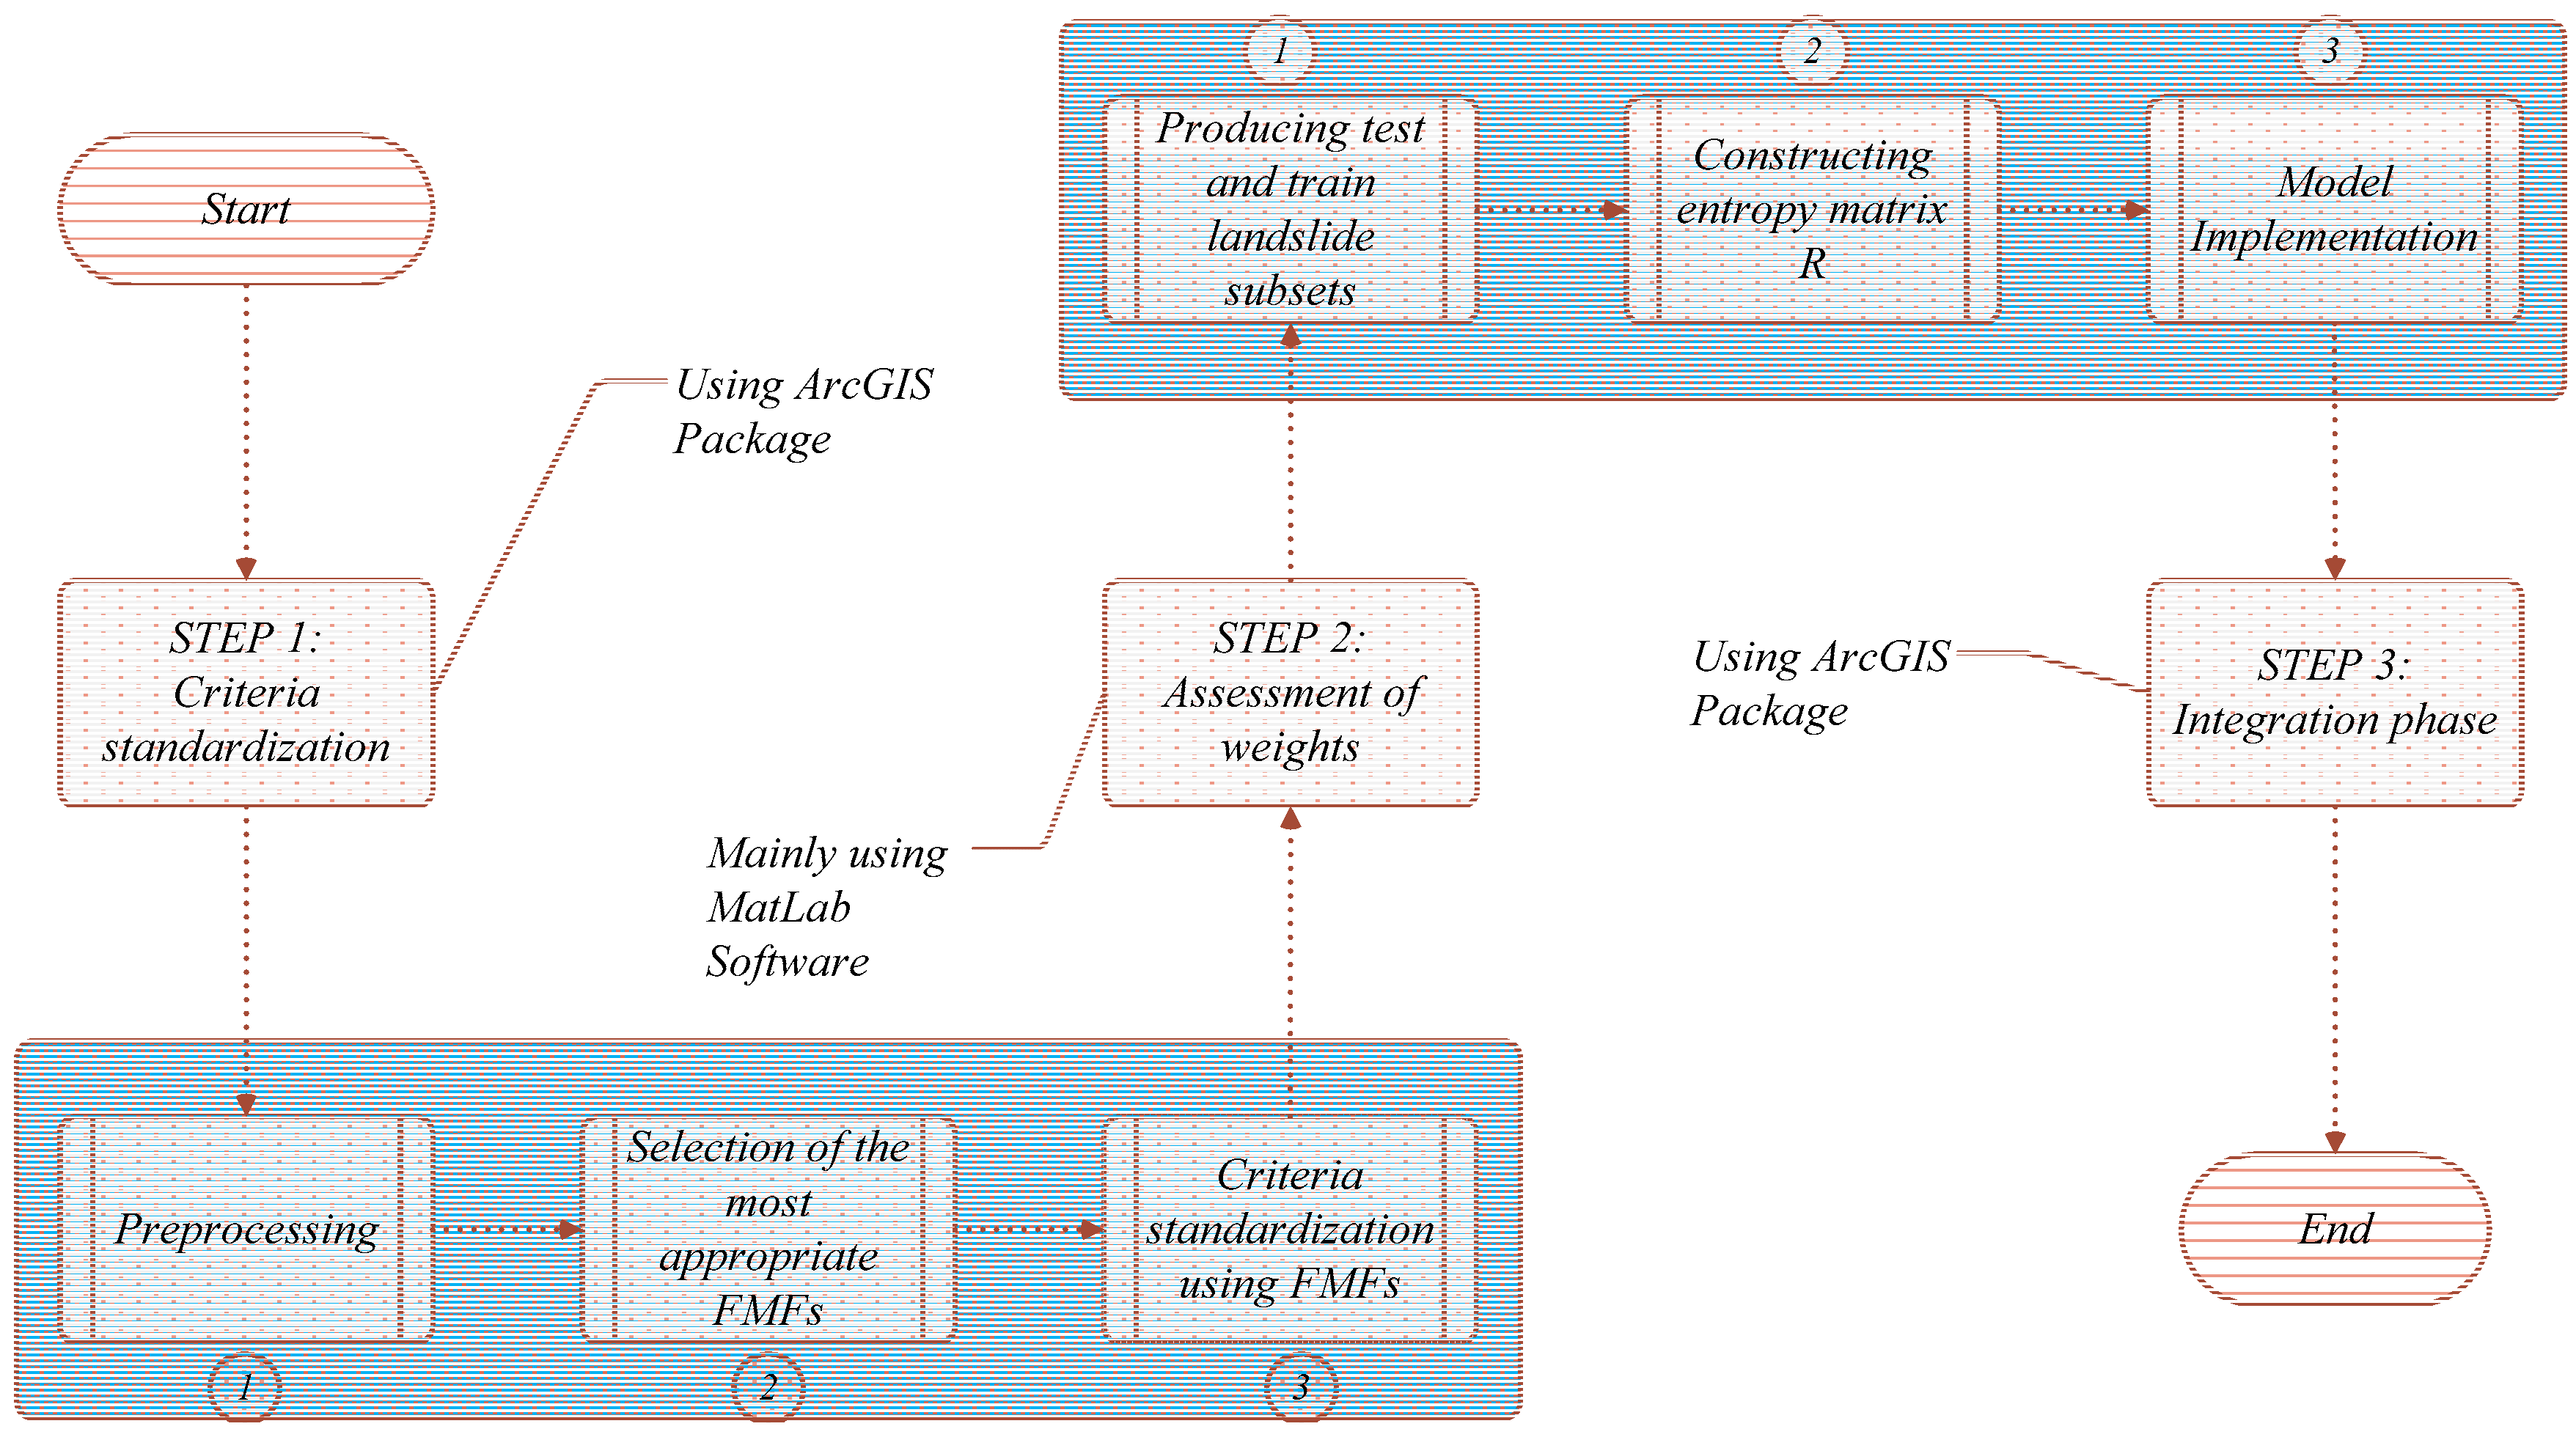
3.3. Methodology Implementation

The following 3-steps experimental design is implemented (see Figure 3).

3.3.1. Step 1: Data Standardisation Using FMFs

Considering the fact that GIS-based landslide related criteria measured not only in different units but also in different scales of measurement (data types), such as nominal, ordinal, interval, and ratio scales [71], there is an urgent need for data standardisation. This rises from the inherent need to integrate all landslide criteria into the single output in the evaluation process. In this regard, the fuzzy membership approach is considered one of the frequently applied standardisation methods that have been proposed [72].
The use of fuzzy sets within GIS-based hazard and susceptibility assessment has been demonstrated to have a good effect [71,72,73]. For this reason, fuzzy sets were used in this study. In this context, all the factors used were standardised to a float-level range of 0–1, where 0 is assigned to the least susceptible areas and 1 to the most susceptible ones. This transforms the different measurement units of all landslide casual criteria into comparable values using FMFs [74]. Figure 4 shows selected and applied FMFs for LSM of the study region.
There is no optimal method for choosing the most appropriate FMF and their respective parameters; these are generally selected according to the preferences of the DMs [17,75]. However, the predictive and causal value of landslide casual criteria seems more or less similar in most of the studies. In this study, three different membership functions have been employed for landslide susceptibility purpose including sigmoidal (s-shaped) FMFs, i.e., monotonically increasing and monotonically decreasing, user-defined fuzzy membership functions along with crisp membership functions are specified for each criterion (see Figure 4). The sigmoidal membership function is likely the most commonly used FMF in fuzzy set theory, and provides a gradual variation from non-membership (zero) to complete membership (one) [6,71,72,76], whereas it is sometimes inevitable to use user-defined FMFs or crisp membership functions. Nevertheless, all applied functions of criteria and the resultant output raster files are shown in Figure 4 and Figure 5, respectively.

3.3.2. Step 2: Assessment of Weights with Shannon Entropy

Here, this study selects a total number of 76 landslides to calculate the weights of each landslide criteria in southern Izeh. Following the insertion of all nine selected landslide criteria into the entropy matrix R, in order to standardise the basic data into the mentioned entropy matrix, both Equations (1) and (2) were employed along with user defined FMF and crisp MF (Figure 4). Next, weights of all criteria are determined by the help of Shannon entropy in the successive steps:
R = 1 2 76 { 1.000 0.583 0.747 1.000 0.000 0.143 0.970 1.000 0.300 0.337 0.000 0.708 1.000 0.000 0.138 1.000 1.000 0.300 M M M M M M M M M 0.364 0.124 0.000 0.140 0.184 0.122 1.000 0.900 0.600 }
Entropy values and weights can be calculated using (4)–(7):
E j = { 0.883 0.874 0.735 0.902 0.715 0.861 0.915 0.927 0.902 }
v j = { 0.116 0.097 0.264 0.097 0.284 0.138 0.084 0.072 0.097 }
w j = { 0.090 0.097 0.206 0.075 0.222 0.108 0.066 0.056 0.075 }
Finally, after further calculation of entropy value, we obtain the weights (Table 2) to be used in criteria integration in the next step.

3.3.3. Step 3: Integration Phase
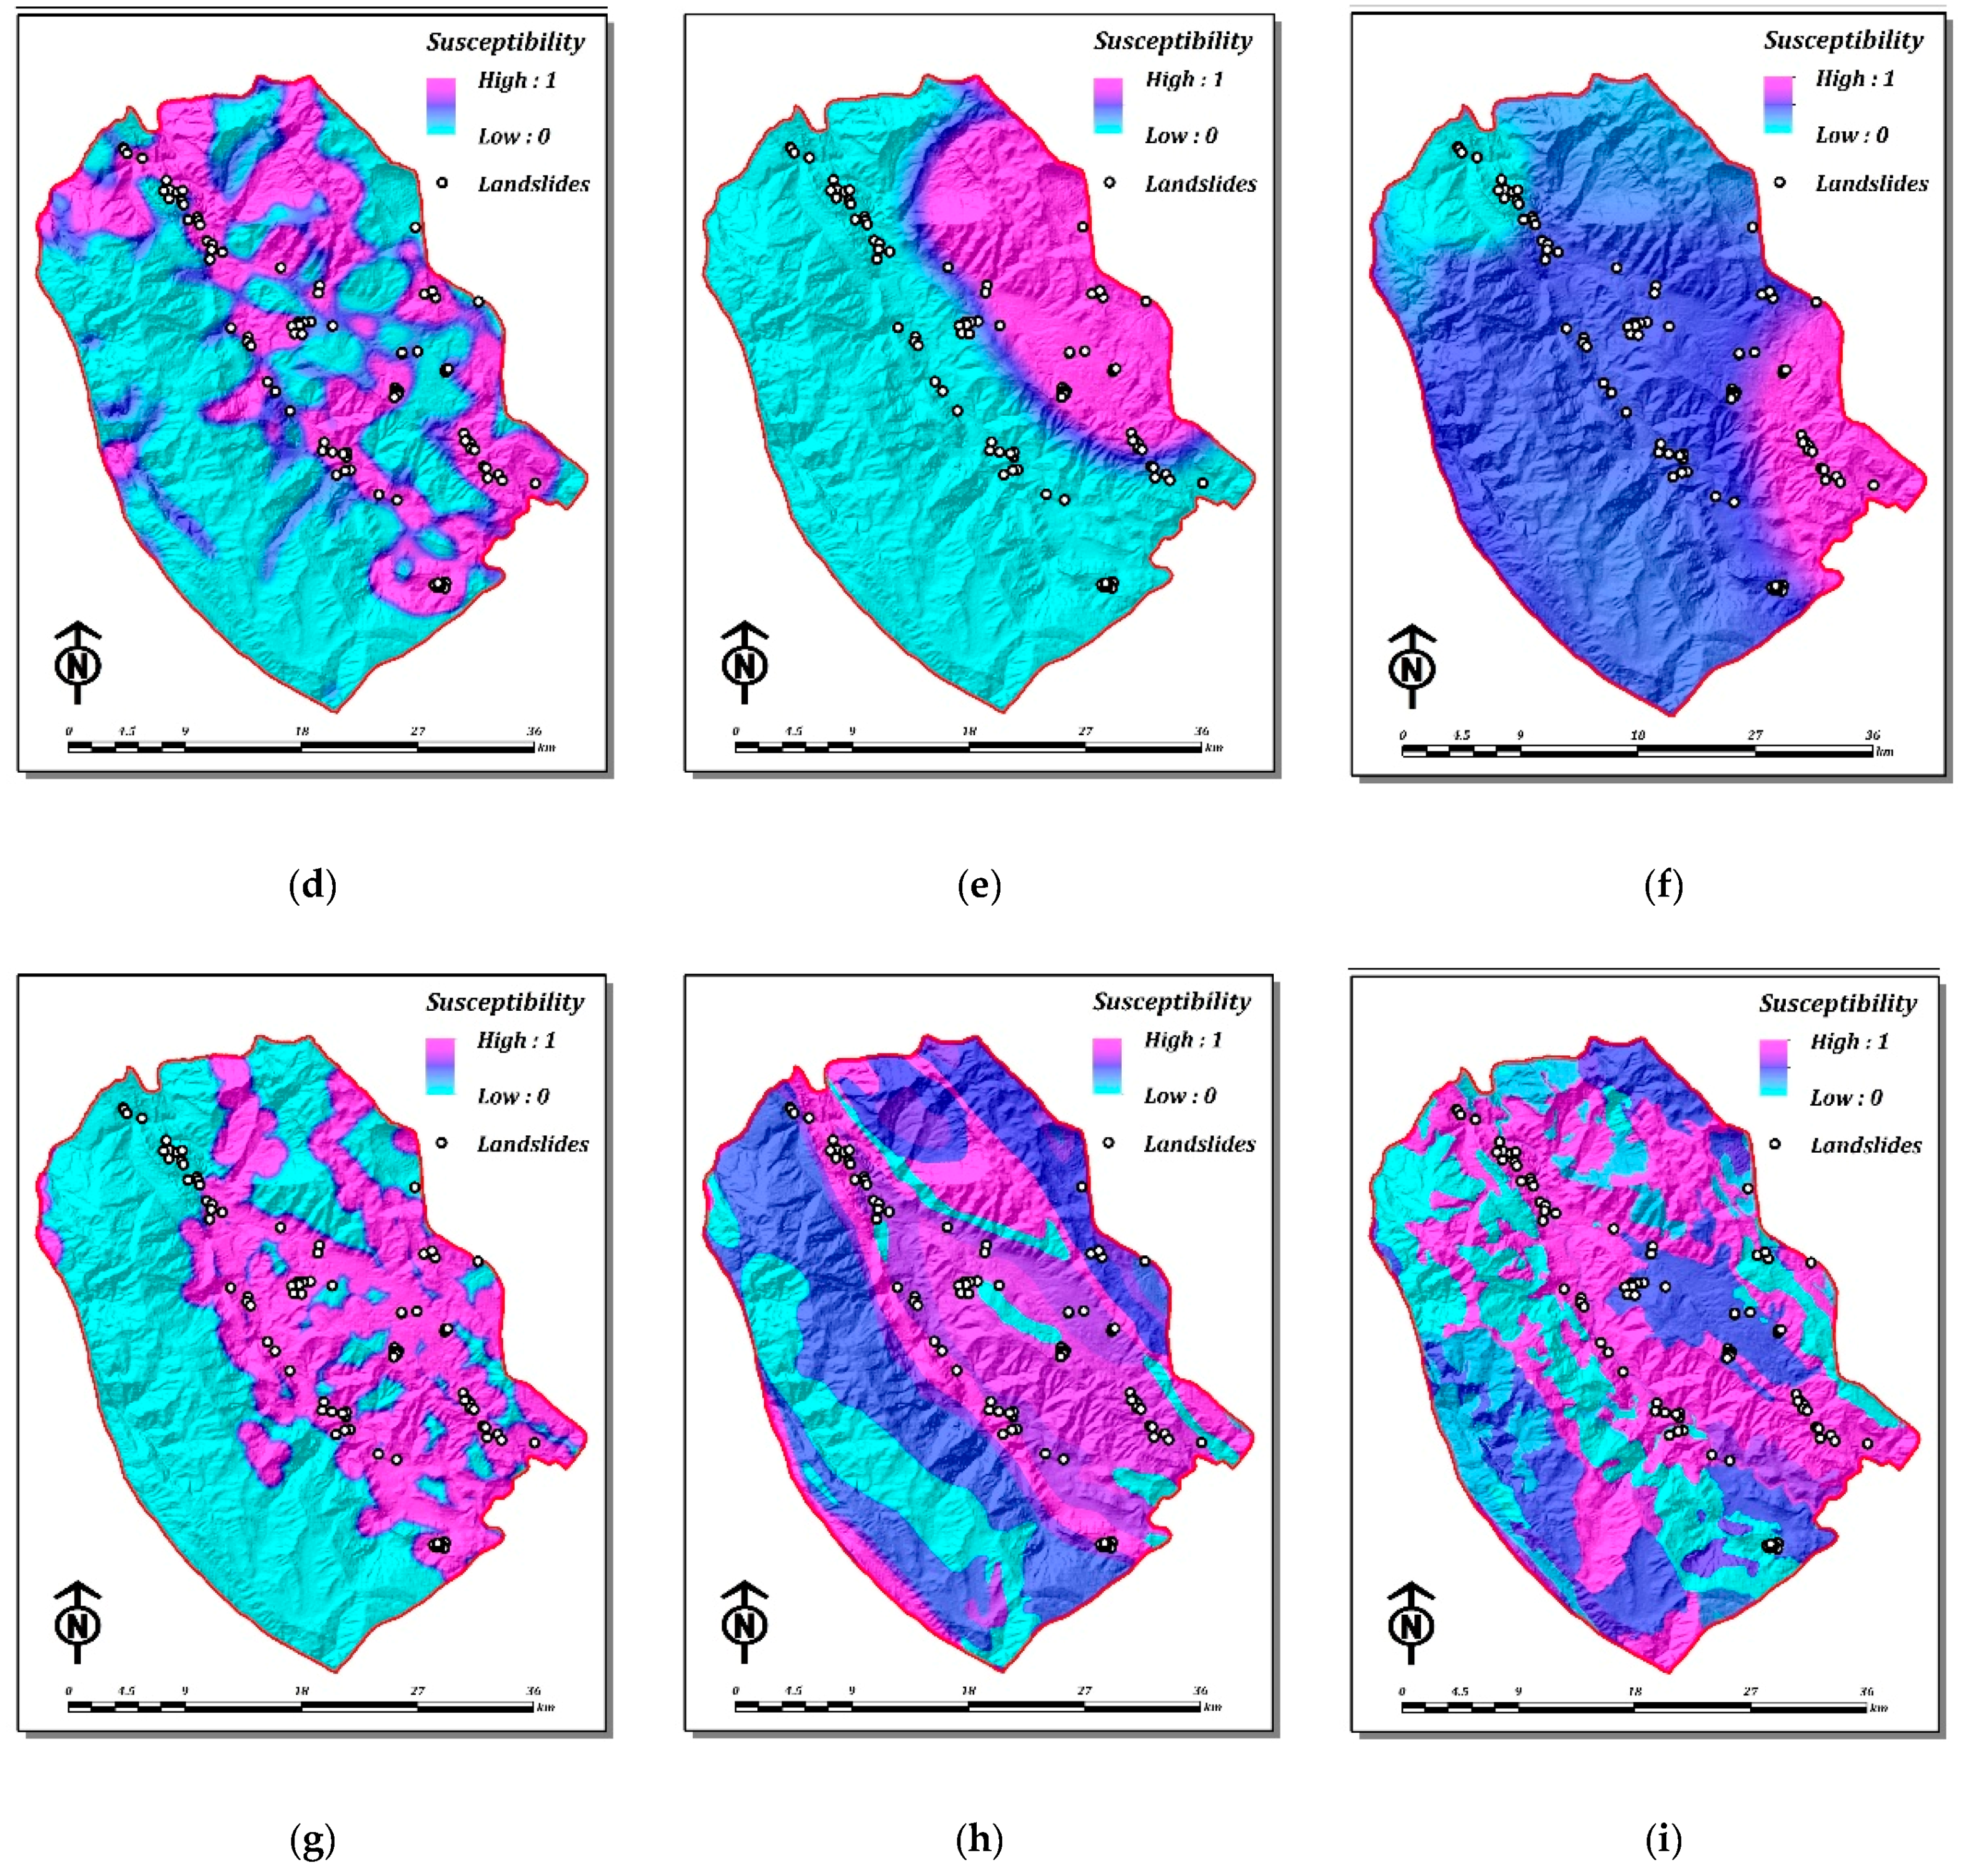
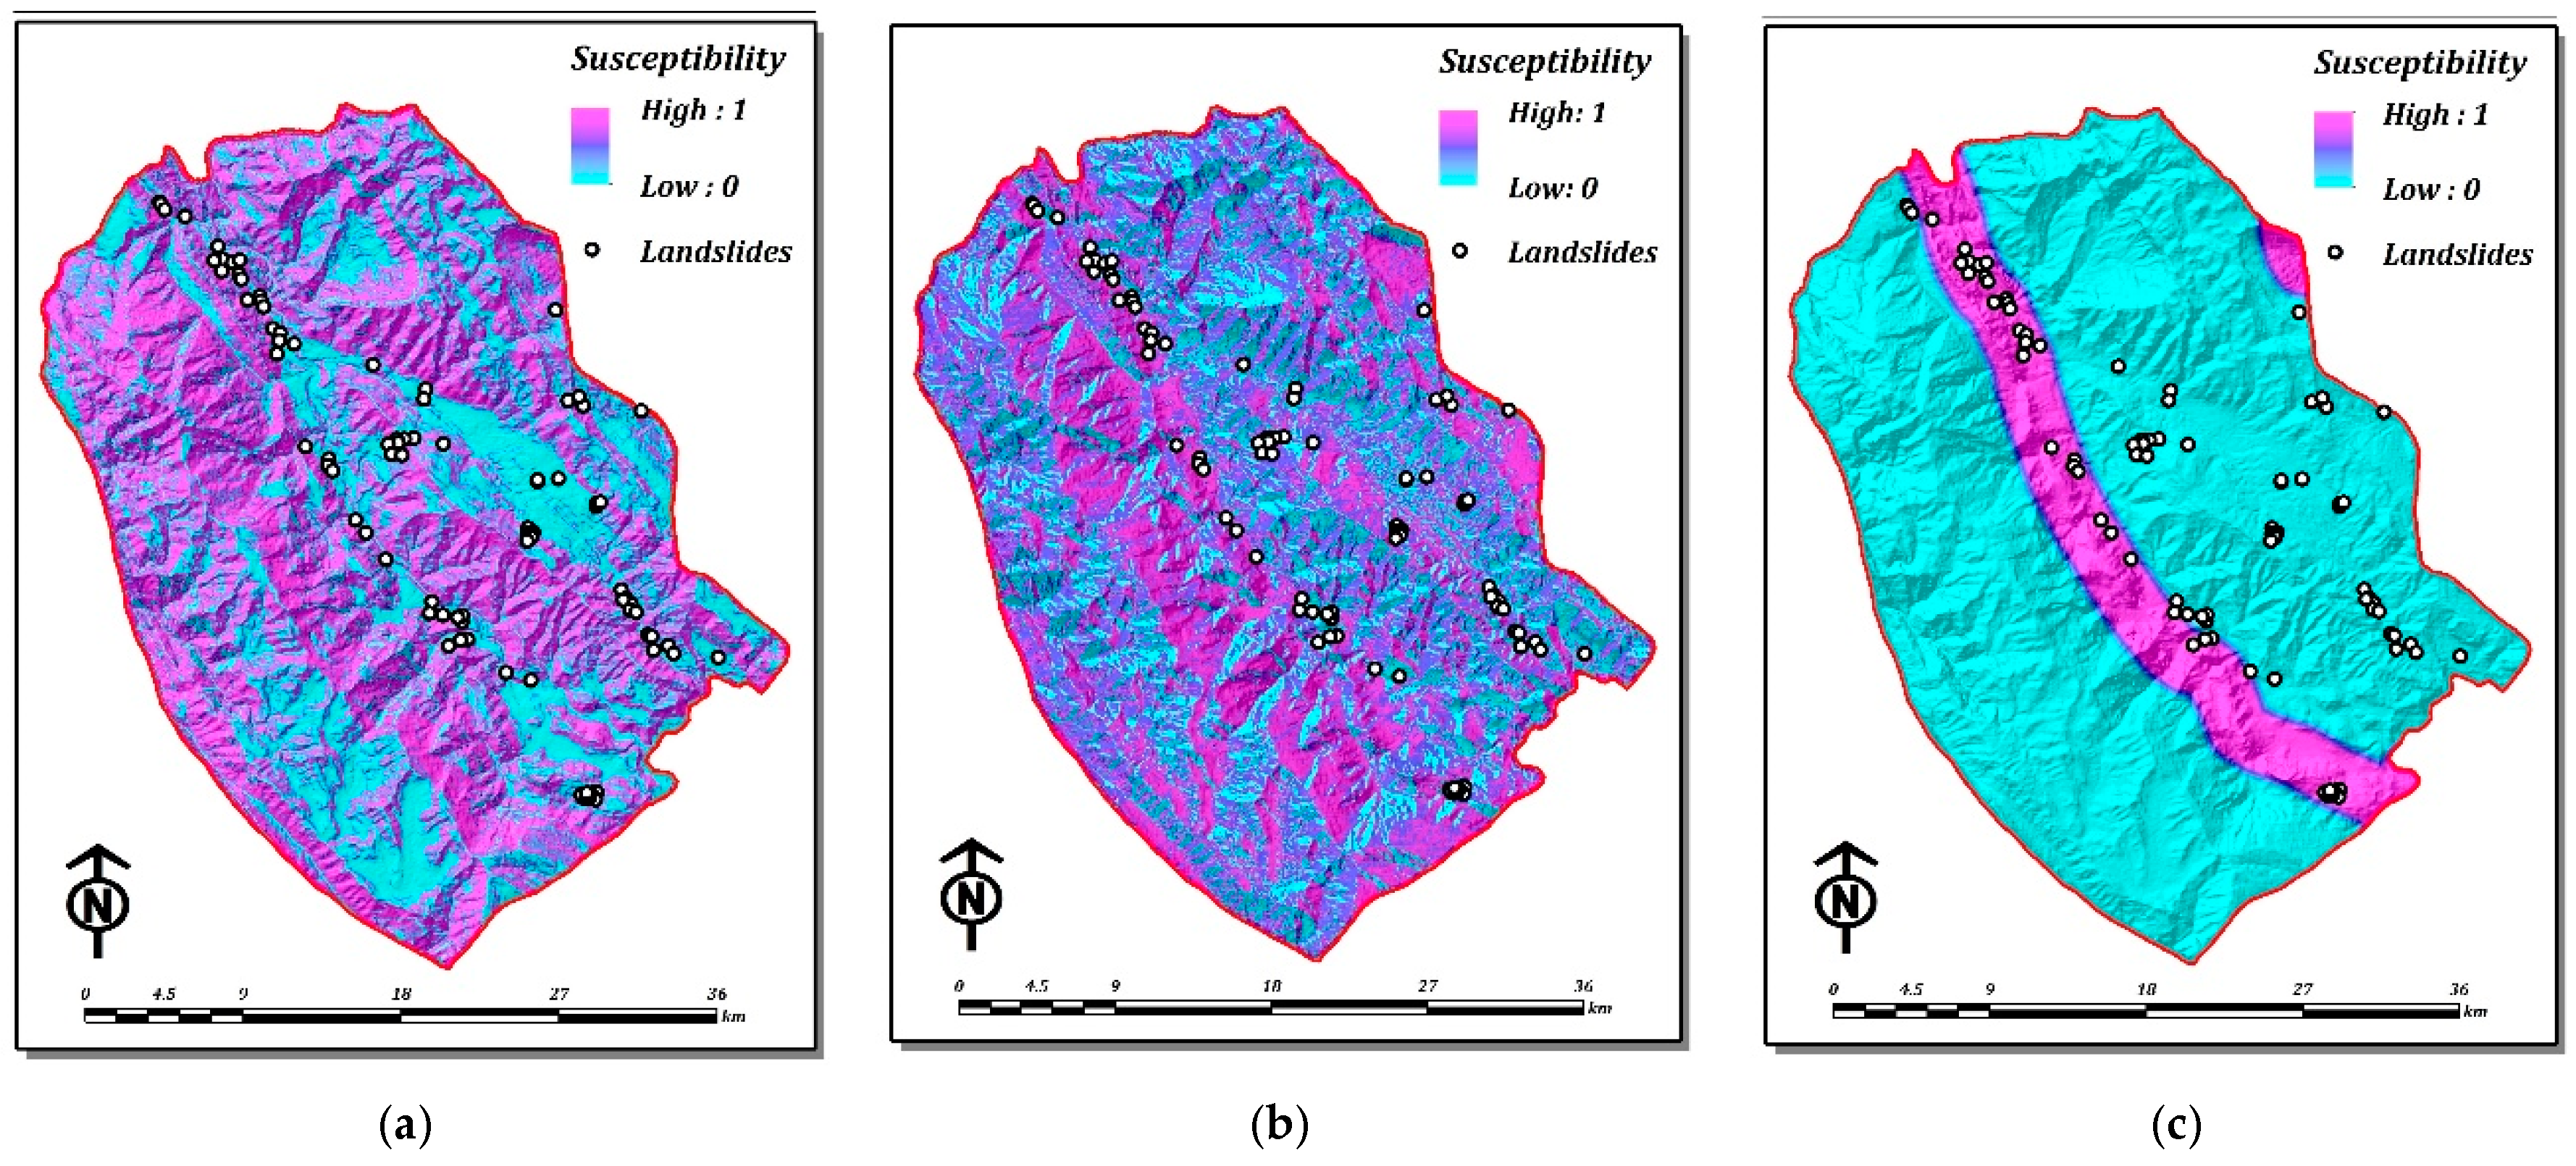
The prepared database of LSM is successfully georeferenced using Universal Transverse Mercator (UTM) coordinate system in the ArcGIS environment. The weight derived from Shannon entropy index for each landslide related criteria is calculated using the 76 occurred landslide events and is applied for integration purpose. Afterwards, the resultant susceptibility map is calculated as the summation of the weighted criteria as shown in Equation (9).
Using all the factors (Table 1), susceptibility values range from 0 to 8.00 showing various levels of susceptibility. The higher susceptibility values refer greater probability of expected landslides occurrence in the near future. Finally, the landslide susceptibility map (Figure 6) is divided into five susceptibility classes very low, low, moderate, high and very high using natural breaks classification.
The “natural breaks” classifier is based on natural grouping of data values. Normally, the breakpoints are identified by looking for groups and patterns inherent in the data. However, the reasons for using certain methods in previous works are usually not explained by the authors. In this study, the manual classifier method was used to reclassify the LSM values into five different susceptibility zones, according to the classification method that was proposed by [77].

4. Results

After layer standardisation of landslide casual criteria, the susceptibility map was produced based on a hybrid GIS-based LSM technique (see Figure 6). In terms of criteria weighting, typically, in spatial MCDA (multi-criteria decision analysis) problems the greater the value of the entropy corresponding to a spatial attribute, which implies the smaller attribute’s weight, the less the discriminant power of that attribute in decision-making process (see Equation (8)) [54]. Accordingly, fault and river criteria are considered as the two first important landslide criteria. Also, the distance from faults and river criteria both indicate potential trigger factors of the slope failure, are also among the principal indexes of a landslide. As a result, the objectively obtained weights of the landslide related criteria using Shannon entropy index is consistent with the basic rules of identification, characterization and development of landslides.

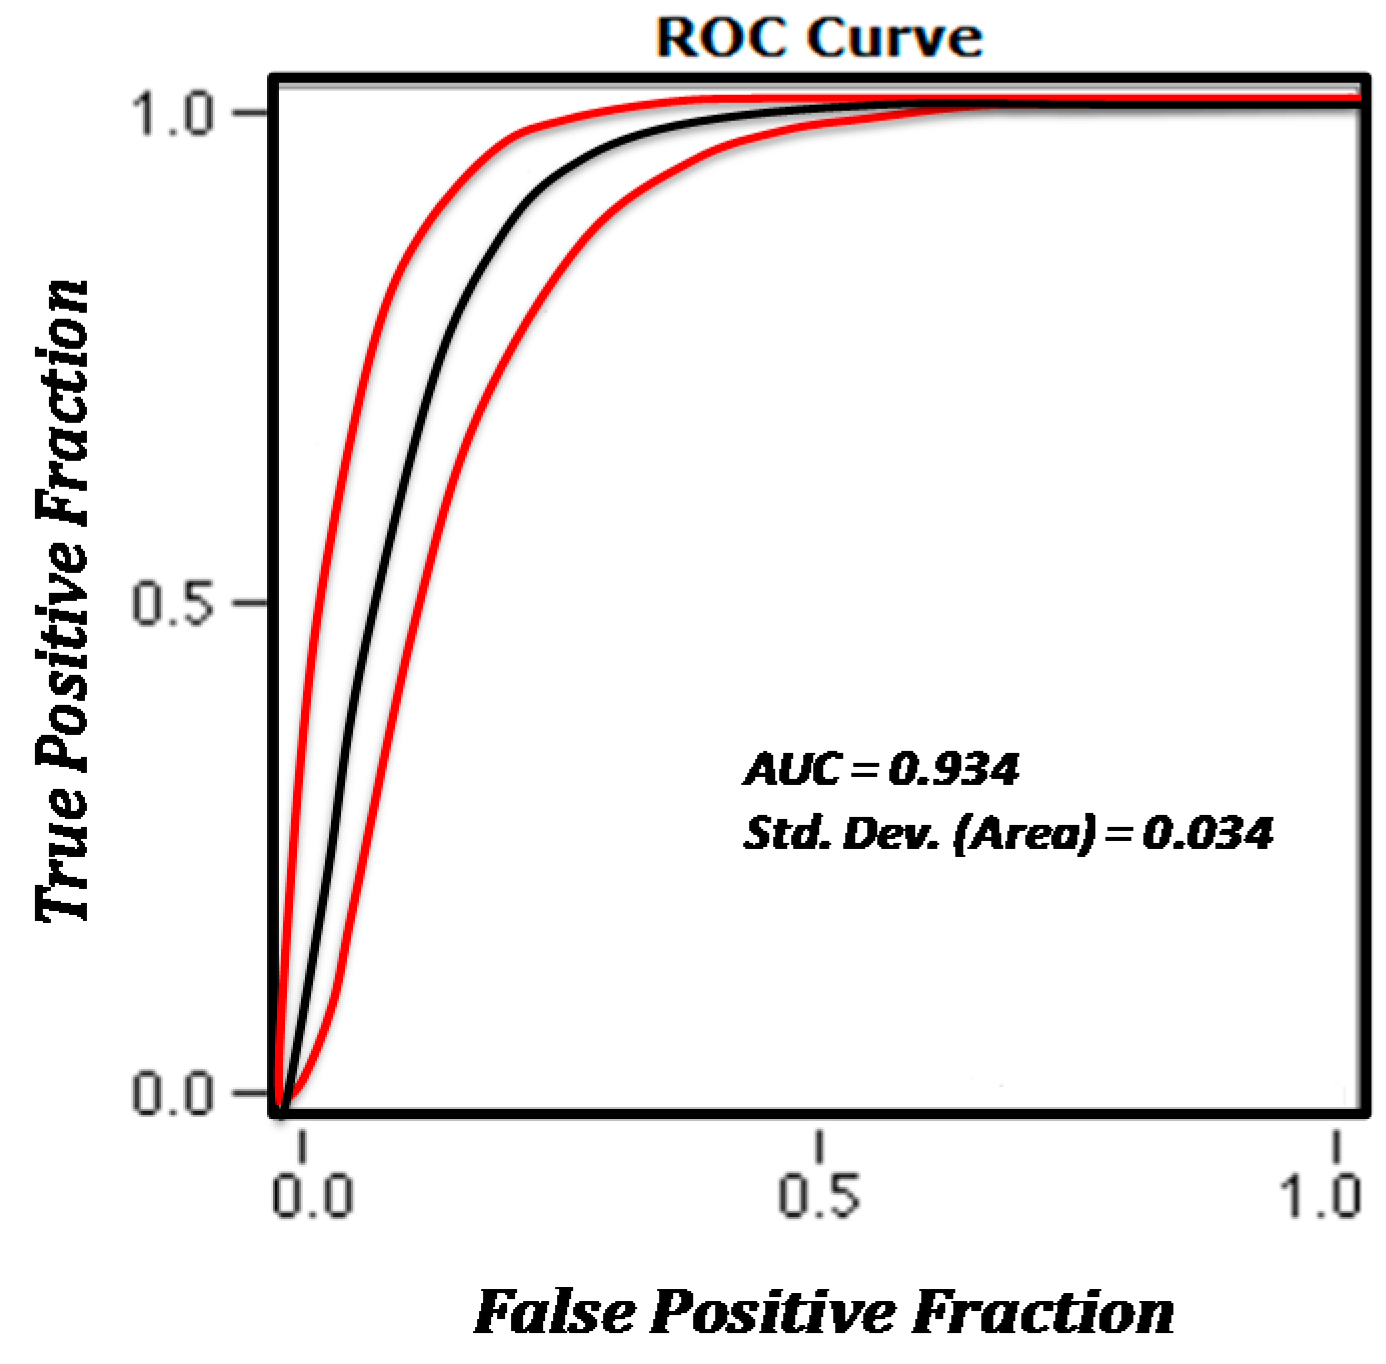
4.1. Validation of the Results Using ROC Curve

The validation phase could be considered as one of the most fundamental stages in the development of all susceptibility maps and determination of their prediction capability for future usage in any natural hazards study and managements. The prediction efficacy of each LSM and its resultant output is typically evaluated by using available independent information of recorded landslide events, which are not used through LSM process (i.e., test subset of landslide inventory map) [17]. As a result, in the present study, the landslide inventory database has been divided into two parts, including training and test datasets. Therefore, the accuracy of the proposed LSM in the study area was evaluated by calculating relative operating characteristics (ROC) [17,24,78] and percentage of known occurred landslides events in various susceptibility classes using test landslide samples. Here, the Area under the ROC Curve (AUC) value, ranging from 0.5 to 1.0, is a numeric indicator of map accuracy. Meaning that AUC is close to 1, the result of the test is more reliable, while closer the AUC to 0.5 indicates to the less reliable result [17,31].
In pursuance of further implementation of the ROC evaluation technique, a precise and comprehensive test dataset was prepared using 32 landslides and 32 randomly selected non-landslide points of the study area. In this regard, following the early identification of landslide-free area using aerial photo interpretation and field survey, non-landslide points are selected within the boundary of these landslide-free areas. Subsequently, the AUC value of 0.934 has been obtained with standard deviation (area) of 0.034 (see Figure 7).

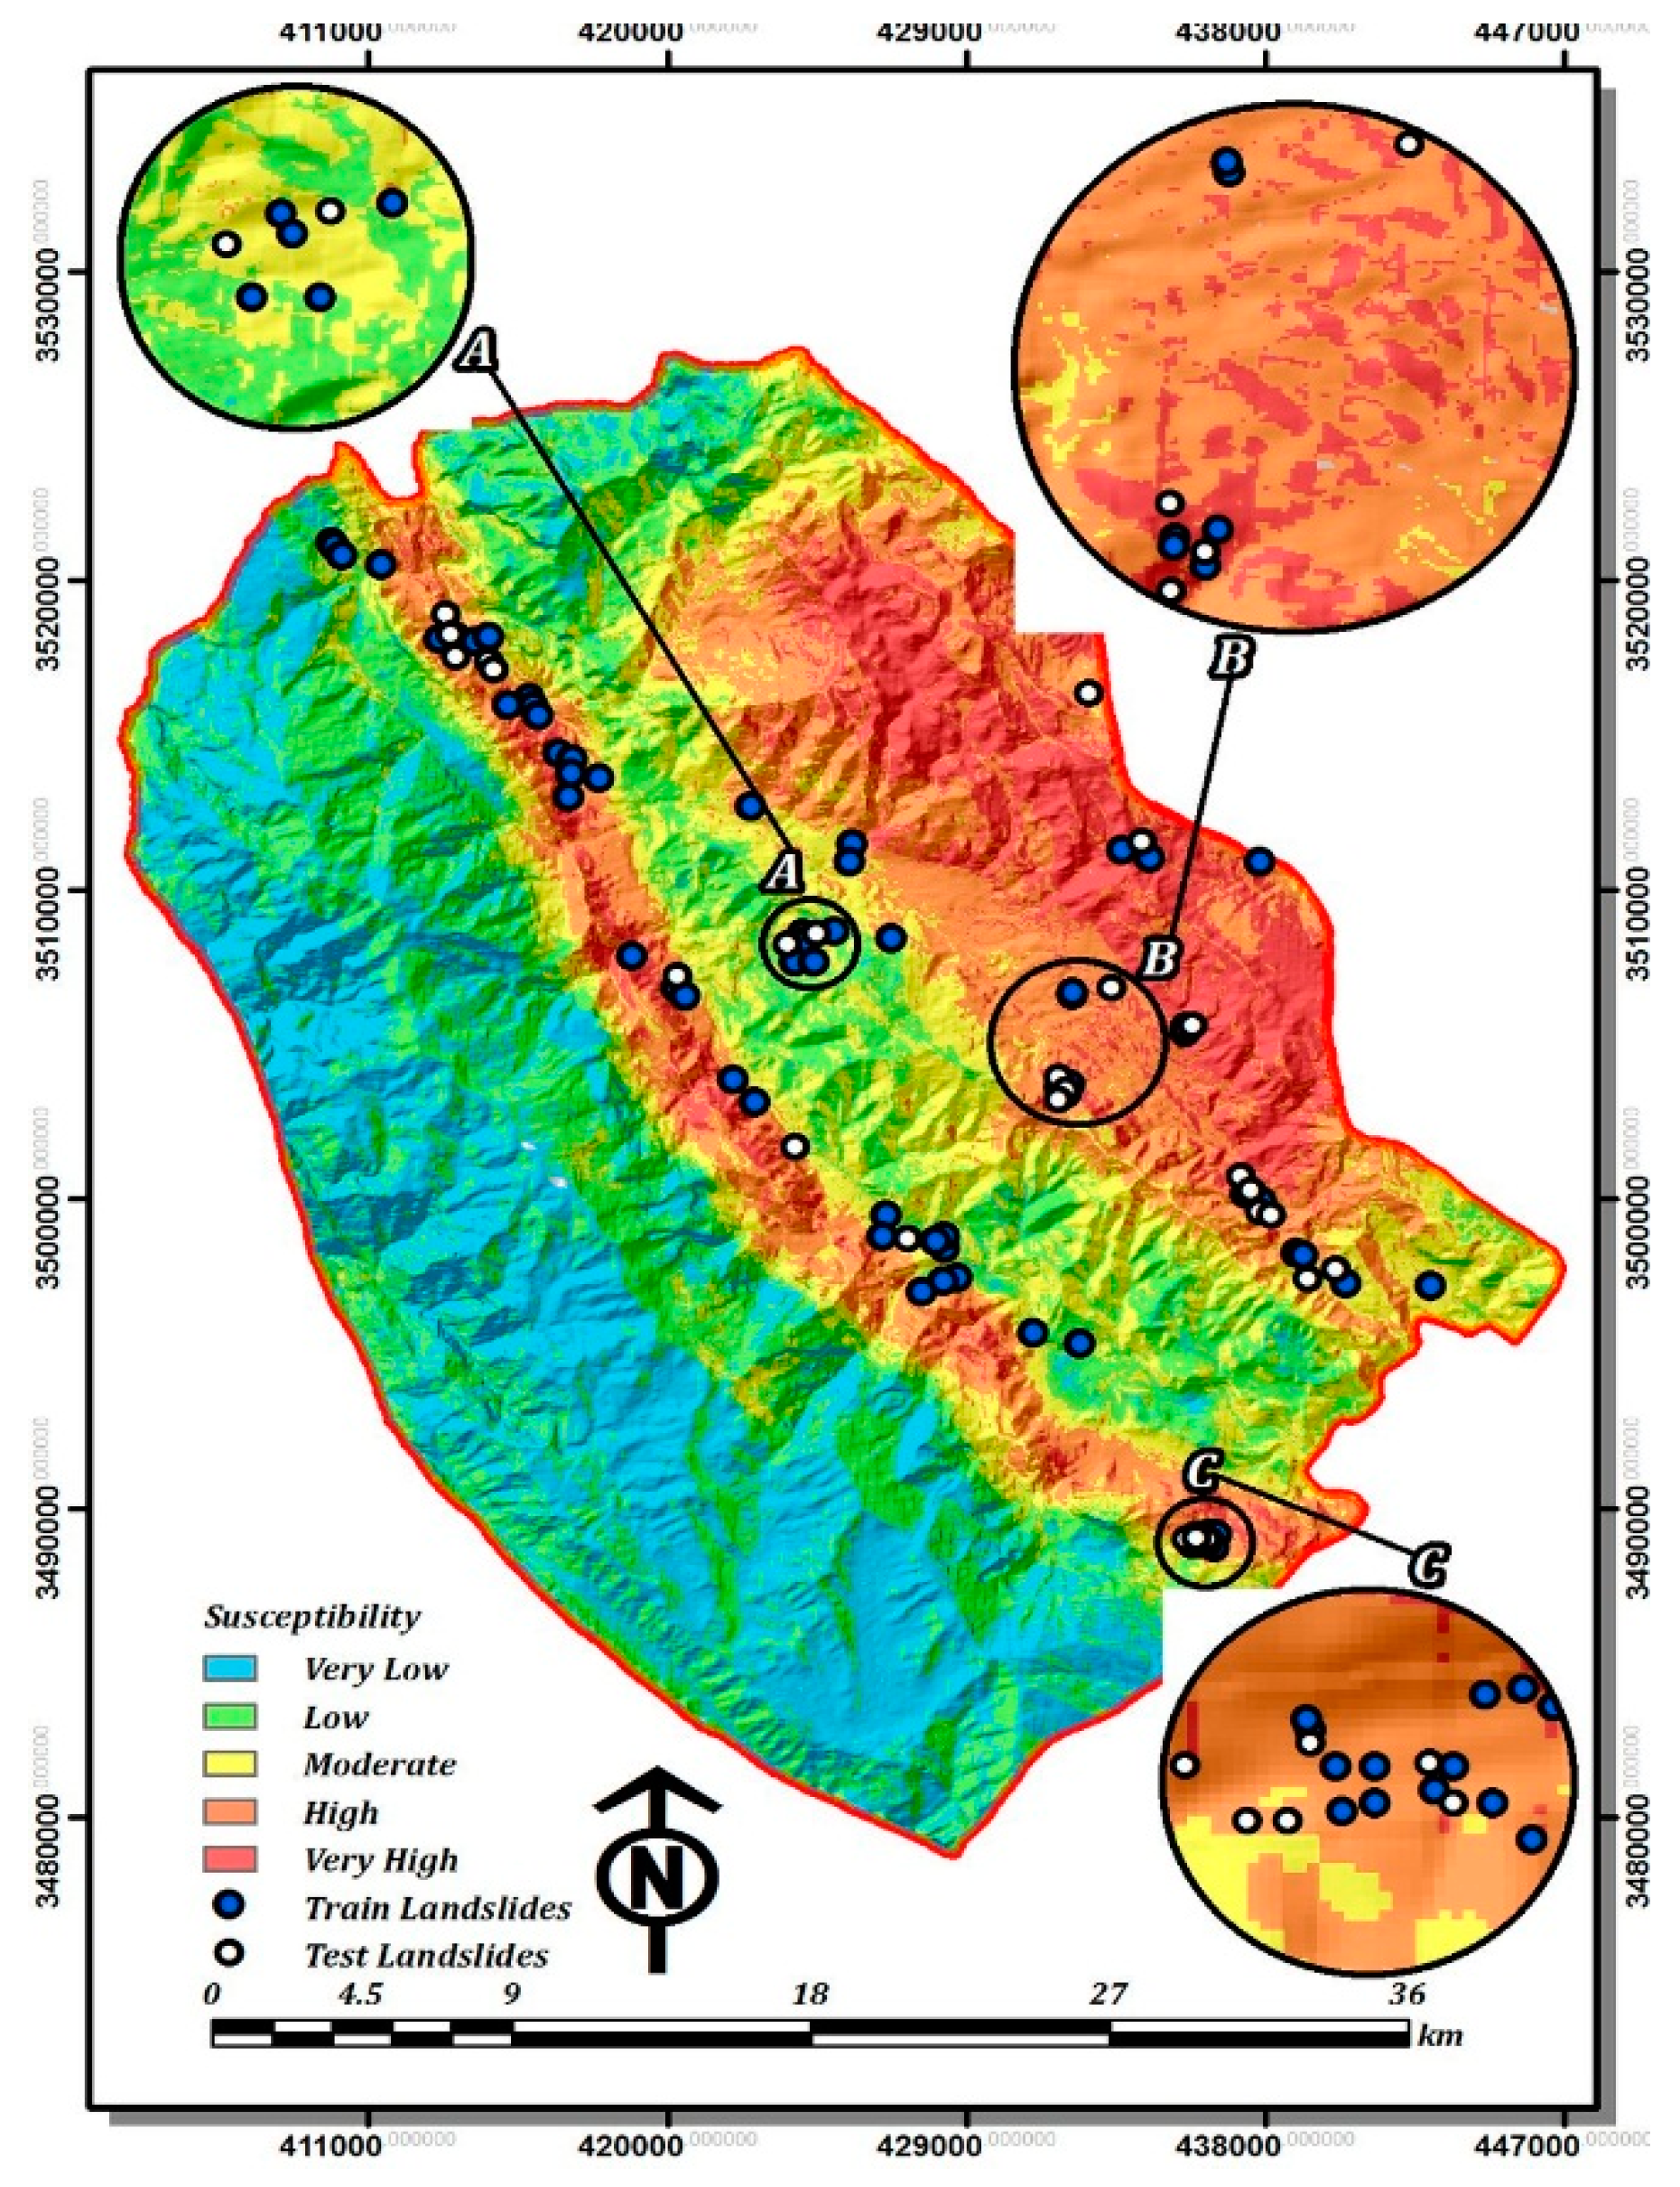
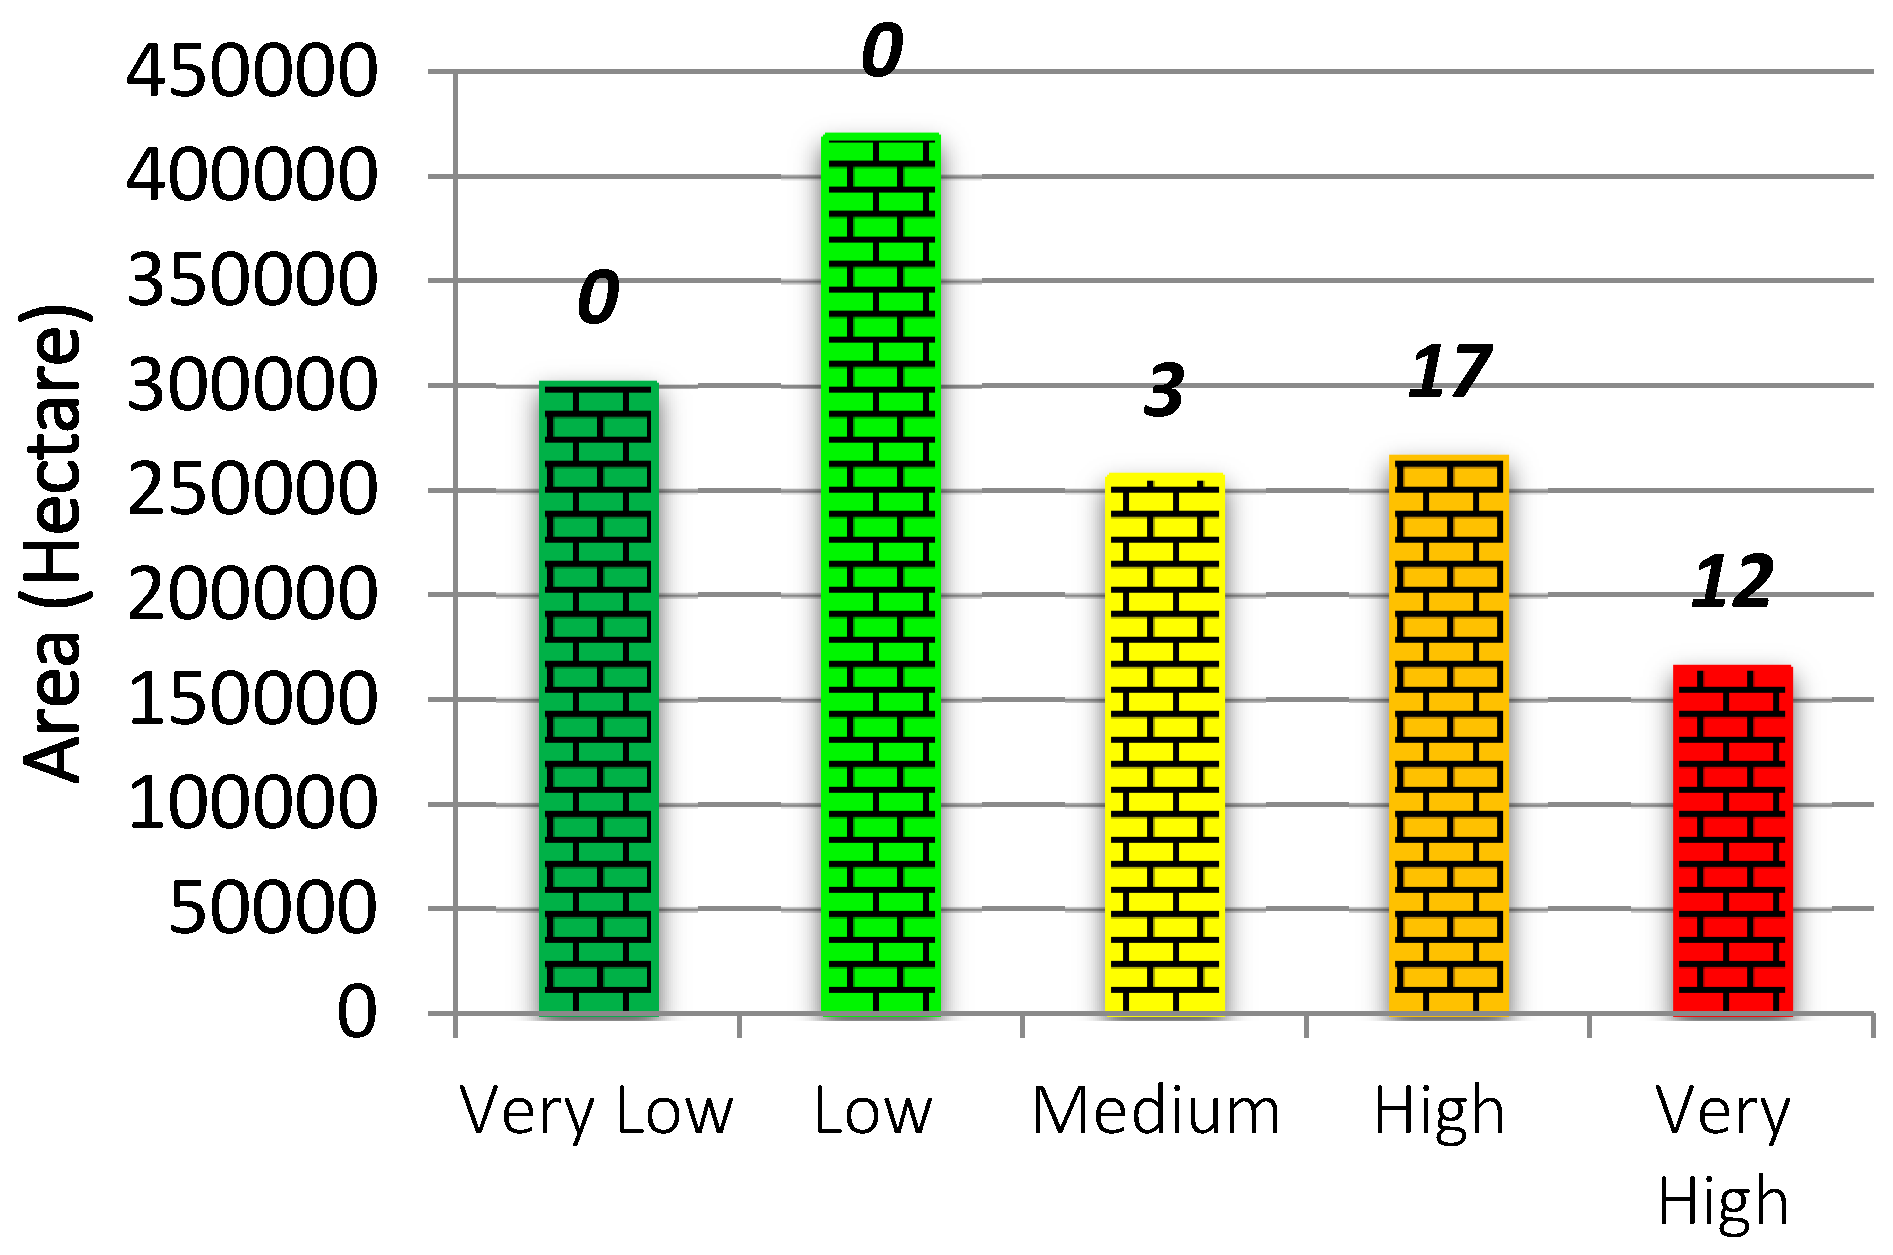
4.2. Validation of the Results Using Simple Overlay

In the second validation process, the LSM result has been evaluated using the test landslide locations, accordingly, these 32 points were overlaid on the susceptibility map of proposed hybrid GIS-based LSM (see Figure 6). The result shows that approximately about 90 percent of the recorded landslides occurred in the high and very high susceptibility classes, which only cover 30.63% of the study area, while, no recorded landslide appears in the low and very low susceptibility zones. In addition to the above, only three landslide points (≈10% of all recorded landslides) fall into the medium susceptibility zone of the map, which covers about 18.22% of the study area (see Figure 8).

5. Discussion

The accuracy of predictive models is considered a major concern in the majority of environmental modelling applications including LSM [50]. The predictive accuracy of subjective LSM models can be affected by the inherent bias that emanates from DMs’ point of view during both data standardisation and criteria weighting. Moreover, the absence of expert DMs may be a serious hindrance in the LSM process when using a subjective method. Considering criteria standardization schemes, by applying a more computationally intensive approach we attempted to preserve the original quality of spatial data. In this respect using a variety of FMFs positively affected the validity and accuracy of input spatial criteria. Therefore, missing or generalised values can represent otherwise precise data. Further, the proposed methodology shows promising results to predict landslide susceptibility values regardless of experts’ opinion. According to the obtained results, the accuracy of the proposed hybrid model is improved significantly compared with the accuracy of accurate subjective approaches, which have been previously implemented in the study area using the same dataset [44].

5.1. Obtained Results and Relevance to the Previous Studies

Considering the high frequency of landslides ocurring in several areas of southern Izeh, there was a demand to establish an accurate landslide susceptibility map. The expected accuracy of LSM depends not only on the presence of concise and comprehensive data, in terms of data scale and accuracy, but also on the selection of the appropriate methodology of data processing and modelling [15]. Regardless of data scale and accuracy, the present study aimed to explore landslide susceptibility of southern Izeh by developing a hybrid GIS-based LSM that uses neither DM's evaluation nor sophisticated objective methods. This is an integrated strategic LSM framework with an emphasis on structuring the decision-making process problem. Within this approach, Shannon entropy was employed to determine the criteria weightings from an objective evaluation of spatial domain while different fuzzy membership functions were employed for criteria standardization.
Obtained results of ROC curve analysis (AUC = 0.934) (see Figure 7) and simple overlay technique (see Figure 8) signify that the proposed hybrid fuzzy Shannon entropy evaluation technique is a promising tool for integrating multiple raster-based criteria for LSM while there is not sufficient knowledge about the criteria weights with respect to landslide mechanism of the study region. The previous study using the same dataset through extended fuzzy multi-criteria evaluation which was built on the basis of DMs’ evaluation achieved AUC value of 0.894 [44]. This further approves the capability of proposed hybrid model for prediction of landslide susceptibility values. In other words, achieved results of accuracy metrics comparison approves that the proposed LSM model can achieve superior prediction accuracy to what that can be achieved by using DMs’ points of view (Table 3), with significant time saving.

5.2. Spatial Information Extraction and Prediction

This study contributed in the area of the spatially structured dilemma of predicting landslide susceptibility values for specific geographic locations. This may be implemented through standardising and subsequent summing of landslide casual criteria. In this paper, we attempted to present an assessment of LSM, carried out by the implementation of hybrid fuzzy Shannon entropy evaluation within which fuzzy set theory has been used for criteria standardisation, and Shannon entropy algorithm was used for weighting of some factors that may affect the landslide susceptibility. Therefore, the prepared hybrid susceptibility map is the result of a pixel-based combination of nine standardised criteria affecting the degree of landslide susceptibility. The optimal criteria weights are obtained objectively by a precise mathematical solution through the proposed entropy-based model [79]. In this respect, the lower the landslide entropy of a criterion, the higher the weight is. In other words, a lower landslide entropy within certain criteria (i.e., distance to faults and distance to river) indicates the presence of predictive spatial frequency and vice versa.
Further, as expected, the estimated data driven (objective) criteria weights using Shannon entropy algorithm do not conform to the subjective criteria weights estimated using an aggregation of DMs’ votes from our prior research (Figure 9).
According to the obtained fuzzy Shannon entropy criteria weighting scheme results the distance to fault is the most important criterion, followed by distance to river and rainfall criteria, respectively. Therefore, considering the estimated criteria weights, the spatial distribution of landslide susceptibility values is mostly controlled by these mentioned criteria. This may be further proved by the high concentration of recorded landslide events along the Karun River (Figure 6). Nonetheless, considering the DMs’ evaluation slope is referred to as the most significant criterion followed by lithology and distance to road layers. Considering these two weighting approach, fuzzy Shannon entropy seems more realistic for predictive modelling of spatial pattern of landslides compared to the latter method. Even though the slope criterion is of paramount importance in any shape of slope instability, it is not the only constituent of landslides. Accordingly, the spatial pattern of landslides (at least in the study region) is controlled by other important but less geographically available landslide casual criteria (distance to fault, distance to river and rainfall criteria). In other words, if similar high susceptible values of slope (or any other criteria) are prevailing all around a region while the landslide distribution pattern is represented by a different spatial order (Figure 5a), a secondary criterion (such as distance to river) with less availability may be the determinant factor of landslides’ spatial distribution (Figure 5c,e,f). This indicates the insight of the proposed objective weighting scheme in local evaluation of the landslide casual criteria. In other words, in the current study area, the slope angle is usually sufficient to influence landsliding. Nonetheless, considering the spatial distribution of landslides, there is limited evidence which proves that the slope criterion plays an important role in landsliding. In the present study area, susceptible slope values are distributed almost evenly over the study region; however, actual landslide events are more or less concentrated along the Karun Canyon. This may be due to the fact that the required water for slope failure, as a triggering factor, is controlling landslide events in southern Izeh. Water is not always directly involved as the transporting medium in mass movement processes while it does play an important role. This is not only proved by the obtained criteria weights of the Shannon entropy method but also it can be recognized by visual inspection of landslide spatial patterns and frequency along the Karun River (Figure 6).
Further, considering the results of our proposed objective weighting approach lithology criterion is the least important among all selected criteria, while the expert opinion refers to the rainfall layer as the least important. The achieved accuracy value of fuzzy Shannon entropy, however, is still remarkably superior.

5.3. Decision Aiding and Planning

Many researchers, [13,80,81] have pointed out that the traditional subjective weighting schemes usually suffer from sensitivity in decision-making and they are susceptible to intrinsic experts’ knowledge errors. Looking into the contribution to decision aiding, this study presents an integrated strategic weighting procedure using an objective method which determines the criteria weights by solving mathematical models. This is executed without any consideration of the decision maker’s preferences as it is a convention in subjective methods, such as the AHP method, OWA method, Delphi method, etc. In other words, this article introduces an objective approach that integrates fuzzy set theory and information theory algorithm (i.e., Shannon entropy), which could be a useful geospatial tool for integrating multiple features/attributes that affect the LSM process. This can largely compensate for the absence of expert DMs or the lack of local knowledge about study area when it comes to producing quality LSMs.

5.4. Limitation of the Proposed Methodology in LSM

While information theory-based methods such as the one proposed in the present research have shown considerable potential in different predictive spatial modelling scenarios, they do have their own limitations. Even though the application of the proposed methodology as an objective weighting scheme is not dependent on decision maker’s expertise and judgment, it relies on quantification of defined attributes of landslide data points using step by step mathematical computations. This is conditional on the existence of a concise and representative database. In terms of the present research, the availability of a comprehensive and readily accessible landslide inventory database was quite beneficial in achieving the desired outcome.
Another limitation of the implemented methodology is observable in particular in the NE part of the study region where false alarms exist in the form of low slope areas indicated as a high susceptibility class (very few pixels as a very high susceptible class). This is mainly due to the fact that the slope angle is not characterised as a primary criterion shaping the landslide occurrence spatial pattern. Most LSM approaches end up with extremely high false positive rates in terms of high or very high susceptible areas compared to the total landslide areas. This problem is not only limited to our study, therefore, we would like to call the attention of the physical geography community, in particular methodological development researchers, to exploring ways to reduce the problem of over-estimated susceptibility in future studies.
Further, after fitting the desired membership function, the proposed fuzzy Shannon entropy technique considers the dataset as a collection of distributions, which may not be suitable to extract specific spatial structures embedded in the underlying features/attributes [82]. Even though datasets with the same histogram certainly have the same entropy (i.e., distance to river and distance to fault in the present study), the distributions of their data values in space could be totally different. In addition, the result can be sensitive to the level of discretization caused by different membership functions (i.e., crisp or fuzzy) when using the histogram. We believe that further interest from researchers with access to larger data sample sizes is vital for developing more robust entropy-based LSM methods that can incorporate generalizable results.

6. Conclusions

This study showed promising results for GIS-MCDA tackling two major limitations. Firstly, the inherent subjectivity which emanates from decision makers’ (DMs’) preferences is diminished during the criteria standardization phase. Secondly, intrinsic biases and probable errors of DMs’ preferences corresponding to the subjective weighting approaches are also eliminated using the proposed LSM model. This LSM approach involves a thoughtful selection and elaborative standardization of landslide casual criteria while weighting procedures are accomplished using an objective method. This is performed by constructing a mathematical approach without any consideration of the DMs’ preferences from the beginning to the end of model implementation. Our results show that the integration of fuzzy sets with Shannon entropy can contribute to the production of landslide susceptibility maps with a reasonably high level of reliability. Finally, considering the fact that the proposed hybrid method has the advantage of objective weight evaluation, it can be used not only in similar areas of geo-hazard risk assessment and mapping, such as land subsidence, earthquake and flood risk mapping, but also in multi-hazard risk assessment for a further combination of risk elements. However, in order to apply the proposed objective weighting approach more generally by conducting different case studies, new hybrid models of GIS-based landslide susceptibility mapping need to be developed.

Acknowledgments

This research was supported by CSIRO Australian Sustainable Agriculture Scholarship (ASAS) as a top-up scholarship to Majid Shadman Roodposhti, a PhD scholar, at the University of Tasmania (RT109121), School of Land and Food. We thank three anonymous reviewers for their suggestions in improving the manuscript. Special thanks to Brett A. Bryan and Jeff Connor from CSIRO, Australia for their support.

Author Contributions

This paper was prepared using the contributions of all the authors. All authors have read and approved the final manuscript.

Conflicts of Interest

The authors declare no conflict of interest.

References

  1. Varnes, D.J. Slope movement types and processes. Transp. Res. Board Spec. Res. 1978, 176, 11–33. [Google Scholar]
  2. Brabb, E.E. Innovative approaches to landslide hazard and risk mapping. In Proceedings of the Fourth International Symposium on Landslides; Canadian Geotechnical Society: Torento, Canada, 1984; Volume 1, pp. 307–324. [Google Scholar]
  3. Ercanoglu, M.; Gokceoglu, C. Use of fuzzy relations to produce landslide susceptibility map of a landslide prone area (West Black Sea Region, Turkey). Eng. Geol. 2004, 75, 229–250. [Google Scholar] [CrossRef]
  4. Bui, D.T.; Pradhan, B.; Lofman, O.; Revhaug, I.; Dick, O.B. Spatial prediction of landslide hazards in Hoa Binh province (Vietnam): A comparative assessment of the efficacy of evidential belief functions and fuzzy logic models. Catena 2012, 96, 28–40. [Google Scholar]
  5. Atkinson, P.M.; Massari, R. Autologistic modelling of susceptibility to landsliding in the Central Apennines, Italy. Geomorphol. 2011, 130, 55–64. [Google Scholar] [CrossRef]
  6. Zadeh, L.A. Fuzzy sets. Inf. Control 1965, 8, 338–353. [Google Scholar] [CrossRef]
  7. De Luca, A.; Termini, S. A definition of a nonprobabilistic entropy in the setting of fuzzy sets theory. Inf. Control 1972, 20, 301–312. [Google Scholar] [CrossRef]
  8. Kosko, B. Fuzzy entropy and conditioning. Inf. Sci. 1986, 40, 165–174. [Google Scholar] [CrossRef]
  9. Majerník, V. Entropy—A universal concept in sciences. Nat. Sci. 2014, 6, 552–564. [Google Scholar] [CrossRef]
  10. Xu, C.; Dai, F.; Xu, X.; Lee, Y.H. GIS-based support vector machine modeling of earthquake-triggered landslide susceptibility in the Jianjiang River watershed, China. Geomorphology 2012, 145, 70–80. [Google Scholar] [CrossRef]
  11. Shahabi, H.; Hashim, M.; Ahmad, B.B. Remote sensing and GIS-based landslide susceptibility mapping using frequency ratio, logistic regression, and fuzzy logic methods at the central Zab basin, Iran. Environ. Earth Sci. 2015, 73, 8647–8668. [Google Scholar] [CrossRef]
  12. Wang, W.D.; Guo, J.; Fang, L.G.; Chang, X.S. A subjective and objective integrated weighting method for landslides susceptibility mapping based on GIS. Environ. Earth Sci. 2012, 65, 1705–1714. [Google Scholar] [CrossRef]
  13. Feizizadeh, B.; Blaschke, T. GIS-multicriteria decision analysis for landslide susceptibility mapping: Comparing three methods for the Urmia lake basin, Iran. Nat. Hazards 2013, 65, 2105–2128. [Google Scholar] [CrossRef]
  14. Ayalew, L.; Yamagishi, H.; Ugawa, N. Landslide susceptibility mapping using GIS-based weighted linear combination, the case in Tsugawa area of Agano River, Niigata Prefecture, Japan. Landslides 2004, 1, 73–81. [Google Scholar] [CrossRef]
  15. Yalcin, A. GIS-based landslide susceptibility mapping using analytical hierarchy process and bivariate statistics in Ardesen (Turkey): Comparisons of results and confirmations. Catena 2008, 72, 1–12. [Google Scholar] [CrossRef]
  16. Neaupane, K.M.; Piantanakulchai, M. Analytic network process model for landslide hazard zonation. Eng. Geol. 2006, 85, 281–294. [Google Scholar] [CrossRef]
  17. Roodposhti, M.S.; Rahimi, S.; Beglou, M.J. PROMETHEE II and fuzzy AHP: An enhanced GIS-based landslide susceptibility mapping. Nat. Hazards 2014, 73, 77–95. [Google Scholar] [CrossRef]
  18. Barredo, J.; Benavides, A.; Hervás, J.; van Westen, C. J. Comparing heuristic landslide hazard assessment techniques using GIS in the Tirajana basin, Gran Canaria Island, Spain. Int. J. Appl. Earth Obs. Geoinf. 2000, 2, 9–23. [Google Scholar] [CrossRef]
  19. Van Westen, C.J.; Getahun, F.L. Analyzing the evolution of the Tessina landslide using aerial photographs and digital elevation models. Geomorphology 2003, 54, 77–89. [Google Scholar] [CrossRef]
  20. Ruff, M.; Czurda, K. Landslide susceptibility analysis with a heuristic approach in the Eastern Alps (Vorarlberg, Austria). Geomorphology 2008, 94, 314–324. [Google Scholar] [CrossRef]
  21. Lee, S.; Min, K. Statistical analysis of landslide susceptibility at Yongin, Korea. Environ. Geol. 2001, 40, 1095–1113. [Google Scholar] [CrossRef]
  22. Havenith, H.B.; Strom, A.; Caceres, F.; Pirard, E. Analysis of landslide susceptibility in the Suusamyr region, Tien Shan: Statistical and geotechnical approach. Landslides 2006, 3, 39–50. [Google Scholar] [CrossRef]
  23. Greco, R.; Sorriso-Valvo, M.; Catalano, E. Logistic regression analysis in the evaluation of mass movements susceptibility: The Aspromonte case study, Calabria, Italy. Eng. Geol. 2007, 89, 47–66. [Google Scholar] [CrossRef]
  24. Nandi, A.; Shakoor, A. A GIS-based landslide susceptibility evaluation using bivariate and multivariate statistical analyses. Eng. Geol. 2010, 110, 11–20. [Google Scholar] [CrossRef]
  25. Ozdemir, A. Landslide susceptibility mapping using Bayesian approach in the Sultan Mountains (Akşehir, Turkey). Nat. Hazards 2011, 59, 1573–1607. [Google Scholar] [CrossRef]
  26. Budimir, M.E.A.; Atkinson, P.M.; Lewis, H.G. A systematic review of landslide probability mapping using logistic regression. Landslides 2015, 12, 419–436. [Google Scholar] [CrossRef]
  27. Shahabi, H.; Hashim, M. Landslide susceptibility mapping using GIS-based statistical models and Remote sensing data in tropical environment. Sci. Rep. 2015, 5, 9899. [Google Scholar] [CrossRef] [PubMed]
  28. Lee, S.; Ryu, J.H.; Won, J.S.; Park, H.J. Determination and application of the weights for landslide susceptibility mapping using an artificial neural network. Eng. Geol. 2004, 71, 289–302. [Google Scholar] [CrossRef]
  29. Pradhan, B.; Lee, S. Regional landslide susceptibility analysis using back-propagation neural network model at Cameron Highland, Malaysia. Landslides 2010, 7, 13–30. [Google Scholar] [CrossRef]
  30. Carrara, A. Multivariate models for landslide hazard evaluation. J. Int. Assoc. Math. Geol. 1983, 15, 403–426. [Google Scholar] [CrossRef]
  31. Pradhan, B. A comparative study on the predictive ability of the decision tree, support vector machine and neuro-fuzzy models in landslide susceptibility mapping using GIS. Comput. Geosci. 2013, 51, 350–365. [Google Scholar] [CrossRef] [Green Version]
  32. Bui, D.T.; Tuan, T.A.; Klempe, H.; Pradhan, B.; Revhaug, I. Spatial prediction models for shallow landslide hazards: A comparative assessment of the efficacy of support vector machines, artificial neural networks, kernel logistic regression, and logistic model tree. Landslides 2016, 13, 361–378. [Google Scholar]
  33. Conforti, M.; Pascale, S.; Robustelli, G.; Sdao, F. Evaluation of prediction capability of the artificial neural networks for mapping landslide susceptibility in the Turbolo River catchment (northern Calabria, Italy). Catena 2014, 113, 236–250. [Google Scholar] [CrossRef]
  34. Dou, J.; Yamagishi, H.; Pourghasemi, H.R.; Yunus, A.P.; Song, X.; Xu, Y.; Zhu, Z. An integrated artificial neural network model for the landslide susceptibility assessment of Osado Island, Japan. Nat. Hazards 2015, 78, 1749–1776. [Google Scholar] [CrossRef]
  35. Yeon, Y.K.; Han, J.G.; Ryu, K.H. Landslide susceptibility mapping in Injae, Korea, using a decision tree. Eng. Geol. 2010, 116, 274–283. [Google Scholar] [CrossRef]
  36. Hong, H.; Pradhan, B.; Xu, C.; Bui, D.T. Spatial prediction of landslide hazard at the Yihuang area (China) using two-class kernel logistic regression, alternating decision tree and support vector machines. Catena 2015, 133, 266–281. [Google Scholar] [CrossRef]
  37. Youssef, A.M.; Pourghasemi, H.R.; El-Haddad, B.A.; Dhahry, B.K. Landslide susceptibility maps using different probabilistic and bivariate statistical models and comparison of their performance at Wadi Itwad Basin, Asir Region, Saudi Arabia. Bull. Eng. Geol. Environ. 2016, 75, 63–87. [Google Scholar] [CrossRef]
  38. Pourghasemi, H.R.; Mohammady, M.; Pradhan, B. Landslide susceptibility mapping using index of entropy and conditional probability models in GIS: Safarood Basin, Iran. Catena 2012, 97, 71–84. [Google Scholar] [CrossRef]
  39. Constantin, M.; Bednarik, M.; Jurchescu, M.C.; Vlaicu, M. Landslide susceptibility assessment using the bivariate statistical analysis and the index of entropy in the Sibiciu Basin (Romania). Environ. Earth Sci. 2011, 63, 397–406. [Google Scholar] [CrossRef]
  40. Devkota, K.C.; Regmi, A.D.; Pourghasemi, H.R.; Yoshida, K.; Pradhan, B.; Ryu, I.C.; Dhital, M.R.; Althuwaynee, O.F. Landslide susceptibility mapping using certainty factor, index of entropy and logistic regression models in GIS and their comparison at Mugling–Narayanghat road section in Nepal Himalaya. Nat. Hazards 2013, 65, 135–165. [Google Scholar] [CrossRef] [Green Version]
  41. Tsangaratos, P.; Ilia, I. Combining fuzzy logic and information theory for producing a landslide susceptibility model. In Proceedings of the 14th International Congress of the Geological Society of Greece, Thessaloniki, Greece, 25–27 May 2016; Volume 50, pp. 34–46.
  42. Zongji, Y.; Jianping, Q.; Xiaogang, Z. Regional landslide zonation based on entropy method in Three Gorges area, China. In Proceedings of the Fuzzy Systems and Knowledge Discovery (FSKD), Yantai, China, 10–12 August 2010; pp. 1336–1339.
  43. Davis, J.; Blesius, L. A hybrid physical and maximum-entropy landslide susceptibility model. Entropy 2015, 17, 4271–4292. [Google Scholar] [CrossRef]
  44. Feizizadeh, B.; Roodposhti, M.S.; Jankowski, P.; Blaschke, T. A GIS-based extended fuzzy multi-criteria evaluation for landslide susceptibility mapping. Comput. Geosci. 2014, 73, 208–221. [Google Scholar] [CrossRef] [PubMed]
  45. Ministry of Natural Resources. Landslide Event Report; Ministry of Natural Resources: Khuzestan, Iran, 2010.
  46. Komac, M. A landslide susceptibility model using the analytical hierarchy process method and multivariate statistics in perialpine Slovenia. Geomorphology 2006, 74, 17–28. [Google Scholar] [CrossRef]
  47. Conoscenti, C.; Di Maggio, C.; Rotigliano, E. GIS analysis to assess landslide susceptibility in a fluvial basin of NW Sicily (Italy). Geomorphology 2008, 94, 325–339. [Google Scholar] [CrossRef]
  48. Thiery, Y.; Malet, J.P.; Sterlacchini, S.; Puissant, A.; Maquaire, O. Landslide susceptibility assessment by bivariate methods at large scales: Application to a complex mountainous environment. Geomorphology 2007, 92, 38–59. [Google Scholar] [CrossRef] [Green Version]
  49. Kayastha, P.; Dhital, M.R.; De Smedt, F. Landslide susceptibility mapping using the weight of evidence method in the Tinau watershed, Nepal. Nat. Hazards 2012, 63, 479–498. [Google Scholar] [CrossRef]
  50. Bennett, N.D.; Croke, B.F.; Guariso, G.; Guillaume, J.H.; Hamilton, S. H.; Jakeman, A.J.; Marsili-Libelli, S.; Newham, L.T.; Norton, J.P.; Perrin, C.; et al. Characterising performance of environmental models. Environ. Model. Softw. 2013, 40, 1–20. [Google Scholar] [CrossRef]
  51. Kritikos, T.; Robinson, T.R.; Davies, T.R. Regional coseismic landslide hazard assessment without historical landslide inventories: A new approach. J. Geophys. Res. Earth Surf. 2015, 120, 711–729. [Google Scholar] [CrossRef] [Green Version]
  52. Ayalew, L.; Yamagishi, H. The application of GIS-based logistic regression for landslide susceptibility mapping in the Kakuda-Yahiko Mountains, Central Japan. Geomorphology 2005, 65, 15–31. [Google Scholar] [CrossRef]
  53. Guzzetti, F.; Reichenbach, P.; Ardizzone, F.; Cardinali, M.; Galli, M. Estimating the quality of landslide susceptibility models. Geomorphology 2006, 81, 166–184. [Google Scholar] [CrossRef]
  54. Lotfi, F.H.; Fallahnejad, R. Imprecise Shannon’s entropy and multi attribute decision making. Entropy 2010, 12, 53–62. [Google Scholar] [CrossRef]
  55. Sabokbar, H.F.; Roodposhti, M.S.; Tazik, E. Landslide susceptibility mapping using geographically-weighted principal component analysis. Geomorphology 2014, 226, 15–24. [Google Scholar] [CrossRef]
  56. Pareek, N.; Sharma, M.L.; Arora, M.K. Impact of seismic factors on landslide susceptibility zonation: A case study in part of Indian Himalayas. Landslides 2010, 7, 191–201. [Google Scholar] [CrossRef]
  57. Kanungo, D.P.; Arora, M.K.; Sarkar, S.; Gupta, R.P. A comparative study of conventional, ANN black box, fuzzy and combined neural and fuzzy weighting procedures for landslide susceptibility zonation in Darjeeling Himalayas. Eng. Geol. 2006, 85, 347–366. [Google Scholar] [CrossRef]
  58. Lee, S.; Pradhan, B. Landslide hazard mapping at Selangor, Malaysia using frequency ratio and logistic regression models. Landslides 2007, 4, 33–41. [Google Scholar] [CrossRef]
  59. Marjanović, M.; Kovačević, M.; Bajat, B.; Voženílek, V. Landslide susceptibility assessment using SVM machine learning algorithm. Eng. Geol. 2011, 123, 225–234. [Google Scholar] [CrossRef]
  60. Shahabi, H.; Ahmad, B.B.; Khezri, S. Evaluation and comparison of bivariate and multivariate statistical methods for landslide susceptibility mapping (case study: Zab basin). Arab. J. Geosci. 2013, 6, 3885–3907. [Google Scholar] [CrossRef]
  61. Hong, Y.; Hiura, H.; Shino, K.; Sassa, K.; Suemine, A.; Fukuoka, H.; Wang, G. The influence of intense rainfall on the activity of large-scale crystalline schist landslides in Shikoku Island, Japan. Landslides 2005, 2, 97–105. [Google Scholar] [CrossRef]
  62. Guzzetti, F.; Peruccacci, S.; Rossi, M.; Stark, C.P. Rainfall thresholds for the initiation of landslides in central and southern Europe. Meteorol. Atmos. Phys. 2007, 98, 239–267. [Google Scholar] [CrossRef]
  63. Youssef, A.M.; Maerz, N.H.; Hassan, A.M. Remote sensing applications to geological problems in Egypt: Case study, slope instability investigation, Sharm El-Sheikh/Ras-Nasrani Area, Southern Sinai. Landslides 2009, 6, 353–360. [Google Scholar] [CrossRef]
  64. Bathrellos, G.D.; Kalivas, D.P.; Skilodimou, H.D. GIS-based landslide susceptibility mapping models applied to natural and urban planning in Trikala, Central Greece. Estud. Geol. 2009, 65, 49–65. [Google Scholar] [CrossRef]
  65. Akgun, A.; Sezer, E.A.; Nefeslioglu, H.A.; Gokceoglu, C.; Pradhan, B. An easy-to-use MATLAB program (MamLand) for the assessment of landslide susceptibility using a Mamdani fuzzy algorithm. Comput. Geosci. 2012, 38, 23–34. [Google Scholar] [CrossRef]
  66. Günlü, A.; Sivrikaya, F.; Baskent, E.Z.; Keles, S.; Çakir, G.; Kadiogullari, A.I. Estimation of stand type parameters and land cover using landsat-7 ETM image: A case study from Turkey. Sensors 2008, 8, 2509–2525. [Google Scholar] [CrossRef]
  67. Shi, Y.F.; Jin, F.X. Landslide stability analysis based on generalized information entropy. In Proceedings of the International Conference on Environmental Science and Information Application Technology (ESIAT 2009), Los Alamitos, CA, USA, 4–5 July 2009; pp. 83–85.
  68. Sujatha, E.R. Geoinformatics based landslide susceptibility mapping using probabilistic analysis and entropy index of Tevankarai stream sub-watershed, India. Disaster Adv. 2012, 5, 26–33. [Google Scholar]
  69. Mon, D.L.; Cheng, C.H.; Lin, J.C. Evaluating weapon system using fuzzy analytic hierarchy process based on entropy weight. Fuzzy Sets Syst. 1994, 62, 127–134. [Google Scholar] [CrossRef]
  70. Wang, F.; Cao, Y.; Liu, M. Risk early-Warning method for natural disasters based on integration of entropy and DEA model. Appl. Math. 2011, 2, 23–32. [Google Scholar] [CrossRef]
  71. Akgun, A.; Türk, N. Landslide susceptibility mapping for Ayvalik (Western Turkey) and its vicinity by multicriteria decision analysis. Environ. Earth Sci. 2010, 61, 595–611. [Google Scholar] [CrossRef]
  72. Liu, J.G.; Mason, P.J.; Hilton, F.; Lee, H. Detection of rapid erosion in SE Spain: A GIS approach based on ERS SAR coherence imagery: InSAR Application. Photogramm. Eng. Remote Sens. 2004, 70, 1179–1185. [Google Scholar] [CrossRef]
  73. Mason, P.J.; Rosenbaum, M. Geohazard mapping for predicting landslides: An example from the Langhe Hills in Piemonte, NW Italy. Q. J. Eng. Geol. Hydrogeol. 2002, 35, 317–326. [Google Scholar] [CrossRef]
  74. Gemitzi, A.; Petalas, C.; Tsihrintzis, V.A.; Pisinaras, V. Assessment of groundwater vulnerability to pollution: A combination of GIS, fuzzy logic and decision making techniques. Environ. Geol. 2006, 49, 653–673. [Google Scholar] [CrossRef]
  75. Rojas-Mora, J.; Josselin, D.; Aryal, J.; Mangiavillano, A.; Ellerkamp, P. The weighted fuzzy barycenter: Definition and application to forest fire control in the PACA region. Int. J. Agric. Environ. Inf. Syst. 2013, 4, 48–67. [Google Scholar] [CrossRef]
  76. Eastman, J.R. IDRISI Kilimanjaro: Guide to GIS and Image Processing; Clark University: Worcester, MA, USA, 2003. [Google Scholar]
  77. Galang, J.S. A Comparison of GIS Approaches to Slope Instability Zonation in the Central Blue Ridge Mountains of Virginia. Master‘s Thesis, Virginia Polytechnic Institute and State University, Blacksburg, VA, USA, 21 December 2004. [Google Scholar]
  78. Fawcett, T. An introduction to ROC analysis. Pattern Recognit. Lett. 2006, 27, 861–874. [Google Scholar] [CrossRef]
  79. Stein, A.; Aryal, J.; Gort, G. Use of the Bradley-Terry model to quantify association in remotely sensed images. IEEE Trans. Geosci. Remote Sens. 2005, 43, 852–856. [Google Scholar] [CrossRef]
  80. Lerner, J.S.; Li, Y.; Valdesolo, P.; Kassam, K.S. Emotion and decision making. Annu. Rev. Psychol. 2015, 66, 799–823. [Google Scholar] [CrossRef] [PubMed]
  81. Castellan, N.J. Individual and Group Decision Making: Current Issues; Psychology Press: Hove, UK, 2013. [Google Scholar]
  82. Wang, C.; Shen, H.-W. Information theory in scientific visualization. Entropy 2011, 13, 254–273. [Google Scholar] [CrossRef]
Figure 1. Location map of the study area.
Entropy 18 00343 g001
Figure 2. Nine applied criteria used in LSM of Izeh involving: (a) Slope; (b) Aspect; (c) Distance to river; (d) Drainage Density; (e) Distance to faults; (f) Mean annual rainfall; (g) Distance to roads; (h) Lithology and (i) Land use/cover.
Entropy 18 00343 g002
Figure 3. Schematic representation of the 3-steps methodology implementation.
Entropy 18 00343 g003
Figure 4. All types of used membership functions including: (Type I) User defined FMF (for: (a) slope and (b) aspect), (Type II) Sigmoidal FMF including both monotonically decreasing (for: (c) distance to river, distance to faults and distance to road) and monotonically increasing (for: (d) drainage density and mean annual rainfall) and (Type III) Crisp MF (for: (e) lithology and (f) land use).
Entropy 18 00343 g004
Figure 5. Obtained output after applying selected membership functions (i.e., Fuzzy or crisp) on each related parameter: (a) Slope; (b) Aspect; (c) Distance to river; (d) Drainage Density; (e) Distance to faults; (f) Mean annual rainfall; (g) Distance to roads; (h) Lithology and (i) Land use.
Entropy 18 00343 g005aEntropy 18 00343 g005b
Figure 6. Final susceptibility map using the proposed hybrid GIS-based method. A, B and C circles are only for better representation of contiguous landslide points density and positions within the study area.
Entropy 18 00343 g006
Figure 7. ROC curve for the proposed Landslide Susceptibility Map (LSM) of fuzzy Shannon entropy.
Entropy 18 00343 g007
Figure 8. Histogram of calculated landslide susceptibility map showing the relative areas for each susceptibility class (susceptibility classes are labelled with the numbers of the observed landslide points accordingly).
Entropy 18 00343 g008
Figure 9. Histogram of estimated data driven (objective) and experts driven (subjective) landslide casual criteria weights for selected landslide criteria.
Entropy 18 00343 g009
Table 1. Selected landslide related criteria on the basis of literature review.
CriteriaData SourceFormer Studies Using the Same Criterion for GIS-Based LSM
Slope30 m, STRM DEMLee and Min [21]; Komac [46]; Ayalew et al. [14]; Conoscenti et al. [47]; Thiery et al. [48]; Yalcin [15]; Kayastha et al. [49]; Bennett et al. [50]; Kritikos et al. [51]
Aspect30 m, STRM DEMAyalew and Yamagishi [52]; Komac [46]; Guzzetti et al. [53]; Thiery et al. [48]; Yalcin [15]; Lotfi et al. [54]
River1:50,000, Topo-mapYalcin [15]; Feizizadeh et al. [44]; Faraji Sabokbar et al. [55]
Drainage1:50,000, Topo-mapYalcin [15]; Pareek et al. [56]; Shadman et al. [17]; Feizizadeh et al. [44]
Fault1:100,000, Geo-mapHavenith et al. [22]; Kanungo et al. [57]; Lee and Pradhan [58]; Marjanović et al. [59]; Shahabi et al. [60]
Rainfall30 years, IMO dataHong et al. [61]; Guzzetti et al. [62]; Feizizadeh et al. [44]
Road1:50,000, Topo-mapAyalew and Yamagishi [52]; Yalcin [15]; Youssef et al. [63]; Bathrellos et al. [64]; Pradhan [31]
Lithology1:100,000, Geo-mapErcanoglu and Gokceoglu [3]; Ayalew and Yamagishi [52]; Thiery et al. [48]; Akgun et al. [65]; Davis and Blesius [43]
Land use30 m, Landsat imageLee and Pradhan [58]; Bathrellos et al. [64]; Feizizadeh et al. [44]
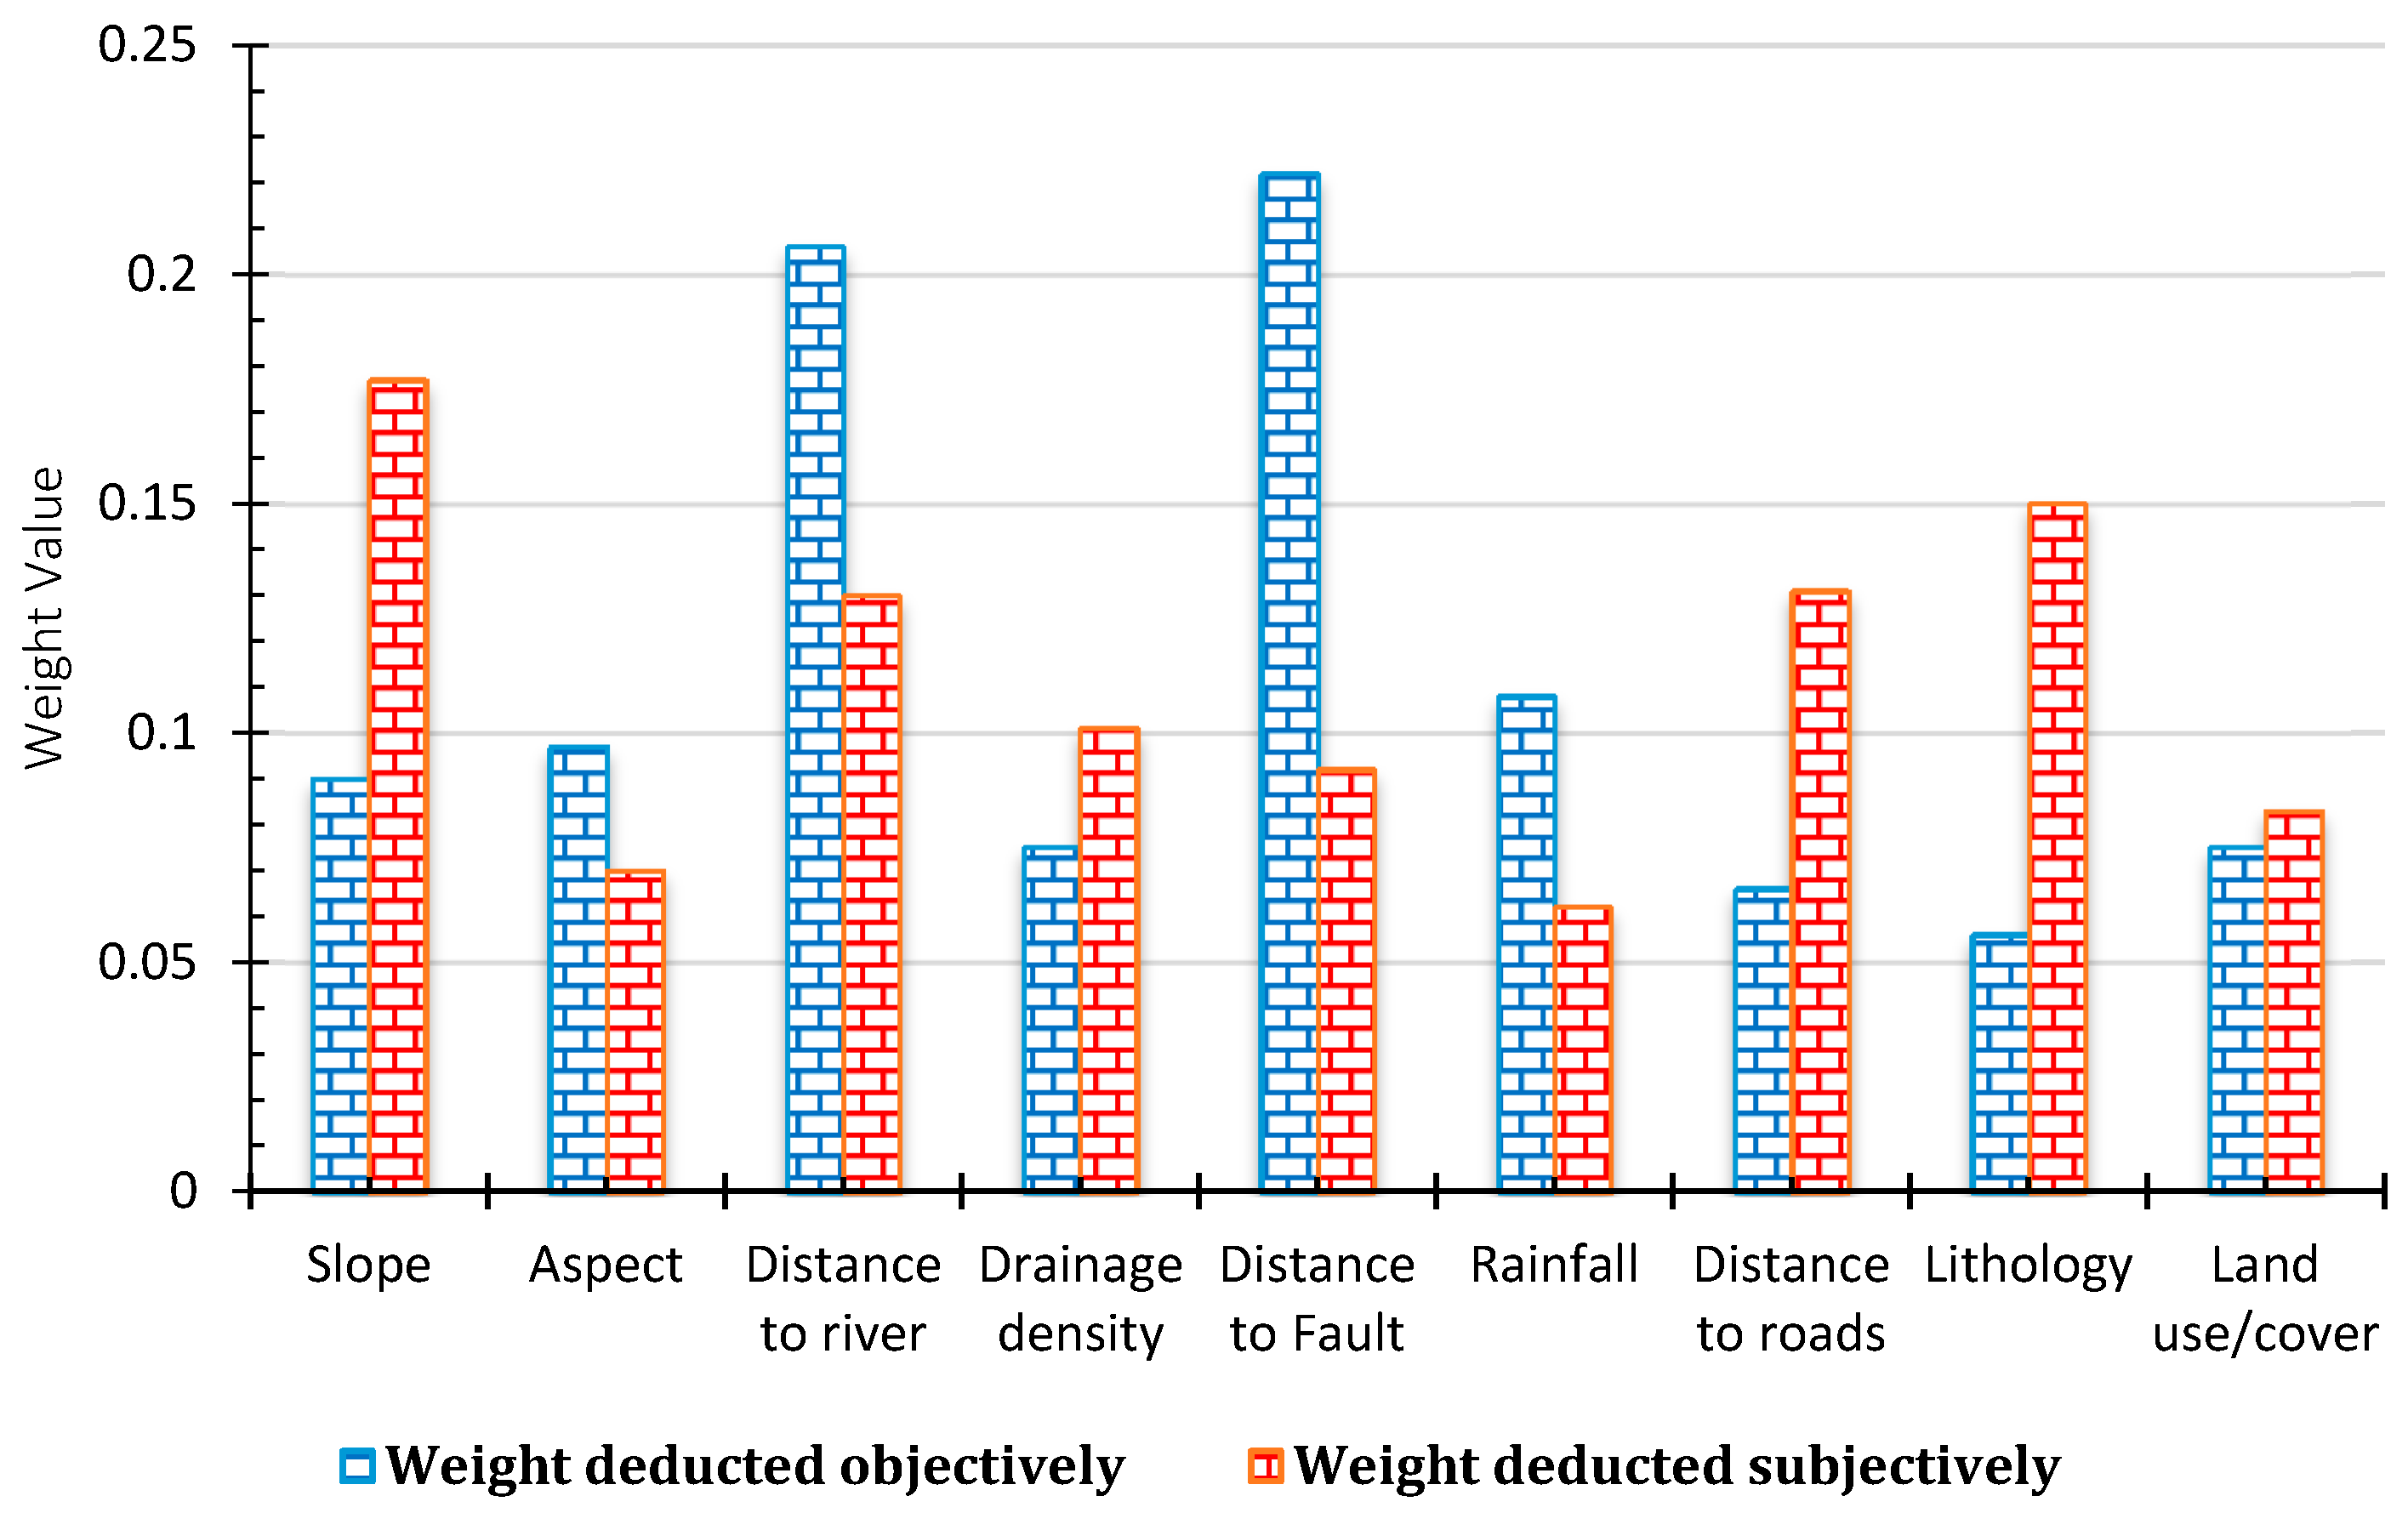
Table 2. The calculated weight vector from Shannon entropy method.
CriteriaWeight
Slope0.090
Aspect0.097
Distance to river0.206
Drainage density0.075
Distance to Fault0.222
Rainfall0.108
Distance to roads0.066
Lithology0.056
Land use/cover0.075
Table 3. Accuracy metrics of implemented data-driven (objective) and expert-driven (subjective) LSMs using fuzzy Shannon entropy and extended fuzzy multi-criteria evaluation methods, respectively.
MetricObjective Weighting ApproachSubjective Weighting Approach
Number of Cases64212
Number Correct56 (76% of total)173 (81% of total)
AUC0.930.89
Std. Dev. (Area)0.010.02
Accuracy76.6%81.6%
Sensitivity100.0%98.1%
Specificity53.1%65.1%
Pos Cases Missed02
Neg Cases Missed1537

