Article

Maximum Entropy Method for Operational Loads Feedback Using Concrete Dam Displacement

1
College of Water-Conservancy and Hydropower Engineering, Hohai University, Nanjing 210098, China
2
State Key Laboratory of Hydrology-Water Resources and Hydraulic Engineering, Hohai University, Nanjing 210098, China
3
National Engineering Research Center of Water Resources Efficient Utilization and Engineering Safety, Hohai University, Nanjing 210098, China
*
Author to whom correspondence should be addressed.
Entropy 2015, 17(5), 2958-2972; https://doi.org/10.3390/e17052958
Submission received: 7 February 2015 / Revised: 28 April 2015 / Accepted: 29 April 2015 / Published: 8 May 2015

Abstract

:
Safety control of concrete dams is required due to the potential great loss of life and property in case of dam failure. The purpose of this paper is to feed back the operational control loads for concrete dam displacement using the maximum entropy method. The proposed method is not aimed at a judgement about the safety conditions of the dam. When a strong trend-line effect is evident, the method should be carefully applied. In these cases, the hydrostatic and temperature effects are added to the irreversible displacements, thus maximum operational loads should be accordingly reduced. The probability density function for the extreme load effect component of dam displacement can be selected by employing the principle of maximum entropy, which is effective to construct the least subjective probability density distribution merely given the moments information from the stated data. The critical load effect component in the warning criterion can be determined through the corresponding cumulative distribution function obtained by the maximum entropy method. Then the control loads feedback of concrete dam displacement is realized by the proposed warning criterion. The proposed method is applied to a concrete dam. A comparison of the results shows that the maximum entropy method can feed back rational control loads for the dam displacement. The control loads diagram obtained can be a straightforward and visual tool to the operation and management department of the concrete dam. The result from the proposed method is recommended to be used due to minimal subjectivity.

1. Introduction

Safety control of concrete dams is important because a dam failure can cause a great loss of life and property downstream [1,2]. Observations from concrete dams are reliable in the operational control because they are the most direct reflections of the dam behavior. Displacement has been regarded as one of the most important monitoring items for dam safety, and an interpretation model of dam displacement has been established to explain and predict this feature. The practical interpretation model of a concrete dam can be obtained by inputting the observations (environmental loads and displacements) into the theoretical model. The model establishes the relationship between the environmental loads and the corresponding displacements. Adverse combinations of environmental loads contribute enormously to extreme displacements which may indicate a warning about the state of the dam. Critical control loads can be fed back to the operation and management department by analyzing the practical interpretation model and the operation situation of the dam. Then actual operational control can be performed by dam operators.
In recent decades, dam displacement analysis has concentrated on the interpretation, prediction and safety monitoring index determination [38]. Other research on feedback analysis of operation and control loads based on displacement observations is a rare occurrence. However, operational control loads are significant for the management of concrete dams. When acquainted with the control loads, the relevant staff will be reminded to adjust the operation plan when the environmental loads are close to the critical control loads.
Operation and control loads feedback for the crack deformation in concrete dams has been analyzed in several references [911]. Gu et al. [9] put forward the feedback analysis method of operation and control loads for concrete dams with cracks and derived the control loads formula. Li et al. [10] applied the Kolmogorov–Smirnov (K–S) test method to find the probability density functions of stress intensity factors based on which the fracture toughness of concrete dams was inverted to carry out the control loads feedback for the crack deformation. Lei et al. [11] also applied the Kolmogorov–Smirnov test method to invert the fracture toughness which is used to determine the control loads for crack deformation.
In statistics, the Kolmogorov–Smirnov test is a nonparametric test of the equality of continuous, one-dimensional probability distributions that can be used to compare a sample with a reference probability distribution. The Kolmogorov–Smirnov statistic quantifies a distance between the empirical distribution function of the sample and the cumulative distribution function of the reference distribution. The null distribution of this statistic is calculated under the null hypothesis that the sample is drawn from the reference distribution. The null distribution is accepted for the sample if the statistic converges to zero. Therefore, Kolmogorov–Smirnov test has a high subjective content.
Compared with the Kolmogorov–Smirnov test, the maximum entropy method (MEM) [1214] selects the least subjective probability density function (PDF) which maximizes the entropy subject to the moment constraints. The rationale of this approach is that only the moment constraints from the stated prior data are considered. It is based on Shannon’s measure of uncertainty and has been used for estimating distribution functions. In recent years, The maximum entropy method has achieved good performances in the structural reliability analysis [15,16], the geotechnical engineering back analysis [17], the probability distribution of rock mechanics parameters [18] and many other fields [1922].
In this study, the maximum entropy method is used to approximate the probability density function for the extreme load effect component of dam displacement. The critical load effect component is determined by taking a certain exceedance probability in the cumulative distribution function (CDF) obtained by the proposed method. The rationale of this approach is that the PDF maximizing entropy is the least subjective PDF subject to the moment information.
The remainder of this paper is organized as follows: in Section 2, an interpretation model of concrete dam displacement is presented. In Section 3, we outline the maximum entropy method for selecting the approximate density distribution function of the extreme load effect component from knowledge of moments. The critical load effect component in the warning criterion is determined by the corresponding cumulative distribution function and then the control loads feedback for dam displacement is realized by the proposed warning criterion. A numerical example is analyzed using the proposed method and the corresponding results are discussed in Section 4. Finally, some conclusions are given in Section 5.

2. Interpretation Model of Concrete Dam Displacement

Concrete dam displacement is the result of many effects, including environmental factors, hydraulic factors and geological factors. In the displacement interpretation model which has been applied in practice successfully, dam displacement can be approximated by the sum of three components which are a hydrostatic pressure component, a temperature component and a time effect component, respectively [3,5]:
δ = δ ( H ) + δ ( T ) + δ ( t ) + ε
where δ is the observed dam displacement, δ(H) is the dam displacement caused by the hydrostatic pressure factor, δ(T) is the dam displacement caused by the temperature factor, δ(t) is the component due to the time effect, and ε is the random error term.
The hydrostatic pressure component δ(H) is caused by the reservoir water pressure on the dam body and the foundation. Through engineering mechanics analysis, δ(H) is usually approximated by polynomials depending on the height H of the water in the reservoir:
δ ( H ) = i = 1 4 a i H i
where ai is the corresponding coefficient.
The temperature component δ(T) of dam displacement is mainly caused by the temperature variation of the dam concrete and bedrock. Thermometer measurements of dam concrete and bedrock can be selected as factors in the temperature component. However, internal thermometers are normally not embedded in many dams during construction. Besides, dam temperature field is generally in the quasi-steady state after years of operation, so the temperature can be represented with a periodic function. Thus, the temperature component can be expressed as follows:
δ ( T ) = i = 1 2 ( b 1 i sin 2 π i t 365 + b 2 i cos 2 π i t 365 )
where t represents the cumulative number of days from the initial measured day to the day of observation; b1i and b2i are the regression coefficients corresponding to the temperature component. In the next Section 3, a different expression for the temperature displacement will be introduced, in order to correlate the measured temperature to the observed displacement.
The time effect displacement δ(t) varies dramatically during the initial water impoundment, and then gradually but steadily over time. Through the developing trend analysis of displacement observations and the remaining value δ − δ(H) − δ(T), the mathematic expression of the time effect component can be determined reasonably. For a concrete dam operating for years, the time effect component can be expressed as follows:
δ ( t ) = c 1 θ + c 2 ln θ
where θ = t/100, t has the same meaning with that in Equation (3); c1 and c2 are the corresponding coefficients.
Finally, with the initial reference observations into consideration, the dam displacement response in the interpretation model can be expressed by:
δ = a 0 + i = 1 4 a i ( H i H 0 i ) + i = 1 2 ( b 1 i ( sin 2 π i t 365 sin 2 π i t 0 365 ) + b 2 i ( cos 2 π i t 365 cos 2 π i t 0 365 ) ) + c 1 ( θ θ 0 ) + c 2 ( ln θ ln θ 0 ) + ε
where the subscript 0 denotes the initial reference day of the analysis sequence. The unknown coefficients can be determined by the least squares method.

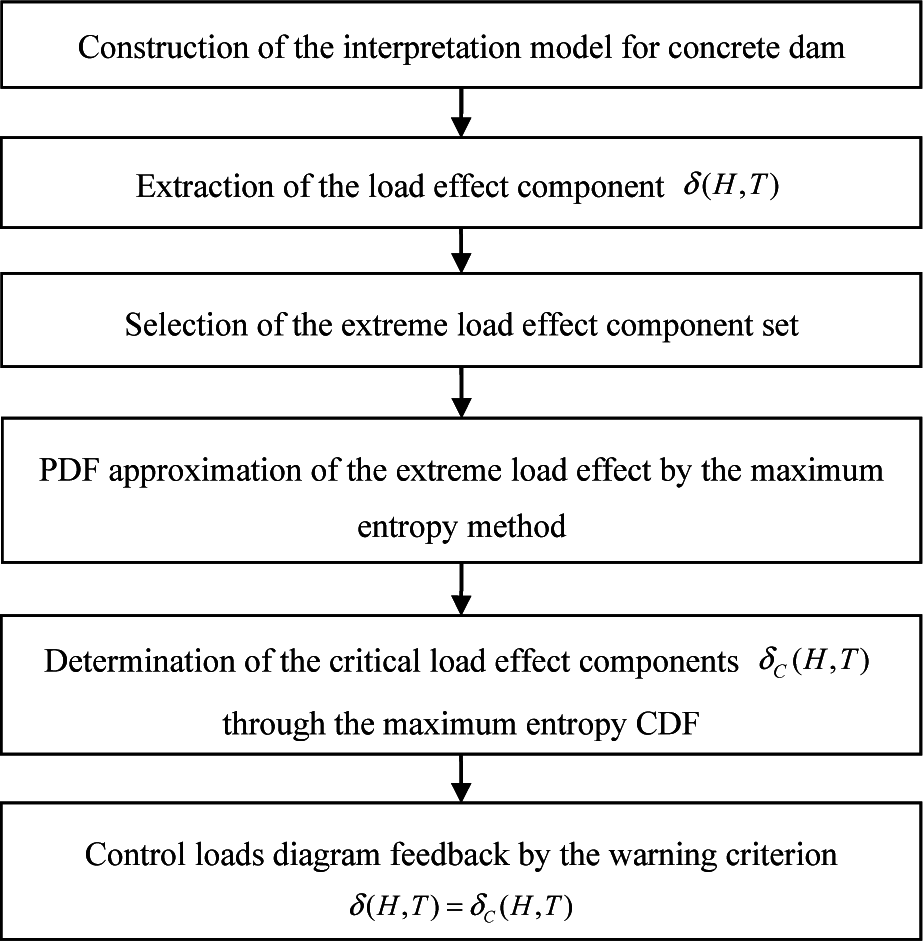
3. Maximum Entropy Method for the Control Loads Feedback

Here the maximum entropy method is used to approximate the PDF for the extreme load effect component of dam displacement. The load effect component is extracted from the dam displacement interpretation model. The critical load effect component is determined by taking a certain exceedance probability in the CDF obtained by the maximum entropy method. Ultimately, the proposed warning criterion is employed to get the control loads for dam displacement.

3.1. Warning Criterion for Dam Displacement

Displacements of concrete dams result from two effects: one of elastic nature (reversible and instantaneous) due to the variations of the hydrostatic pressure and the temperature and the other of inelastic nature (irreversible) such as a time effect. The time effect component of dam displacements comes from many aspects including long-term adverse loads, creep and plastic deformations of dam concrete, and self-grown volume deformations. The time effect component reflects much of the dam deformation trend, and it is caused primarily by the environmental loads acting on the dam. Here we focus on the load effect component which is the sum of the hydrostatic pressure component and the temperature component. When the load effect component exceeds a certain limit, the dam displacement will exceed its operational value which indicates the normal behavior of the dam. Herein, the certain limit is defined as the critical load effect component of the dam displacement. The proposed method is not aimed at a judgement about the safety conditions of the dam. When a strong trend-line effect is evident, the method should be carefully applied. In these cases, the hydrostatic and temperature effects are summed to the irreversible displacements, thus maximum operational loads should be accordingly reduced.
Generally, (+) signs in the dam displacement observations indicate displacements towards downstream and (‒) signs towards upstream. Excessive displacements towards downstream or upstream are both warning values for the operation of the dam. Thus, there are two critical load effect components of dam displacement which are for the maximum load effect components and for the minimum load effect components respectively. Then the warning criterion of dam displacement behavior is put forward as follows:
δ C min ( H , T ) < δ ( H , T ) < δ C max ( H , T ) , normal condition δ ( H , T ) = δ C min ( H , T ) or δ ( H , T ) = δ C max ( H , T ) , critical condition δ ( H , T ) < δ C min ( H , T ) or δ ( H , T ) > δ C max ( H , T ) , warning condition }
where δ C max ( H , T ) and δ C min ( H , T ) are two critical values for the maximum load effect components and the minimum load effect components respectively, δ(H,T) = δ (H) +δ(T).

3.2. Maximum Entropy Method for the Determination of Critical Load Effect Component

The principle of maximum entropy (PME) is applied to approximate the PDF for the extreme load effect component and further to determine the critical load effect component of dam displacement. The principle of maximum entropy was first expounded by E. T. Jaynes in 1957 [1214] where he emphasized a natural correspondence between statistical mechanics and information theory. The principle of maximum entropy states that, subject to precisely stated prior data, the probability distribution which best represents the current state of knowledge is the one with largest entropy. In ordinary language, the principle of maximum entropy can be said to express a claim of epistemic modesty, or of maximum ignorance. The selected distribution is the one that makes the least claim to being informed beyond the stated prior data, that is to say the one that admits the most ignorance beyond the stated prior data.
In 1948 Shannon defined entropy as a measure of uncertainty about a random variable. If the level of uncertainties decreases, then the entropy decreases. The maximum of uncertainty corresponds to the maximum of entropy. For continuous distributions of a random variable x, the simple definition of Shannon entropy H (x) is defined as:
H ( x ) = R f ( x ) ln f ( x ) d x
where f (x) is the probability density function of the random variable x and the extreme load effect component can be regarded as the random variable x here.
It is obvious that H (x) is a functional of f (x) and H (x) varies with f (x). Based on the principle of maximum entropy, the method of estimating f (x) is stated as follows:
max H ( x ) = R f ( x ) ln f ( x ) d x
with the constraints:
R f ( x ) d x = 1 ,
R x i f ( x ) d x = μ i , ( i = 1 , 2 , , N ) ,
where R is the domain of integration, μi(i =1,2,…, N) represents the i order origin moment. The first four order moments (N = 4) have been proved to be sufficient to describe a wide range of distribution types in many studies and will be used in the numerical example part.
Lagrange multiplier method is applied to solve the above problem with constraints and the corresponding Lagrange function is constructed as follows:
L = H ( x ) + ( λ 0 + 1 ) [ R f ( x ) d x 1 ] + i = 1 N λ i [ R x i f ( x ) d x μ i ]
Letting ∂L / ∂f (x) = 0 leads to the analytical form of f (x):
f ( x ) = exp ( λ 0 + i = 1 N λ i x i )
It can be seen from Equation (12) that, the solution of maximum entropy probability density function comes down to the determination of Lagrange multipliers (λ0,λ1,λ2,…,λN).
Substituting Equation (12) into Equation (9), one has:
R exp ( λ 0 + i = 1 N λ i x i ) d x = 1
which leads to the following expression:
λ 0 = ln ( R exp ( i = 1 N λ i x i ) d x )
Substituting Equation (12) into Equation (10) results in the following equation:
R x i exp ( λ 0 + j = 1 N λ j x j ) d x = μ i
into which Equation (14) can be substituted to get the following equation:
R x i exp ( j = 1 N λ j x j ) d x R exp ( j = 1 N λ j x j ) d x = μ i
For a more convenient numerical calculation, Equation (16) is transformed as follows:
r i = 1 R x i exp ( j = 1 N λ j x j ) d x μ i R exp ( j = 1 N λ j x j ) d x
where ri are the residuals that are reduced to be near zero by a numerical technique. A solution of Lagrange multipliers (λ1,λ2,…,λN) can be obtained by using nonlinear programming in which the sum of squared residuals r converges to a minimum:
r = i = 1 N r i 2 min
Convergence is achieved when r < ω or ri < ω, where ω is the specified acceptable error. Then λ0 can be obtained by substituting Lagrange multipliers (λ1,λ2,…,λN) into Equation (14). Finally, the maximum entropy probability density function f (x) of the random variable x can be generated by Equation (12).
To determine the two critical values δ C max ( H , T ) and δ C min ( H , T ), the annual maximum and minimum values of dam displacement during operation are selected to extract the maximum and minimum load effect component sets by the interpretation model. The annual maximum and minimum values of dam displacement are random variables and so are the maximum and minimum load effect components. Here for the concise expression, (H,T)is omitted in the following equations. Therefore, the corresponding maximum entropy PDF fmax (δ) of the maximum effect load component and fmin (δ) of the minimum one are approximated by the maximum entropy method and then the maximum entropy cumulative distribution functions (CDF) are given.
When the load effect component of dam displacement exceeds δ C max or δ C min, the dam will be in a warning situation and the corresponding exceedance or non-exceedance probability can be determined by the following equations:
P ( δ > δ C max ) = α = δ C max f max ( δ ) d δ
P ( δ < δ C min ) = α = δ C min f min ( δ ) d δ
Thereby, with the significance level α according to the engineering practice given, the corresponding critical load effect components δ C max and δ C min can be derived.

3.3. Control Loads Feedback for Dam Displacement

The proposed warning criterion for concrete dams requires the observations to judge whether the dam is in a warning condition, which is essentially an a posteriori method. However, being acquainted with those environmental load combinations contributing enormously to maximum or minimum displacements in advance is more significant for the operational management of concrete dams.
The expression δ (H,T) = δ (H) +δ (T) for the load effect component of dam displacement can be obtained by the interpretation model. As previously written, in the present application the trend-line term in Equation (1) has been considered as negligible. When this term significantly contributes to the crest displacement, the proposed warning criterion should be carefully revised. The temperature component δ (T) is represented with a periodic function in the interpretation model. To feedback the control loads for dam displacement, the linear fitting between δ (T) and the air temperature T is carried out with δ (T) = b1(TT0) where b1 is the corresponding fitting coefficient. According to δ ( H , T ) = i = 1 4 a i ( H i H 0 i ) + b 1 ( T T 0 ), the three-dimension surface for the load effect component of dam displacement can be given. Then the proposed warning criterion for dam displacement can be employed to derive the critical control loads ( H , T ) C max and ( H , T ) C min by letting δ ( H , T ) = δ C max and δ ( H , T ) = δ C min, and the two critical control loads lines Γ C max and Γ C min can be plotted, see Figure 6 in the next part. Between the two critical lines Γ C max and Γ C min lies the normal loads domain ΩN (H,T) and the rest is the warning loads domain ΩW (H,T) for the dam displacement. The control loads diagram can be a straightforward and visual tool to the operation and management department of the concrete dam. The flowchart for the control loads feedback of dam displacement is presented in Figure 1.

4. Numerical Example

The radial displacement of a gravity arch dam crest is analyzed by the maximum entropy method. This dam is a concrete gravity arch dam having a concentric circle with variable radii located in East China. The construction of the dam began in August 1958 and the entire construction took 12 years. The Silurian quartz sandstones are interbedded with sandy shales in the dam foundation. Because some faults and interlaminar dislocation fissure zones crisscross in the foundation, a part of the rock has broken after several tectonic movements. The dam crest elevation is 126.3 m, its maximum height is 76.3 m, and it consists of 28 sections from left to right. The minimum reservoir water level for hydropower operation is 101 m and the maximum reservoir water level is 119 m, with a total capacity of 2.825 × 10⁹ m3. The radial displacement observations were obtained from pendulums buried in the dam. The 18# arch crown beam cross-section of the dam with the layout of the pendulums is exhibited in Figure 2. The radial displacements of the dam crest in block 18# from January 3, 1972 to December 31, 2012 were analyzed. The observations of the reservoir water level, air temperature and the radial displacement are shown in Figure 3.

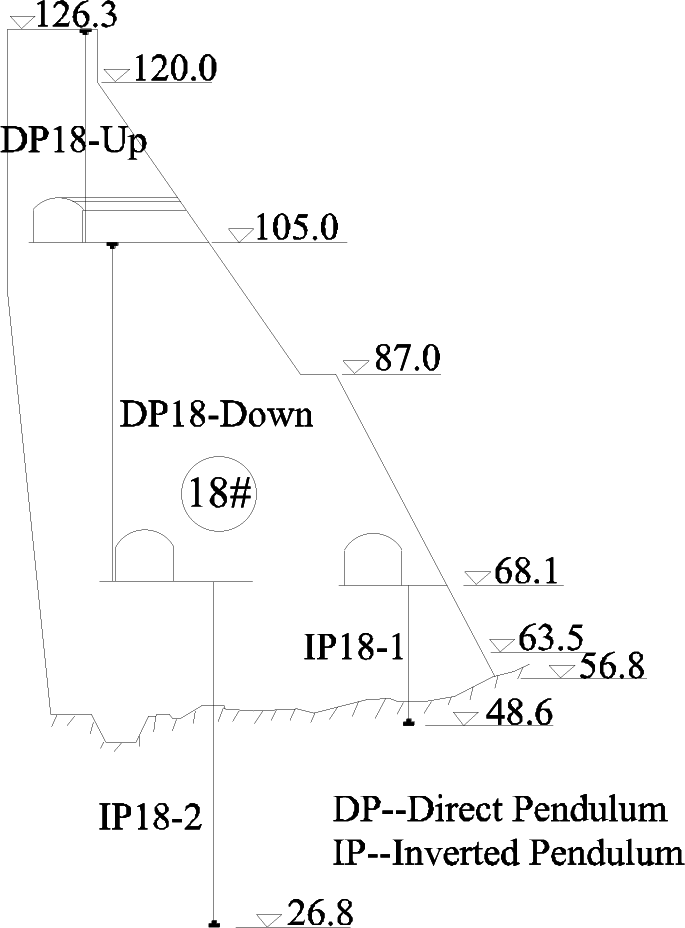
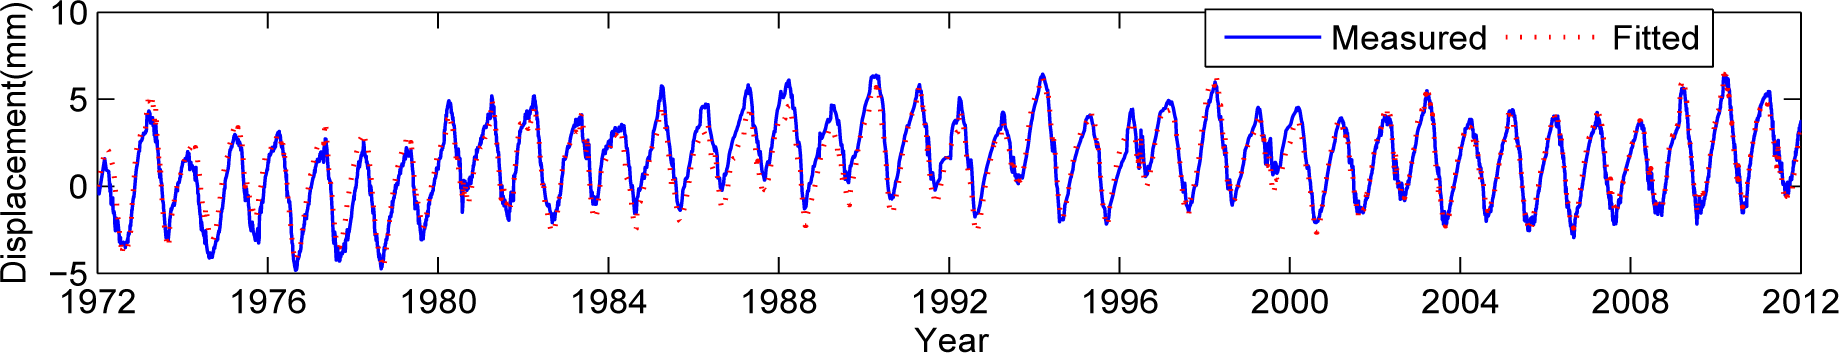
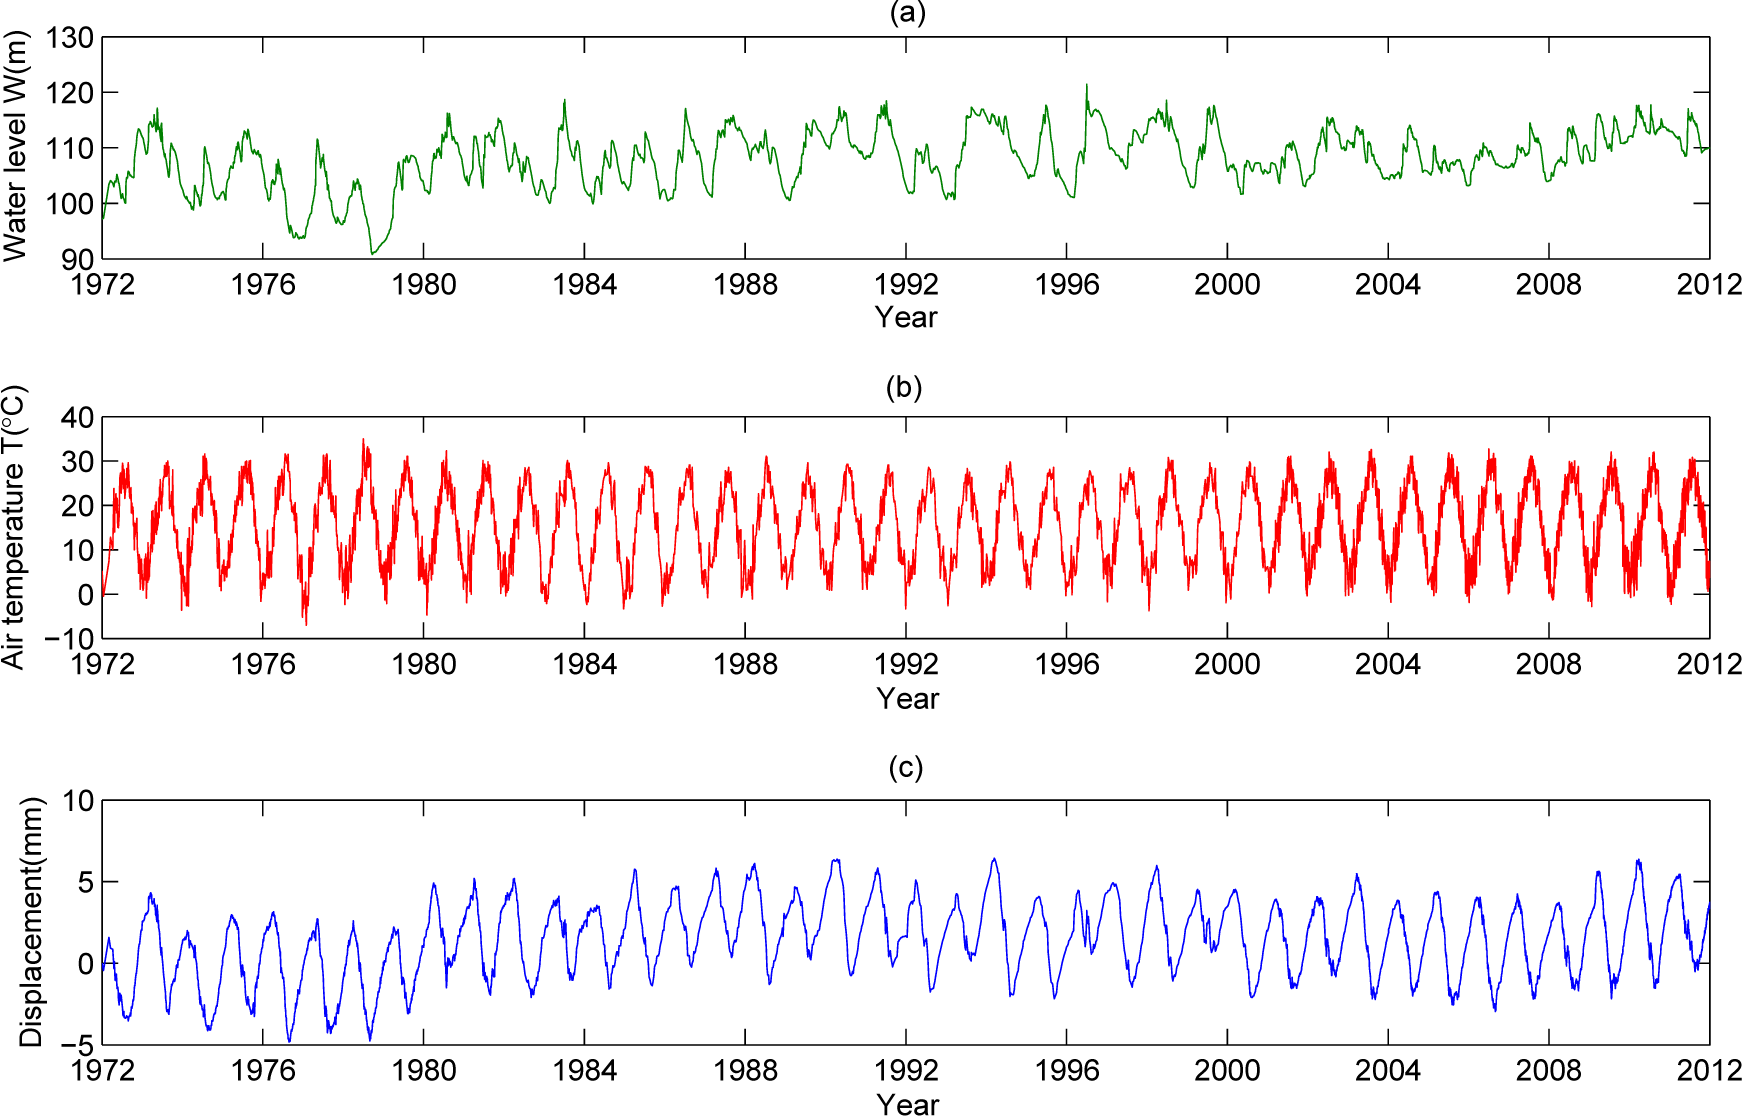
4.1. Interpretation Model of Dam Displacement

The interpretation model for the dam displacement response has been presented in Equation (5). The unknown coefficients were obtained by using the least squares minimum method, see Table 1. R and S are the multiple correlation coefficient and the standard deviation, respectively, representing the goodness of fit between the measured displacement and the model-fitted one. A larger multiple correlation coefficient indicates a better fit effect, and a smaller standard deviation represents a better fit effect. Figure 4 shows the comparison between the measured displacement curve and the fitted one obtained by the interpretation model. The multiple correlation coefficient R is 0.964 and the standard deviation S is 0.54 mm, which both indicate that the interpretation model has a good fit effect.

4.2. Determination of the Critical Load Effect Component by the Maximum Entropy Method

To determine the two critical values δ C max and δ C min, the annual extreme values of dam displacements from 1972 to 2012 were selected to extract the extreme load effect component sets by the interpretation model. Table 2 presents the results of the first four moments for the extreme load effect component sets of dam displacement.
The first four moments obtained were substituted into Equation (17) and the nonlinear least squares method was employed to get a solution of the Lagrange multipliers (λ1,λ2,…,λ4). Then λ0 was obtained by substituting Lagrange multipliers (λ1,λ2,…,λ4) into Equation (14). These Lagrange multipliers are presented in Table 3.
Therefore, the corresponding maximum entropy PDF fmax (δ) of the maximum load component and fmin (δ) of the minimum load component can be approximated as follows:
f max ( δ ) = exp ( 2 × 10 8 δ 4 + 9.96 × 10 4 δ 3 + 0.3847 δ 2 + 2.4622 δ 4.9896 )
f min ( δ ) = exp ( 2 × 10 8 δ 4 + 9.86 × 10 4 δ 3 0.3591 δ 2 2.1545 δ 4.3163 )
When the load effect component of dam displacement exceeds δ C max or δ C min, the dam will be in a warning situation and the corresponding exceedance or non-exceedance probability can be determined by the following equations:
P ( δ > δ C max ) = α = δ C max exp ( 2 × 10 8 δ 4 + 9.96 × 10 4 δ 3 + 0.3847 δ 2 + 2.4622 δ 4.9896 ) d δ
P ( δ < δ C min ) = α = δ C min exp ( 2 × 10 8 δ 4 + 9.86 × 10 4 δ 3 0.3591 δ 2 2.1545 δ 4.3163 ) d δ
Herein, the significance level α has been assumed as 0.05 according to an expert judgement about the actual situation of the dam. Then the corresponding critical load effect components δ C max and δ C min can be derived: δ C max = 5.90 mm, δ C min = 4.85 mm.
Table 4 shows the results obtained from the Kolmogorov–Smirnov method and the proposed method. The result obtained by the proposed method is close to that by the Kolmogorov–Smirnov method. However, the Kolmogorov–Smirnov method compares the sample with a reference probability distribution, so it has a high subjective content. Compared with the Kolmogorov–Smirnov method, the maximum entropy method merely considers the moment constraints from the stated prior data. Therefore, the result from the proposed method is more rational and is recommended to be used.

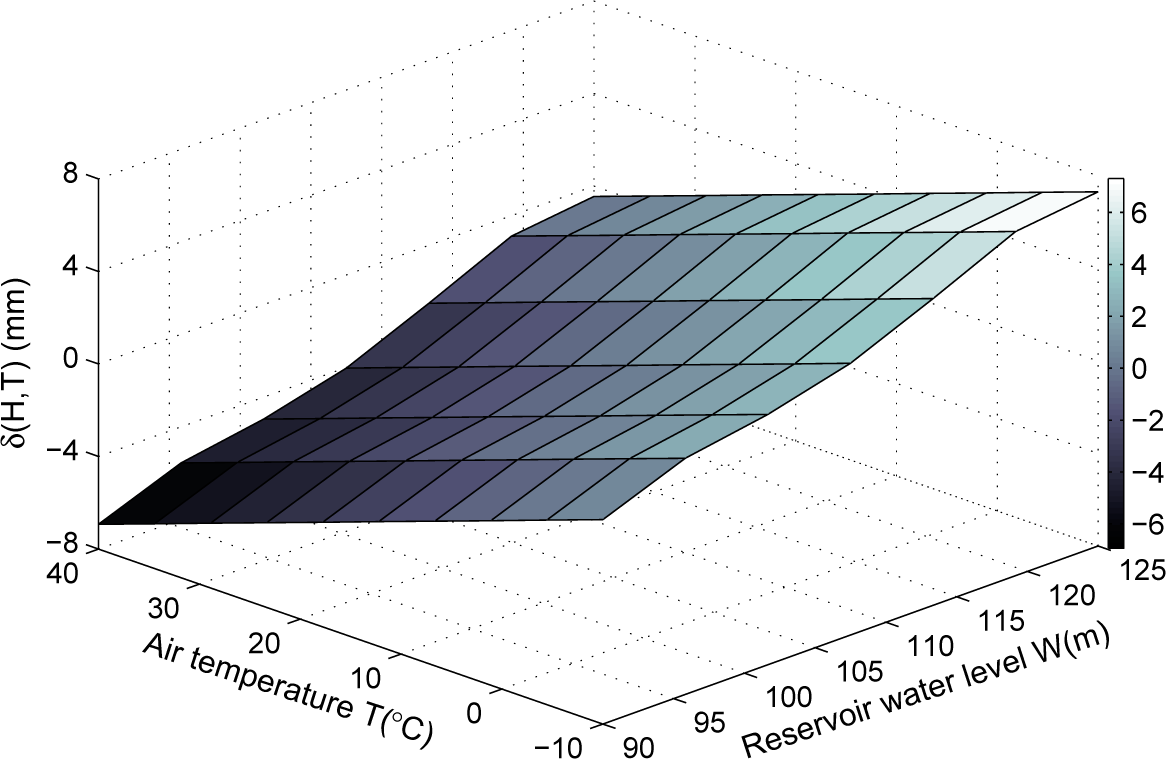
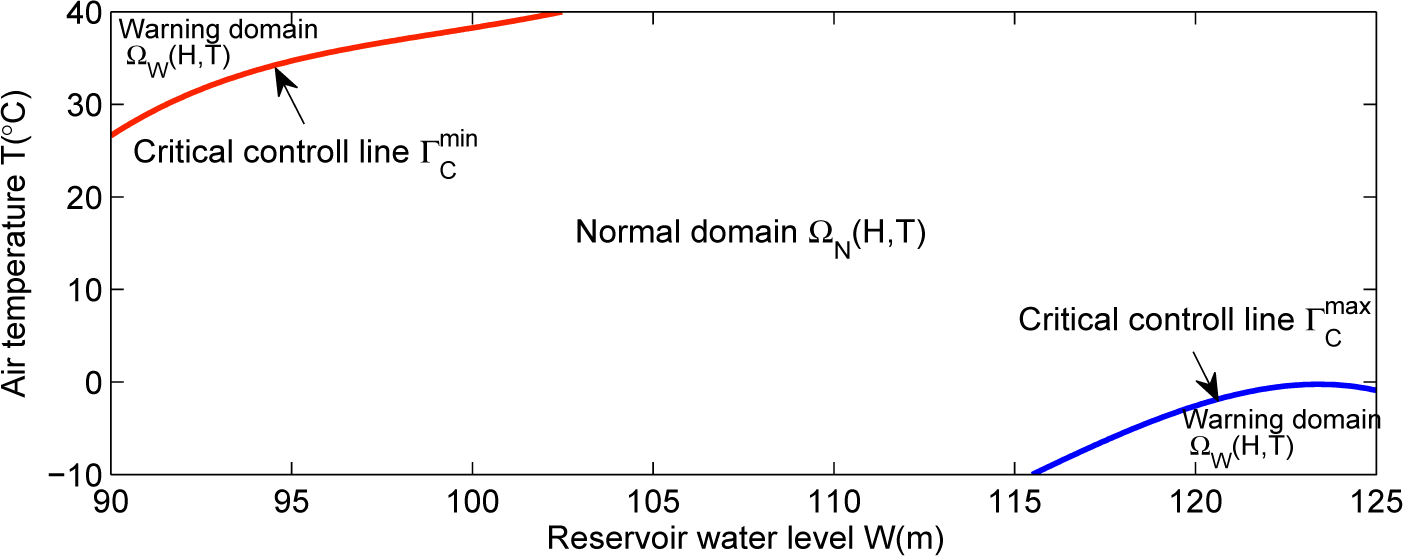
4.3. Control Loads Feedback for Dam Displacement

The expression δ (H,T) =δ (H) +δ (T) for the load effect component of dam displacement has been obtained by the interpretation model. The temperature component δ (T) is represented with a periodic function in the interpretation model. To feedback the control loads for dam displacement, the linear fitting between δ (T) and the air temperature T was carried out with δ (T) = b1(TT0) and b1 = −0.155 was obtained. According to δ ( H , T ) = i = 1 4 a i ( H i H 0 i ) + b 1 ( T T 0 ), the three-dimension surface for the load effect component of dam displacement was given and is shown in Figure 5. Here in Figure 5 and Figure 6, the water height H is replaced by the reservoir water level W with H = W − 50 m where 50 m is the dam foundation elevation.
The critical control loads ( H , T ) C max and ( H , T ) C min were derived by letting δ ( H , T ) = δ C max and δ ( H , T ) = δ C min in the proposed warning criterion:
a 1 ( H H 0 ) + a 2 ( H 2 H 0 2 ) + a 3 ( H 3 H 0 3 ) + a 4 ( H 4 H 0 4 ) + b 1 ( T T 0 ) = 5.90
a 1 ( H H 0 ) + a 2 ( H 2 H 0 2 ) + a 3 ( H 3 H 0 3 ) + a 4 ( H 4 H 0 4 ) + b 1 ( T T 0 ) = 4.85
Two critical control loads lines Γ C max and Γ C min were plotted according to Equations (25) and (26), see Figure 6. Between the two critical lines Γ C max and Γ C min is the normal loads domain ΩN (H,T) and the rest is the warning loads domain ΩW (H,T) for the dam displacement. It can be seen from the control load diagram (Figure 6) that: (i) when the air temperature is high in summer, it is not recommended that the reservoir water level be maintained in a low level; (ii) when air temperature is low in winter, it is not recommended that the reservoir water level be maintained in a high level. The control loads diagram can be a straightforward and visual tool for the operation and management department of the concrete dam.

5. Conclusions

This paper presents a maximum entropy method to feed back the operational control loads of concrete dam displacement. The practical interpretation model of the displacement establishes the relationship between the environmental loads and the displacement response. The load effect component of the displacement is extracted from the model. The PDF for the extreme load effect component of dam displacement is selected using the principle of maximum entropy, which is effective to construct the least subjective probability density distribution given a finite number of moments. The critical load effect components in the warning criterion are determined through taking a certain exceedance or non-exceedance probability in the cumulative distribution functions obtained by the maximum entropy method. The control loads feedback of concrete dam displacement is realized by the proposed warning criterion. The usefulness of this method is demonstrated by using a numerical example. Numerical results show that maximum entropy method can feed back rational control loads for the dam displacement. A comparison of the results from the proposed method and the Kolmogorov–Smirnov method confirms the accuracy of the proposed method. The result from the proposed method is recommended to be used due to its least subjectivity. The actual control loads diagram obtained from the observations of the concrete dam can be a straightforward and visual tool for the operation and management departments of concrete dams. However, a sound structural mechanics analysis about the dam behavior is not considered in this paper. Further research will be directed towards the structural considerations to make the actual safety control more rational.

Acknowledgments

This work was supported by the National Natural Science Foundation of China (Grant Nos. 41323001, 51139001, 51379068, 51179066, 51279052, 51209077), Research Fund for the Doctoral Program of Higher Education of China (Grant No. 20120094110005, 20120094130003, 20130094110010), the Program for New Century Excellent Talents in University (Grant no.NCET-11-0628), and the Ministry of Water Resources Public Welfare Industry Research Special Fund Project (Grant Nos. 201201038, 201301061).

Author Contributions

Jingmei Zhang designed the research, analyzed the data, drafted the article and revised the manuscript. Chongshi Gu revised the manuscript. Both authors have read and approved the final manuscript.

Conflicts of Interest

The authors declare no conflict of interest.

References

  1. ICOLD, World Register of Dams; International Commission on Large Dams: Paris, France, 1988.
  2. ICOLD, Automated Observation for the Safety Control of Dams; International Commission on Large Dams: Paris, France, 1982.
  3. Wu, Z.R.; Gu, C.S. Safety Monitoring Theories of Hydraulic Structures and Their Application; Higher Education Process: Beijing, China, 2003; in Chinese. [Google Scholar]
  4. Rocha, M. A quantitative method for the interpretation of the results of the observation of dams. Proceedings of VI Congress on Large Dams, New York, NY, USA; 1958. [Google Scholar]
  5. Pierre, L.; Martin, L. Hydrostatic, temperature, time-displacement model for concrete dams. J. Eng. Mech 2007, 133, 267–277. [Google Scholar]
  6. De Sortis, A.; Paoliani, P. Statistical analysis and structural identification in concrete dam monitoring. Eng. Struct 2007, 29, 110–120. [Google Scholar]
  7. Mata, J.; de Castro, A.T.; da Costa, J.S. Constructing statistical models for arch dam deformation. Struct. Control Health. Monit 2014, 21, 423–437. [Google Scholar]
  8. Mata, J. Interpretation of concrete dam behaviour with artificial neural network and multiple linear regression models. Eng. Struct 2011, 33, 903–910. [Google Scholar]
  9. Gu, C.S.; Sha, Y.C. Feedback analysis method of operation and control load conditions of the dam with slot. Water Power 2002, 30–32, in Chinese. [Google Scholar]
  10. Li, X.H. Evolution rule and abnormality diagnosis of crack of important hydraulic concrete structure. In Ph.D. Thesis; Hohai University: Nanjing, China, 2003; in Chinese. [Google Scholar]
  11. Lei, P.; Xiao, F.; Su, H.Z. Analysis of control loads on concrete dam during operation. Water Resour. Hydropower Eng 2011, 42, 8–11, in Chinese. [Google Scholar]
  12. Jaynes, E.T. Information theory and statistical mechanics. Phys. Rev 1957, 106, 620–630. [Google Scholar]
  13. Jaynes, E.T. Information theory and statistical mechanics II. Phys. Rev 1957, 108, 171–190. [Google Scholar]
  14. Jaynes, E.T. On the rationale of maximum entropy methods. Proc. IEEE 1982, 70, 939–952. [Google Scholar]
  15. Zhang, G.; Zhu, W.S.; Bai, S.W. A method of maximum entropy density function calculations of approximate failure probability. Chin. J. Rock Mech. Eng 1995, 14, 119–129, in Chinese. [Google Scholar]
  16. Zhou, C.X.; Shen, X.D.; Wang, L.P.; Wang, H.L. The principle of maximum entropy in analysis of hydraulic construction reliability. J. Fuzhou Univ 2005, 115–118, in Chinese. [Google Scholar]
  17. Chen, B.; Liu, N.; Zhou, J.S. Principle of maximum entropy for back analysis in geotechnical engineering. J. Hohai Univ 2002, 30, 52–55, in Chinese. [Google Scholar]
  18. Deng, J.; Li, X.B. Probability distribution of rock mechanics parameters by using maximum entropy method. Chin. J. Rock Mech. Eng 2004, 23, 2177–2181, in Chinese. [Google Scholar]
  19. Kang, H.Y.; Kwak, B.M. Application of maximum entropy principle for reliability-based design optimization. Struct. Multidiscip. Optim 2009, 38, 331–346. [Google Scholar]
  20. Singh, V. Hydrologic synthesis using entropy theory: Review. J. Hydrol. Eng 2011, 16, 421–433. [Google Scholar]
  21. Li, C.; Wang, W.; Wang, S. Maximum-entropy method for evaluating the slope stability of earth dams. Entropy 2012, 14, 1864–1876. [Google Scholar]
  22. Zhou, R.; Cai, R.; Tong, G. Applications of entropy in finance: A review. Entropy 2013, 15, 4909–4931. [Google Scholar]
Figure 1. Flowchart for the control loads feedback of dam displacement.
Entropy 17 02958f1
Figure 2. Arch crown beam cross-section of the dam.
Entropy 17 02958f2
Figure 3. (a) Reservoir water level observations of the dam. (b) Air temperature observations in the dam site. (c) Radial displacement observations of the dam crest monitored by the pendulums in dam block 18#.
Entropy 17 02958f3
Figure 4. Comparison between the measured displacement curve and the fitted one.
Entropy 17 02958f4
Figure 5. Three-dimension surf for the load effect component of dam displacement.
Entropy 17 02958f5
Figure 6. Control loads diagram for dam displacement.
Entropy 17 02958f6
Table 1. Coefficients of the interpretation model and the multiple correlation coefficient.
CoefficientValueCoefficientValueCoefficientValue
a00.00a4−0.0000282b22−0.365
a119.6b110.109c1−0.0109
a2−0.534b120.279Ec20.756
a30.00639b21−3.07R0.964
Table 2. Moments for the extreme load effect component sets of dam displacement.
MomentsMaximum load effect componentMinimum load effect component
011
1st3.2−3
2nd11.5110.35
3rd44.66−39.41
4th182.93160.7
Table 3. Lagrange multipliers of the probability density function (PDF) for the extreme load effect components.
Lagrange multipliersMaximum load effect componentMinimum load effect component
λ0−4.9896−4.3163
λ12.4622−2.1545
λ20.3847−0.3591
λ30.0009960.000986
λ42.00E−082.00E−08
Table 4. Comparison between the critical values obtained by different methods.
Method δ C max ( mm ) δ C min ( mm )
Proposed method5.90−4.85
Kolmogorov–Smirnov method5.76−4.87

