Article

High-Speed Spindle Fault Diagnosis with the Empirical Mode Decomposition and Multiscale Entropy Method

Department of Mechanical Engineering, National Taiwan University, Taipei, 10617 Taiwan
*
Author to whom correspondence should be addressed.
These authors contributed equally to this work.
Entropy 2015, 17(4), 2170-2183; https://doi.org/10.3390/e17042170
Submission received: 27 January 2015 / Revised: 1 April 2015 / Accepted: 2 April 2015 / Published: 13 April 2015

Abstract

:
The root mean square (RMS) value of a vibration signal is an important indicator used to represent the amplitude of vibrations in evaluating the quality of high-speed spindles. However, RMS is unable to detect a number of common fault characteristics that occur prior to bearing failure. Extending the operational life and quality of spindles requires reliable fault diagnosis techniques for the analysis of vibration signals from three axes. This study used empirical mode decomposition to decompose signals into intrinsic mode functions containing a zero-crossing rate and energy to represent the characteristics of rotating elements. The MSE curve was then used to identify a number of characteristic defects. The purpose of this research was to obtain vibration signals along three axes with the aim of extending the operational life of devices included in the product line of an actual spindle manufacturing company.

1. Introduction

Spindle manufacturers use a variety of fault diagnosis techniques based on temperature, vibration and acoustics, to enhance the reliability, stability and lifespan of their devices [13]. Root mean square (RMS) values and temperature monitoring systems are used to examine the quality of the spindle before leaving the factory. Unfortunately, the RMS value reveals only the amplitude of vibration, giving no indication of fault characteristics.
Some vibration analysis methods have been proposed [4,5] for the diagnosis of fault characteristics in rotational machinery. Fourier transform and time-domain statistical analysis methods [6] are widely used to analyze the non-stationary characteristics of vibration signals in rotating machinery. Unfortunately, Fourier analysis can only be used in linear system and stationary data. It is very difficult to extract fault characteristics directly from original measurement data in a complex vibration signal due to the wide frequency spectrum and spurious harmonics. Furthermore, Fourier analysis is unable to separate useful signals from noise and external disturbances [7]. A number of advanced signal processing algorithms, such as empirical mode decomposition (EMD) and multiscale entropy (MSE), have been developed to remedy this problem.
Huang [8] developed an adaptive time-frequency data analysis method called empirical mode decomposition, which can decompose complex non-linear and non-stationary signals into to a number of intrinsic mode functions (IMFs) with specific physical representation. Peng [9] proposed two methods to detect tool breakage: (1) using the Hilbert spectrum; and (2) using the energies of characteristic IMFs during the milling process. Analysis of individual IMF components enables the extraction of specific fault characteristics from the original signal. For this reason, EMD has been successfully employed to rotating machinery fault diagnosis and tool health condition monitoring, such as misalignment diagnosis [10], rolling bearing defect diagnosis and tool breakage detection. Yu et al. [11] used the Hilbert–Huang transform (HHT) to diagnose faults in roller bearings. Cheng et al. [12] proposed a method for the extraction of fault characteristics of roller bearings using an autoregressive (AR) model based on the EMD method. Since that time, EMD has been applied in the analysis of vibration signals in diagnosing bearing faults [13], monitoring the condition of machine tools [14] and diagnosing faults in built-in motors [15].
Multiscale entropy (MSE) is a new approach measuring the complexity of systems in order to quantify irregularities in a time series. Pincus [16] introduced approximate entropy (ApEn), which is a statistical measure used to quantify the regularity or predictability of a time series. ApEn has been successfully applied in the analysis of vibration signals [17] and biomedical signals [18]. However, ApEn has two fundamental drawbacks: a heavy dependence on the length of records and an estimated value consistently below that expected of short records. Second, it lacks relative consistency. To overcome these shortcomings, Richman et al. [19] proposed sample entropy (SampEn), which requires a much shorter record length than does ApEn. Costa et al. [20] proposed the use of multiscale entropy (MSE) to differentiate individual signals associated with the human heartbeat. Zhang et al. [21] used MSE and adaptive neuro-fuzzy inference to detect faults in bearings and to determine their severity. Lin et al. [22] utilized MSE to reveal features capable of differentiating vibration signals in shafts under normal and misalignment conditions.
Measurements of radial vibration and position [23] are fundamental to collect vibration signals. However, a range of factors can affect the behavior and position of the shaft in the axial direction (e.g., excessive axial load, bearing lubrication failure). An accelerometer can be mounted above the bearing on the housing to collect signals related to vibration in three directions in order to identify the fault characteristics of the spindle.
The remainder of this paper is organized as follows. Section 2 discusses the experiment setup. Section 3 presents a flow chart of signal analysis, EMD and MSE approaches. Section 4 discusses the creation of artificial defects. Section 5 presents experiment and analysis results. Conclusions are drawn in Section 6.

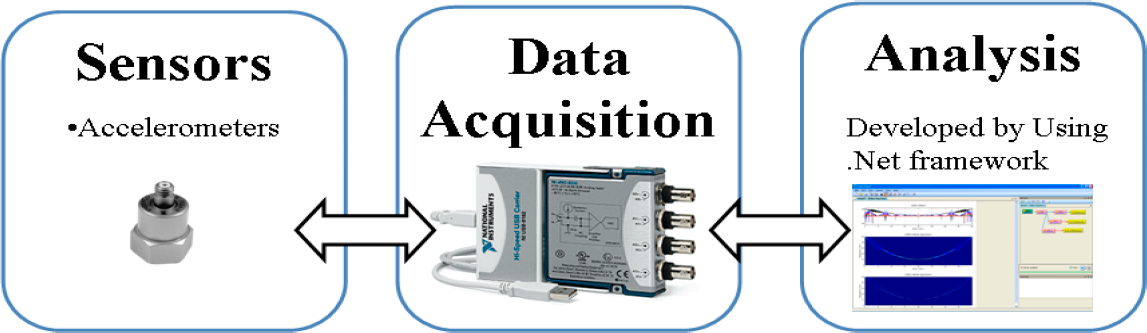
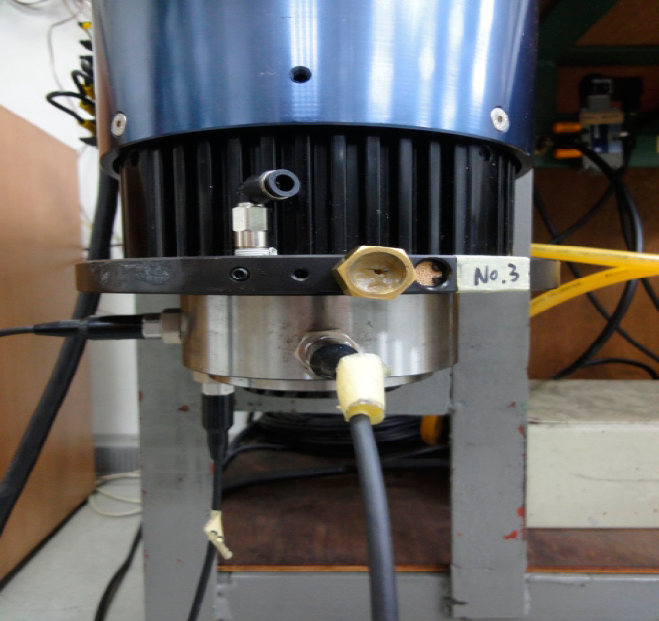
2. Experiment Setup and Measurement System

Investigating defects in spindles requires health monitoring and fault diagnosis. The experiment configuration comprises a shaft, constant pressure device and two bearing sets (SKF 71908CD and 7010CE). Spindle rotation speed was controlled using an AC inverter capable of operating at up to 24,000 rpm. Constant pressure devices can be used over a wide range of loads in the axial direction. Three 352C65 ICP accelerometers (sensitivity: 100 mV/g) were mounted on the front-side bearing of the spindle to collect vibration signals in the radial and axial directions as shown in Figure 1 (sampling frequency = 51,200 Hz). Vibration signals of the spindle were collected by the data acquisition device (NI-9234). The validity and effectiveness of the experiment configuration is shown in Figure 2.
The experiment parameters were as follows [15]:
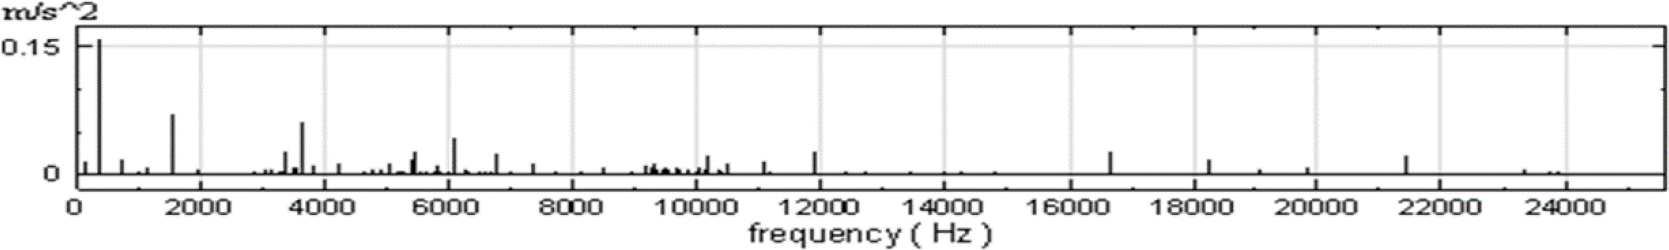
  • the data sampling rate was set to 51,200 Hz (maximum achievable) for the acquisition system for the extraction of vibration signals;
  • a maximum rotational speed of 24,000 RPM (400 Hz);
  • three accelerometers mounted using magnets on the front-side bearings of the spindle;
  • total measurement time of 10 s.
Figure 3 presents an actual example of the signal measured from a mass-unbalanced shaft. The Fourier spectrum corresponding to the measured vibration signal is presented in Figure 4, showing that the first-order frequency (rotation speed of 400 Hz) is the dominant constituent in the spectrum. Despite the fact that the spectrum extended to 25,600 Hz (one half of the sampling rate), the usable range was only from 0 to 5,000 Hz [24,25], after taking into account the mounting method and its associated natural frequency.

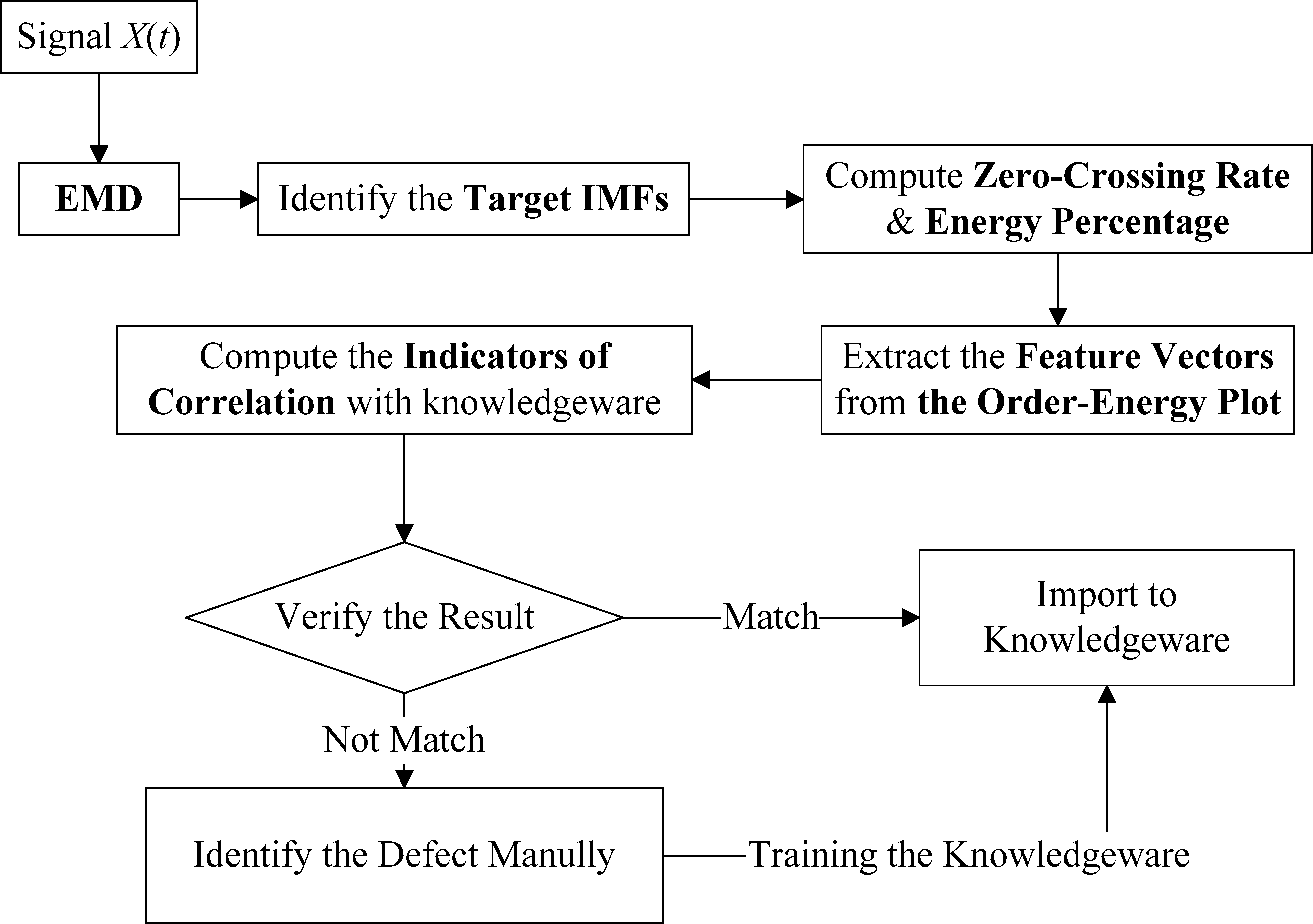
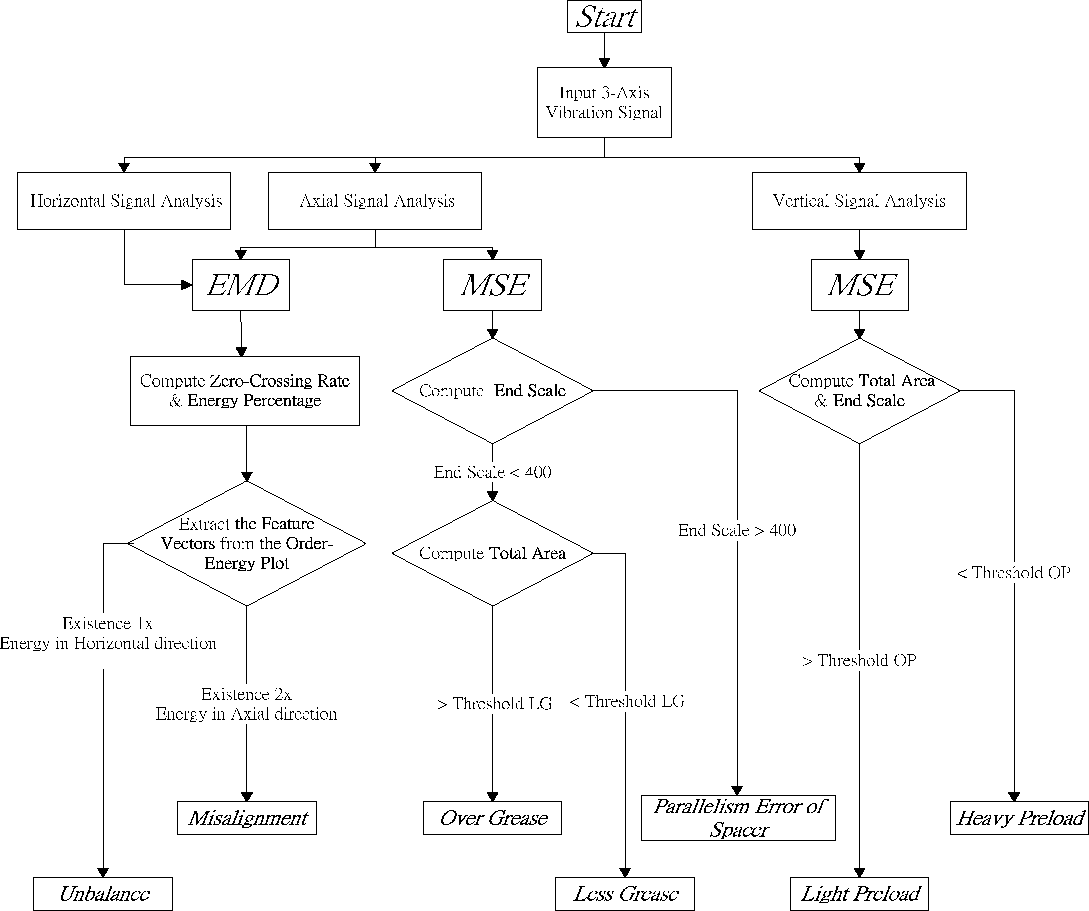
3. Rotating Machinery Fault Diagnosis Method

Vibration signals were collected along three axes and then analyzed using EMD and MSE for the detection and diagnosis of faults. The process used for the analysis of vibration signals is illustrated in Figure 5.
Signal analysis involves the extraction of the vibration signal in order to calculate the zero-crossing rate and energy percentage of each IMF according to EMD. The second step is to judge the horizontal and axial signal existence vibration amplitude at a 1× or 2× running frequency. Mass unbalance exists at 1× running frequency and misalignment exists at 2× running frequency. The third step is to determine whether the end scale is higher than 400 from the axial signal, which would verify the existence error in the parallel alignment of the bearing spacer ring. The fourth step involves calculating the total area under the MSE curve with the end scale below 400 in order to estimate the amount of grease. The fifth step involves calculating the end scale and total area under the MSE curve in order to deduce the preload value from the vertical signal.

3.1. Brief Outline of the EMD Method

HHT was used as a feature extraction method to detect specific physical meanings [26]. The HHT consists of two main parts: EMD and Hilbert transform. The EMD method can decompose any multicomponent signal into a set of monocomponent signals, which are referred to as intrinsic mode functions (IMFs) [27]. Each IMF is unique and satisfies the following two conditions [8]: (1) within the entire dataset, the number of extrema and the number of zero-crossings must either equal or differ at most by one; and (2) at any point, the mean value of the envelope defined by the local maxima and the envelope defined by the local minima is zero.

3.1.1. Characteristics of the Intrinsic Mode Function

The decomposition of the time series by EMD into a number of IMFs with physical meanings has been demonstrated [28]. An IMF represents a simple oscillatory mode embedded in the signal [4]. To gain insight into the characteristics of IMFs, the zero-crossing rate Zri (Equation (1)) and average energy Ei (Equation (2)) associated with the i-th IMF are calculated as follows:
Z r i = i t h ¯ N u m b e r ¯ o f ¯ Z e r o C r o s s × S a m p l in g ¯ R a t e N × 2
E i = 1 n k = 1 n ( C i [ k ] ) 2
where N represents the length of the signal and Ci[k] represents the k-th element of the i-th IMF.

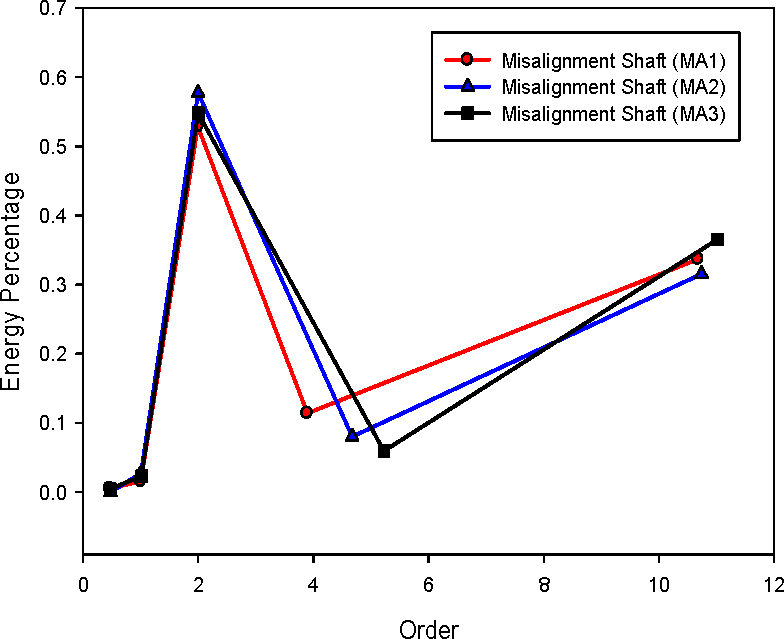
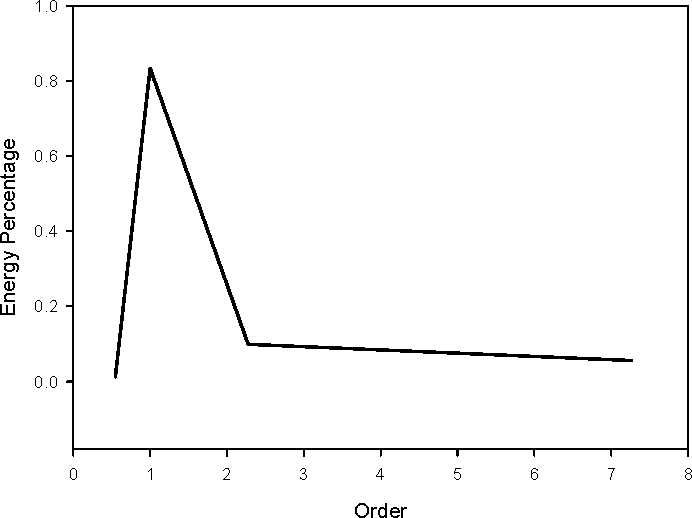
3.1.2. Order-Energy Plot

Peng [9] and Junsheng [12] revealed that the energy distribution of IMFs is closely related to the conditions found in machine tool systems. Lin et al. [15] proposed the order-energy plot to represent this energy distribution as shown in Figure 6. The order-energy plot of the shaft with the target IMFs is presented in Figure 7, in which the X-axis presents the order (equal to the zero-crossing rate divided by the working speed) and the Y-axis is the average energy percentage of each IMF component.

3.2. MSE Approach

In MSE analysis, we consider a one-dimensional discrete time series of length N: X = { x 1 ... x 2 ... x n }. We then construct a consecutive coarse-grained time series, X = { y ( τ ) }, which is divided by the scale factor τ, and the data points inside each window are averaged. Each element j of a coarse-grained time series y j τ is then calculated according to the following equation [29]:
y j τ = 1 τ i = ( j 1 ) τ + 1 j τ x i , 1 j N / τ , N > τ
When the scale factor equals one, the coarse-grained time series { y ( 1 ) } is simply the original time series. The length of the original time series is equal to the length of the coarse-grained one divided by the scale factor τ.
The sample entropy S E ( τ , m , r , N ) [19] is computed using Equation (4) for each scale factor τ. The n i m is the number of similar patterns for data point i.
S E ( m , r , N ) = ln ( i = 1 N m n i m i = 1 N m n i m + 1 )
This is then used to calculate the sample entropy SE for each coarse-grained time series, which is plotted as a function of the scale factor τ.

4. Types of Artificial Defect

Using statistics compiled by one manufacturer of spindles, this study assembled seven models to represent the following fault categories: mass unbalance, shaft misalignment, inappropriate grease content [30], inappropriate preload [31] and errors in the parallel alignment of the bearing spacer ring.

4.1. Unbalanced

Mass unbalance is a common problem, defined as an uneven distribution in the mass of the rotor, which can cause severe problems, particularly at high operating speeds. Optimizing shaft alignment is meant to extend the life of the device; however, process variation in manufacturing makes it difficult to ensure the balance of a rotor [32].

4.2. Misalignment

Shaft misalignment is the most common fault encountered in rotating machinery. Geometric and assembly-related tolerances are extremely difficult to control, which makes it hard to ensure perfect alignment between the shaft and housing. Therefore, this study applied a gauge to measure the concentricity of the rotating machinery in order to ensure shaft misalignment.

4.3. Lubricant

A dearth or excess of lubricant can lead to bearing failure. The correct amount of lubricant in bearings can be determined based on vibration signals. This study followed guidelines in the SKF manual [33] in which 50% of the recommended value was considered insufficient grease content and double the recommended value was considered excessive grease content as shown in Table 1.

4.4. Preload

The initial preload enhances accuracy in rotation, determines the stiffness and lifespan of the spindle and helps to decrease noise and vibration. Two methods have been developed for the adjustment of bearing preload: (1) constant position preload; and (2) constant force preload (spring preload). Constant position preload is applied using a constant relative displacement between the inner and outer spacer rings. Unfortunately, thermal deformation within the spindle system can affect the preload of bearings [34] by altering the relative position of inner and outer spacer rings. As mentioned previously, this research developed a spring-force mechanism, which allows the user to control the preload value.

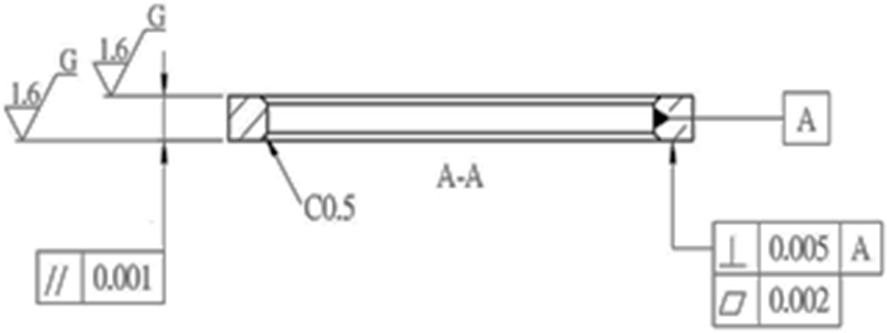
4.5. Error in Parallel Positioning of Bearing Spacer Ring

The bearing spacer ring plays an important role in system rigidity and the lifespan of bearings by allowing grease to escape from the bearing to reduce running temperature. The spacer must be sufficiently hard to resist deformation during bearing rotation. However, it is difficult to ensure the parallel alignment of the spacer (within 1–2 μm), as shown in Figure 8 [33], particularly in mass manufacturing. Most cases of bearing failure without warning can be attributed to variations in this parameter.

5. Result

This research proposes EMD and MSE algorithms to extract common fault types signals, such as mass unbalance, misalignment, less and over-grease, light and heavy preload and the parallelism error of the spacer.

5.1. Unbalance

In this study, the rotor was subject to the effects of gravity, because the high-speed motor was placed in a vertical place (Figure 1). This study used EMD to detect mass-unbalance faults. Previous researchers have indicated [35] that 1× (rotation speed) energy represents mass unbalance. As shown in Figure 9, the 1× energy is largest in the horizontal vibration signal. The EMD was able to diagnose an unbalanced shaft from the vibration signal.

5.2. Misalignment

Geometric and dimensional errors are difficult to control due to process variations inherent in mass production methods. Accumulated tolerance was defined as the sum of geometrical tolerance and dimension tolerance. As mentioned above, shaft alignment is difficult to achieve. A number of researchers [35] have reported that 2× (rotation speed) energy is an indication of shaft misalignment. As shown in Figure 10, the 2× (rotation speed) energy is largest in the axial vibration signals. However, the zero-crossing rate of IMF4 is 797, and the energy percentage is 53.12 percent, as shown in Figure 10. Thus, EMD was able to diagnose shaft misalignment based on the axial vibration signal.

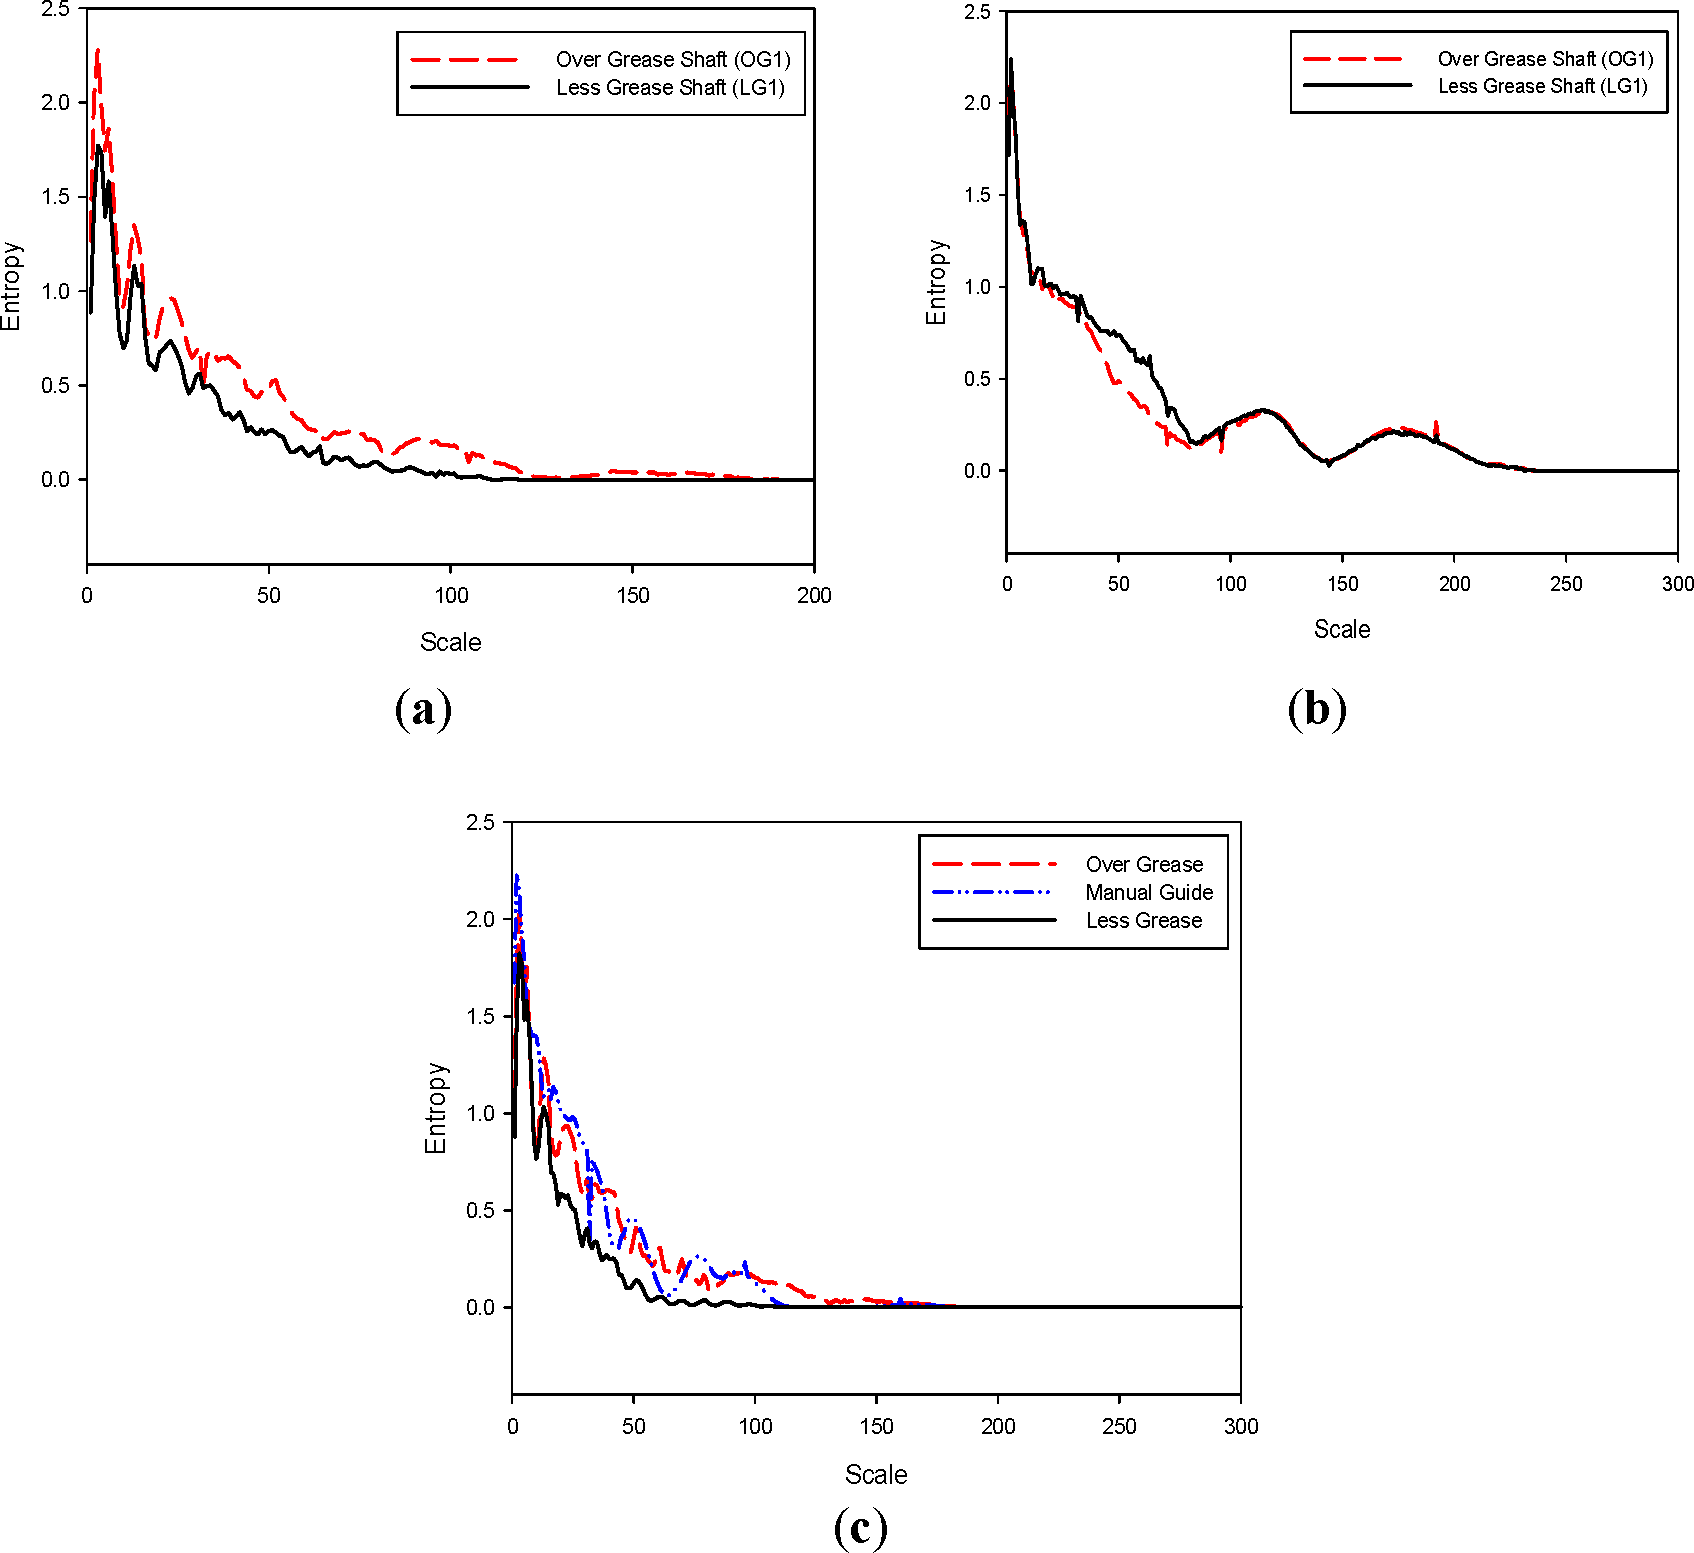
5.3. Less and Over-Grease

This study used the end scale and total area under the MSE curve to analyze the vibration signals in order to calculate the amount of grease in the bearings, as shown in Figure 11 and Table. 2. The bearing preload is set to a constant value to ensure the reliability of this experiment. The axial vibration signal was used to quantify the amount of grease filling, as shown in Figure 11a. The radial vibration signal represents the MSE curve coincidence in Figure 11b, which makes it difficult to identify the amount of grease in the bearing. The MSE curve in Figure 11c and Table 2 clearly indicates the fault feature of insufficient grease.

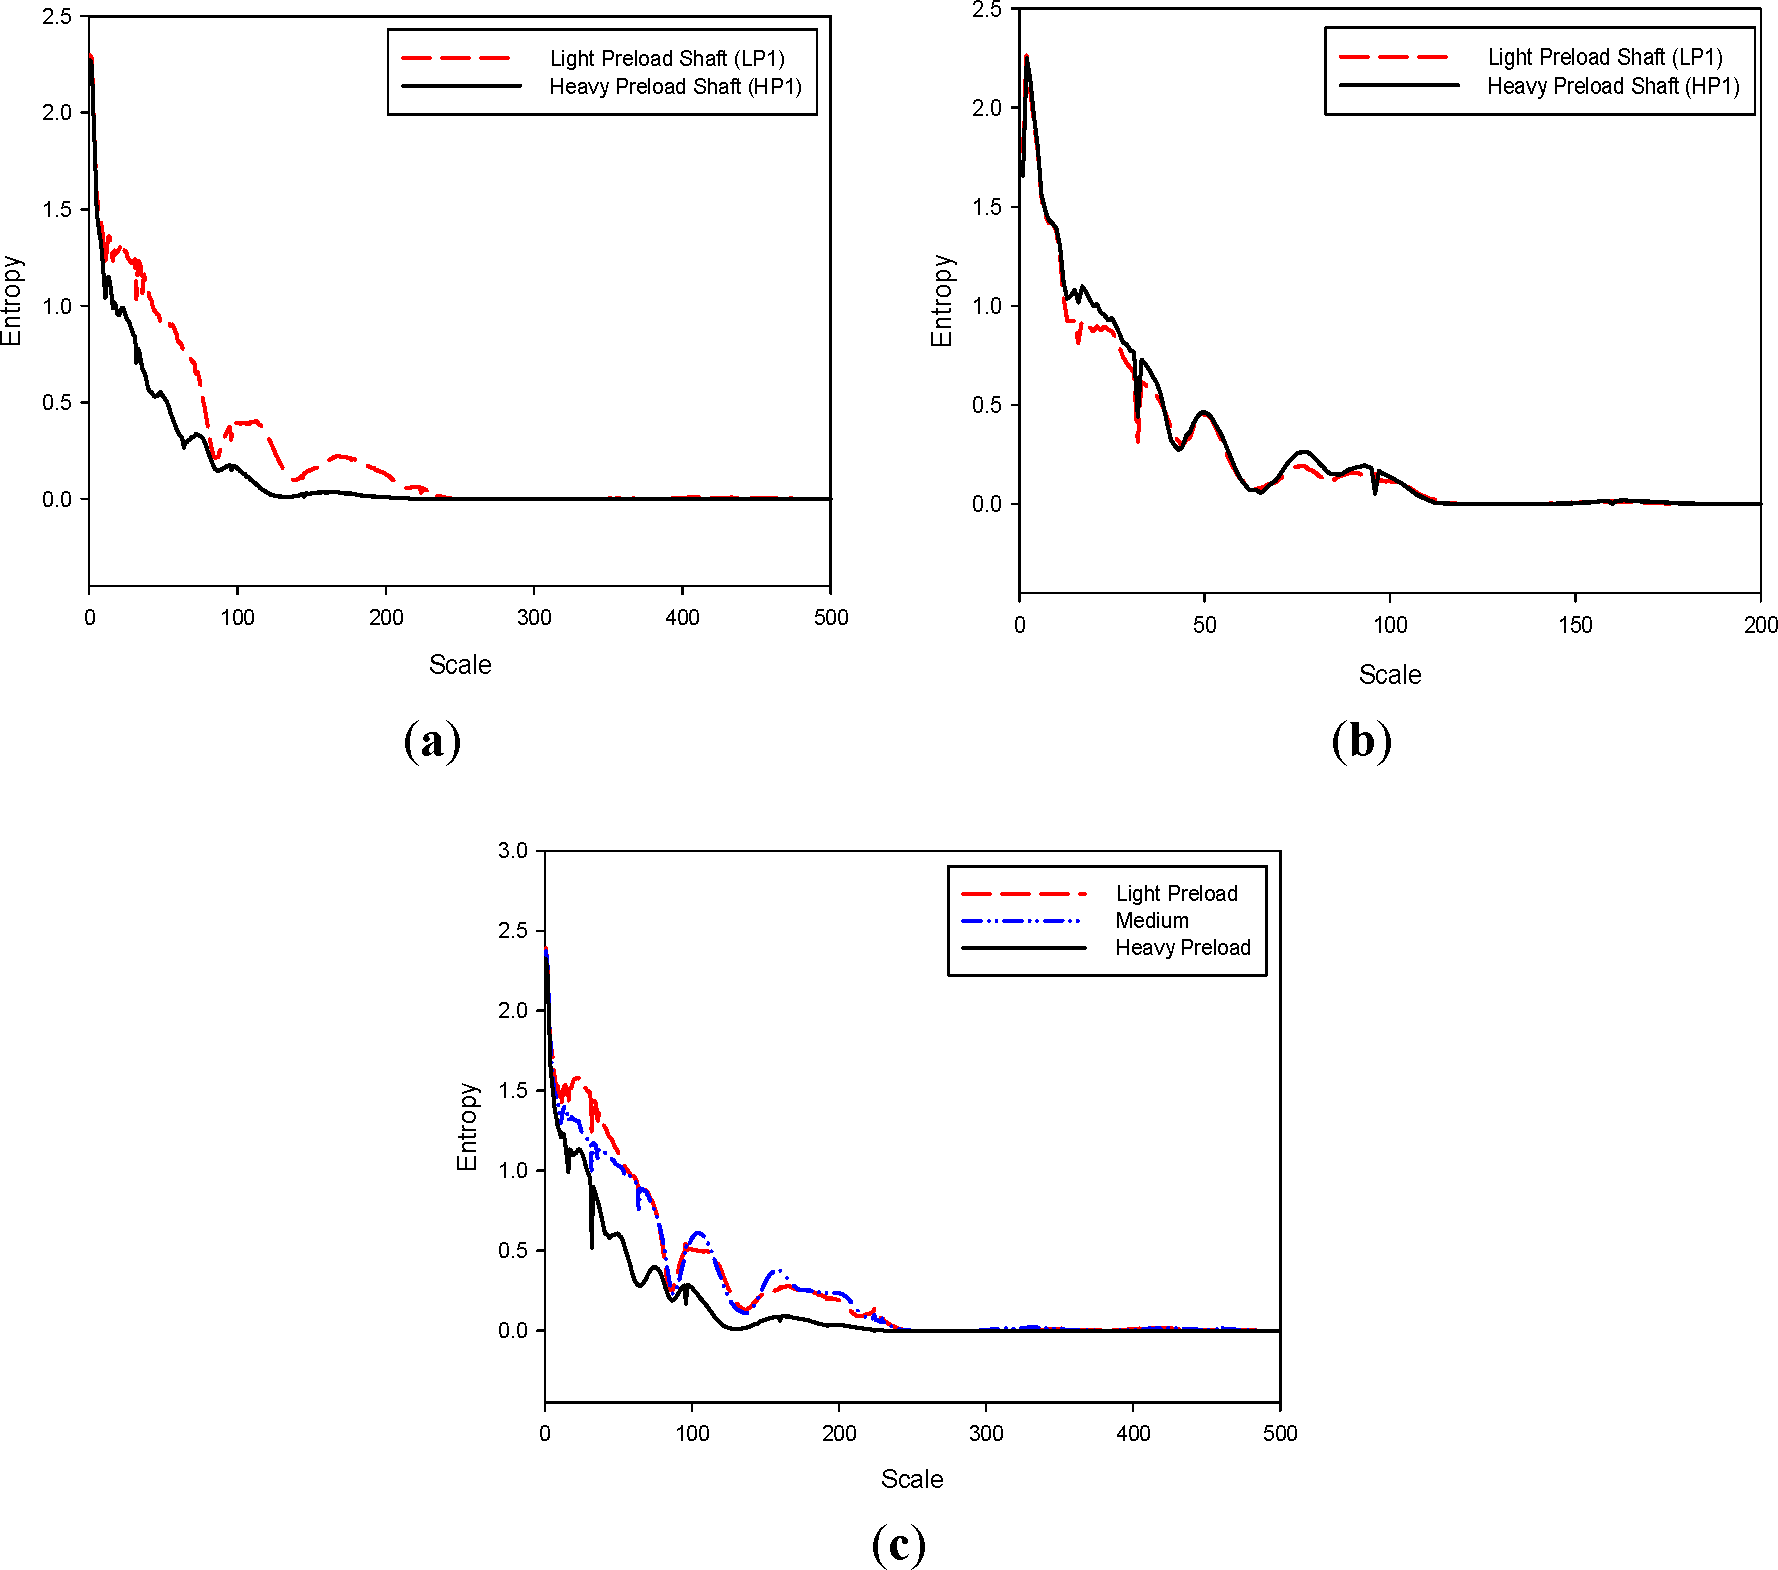
5.4. Light and Heavy Preload

Identifying the appropriate preload can affect rotation accuracy and operating temperature. This study developed a means to monitor the effects of preload using a constant pressure device to absorb changes associated with thermal expansion [34]. The vibration signal under various preload conditions was analyzed using MSE, as shown in Figure 12 and Table 3. The difference between the end scale and the total area under the MSE curve in Figure 12a represents high and low preload. The MSE curve in Figure 12c and Table 3 clearly indicates the fault features associated with heavy preload.

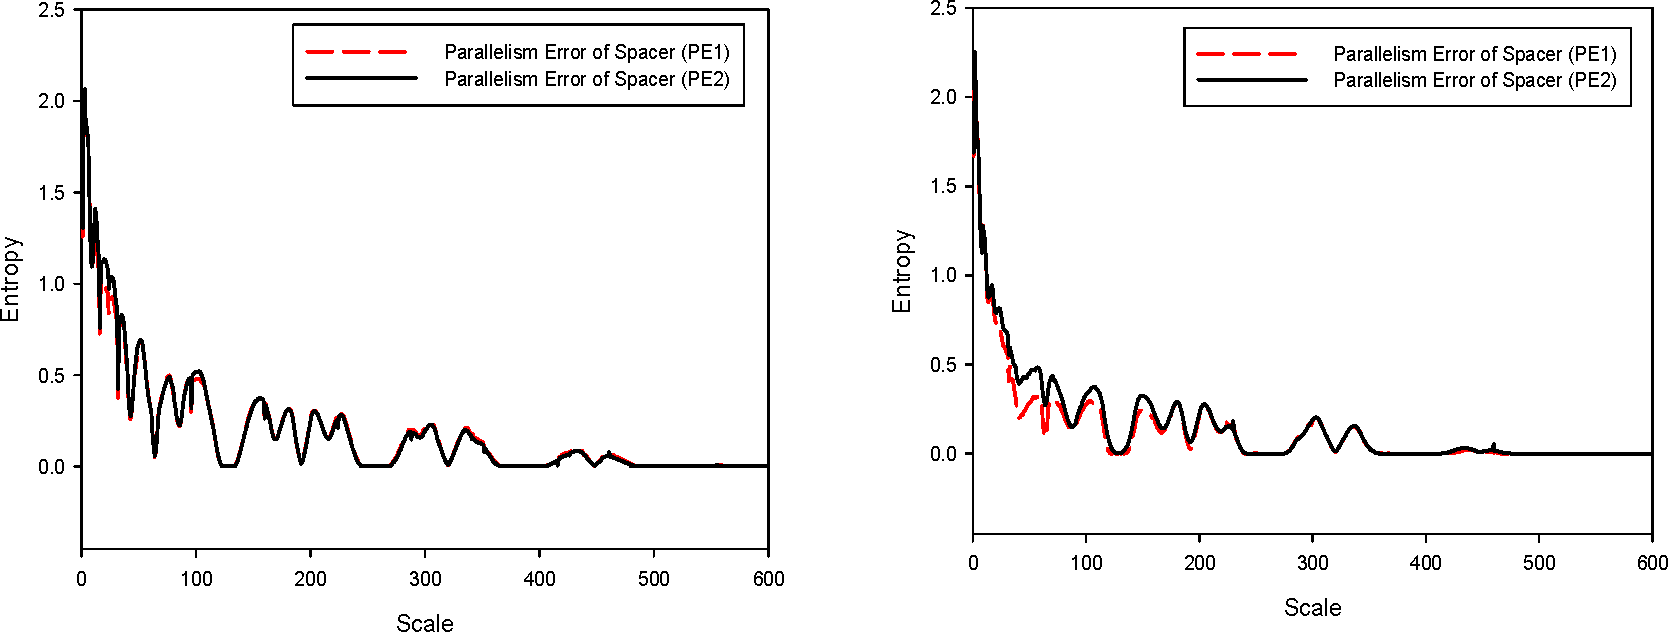
5.5. Parallelism Error of Spacer

Non-uniform compression force and unequal force distribution across the bearing can lead to damage without warning. Ensuring surface flatness in the spacer is crucial to optimizing the performance of bearings. This research simulated the parallelism error of a spacer in order to extract vibration signals related to this defect. As shown in Figure 13a, the end scale of the parallelism error of the spacer is 596, which exceeds the end scale of the excessive grease MSE curve (230) in Figure 11c. The end scale of the lubrication MSE curve of the axial vibration signal is less than 400. Thus, this study used the axial vibration signal to characterize the parallelism error associated with the spacer.

6. Conclusions

The objective of this study was to collect information related to common fault vibration signals using three accelerometers in the three directions for the diagnosis of faults. This research adopted EMD and MSE methods to identify faults according to their characteristics. The EMD method draws an order-energy plot to identify mass unbalance and shaft misalignment from horizontal and axial vibration signals. The axial vibration signal can also be used to derive information for use in determining the amount of lubrication and error in the parallel alignment of the spacer according to the end scale and total area under the MSE curve. This study then used the MSE method to diagnose the preload value according to the MSE curve from the vertical vibration signal. In this research, the end scale and total area of each artificial defect type are obtained by statistical analysis of the data. Hence, the MSE curve is able to accurately diagnose the fault type of less grease, heavy preload and the parallelism of the spacer.
Finally, this experiment collected signals from spindles that included noise commonly encountered in actual operating environments. This breakthrough technology is able to identify the essential operating characteristics of a spindle and, thereby, to prevent sudden breakdowns. This approach was then evaluated for its ability to enhance the reliability and quality control of spindles in an existing product line.

Acknowledgments

This work is support by the Anderson group.

Author Contributions

Nan-Kai Hsieh is in charge of collecting and doing statistics of the conditions of the high-speed spindle damage. Also, he collects the vibration signals from a variety of self-made spindles. Wei-Yen Lin is responsible for developing programs and collecting all kinds of characteristics that lead to damage. Hong-Tsu Young integrates and executes the task in progress. All authors have read and approved the final manuscript.

Conflicts of Interest

The authors declare no conflict of interest.

References

  1. Xiong, X.; Yang, S.; Gan, C. A new procedure for extracting fault feature of multi-frequency signal from rotating machinery. Mech. Syst. Signal Process 2012, 32, 306–319. [Google Scholar]
  2. Tsao, W.-C.; Li, Y.-F.; Le, D. D.; Pan, M.-C. An insight concept to select appropriate IMFs for envelope analysis of bearing fault diagnosis. Measurement 2012, 45, 1489–1498. [Google Scholar]
  3. Saravanan, S.; Yadava, G.S.; Rao, P.V. Condition monitoring studies on spindle bearing of a lathe. Int. J. Adv. Manuf. Technol. 2006, 28, 993–1005. [Google Scholar]
  4. Lei, Y.; He, Z.; Zi, Y. Application of the EEMD method to rotor fault diagnosis of rotating machinery. Mech. Syst. Signal Process 2009, 23, 1327–1338. [Google Scholar]
  5. Lei, Y.; Lin, J.; He, Z.; Zuo, M.J. A review on empirical mode decomposition in fault diagnosis of rotating machinery. Mech. Syst. Signal Process 2013, 35, 108–126. [Google Scholar]
  6. Al-Hamdan, A. Effect of misalignment on the cutting force signature in drilling. J. Mater. Process. Technol. 2002, 124, 83–91. [Google Scholar]
  7. Wu, T.Y.; Chen, J.C.; Wang, C.C. Characterization of gear faults in variable rotating speed using Hilbert-Huang Transform and instantaneous dimensionless frequency normalization. Mech. Syst. Signal Process 2012, 30, 103–122. [Google Scholar]
  8. Huang, N.E.; Shen, Z.; Long, S.R.; Wu, M.C.; Shih, H.H.; Zheng, Q.; Yuen, N.C.; Tung, C.C.; Liu, H.H. The empirical mode decomposition and the Hilbert spectrum for nonlinear and non-stationary time series analysis. Proc. R. Soc. Lond. 1998, 454A, 903–995. [Google Scholar]
  9. Peng, Y. Empirical model decomposition based time-frequency analysis for the effective detection of tool breakage. J. Manuf. Sci. Eng. 2006, 128, 154–166. [Google Scholar]
  10. Jiang, H.; Li, C.; Li, H. An improved EEMD with multiwavelet packet for rotating machinery multi-fault diagnosis. Mech. Syst. Signal Process 2013, 36, 225–239. [Google Scholar]
  11. Yu, D.; Cheng, J.; Yang, Y. Application of EMD method and Hilbert spectrum to the fault diagnosis of roller bearings. Mech. Syst. Signal Process 2005, 19, 259–270. [Google Scholar]
  12. Cheng, J.; Yu, D.; Yu, Y. A fault diagnosis approach for roller bearings based on EMD method and AR model. Mech. Syst. Signal Process 2006, 20, 350–362. [Google Scholar]
  13. Rai, V.K.; Mohanty, A.R. Bearing fault diagnosis using FFT of intrinsic mode functions in Hilbert-Huang transform. Mech. Syst. Signal Process 2007, 21, 2607–2615. [Google Scholar]
  14. Peng, Z.K.; Tse, P.W.; Chu, F.L. A comparison study of improved Hilbert-Huang transform and wavelet transform: Application to fault diagnosis for rolling bearing. Mech. Syst. Signal Process 2005, 19, 974–988. [Google Scholar]
  15. Lin, W.-Y.; Chuang, L.-C.; Young, H.-T. Condition-based shaft fault diagnosis with the empirical mode decomposition method. Proc. IMechE Part B: J. Eng. Manuf. 2010, 225, 723–734. [Google Scholar]
  16. Pincus, S.M. Approximate entropy as a measure of system complexity. Proc. Natl. Acad. Sci. USA 1991, 88, 2297–2301. [Google Scholar]
  17. Yan, R.; Gao, R.X. Approximate entropy as a diagnostic tool form machine health monitoring. Mech. Syst. Signal Process 2007, 21, 824–839. [Google Scholar]
  18. Ocak, H. Automatic detection of elileptic seizures in EEG using discrete wavelet transform and approximate entropy. Expert Syst. Appl. 2009, 36, 2027–2036. [Google Scholar]
  19. Richman, J.S.; Moorman, J.R. Physiological time-series analysis using approximate entropy and sample entropy. Am J. Physiol. Heart. Circ. Physiol. 2000, 278, H2039–H2049. [Google Scholar]
  20. Costa, M.; Goldberger, A.L.; Peng, C.-K. Multiscale entropy analysis of complex physiologic time series. Phys. Rev. Lett. 2002, 89, 068102. [Google Scholar]
  21. Zhang, L.; Xiong, G.; Liu, H.; Zou, H.; Guo, W. Bearing fault diagnosis using multi-scale entropy and adaptive neuro-fuzzy inference. Expert Syst. Appl. 2010, 37, 6077–6085. [Google Scholar]
  22. Lin, J.-L.; Liu, J.Y.-C.; Li, C.-W.; Tsai, L.F.; Chung, H.-Y. Motor shaft misalignment detection using multiscale entropy with wavelet denoising. Expert Syst. Appl. 2010, 37, 7200–7204. [Google Scholar]
  23. Serrato, R.; Maru, M.M.; Padovese, L.R. Effect of lubricant viscosity grade on mechanical vibration of roller bearings. Tribol. Int. 2007, 40, 1270–1275. [Google Scholar]
  24. Wilosn, J.S. Sensor Technology Handbook; Newnes: Oxford, UK, 2005. [Google Scholar]
  25. Hansen, T.F. Accelerometer mounting techniques. B&K Web Course 2007. [Google Scholar]
  26. Yang, Z.; Yu, Z.; Xie, C.; Huang, Y. Application of Hilbert-Huang transform to acoustic emission signal for burn feature extraction in surface grinding process. Measurement 2014, 47, 14–21. [Google Scholar]
  27. Peng, Z.K.; Tse, P.W.; Chu, F.L. An improved Hilbert-Huang transform and its application in vibration signal analysis. J. Sound Vib 2005, 286, 187–205. [Google Scholar]
  28. Huang, N.E.; Shen, Z.; Long, S.R. A new view of nonlinear water waves: The Hilbert Spectrum. Annu. Rev. Fluid Mech 1999, 31, 417–457. [Google Scholar]
  29. Costa, M.; Goldberger, A.L.; Peng, C.-K. Multiscale entropy analysis of biological signals. Phys. Rev. E 2005, 71, 021906. [Google Scholar]
  30. Wu, C.-H.; Kung, Y.-T. A parametric study on oil/air lubrication of a high-speed spindle. Precis. Eng. 2005, 29, 162–167. [Google Scholar]
  31. Spiewak, S.A.; Nickel, T. Vibration based preload estimation in machine tool spindles. Int. J. Mach. Tools Manuf 2001, 41, 567–588. [Google Scholar]
  32. Saleem, A.; Diwakar, G.; Satyanarayana, M.R.S. Detection of unbalance in rotating machines using shaft deflection measurement during its operation. J. Mech. Civil Eng 2012, 3, 8–20. [Google Scholar]
  33. SKF-Catalogue 4950/IE, 2000.
  34. Cao, H.; Holkup, T.; Altintas, Y. A comparative study on the dynamics of high speed spindles with respect to different preload mechanisms. Int. J. Adv. Manuf. Technol. 2011, 57, 871–883. [Google Scholar]
  35. Vibration Diagnostic Guide, SKF Reliability Systems, Application Note 5003. Available online: www.budmgt.com/machanic/mcn-pdf/vibration-guide.pdf accessed on 13 April 2015.
Figure 1. Experiment setup.
Entropy 17 02170f1
Figure 2. Schematic diagram of the PC-based measurement system.
Entropy 17 02170f2
Figure 3. Vibration signals of the mass-unbalanced shaft.
Entropy 17 02170f3
Figure 4. Fourier spectrum of the mass-unbalanced shaft.
Entropy 17 02170f4
Figure 5. Process used in the analysis of vibration signals.
Entropy 17 02170f5
Figure 6. Methodology used for the identification of fault conditions in specimens [15].
Entropy 17 02170f6
Figure 7. Order-energy plot of the shaft [15].
Entropy 17 02170f7
Figure 8. Geometric tolerance in the placement of the spacer.
Entropy 17 02170f8
Figure 9. EMD profile (mass unbalance).
Entropy 17 02170f9
Figure 10. EMD profile (misalignment).
Entropy 17 02170f10
Figure 11. MSE profile (less and over-grease). (a) Axial vibration signal; (b) radial vibration signal; (c) MSE curve from the axial vibration signal.
Entropy 17 02170f11
Figure 12. MSE profile (light and heavy preload). (a) Radial vibration signal; (b) axial vibration signal; (c) MSE curve from the radial vibration signal.
Entropy 17 02170f12
Figure 13. MSE profile (errors in the parallel alignment of the spacer). (a) Axial vibration signal; (b) radial vibration signal.
Entropy 17 02170f13
Table 1. Grease charges.
Bearing SpecificationGrease Charge for Bearings
Less GreaseRecommended AmountOver-Grease
7010CE0.8 cc1.2 cc1.6 cc
71908CD0.4 cc0.48 cc0.8 cc
Table 2. The total area under the MSE curve and the end scale associated with the lubricant.
Less GreaseRecommended AmountOver-Grease
End Scale164222230
Total Area315560
Table 3. Total area and end scale of the preload MSE curve.
Heavy PreloadMediumLight Preload
End Scale234485493
Total Area6999132

