
Theoretical Search for RNA Folding Nuclei


Abstract
:1. Introduction
2. Theory
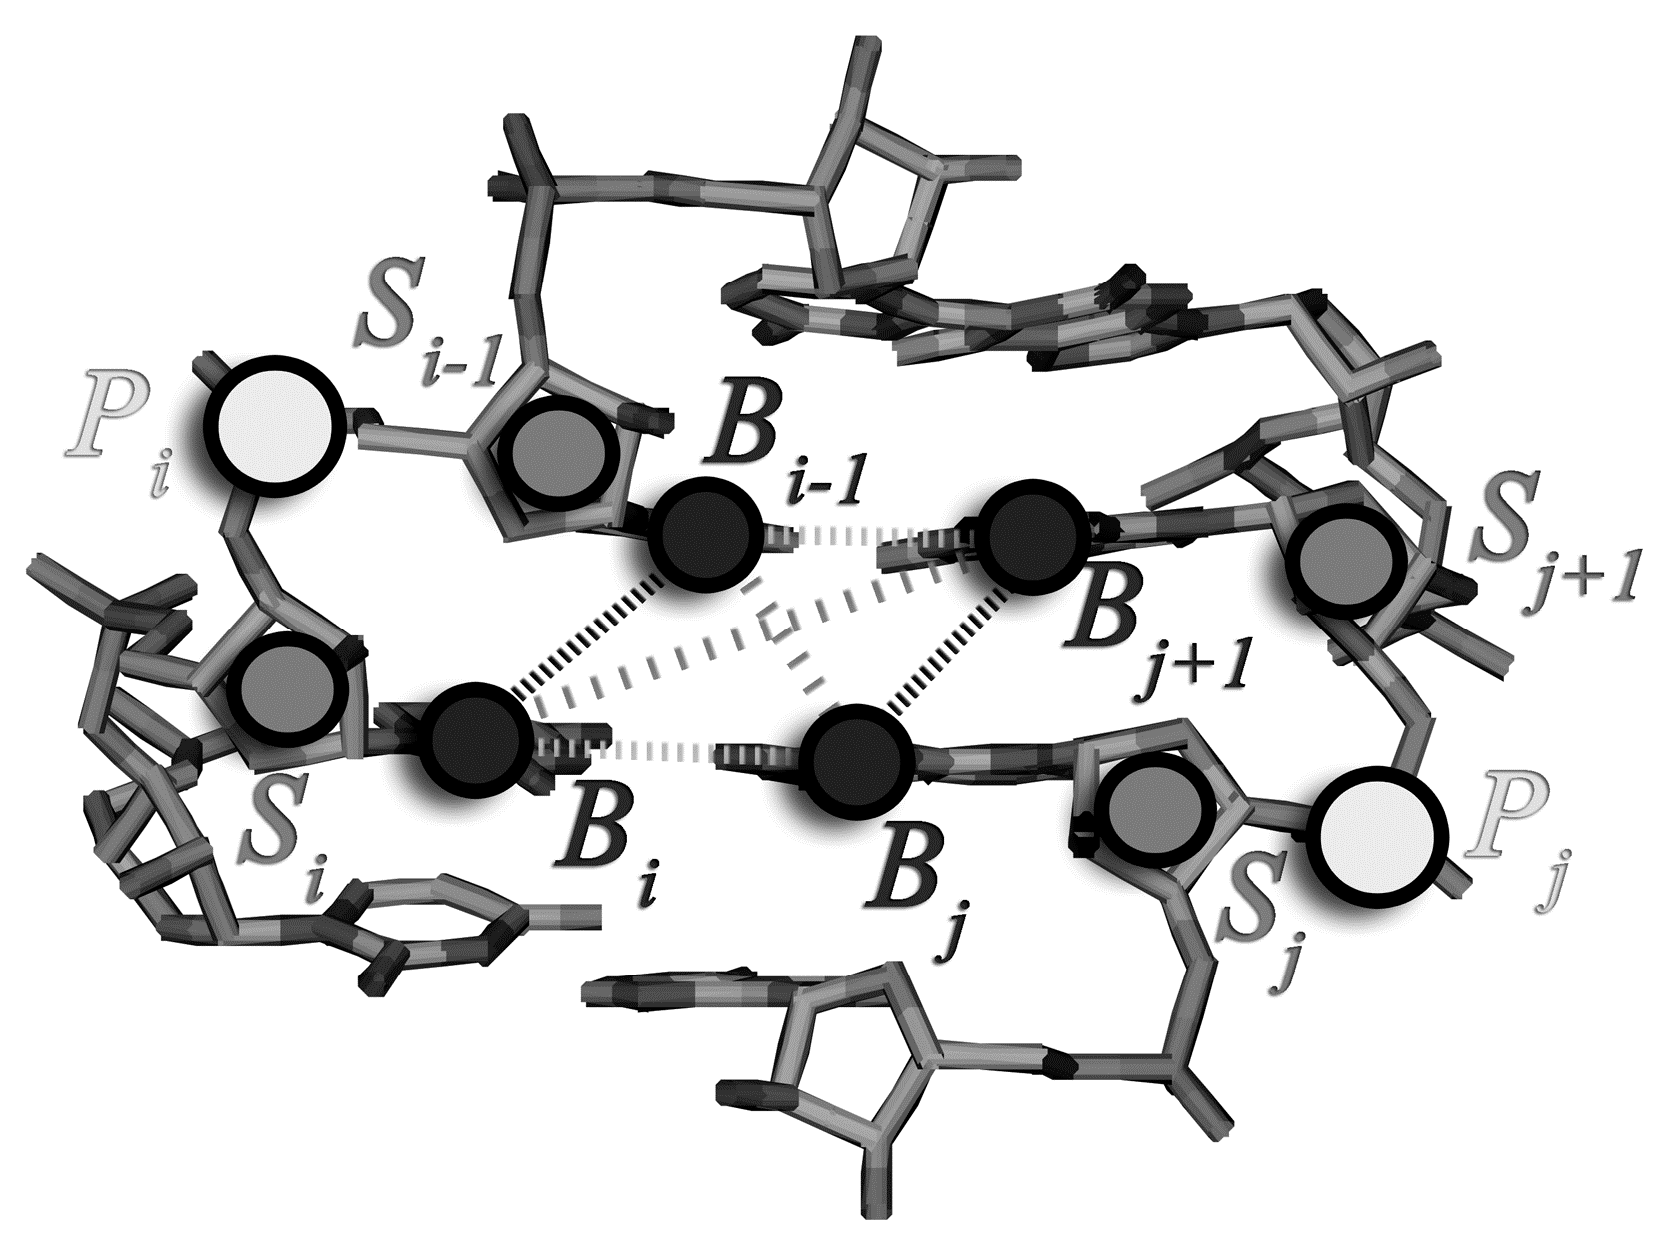
2.1. Assignment of the Coarse-Grained Structural Model and Energy Parameters for Base Pairing, Base-Stacking, and Hydrophobic Interactions


| Nucleotide Pair and Its Components | dmin | d0 | d1 | dmax |
|---|---|---|---|---|
| Ci Gj | 5.20 Å | 5.46 Å | 5.62 Å | 5.74 Å |
| Si Gj | 7.70 Å | 8.08 Å | 8.63 Å | 9.00 Å |
| Ci Sj | 9.74 Å | 9.74 Å | 10.53 Å | 10.82 Å |
| Ai Uj | 5.00 Å | 5.25 Å | 5.68 Å | 5.84 Å |
| Si Uj | 9.76 Å | 9.94 Å | 10.50 Å | 10.76 Å |
| Ai Sj | 7.72 Å | 7.92 Å | 8.82 Å | 9.00 Å |
| Ui Gj | 5.10 Å | 5.65 Å | 6.10 Å | 6.25 Å |
| Si Gj | 7.00 Å | 7.44 Å | 8.24 Å | 8.70 Å |
| Ui Sj | 9.50 Å | 10.25 Å | 10.80 Å | 11.35 Å |
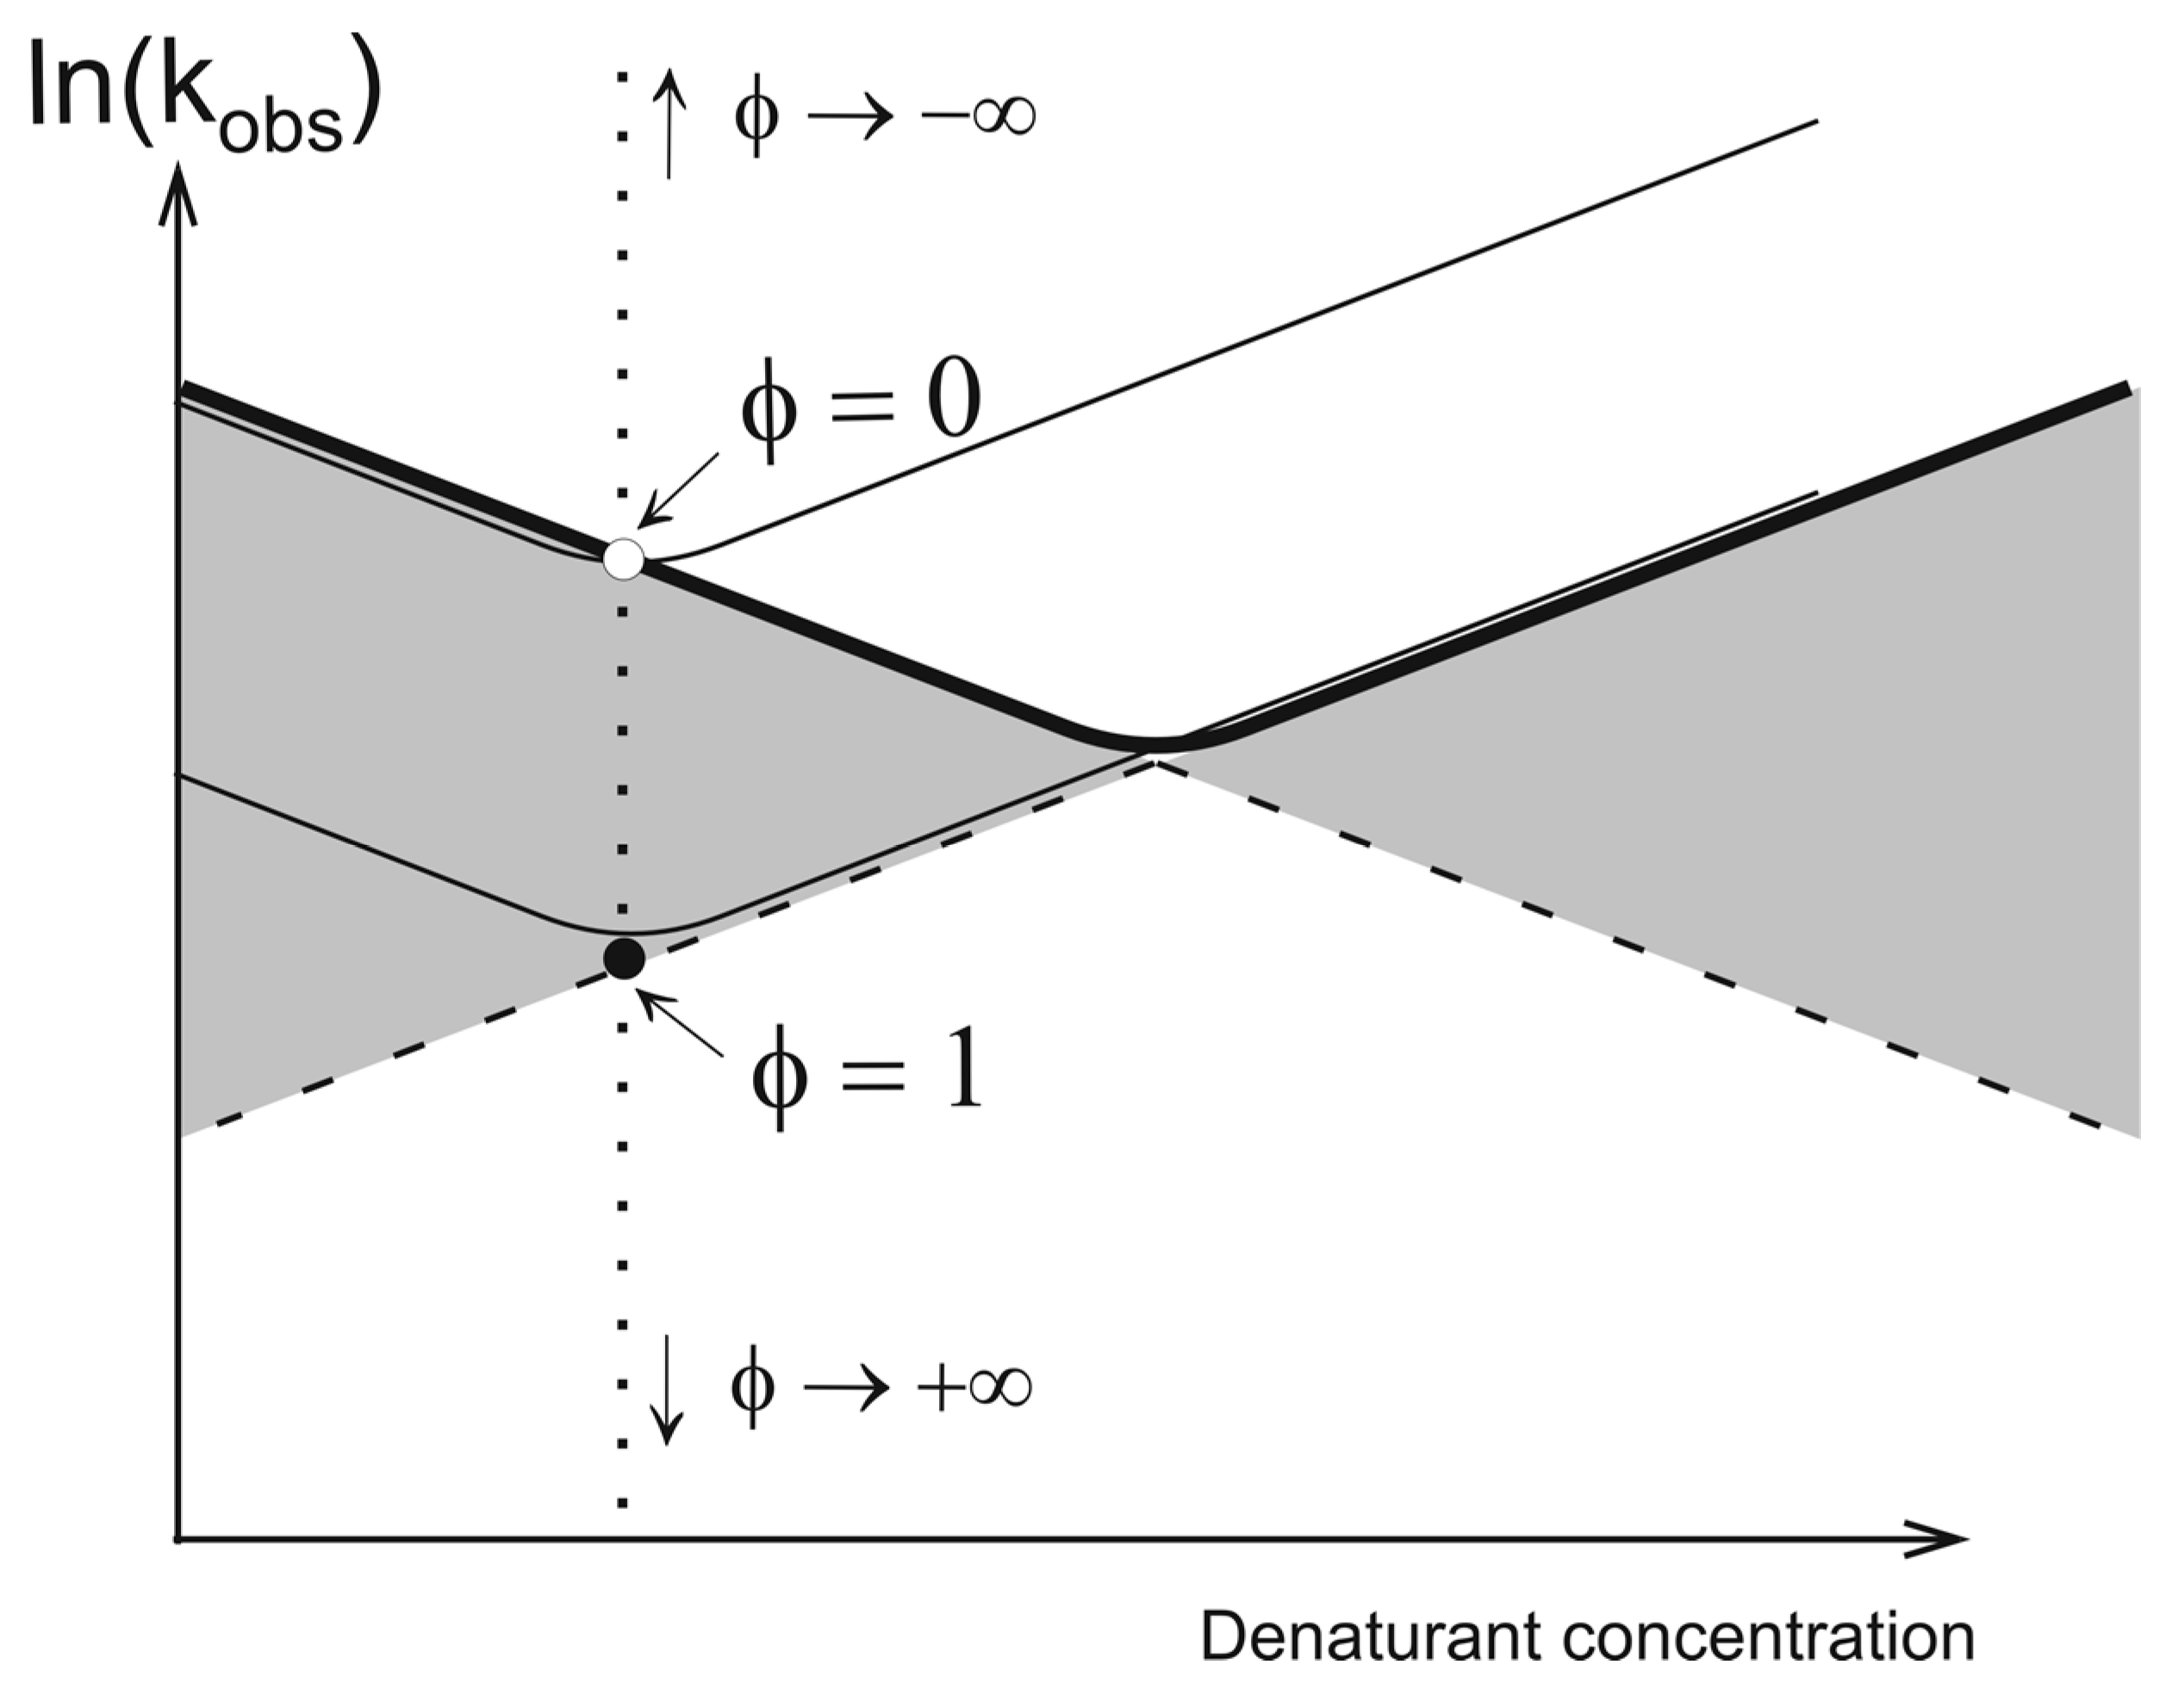
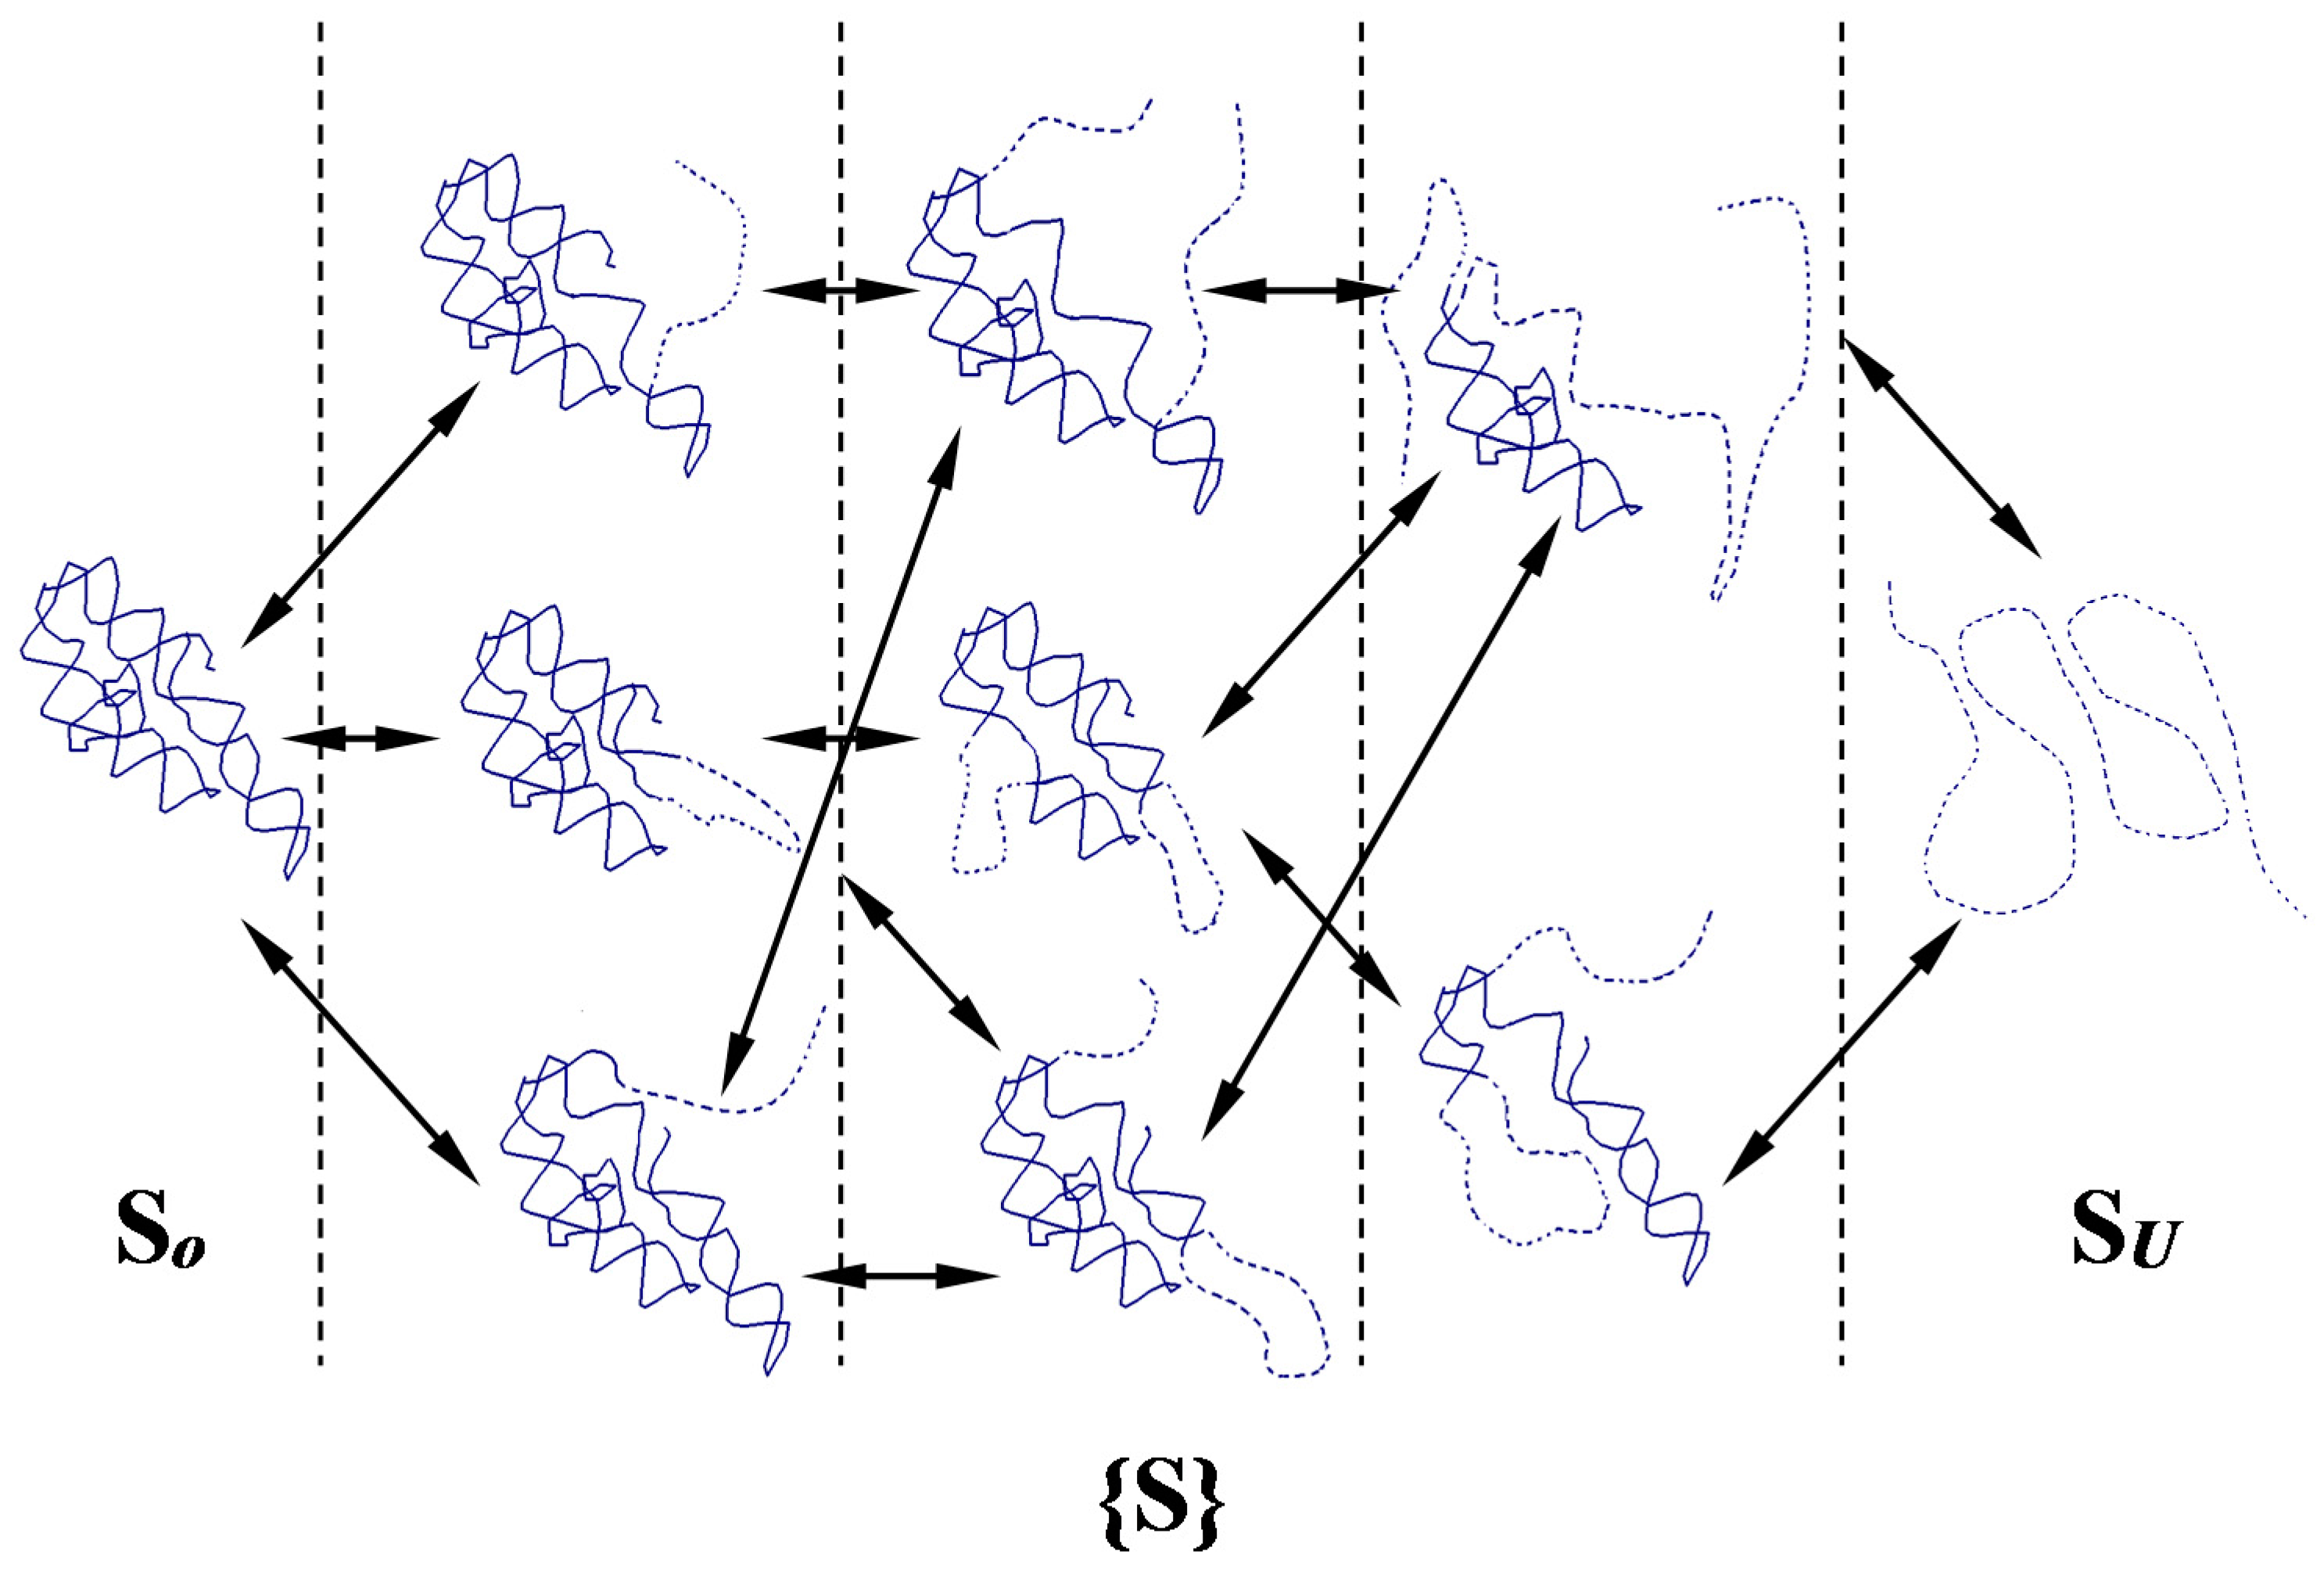
2.2. Network of Folding/Unfolding Pathways and the Point of Thermodynamic Equilibrium
2.3. Estimation of Free Energy and Calculation of Folding Nuclei
3. Results and Discussion
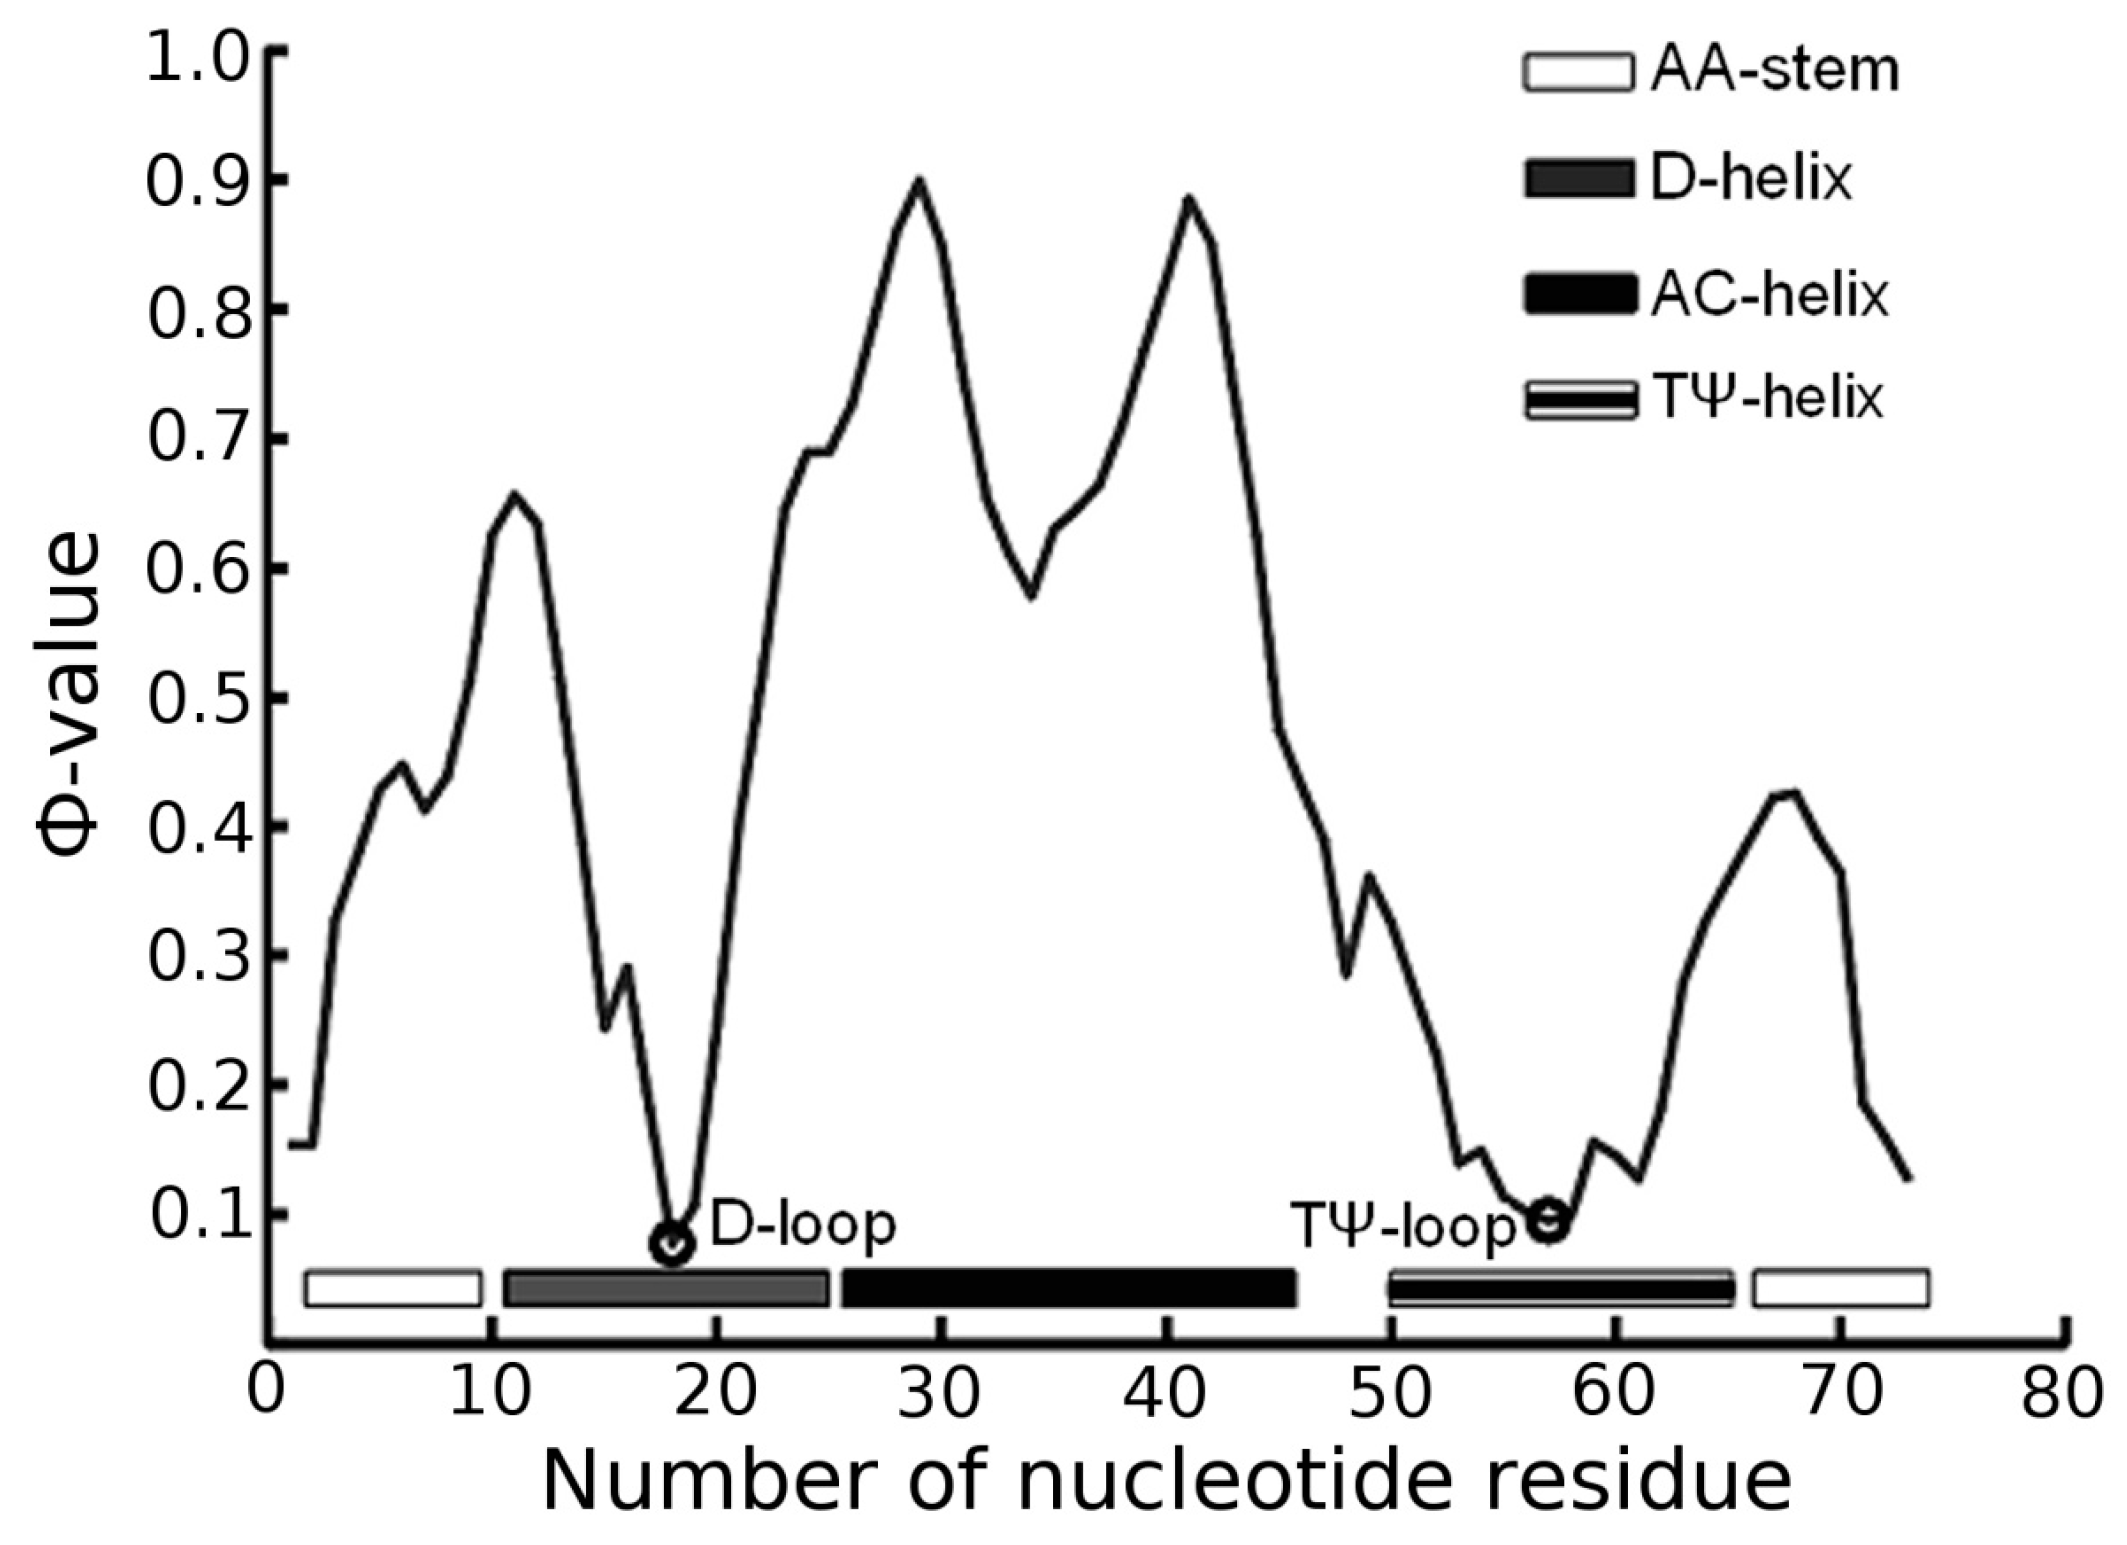
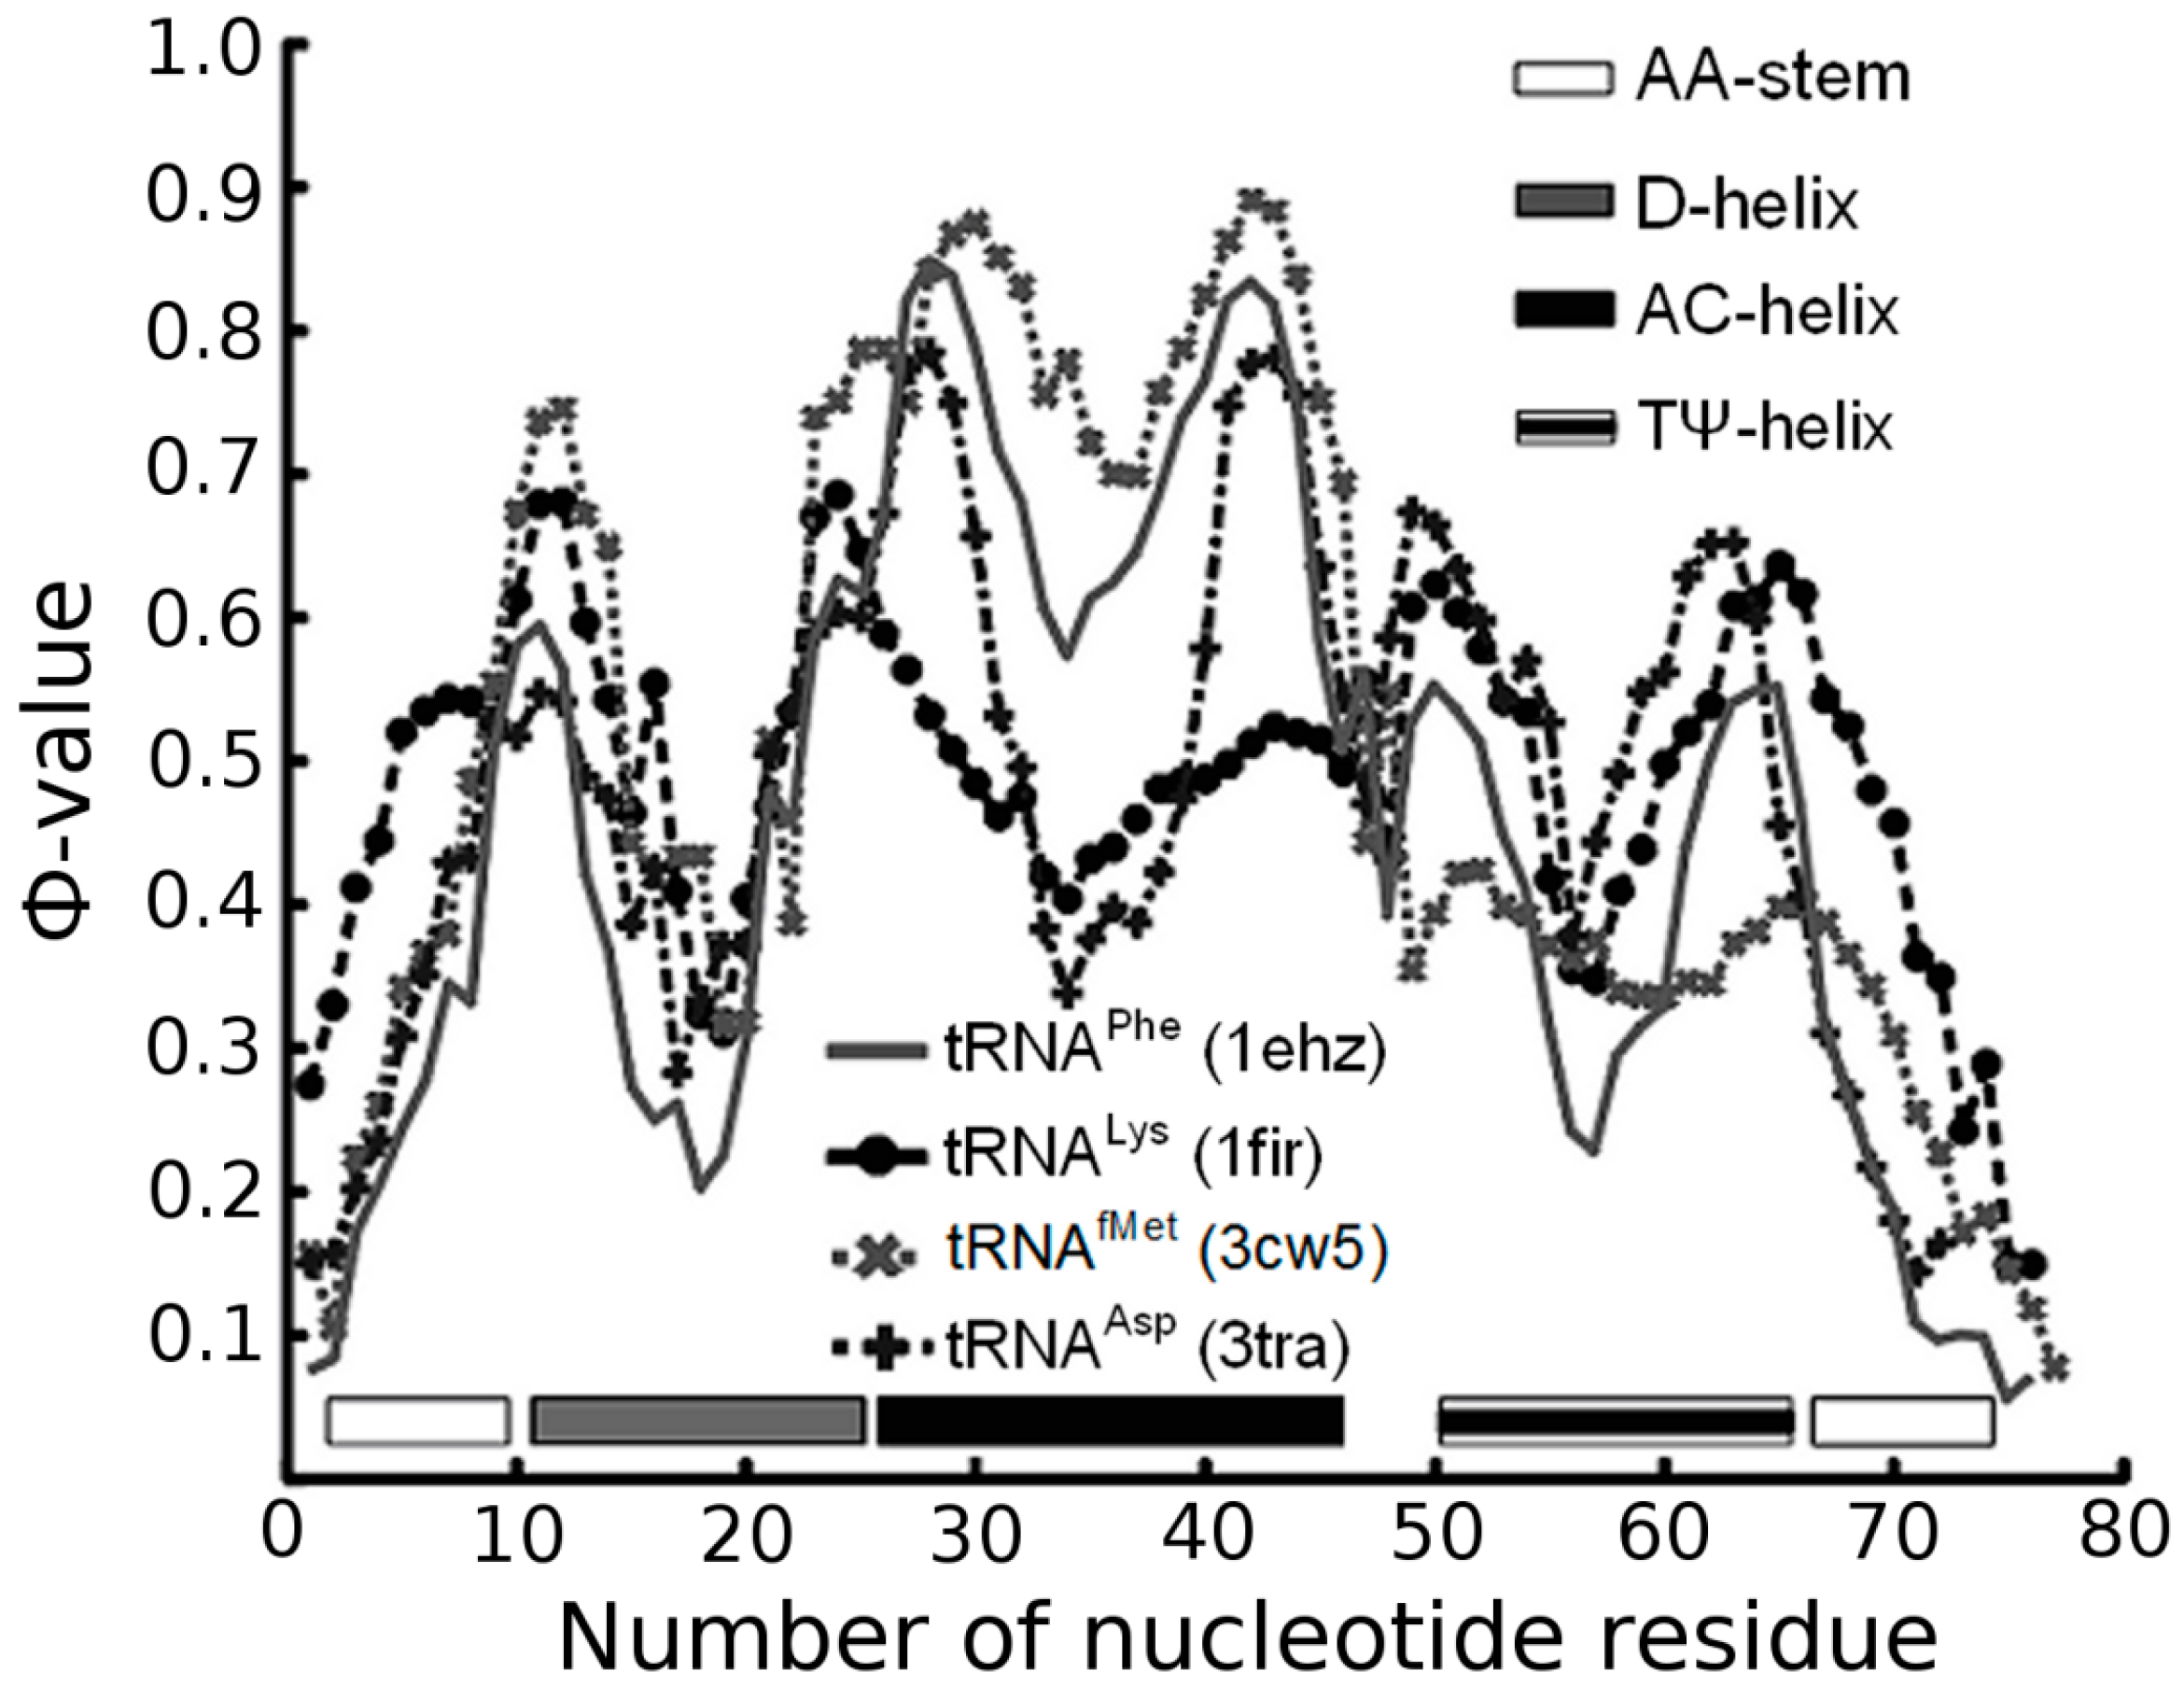
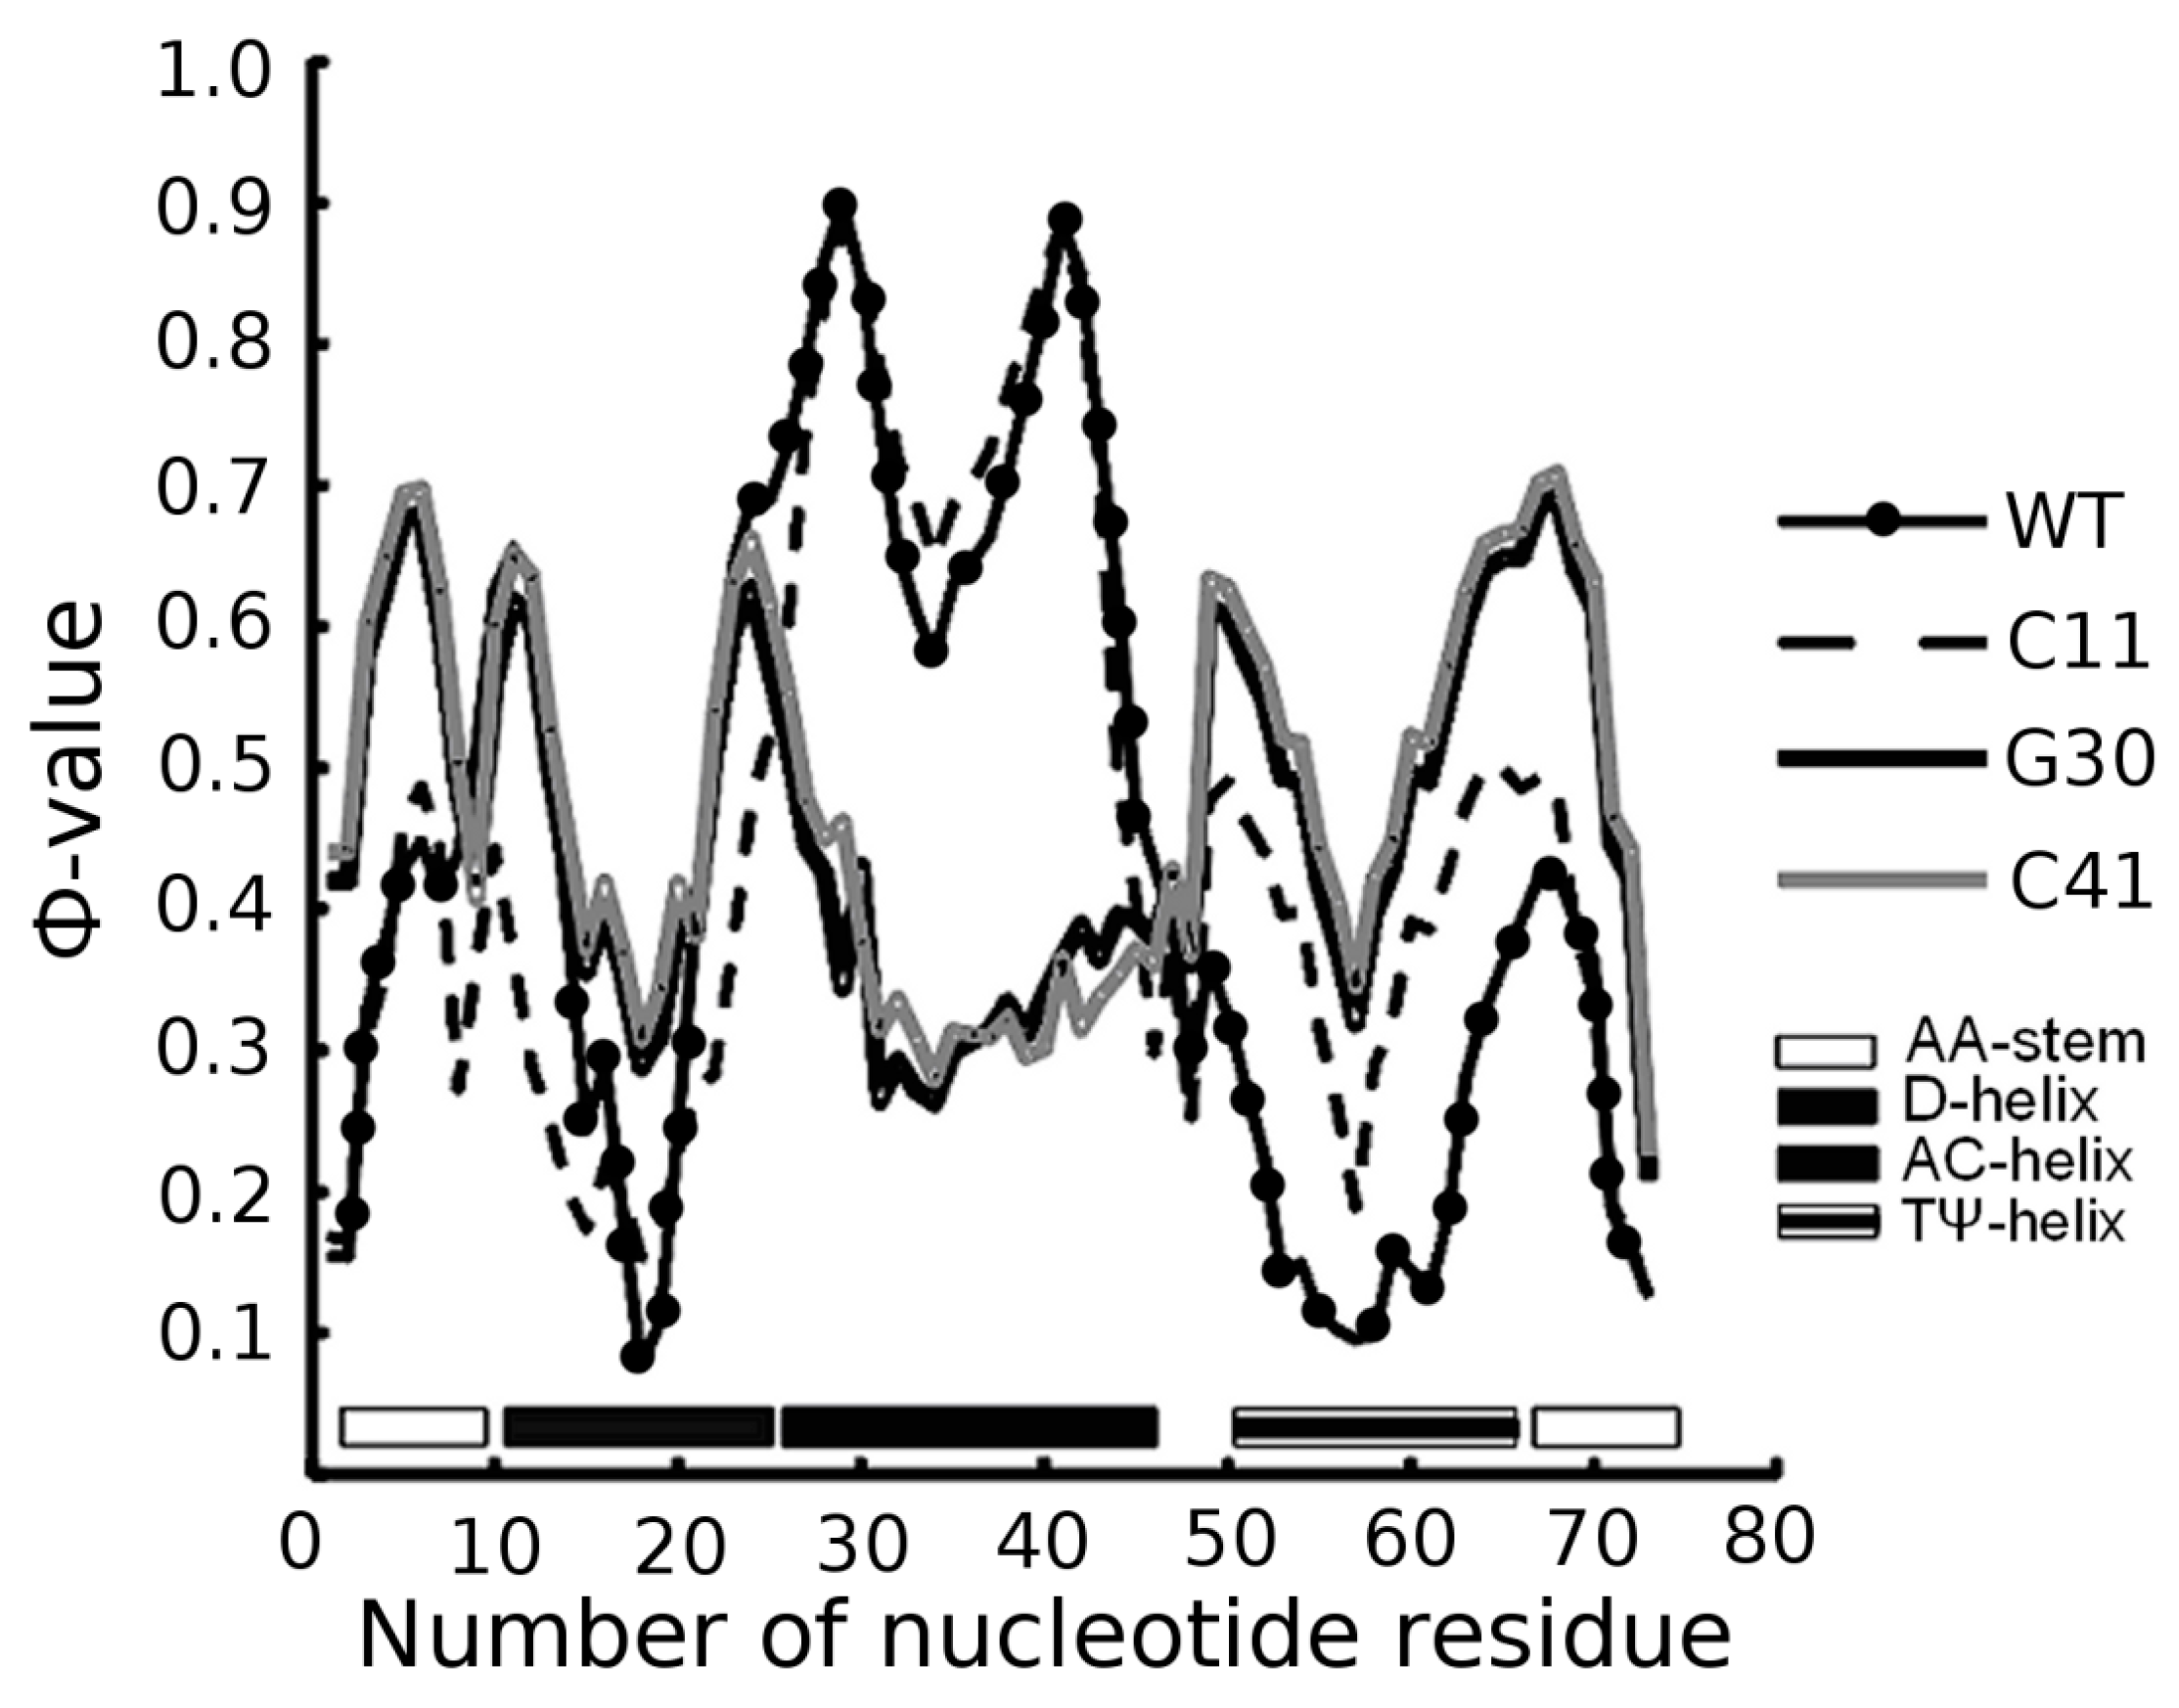
3.1. Prediction of Folding Nuclei for tRNAs


| PDB Code (Resolution) | Name and Origin | Energy Components (kcal/mol) | Number of Interactions | |||||
|---|---|---|---|---|---|---|---|---|
| Complete Energy of Molecule | Hydrogen Bonds | Stacking Interactions | Hydrophobic Interactions | Number of Hydrogen Bonds | Number of Stacking Interactions | Number of Hydrophobic Interactions | ||
| 1EHZ (1.93 Å) | Yeast tRNAPhe | −127.2 | −31.4 | −59.4 | −36.4 | 22 | 99 | 90 |
| 1FIR (3.3 Å) | Bovine tRNALys | −116.62 | −21.82 | −60.0 | −34.8 | 20 | 100 | 86 |
| 3CW5 (3.1 Å) | E. coli tRNAfMet | −116.75 | −17.75 | −67.8 | −31.2 | 19 | 113 | 77 |
| 3L0U (3 Å) | E. coli tRNAPhe (unmodified) | −116.1 | −29.9 | −58.2 | −28.0 | 22 | 97 | 69 |
| 3TRA (3 Å) | Yeast tRNAAsp | −116.43 | −25.43 | −57.0 | −34.0 | 23 | 95 | 84 |
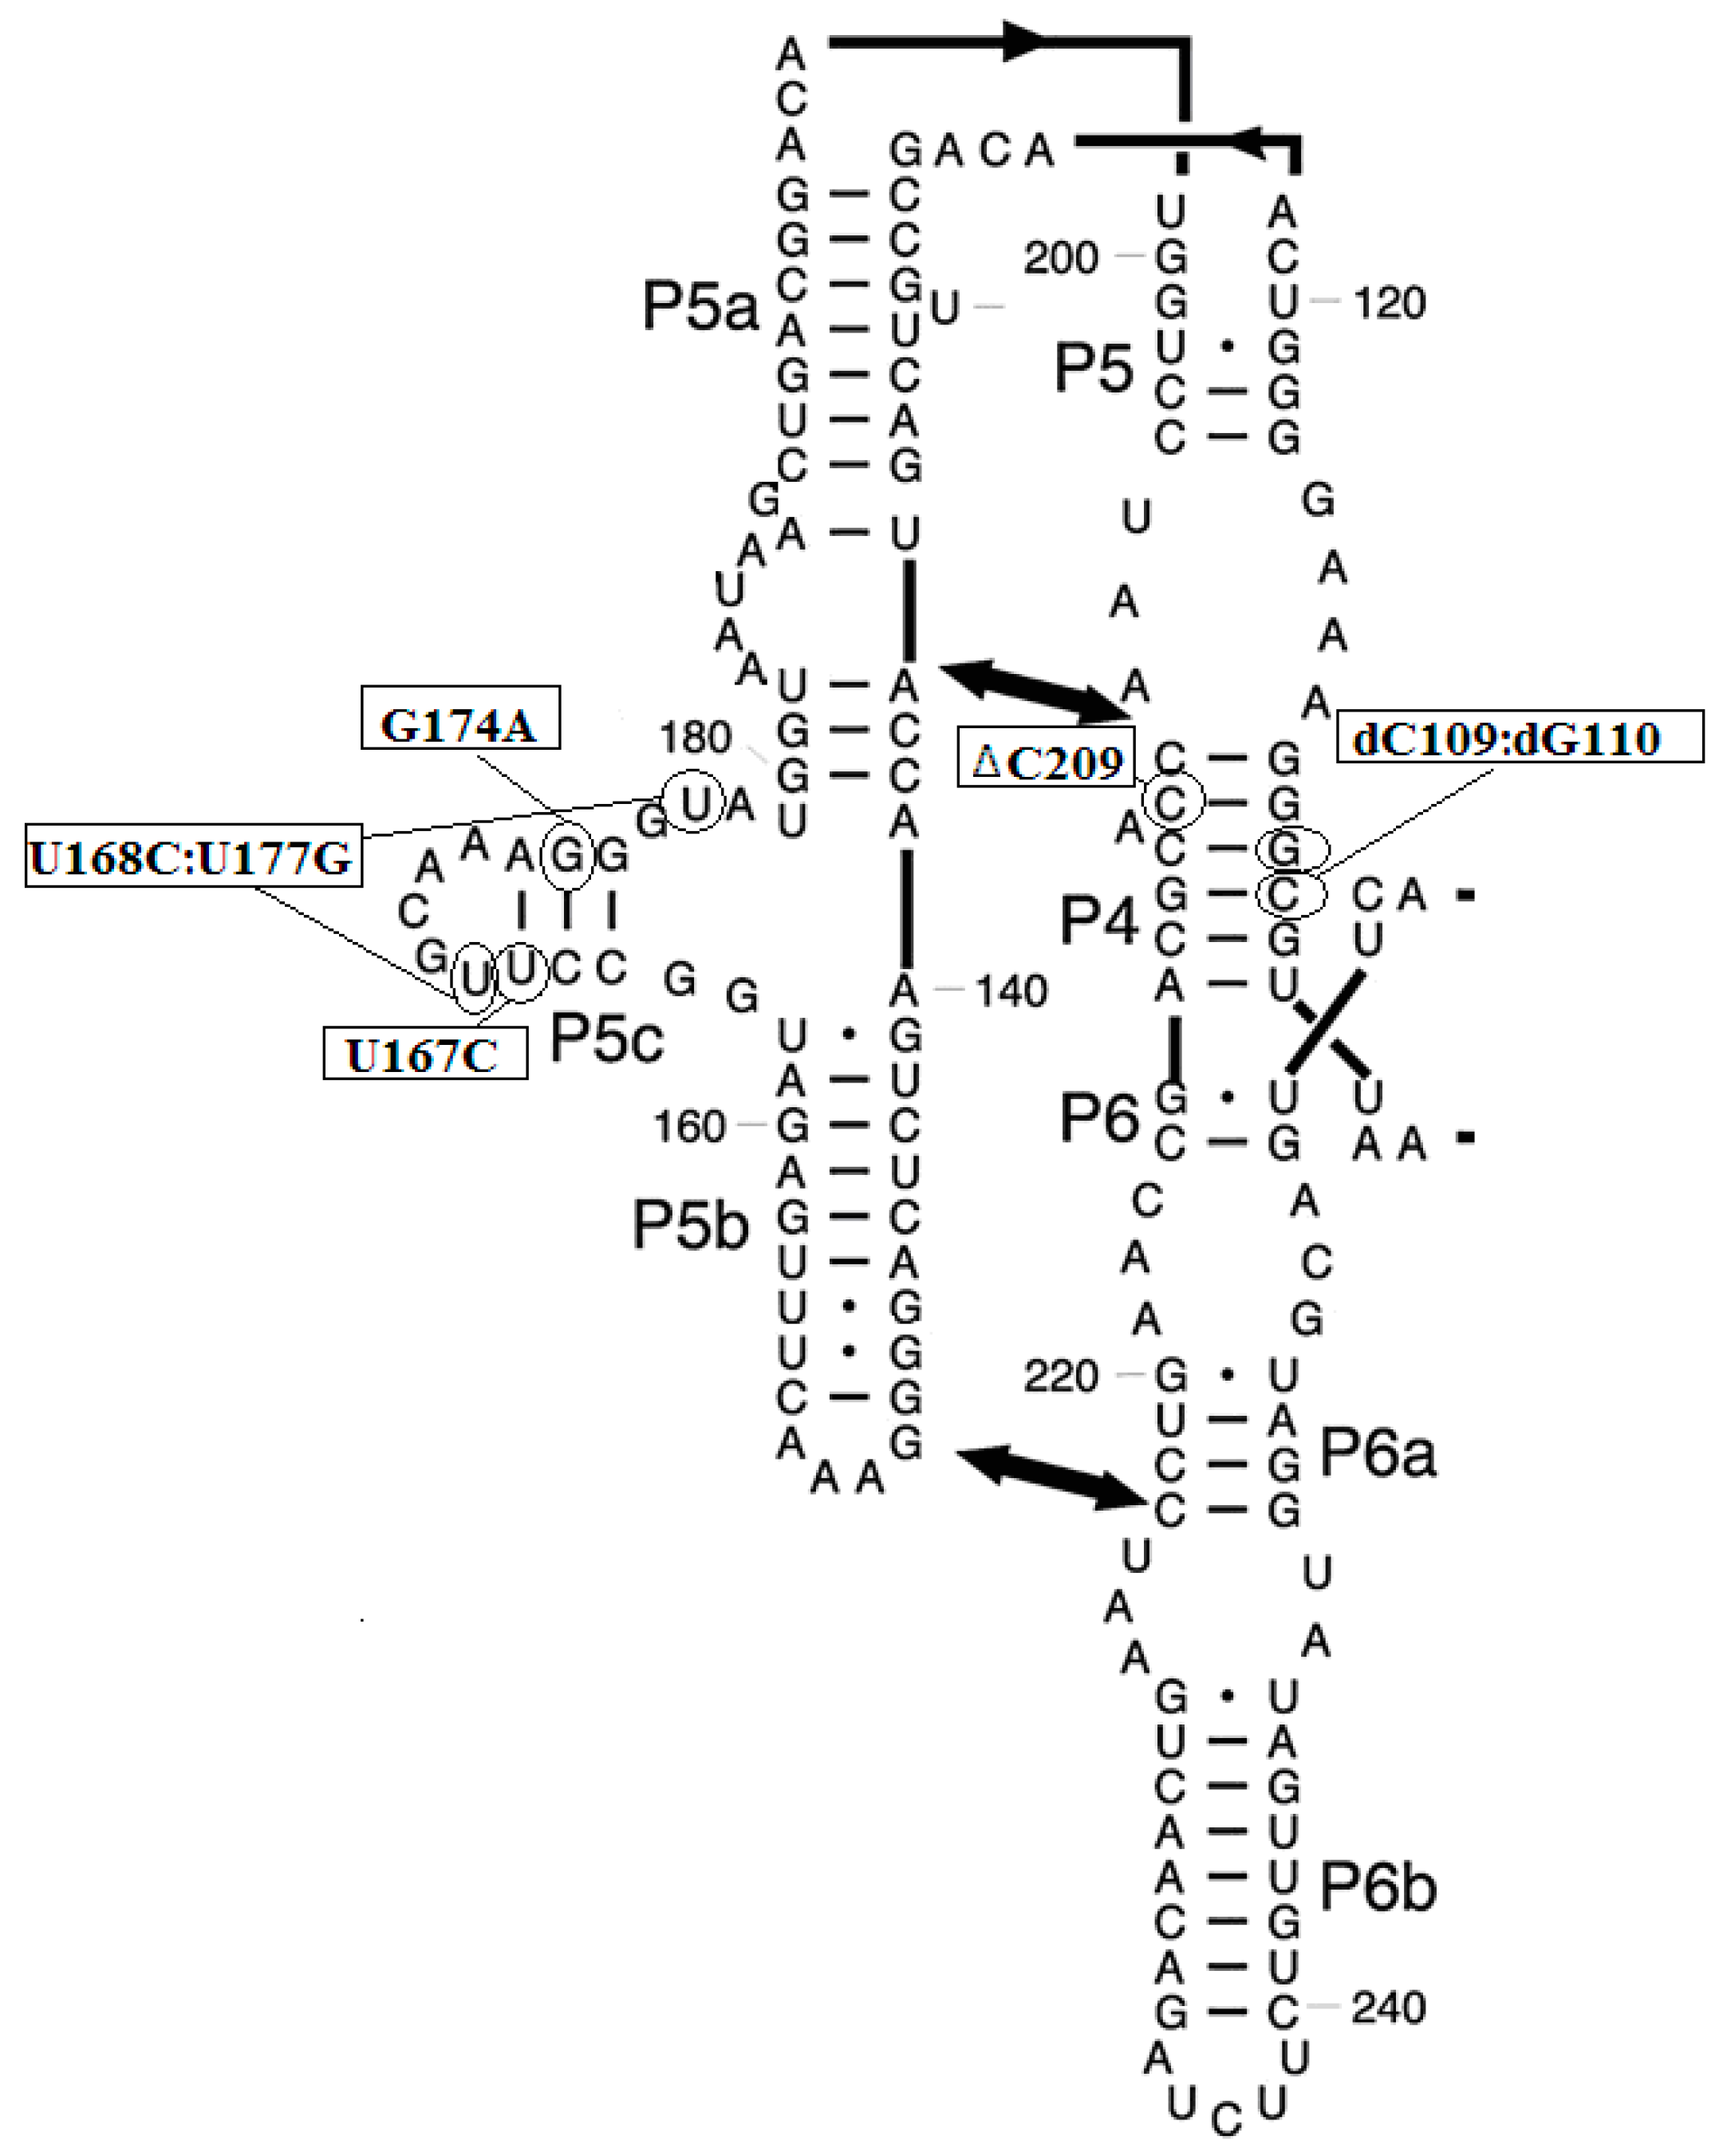
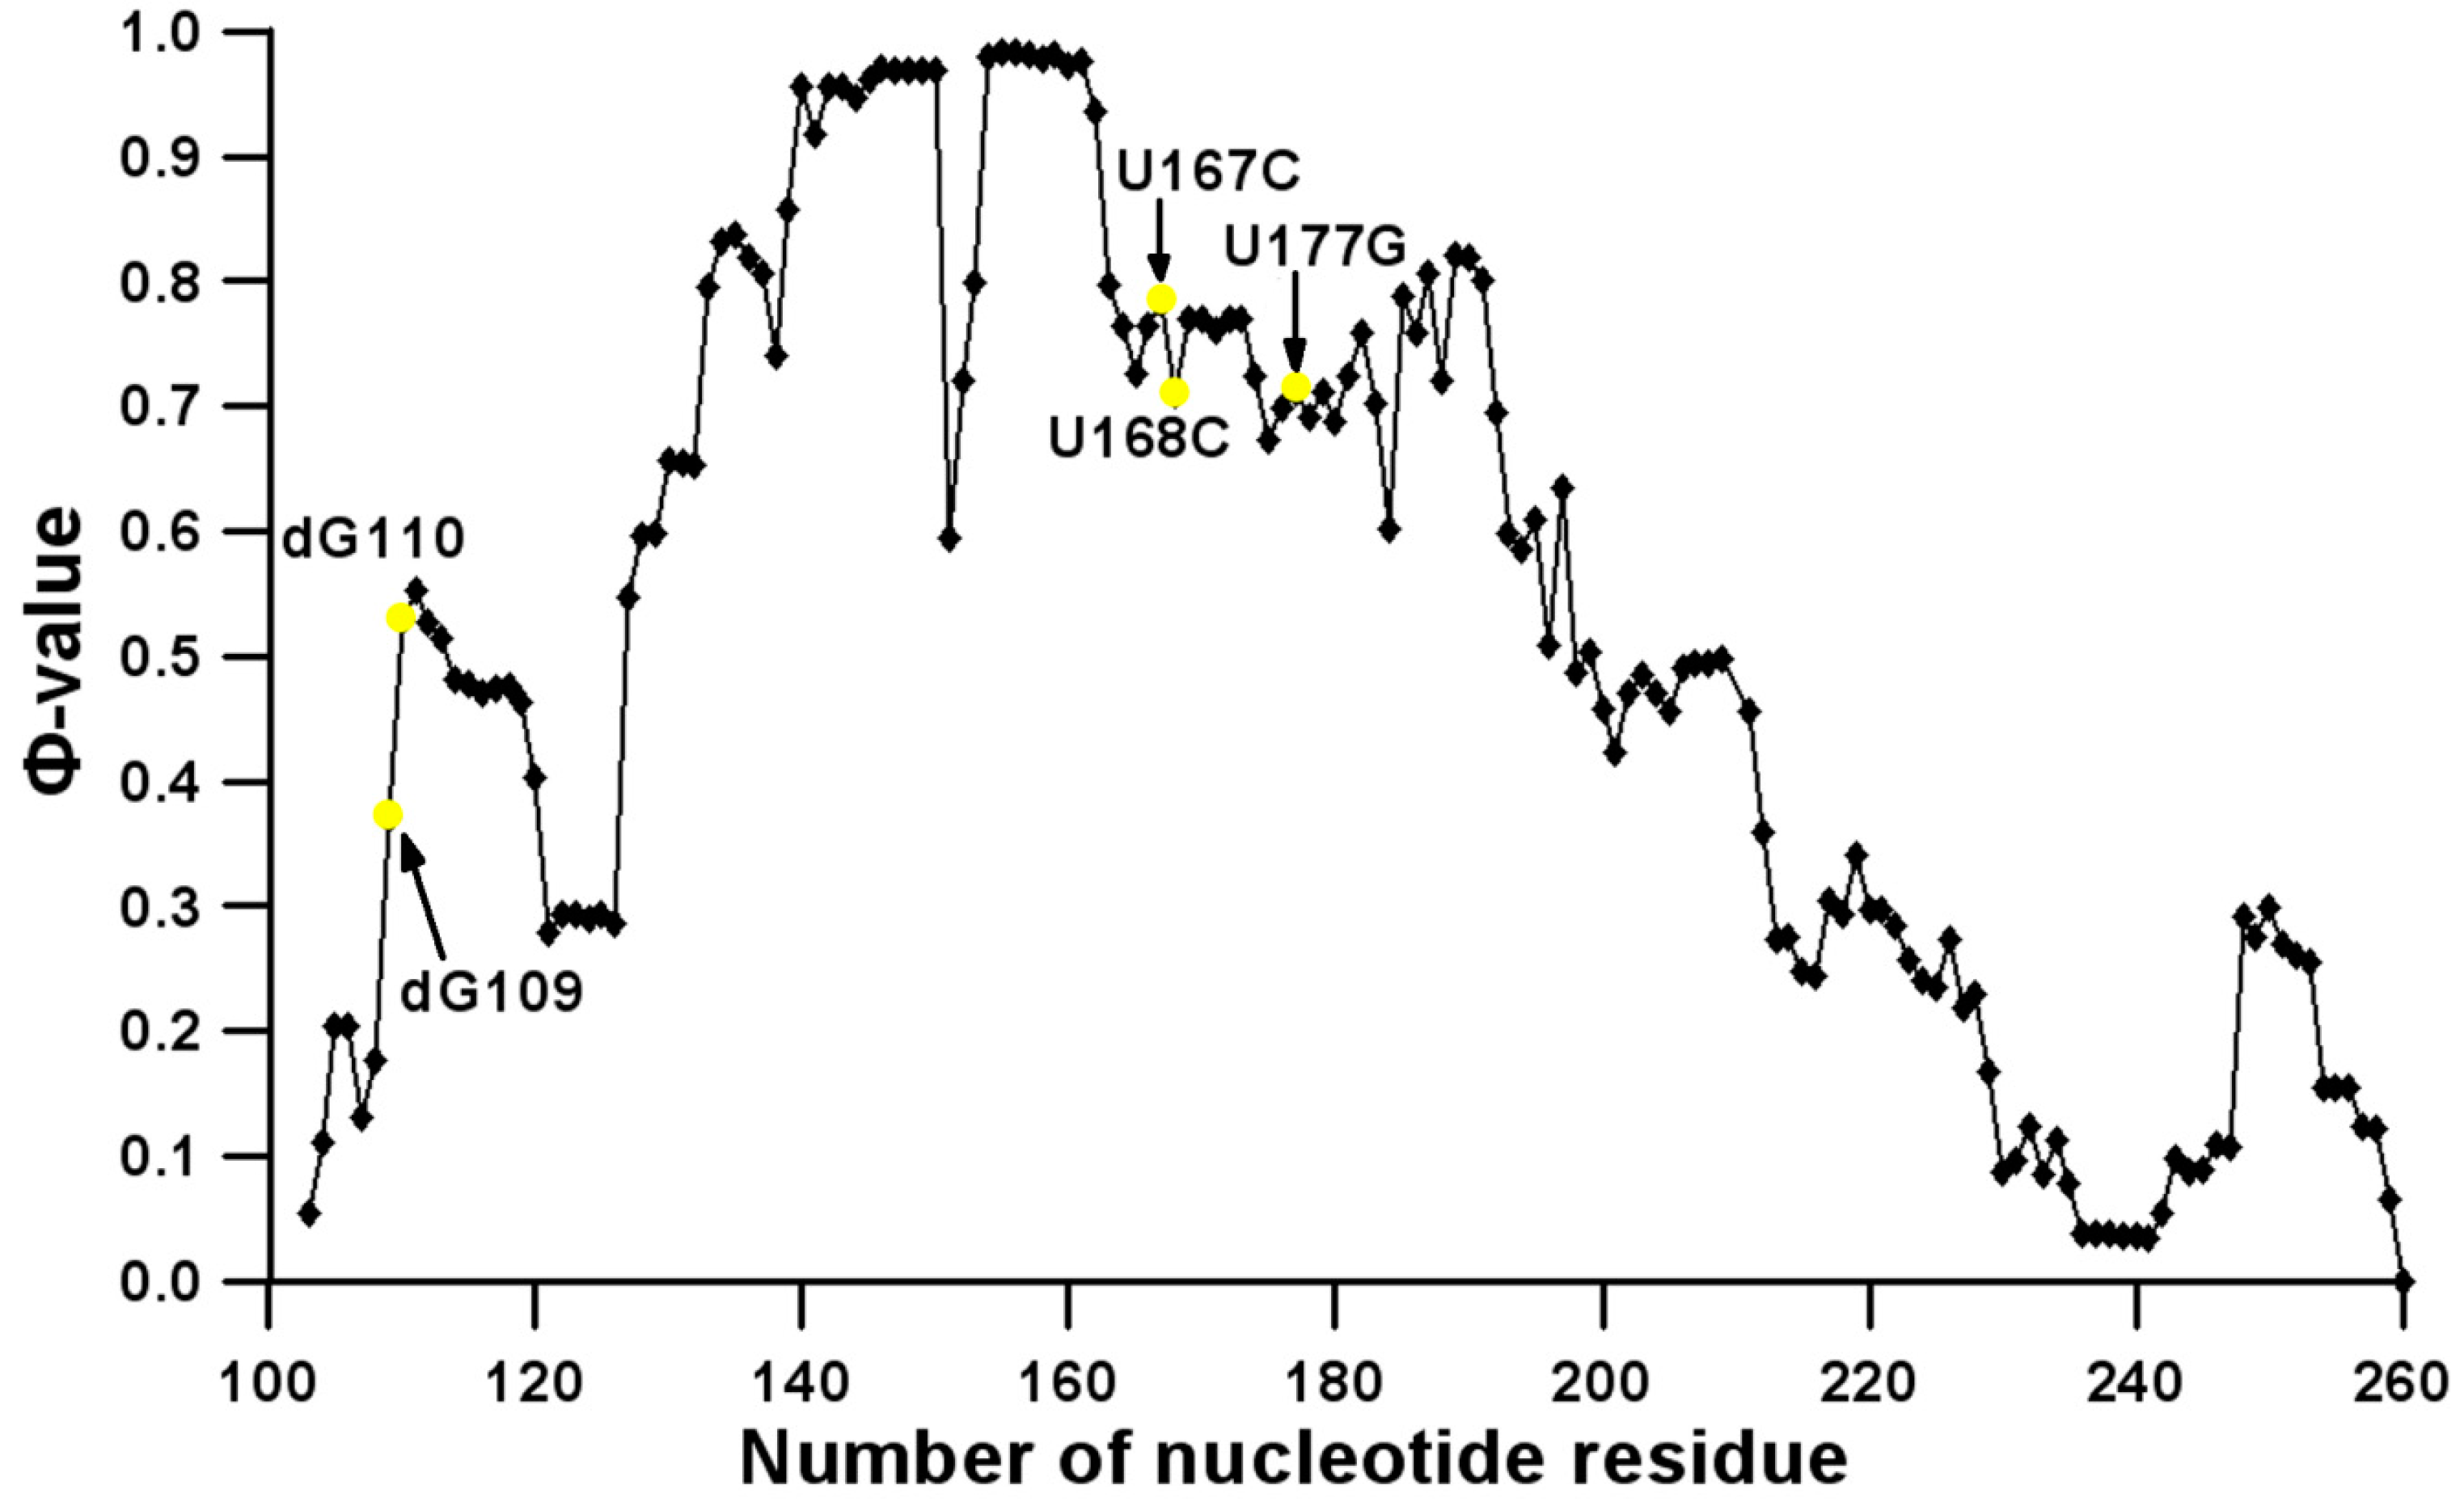
3.2. Prediction of Folding Nuclei for Domain P4-P6 from the Tetrahymena thermophila Ribozyme First Group Intron


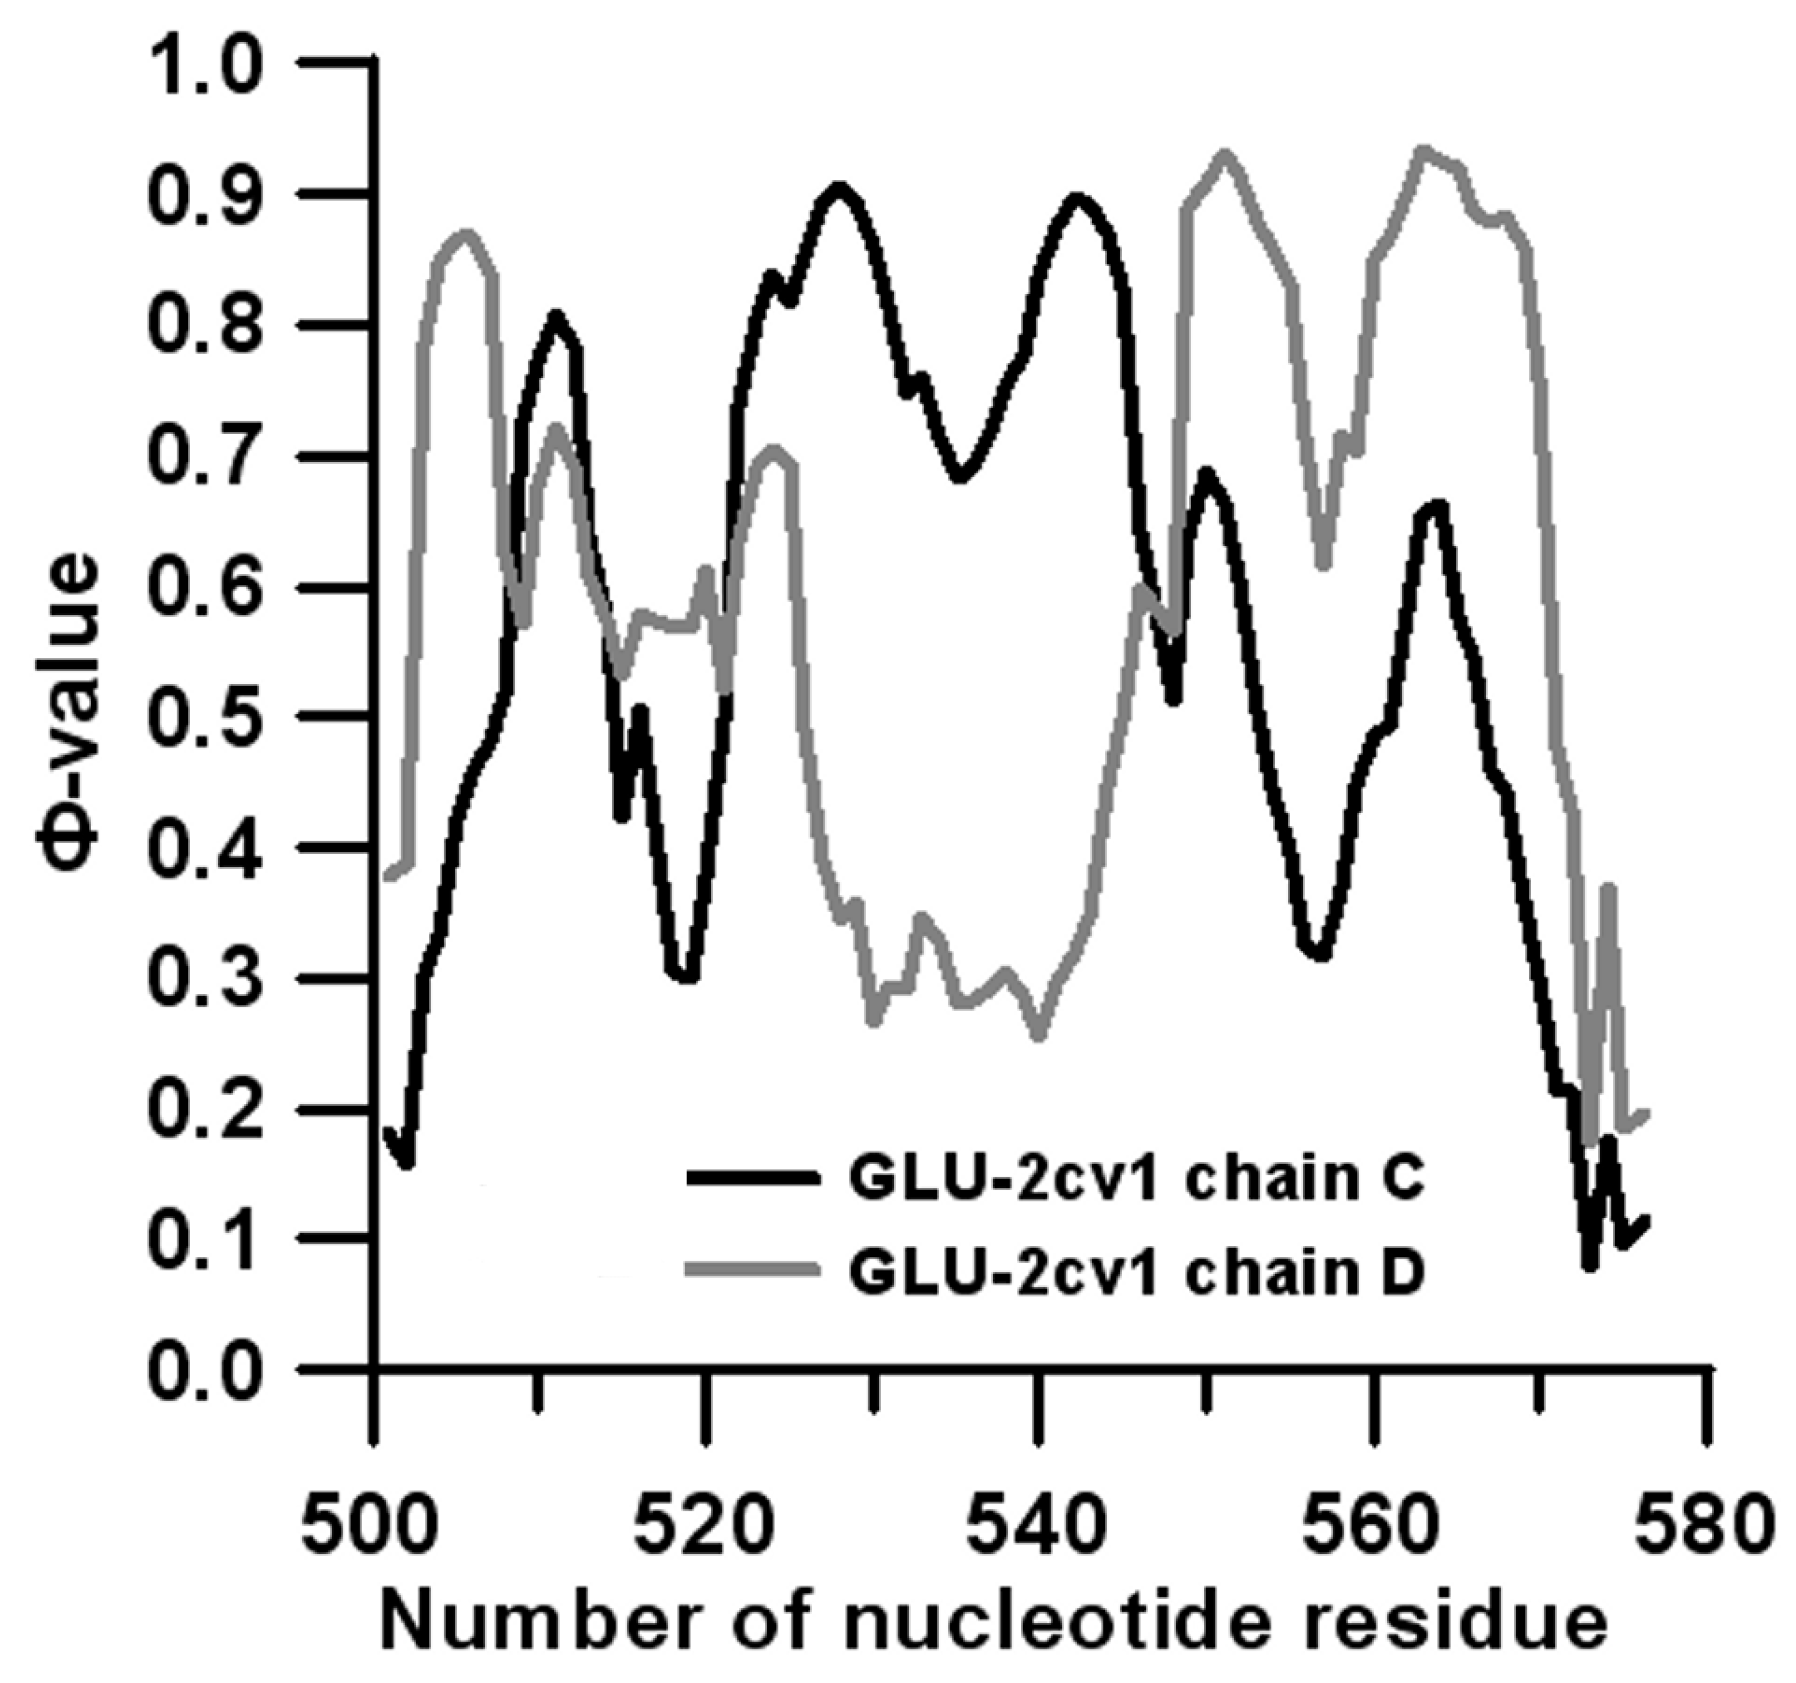
3.3. Prediction of Folding Nuclei for RNA Structures with Hairpin and Pseudoknots
| PDB Entry | Name | -value Profile | 3D Structure of Molecule |
|---|---|---|---|
| 2ap0 (NMR) | C27A SUGARCANE YELLOW LEAF VIRUS RNA PSEUDOKNOT | 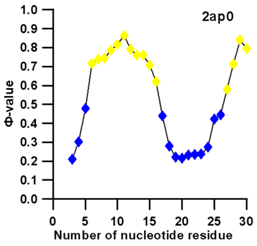 | 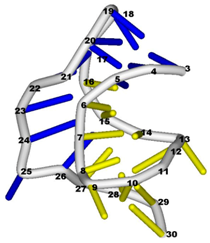 |
| 1e95 (NMR) | SOLUTION STRUCTURE OF THE PSEUDOKNOT OF SRV-1 RNA, INVOLVED IN RIBOSOMAL FRAMESHIFTING | 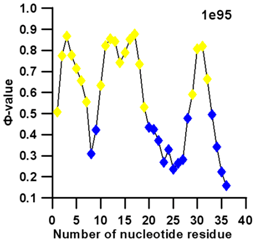 | 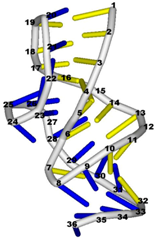 |
| 1aqo (NMR) | IRON RESPONSIVE ELEMENT RNA HAIRPIN | 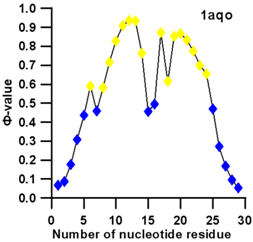 | 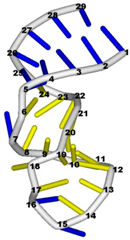 |
| 1bn0 (NMR) | SL3 HAIRPIN FROM THE PACKAGING SIGNAL OF HIV-1 | 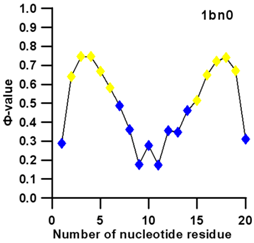 |  |
4. Conclusions
Acknowledgments
Author Contributions
Conflicts of Interest
References
- Woodson, S.A. Compact intermediates in RNA folding. Annu. Rev. Biophys. 2010, 39, 61–77. [Google Scholar] [CrossRef] [PubMed]
- Lee, M.-K.; Gal, M.; Frydman, L.; Varani, G. Real-time multidimensional NMR follows RNA folding with second resolution. Proc. Natl. Acad. Sci. USA 2010, 107, 9192–9197. [Google Scholar] [CrossRef] [PubMed]
- Sali, A.; Shakhnovich, E.; Karplus, M. Kinetics of protein folding. A lattice model study of the requirements for folding to the native state. J. Mol. Biol. 1994, 235, 1614–1636. [Google Scholar] [PubMed]
- Socci, N.D.; Onuchic, J.N. Kinetic and thermodynamic analysis of proteinlike heteropolymers: Monte Carlo histogram technique. J. Chem. Phys. 1995, 103, 4732–4744. [Google Scholar] [CrossRef]
- Galzitskaya, O.V.; Finkelstein, A.V. Folding of chains with random and edited sequences: Similarities and differences. Protein Eng. 1995, 8, 883–892. [Google Scholar] [CrossRef] [PubMed]
- Galzitskaya, O.V.; Finkelstein, A.V. A theoretical search for folding/unfolding nuclei in three-dimensional protein structures. Proc. Natl. Acad. Sci. USA 1999, 96, 11299–11304. [Google Scholar] [CrossRef] [PubMed]
- Matouschek, A.; Kellis, J.T.; Serrano, L.; Bycroft, M.; Fersht, A.R. Transient folding intermediates characterized by protein engineering. Nature 1990, 346, 440–445. [Google Scholar] [CrossRef] [PubMed]
- Matouschek, A.; Kellis, J.T.; Serrano, L.; Fersht, A.R. Mapping the transition state and pathway of protein folding by protein engineering. Nature 1989, 340, 122–126. [Google Scholar] [CrossRef] [PubMed]
- Fersht, A.R. Transition-state structure as a unifying basis in protein-folding mechanisms: Contact order, chain topology, stability, and the extended nucleus mechanism. Proc. Natl. Acad. Sci. USA 2000, 97, 1525–1529. [Google Scholar] [CrossRef] [PubMed]
- Fersht, A.R.; Matouschek, A.; Serrano, L. The folding of an enzyme. I. Theory of protein engineering analysis of stability and pathway of protein folding. J. Mol. Biol. 1992, 224, 771–782. [Google Scholar] [CrossRef]
- Fernández-Escamilla, A.M.; Cheung, M.S.; Vega, M.C.; Wilmanns, M.; Onuchic, J.N.; Serrano, L. Solvation in protein folding analysis: Combination of theoretical and experimental approaches. Proc. Natl. Acad. Sci. USA 2004, 101, 2834–2839. [Google Scholar] [CrossRef] [PubMed]
- Sato, S.; Fersht, A.R. Searching for multiple folding pathways of a nearly symmetrical protein: Temperature dependent phi-value analysis of the B domain of protein A. J. Mol. Biol. 2007, 372, 254–267. [Google Scholar] [CrossRef] [PubMed]
- Alm, E.; Baker, D. Prediction of protein-folding mechanisms from free-energy landscapes derived from native structures. Proc. Natl. Acad. Sci. USA 1999, 96, 11305–11310. [Google Scholar] [CrossRef] [PubMed]
- Muñoz, V.; Eaton, W.A. A simple model for calculating the kinetics of protein folding from three-dimensional structures. Proc. Natl. Acad. Sci. USA 1999, 96, 11311–11316. [Google Scholar] [CrossRef] [PubMed]
- Maglott, E.J.; Goodwin, J.T.; Glick, G.D. Probing the Structure of an RNA Tertiary Unfolding Transition State. J. Am. Chem. Soc. 1999, 121, 7461–7462. [Google Scholar] [CrossRef]
- Silverman, S.K.; Cech, T.R. An early transition state for folding of the P4-P6 RNA domain. RNA 2001, 7, 161–166. [Google Scholar] [CrossRef] [PubMed]
- Kim, J.; Shin, J.-S. Probing the transition state for nucleic acid hybridization using phi-value analysis. Biochemistry 2010, 49, 3420–3426. [Google Scholar] [CrossRef] [PubMed]
- Hammond, G.S. A Correlation of Reaction Rates. J. Am. Chem. Soc. 1955, 77, 334–338. [Google Scholar] [CrossRef]
- Matouschek, A.; Fersht, A.R. Application of physical organic chemistry to engineered mutants of proteins: Hammond postulate behavior in the transition state of protein folding. Proc. Natl. Acad. Sci. USA 1993, 90, 7814–7818. [Google Scholar] [CrossRef] [PubMed]
- Fersht, A. Structure and Mechanism in Protein Science: A Guide to Enzyme Catalysis and Protein Folding; W.H. Freeman: New York, NY, USA, 1999. [Google Scholar]
- Förster, T. Zwischenmolekulare Energiewanderung und Fluoreszenz. Ann. Phys. 1948, 437, 55–75. [Google Scholar] [CrossRef]
- Svergun, D.I.; Feĭgin, L.A.; Taylor, G.W. Structure Analysis by Small-angle X-ray and Neutron Scattering; Plenum Press: New York, NY, USA, 1987. [Google Scholar]
- Merino, E.J.; Wilkinson, K.A.; Coughlan, J.L.; Weeks, K.M. RNA structure analysis at single nucleotide resolution by selective 2′-hydroxyl acylation and primer extension (SHAPE). J. Am. Chem. Soc. 2005, 127, 4223–4231. [Google Scholar] [CrossRef] [PubMed]
- Wilkinson, K.A.; Merino, E.J.; Weeks, K.M. RNA SHAPE chemistry reveals nonhierarchical interactions dominate equilibrium structural transitions in tRNA(Asp) transcripts. J. Am. Chem. Soc. 2005, 127, 4659–4667. [Google Scholar] [CrossRef] [PubMed]
- Pereyaslavets, L.B.; Baranov, M.V.; Leonova, E.I.; Galzitskaya, O.V. Prediction of folding nuclei in tRNA molecules. Biochemistry 2011, 76, 236–244. [Google Scholar] [CrossRef] [PubMed]
- Pereyaslavets, L.B.; Sokolovsky, I.V.; Galzitskaya, O.V. FoldNucleus: Web server for the prediction of RNA and protein folding nuclei from their 3D structures. Bioinformatics 2015, 31, 3374–3376. [Google Scholar] [CrossRef] [PubMed]
- De Gennes, P.G. Statistics of branching and hairpin helices for the dAT copolymer. Biopolymers 1968, 6, 715–729. [Google Scholar] [CrossRef] [PubMed]
- Gutin, A.M.; Galzitskaia, O.V. [Helix-coil transition in the simplest model of large native RNA. I. Consideration of only native helices]. Biofizika 1993, 38, 84–92. [Google Scholar] [PubMed]
- Galzitskaia, O.V. [Effect of the energy of distant contacts on the time of finding the native structure for RNA-like heteropolymers]. Mol. Biol. 1997, 31, 488–491. [Google Scholar]
- Galzitskaya, O.V. Geometrical factor and physical reasons for its influence on the kinetic and thermodynamic properties of RNA-like heteropolymers. Fold. Des. 1997, 2, 193–201. [Google Scholar] [CrossRef]
- Zuker, M.; Stiegler, P. Optimal computer folding of large RNA sequences using thermodynamics and auxiliary information. Nucleic Acids Res. 1981, 9, 133–148. [Google Scholar] [CrossRef] [PubMed]
- McCaskill, J.S. The equilibrium partition function and base pair binding probabilities for RNA secondary structure. Biopolymers 1990, 29, 1105–1119. [Google Scholar] [CrossRef] [PubMed]
- Schuster, P.; Fontana, W.; Stadler, P.F.; Hofacker, I.L. From sequences to shapes and back: A case study in RNA secondary structures. Proc. Biol. Sci. 1994, 255, 279–284. [Google Scholar] [CrossRef] [PubMed]
- Rivas, E.; Eddy, S.R. A dynamic programming algorithm for RNA structure prediction including pseudoknots. J. Mol. Biol. 1999, 285, 2053–2068. [Google Scholar] [CrossRef] [PubMed]
- Sato, K.; Kato, Y.; Hamada, M.; Akutsu, T.; Asai, K. IPknot: Fast and accurate prediction of RNA secondary structures with pseudoknots using integer programming. Bioinformatics 2011, 27, i85–i93. [Google Scholar] [CrossRef] [PubMed]
- Ding, F.; Sharma, S.; Chalasani, P.; Demidov, V.V.; Broude, N.E.; Dokholyan, N.V. Ab initio RNA folding by discrete molecular dynamics: From structure prediction to folding mechanisms. RNA 2008, 14, 1164–1173. [Google Scholar] [CrossRef] [PubMed]
- Denesyuk, N.A.; Thirumalai, D. Coarse-Grained Model for Predicting RNA Folding Thermodynamics. J. Phys. Chem. B 2013, 117, 4901–4911. [Google Scholar] [CrossRef] [PubMed]
- Mathews, D.H.; Sabina, J.; Zuker, M.; Turner, D.H. Expanded sequence dependence of thermodynamic parameters improves prediction of RNA secondary structure. J. Mol. Biol. 1999, 288, 911–940. [Google Scholar] [CrossRef] [PubMed]
- Bernstein, F.C.; Koetzle, T.F.; Williams, G.J.; Meyer, E.F.; Brice, M.D.; Rodgers, J.R.; Kennard, O.; Shimanouchi, T.; Tasumi, M. The Protein Data Bank. A computer-based archival file for macromolecular structures. Eur. J. Biochem. FEBS 1977, 80, 319–324. [Google Scholar] [CrossRef]
- Jacobson, H.; Stockmayer, W.H. Intramolecular Reaction in Polycondensations. I. The Theory of Linear Systems. J. Chem. Phys. 1950, 18, 1600–1606. [Google Scholar] [CrossRef]
- Dawson, W.; Yamamoto, K.; Kawai, G. A new entropy model for RNA: Part I. A critique of the standard Jacobson-Stockmayer model applied to multiple cross links. J. Nucleic Acids Investig. 2012, 3, 3. [Google Scholar] [CrossRef]
- Finkel’shteĭn, A.V.; Badretdinov, A.I. [Physical reasons for rapid self-organization of a stable spatial protein structure: Solution of the Levinthal paradox]. Mol. Biol. 1997, 31, 469–477. [Google Scholar]
- Caliskan, G.; Hyeon, C.; Perez-Salas, U.; Briber, R.M.; Woodson, S.A.; Thirumalai, D. Persistence length changes dramatically as RNA folds. Phys. Rev. Lett. 2005, 95, 268303. [Google Scholar] [CrossRef] [PubMed]
- Dawson, W.; Yamamoto, K.; Shimizu, K.; Kawai, G. A new entropy model for RNA: Part II. Persistence-related entropic contributions to RNA secondary structure free energy calculations. J. Nucleic Acids Investig. 2013, 4, 2. [Google Scholar] [CrossRef]
- Shen, N.; Guo, L.; Yang, B.; Jin, Y.; Ding, J. Structure of human tryptophanyl-tRNA synthetase in complex with tRNATrp reveals the molecular basis of tRNA recognition and specificity. Nucleic Acids Res. 2006, 34, 3246–3258. [Google Scholar] [CrossRef] [PubMed]
- Eiler, S.; Dock-Bregeon, A.; Moulinier, L.; Thierry, J.C.; Moras, D. Synthesis of aspartyl-tRNA(Asp) in Escherichia coli—A snapshot of the second step. EMBO J. 1999, 18, 6532–6541. [Google Scholar] [CrossRef] [PubMed]
- Galzitskaia, O.V. [Sensitivity of the folding pathway to the details of amino acid sequence]. Mol. Biol. 2001, 36, 386–390. [Google Scholar]
- Semrad, K.; Green, R.; Schroeder, R. RNA chaperone activity of large ribosomal subunit proteins from Escherichia coli. RNA 2004, 10, 1855–1860. [Google Scholar] [CrossRef] [PubMed]
- Adams, P.L.; Stahley, M.R.; Kosek, A.B.; Wang, J.; Strobel, S.A. Crystal structure of a self-splicing group I intron with both exons. Nature 2004, 430, 45–50. [Google Scholar] [CrossRef] [PubMed]
- Bartley, L.E.; Zhuang, X.; Das, R.; Chu, S.; Herschlag, D. Exploration of the transition state for tertiary structure formation between an RNA helix and a large structured RNA. J. Mol. Biol. 2003, 328, 1011–1026. [Google Scholar] [CrossRef]
- Deras, M.L.; Brenowitz, M.; Ralston, C.Y.; Chance, M.R.; Woodson, S.A. Folding mechanism of the Tetrahymena ribozyme P4-P6 domain. Biochemistry 2000, 39, 10975–10985. [Google Scholar] [CrossRef] [PubMed]
- Greenfeld, M.; Solomatin, S.V.; Herschlag, D. Removal of covalent heterogeneity reveals simple folding behavior for P4-P6 RNA. J. Biol. Chem. 2011, 286, 19872–19879. [Google Scholar] [CrossRef] [PubMed]
- Orden, A.V.; Jung, J. Review fluorescence correlation spectroscopy for probing the kinetics and mechanisms of DNA hairpin formation. Biopolymers 2008, 89, 1–16. [Google Scholar] [CrossRef] [PubMed]
- Ma, H.; Proctor, D.J.; Kierzek, E.; Kierzek, R.; Bevilacqua, P.C.; Gruebele, M. Exploring the energy landscape of a small RNA hairpin. J. Am. Chem. Soc. 2006, 128, 1523–1530. [Google Scholar] [CrossRef] [PubMed]
- Sánchez, I.E.; Kiefhaber, T. Origin of unusual phi-values in protein folding: Evidence against specific nucleation sites. J. Mol. Biol. 2003, 334, 1077–1085. [Google Scholar] [CrossRef] [PubMed]
- Juneau, K.; Cech, T.R. In vitro selection of RNAs with increased tertiary structure stability. RNA 1999, 5, 1119–1129. [Google Scholar] [CrossRef] [PubMed]
- Silverman, S.K.; Zheng, M.; Wu, M.; Tinoco, I.; Cech, T.R. Quantifying the energetic interplay of RNA tertiary and secondary structure interactions. RNA 1999, 5, 1665–1674. [Google Scholar] [CrossRef] [PubMed]
- Staple, D.W.; Butcher, S.E. Pseudoknots: RNA structures with diverse functions. PLoS Biol. 2005, 3. [Google Scholar] [CrossRef] [PubMed]
- Ivankov, D.N.; Finkelstein, A.V. Protein folding as flow across a network of folding-unfolding pathways. 1. The mid-transition case. J. Phys. Chem. B 2010, 114, 7920–7929. [Google Scholar] [CrossRef] [PubMed]
- Taketomi, H.; Ueda, Y.; Gō, N. Studies on protein folding, unfolding and fluctuations by computer simulation. I. The effect of specific amino acid sequence represented by specific inter-unit interactions. Int. J. Pept. Protein Res. 1975, 7, 445–459. [Google Scholar] [CrossRef] [PubMed]
- Pereyaslavets, L.B.; Sokolovsky, I.V.; Galzitskaya, O.V. FoldNucleus: Web server for the prediction of RNA and protein folding nuclei from their 3D structures. Bioinformatics 2015, 31, 3374–3376. [Google Scholar] [CrossRef] [PubMed]
© 2015 by the authors; licensee MDPI, Basel, Switzerland. This article is an open access article distributed under the terms and conditions of the Creative Commons Attribution license (http://creativecommons.org/licenses/by/4.0/).
Share and Cite
Pereyaslavets, L.B.; Galzitskaya, O.V. Theoretical Search for RNA Folding Nuclei. Entropy 2015, 17, 7827-7847. https://doi.org/10.3390/e17117827
Pereyaslavets LB, Galzitskaya OV. Theoretical Search for RNA Folding Nuclei. Entropy. 2015; 17(11):7827-7847. https://doi.org/10.3390/e17117827
Chicago/Turabian StylePereyaslavets, Leonid B., and Oxana V. Galzitskaya. 2015. "Theoretical Search for RNA Folding Nuclei" Entropy 17, no. 11: 7827-7847. https://doi.org/10.3390/e17117827
APA StylePereyaslavets, L. B., & Galzitskaya, O. V. (2015). Theoretical Search for RNA Folding Nuclei. Entropy, 17(11), 7827-7847. https://doi.org/10.3390/e17117827