Article

Application of a Modified Entropy Computational Method in Assessing the Complexity of Pulse Wave Velocity Signals in Healthy and Diabetic Subjects

1
Graduate Institute of Communication Engineering, National Taiwan University, Taipei 10617, Taiwan
2
Department of Electrical Engineering, National Dong Hwa University, Hualien 97401, Taiwan
3
Department of Neurology, Buddhist Tzu Chi General Hospital and Buddhist Tzu Chi University, Hualien 97002, Taiwan
4
Research Center for Adaptive Data Analysis & Center for Dynamical Biomarkers and Translational Medicine, National Central University, Chungli 32001, Taiwan
5
Department of Internal Medicine, Hualien Hospital, Ministry of Health and Welfare, Hualien 97061, Taiwan
6
Department of Emergency Medicine, E-Da Hospital, I-Shou University, Kaohsiung 82445, Taiwan
*
Author to whom correspondence should be addressed.
These authors contributed equally to this paper.
Entropy 2014, 16(7), 4032-4043; https://doi.org/10.3390/e16074032
Submission received: 19 May 2014 / Revised: 2 July 2014 / Accepted: 8 July 2014 / Published: 17 July 2014
(This article belongs to the Special Issue Entropy and Cardiac Physics)

Abstract

:
Using 1000 successive points of a pulse wave velocity (PWV) series, we previously distinguished healthy from diabetic subjects with multi-scale entropy (MSE) using a scale factor of 10. One major limitation is the long time for data acquisition (i.e., 20 min). This study aimed at validating the sensitivity of a novel method, short time MSE (sMSE) that utilized a substantially smaller sample size (i.e., 600 consecutive points), in differentiating the complexity of PWV signals both in simulation and in human subjects that were divided into four groups: healthy young (Group 1; n = 24) and middle-aged (Group 2; n = 30) subjects without known cardiovascular disease and middle-aged individuals with well-controlled (Group 3; n = 18) and poorly-controlled (Group 4; n = 22) diabetes mellitus type 2. The results demonstrated that although conventional MSE could differentiate the subjects using 1000 consecutive PWV series points, sensitivity was lost using only 600 points. Simulation study revealed consistent results. By contrast, the novel sMSE method produced significant differences in entropy in both simulation and testing subjects. In conclusion, this study demonstrated that using a novel sMSE approach for PWV analysis, the time for data acquisition can be substantially reduced to that required for 600 cardiac cycles (∼10 min) with remarkable preservation of sensitivity in differentiating among healthy, aged, and diabetic populations.

Graphical Abstract

1. Introduction

Atherosclerosis, which is the major pathological change underlying most cardiovascular diseases, has been reported to be associated with advanced age, history of stroke, diabetes, hypertension, and cerebrovascular disease. Pulse wave velocity (PWV) is one of the most popular non-invasive parameters used for the assessment of atherosclerosis. Despite the different equipment used for data acquisition, a mean value is usually obtained from the examinee for evaluating the severity of the condition [16]. On the other hand, Costa et al. found healthy subjects and those with heart conditions can be reliably differentiated by a simple measure based on the thermodynamical concept of “entropy” [7]. “Multi-scale entropy (MSE)” is a non-linear means of assessing the complexity of physiological signals [810]. Compared to the traditional complexity measures, MSE has the advantage of being applicable to both physiologic and simulated signals of finite length. MSE, which was first reported by Costa et al. to compare the differences in R-R interval (RRI) among healthy subjects, patients with atrial fibrillation and those with congestive heart failure (CHF) [8], has been successfully applied to the interpretation of physiological series and data from patients with various diseases. One of the advantages of complexity analysis using the MSE method is its ability to deal with non-linear and non-stationary signals [11]. A previous study has reported that area under the MSE curve between scale 6 and 20 can be used to assess disease severity in patients with CHF [12] and patients receiving unilateral primary carotid angioplasty and stenting were reported to exhibit acute increase of complexity in the neurocardiovascular dynamics [13]. In 2006, Escudero et al. reported significant differences in entropy values from signals of electroencephalograms (EEG) of healthy individuals and those with Alzheimer’s disease after data processing with MSE [14]. Accordingly, we have previously shown that healthy, aged, and diabetic subjects can be distinguished with MSE using 1000 successive PWV signals with a scale factor of 10 [11]. Despite being reliable, the whole recording process takes up to 30 min that is usually not well tolerated by aged or diseased subjects [11].
To refine the assessment approach, the present study proposes a novel means of computation, “short time multiscale entropy (sMSE)”, in an attempt to reduce the time for data acquisition through refined computation of the acquired data. To compare between MSE and sMSE in terms of their sensitivity and validity in differentiating signals of small sample size and among healthy, aged, and diabetic subjects, both simulation signals and real PWV data from testing subjects were used for the current study.

2. Methods

2.1. Subject Population and Grouping

The testing subjects were divided into four groups, including healthy young individuals of age between 20 and 40 (Group 1, n = 24), healthy aged subjects of age between 20 to 40 (Group 2, n = 30), middle-aged patients with well-controlled diabetes mellitus type 2 (defined as age between 41 to 80 and 6.5% < glycosylated hemoglobin (HbA1c) level < 8.0%) (Group 3, n = 18), and middle-aged patients with poorly-controlled diabetes mellitus type 2 (defined as age between 41 to 80 with HbA1c level ≥ 8.0%) (Group 4, n = 22). All participants were volunteers. Diabetic patients, who were recruited from the diabetic outpatient clinic of Hualien Hospital from July 2009 to October 2010, fit all the three criteria of: (1) fasting blood sugar > 126 mg/dL, (2) HbA1c level > 6.5%, and (3) established diagnosis of diabetes mellitus type 2 with a follow-up period > 2 years. On the other hand, healthy subjects, who were recruited from the health screening clinic of Hualien Hospital during the same period, had to fill out a questionnaire declaring the absence of medical history of cardiovascular diseases (i.e., stroke, hypertension, diabetes). The whole study has been approved by the Institutional Review Board (IRB) of Hualien Hospital and National Dong Hwa University. Informed consent forms were signed by all testing subjects.

2.2. Measurement Protocol

All subjects were allowed to rest in a supine position in a quiet, temperature-controlled room at 26 ± 1 °C for 5 min before another 20 min of data acquisition. The six-channel ECG-PWV system was used for PWVfoot measurement. The distance from the sternal notch to the foot was the sum of the shortest distance from the sternal notch to medial patella, from medial patella to medial malleolus, and from medial malleolus to the tip of the second toe. Infrared sensors were put on the points of reference simultaneously to acquire data. ECG was obtained using the conventional method. After being processed through an analog-to-digital converter (USB-6009 DAQ, National Instruments, Austin, TX, USA) with a sampling frequency of 500 Hz, the digitized signals were stored in a computer. Because of its conspicuousness, the R wave on Lead II was chosen as a reference point, the time from which to the foot point of a pulse wave was defined as the time difference. Hence, the mean PWVfoot can be determined by averaging the values from both sides. The values of PWVfoot from point of reference within the 1000 cardiac cycles of recording were averaged to a mean value from both feet.

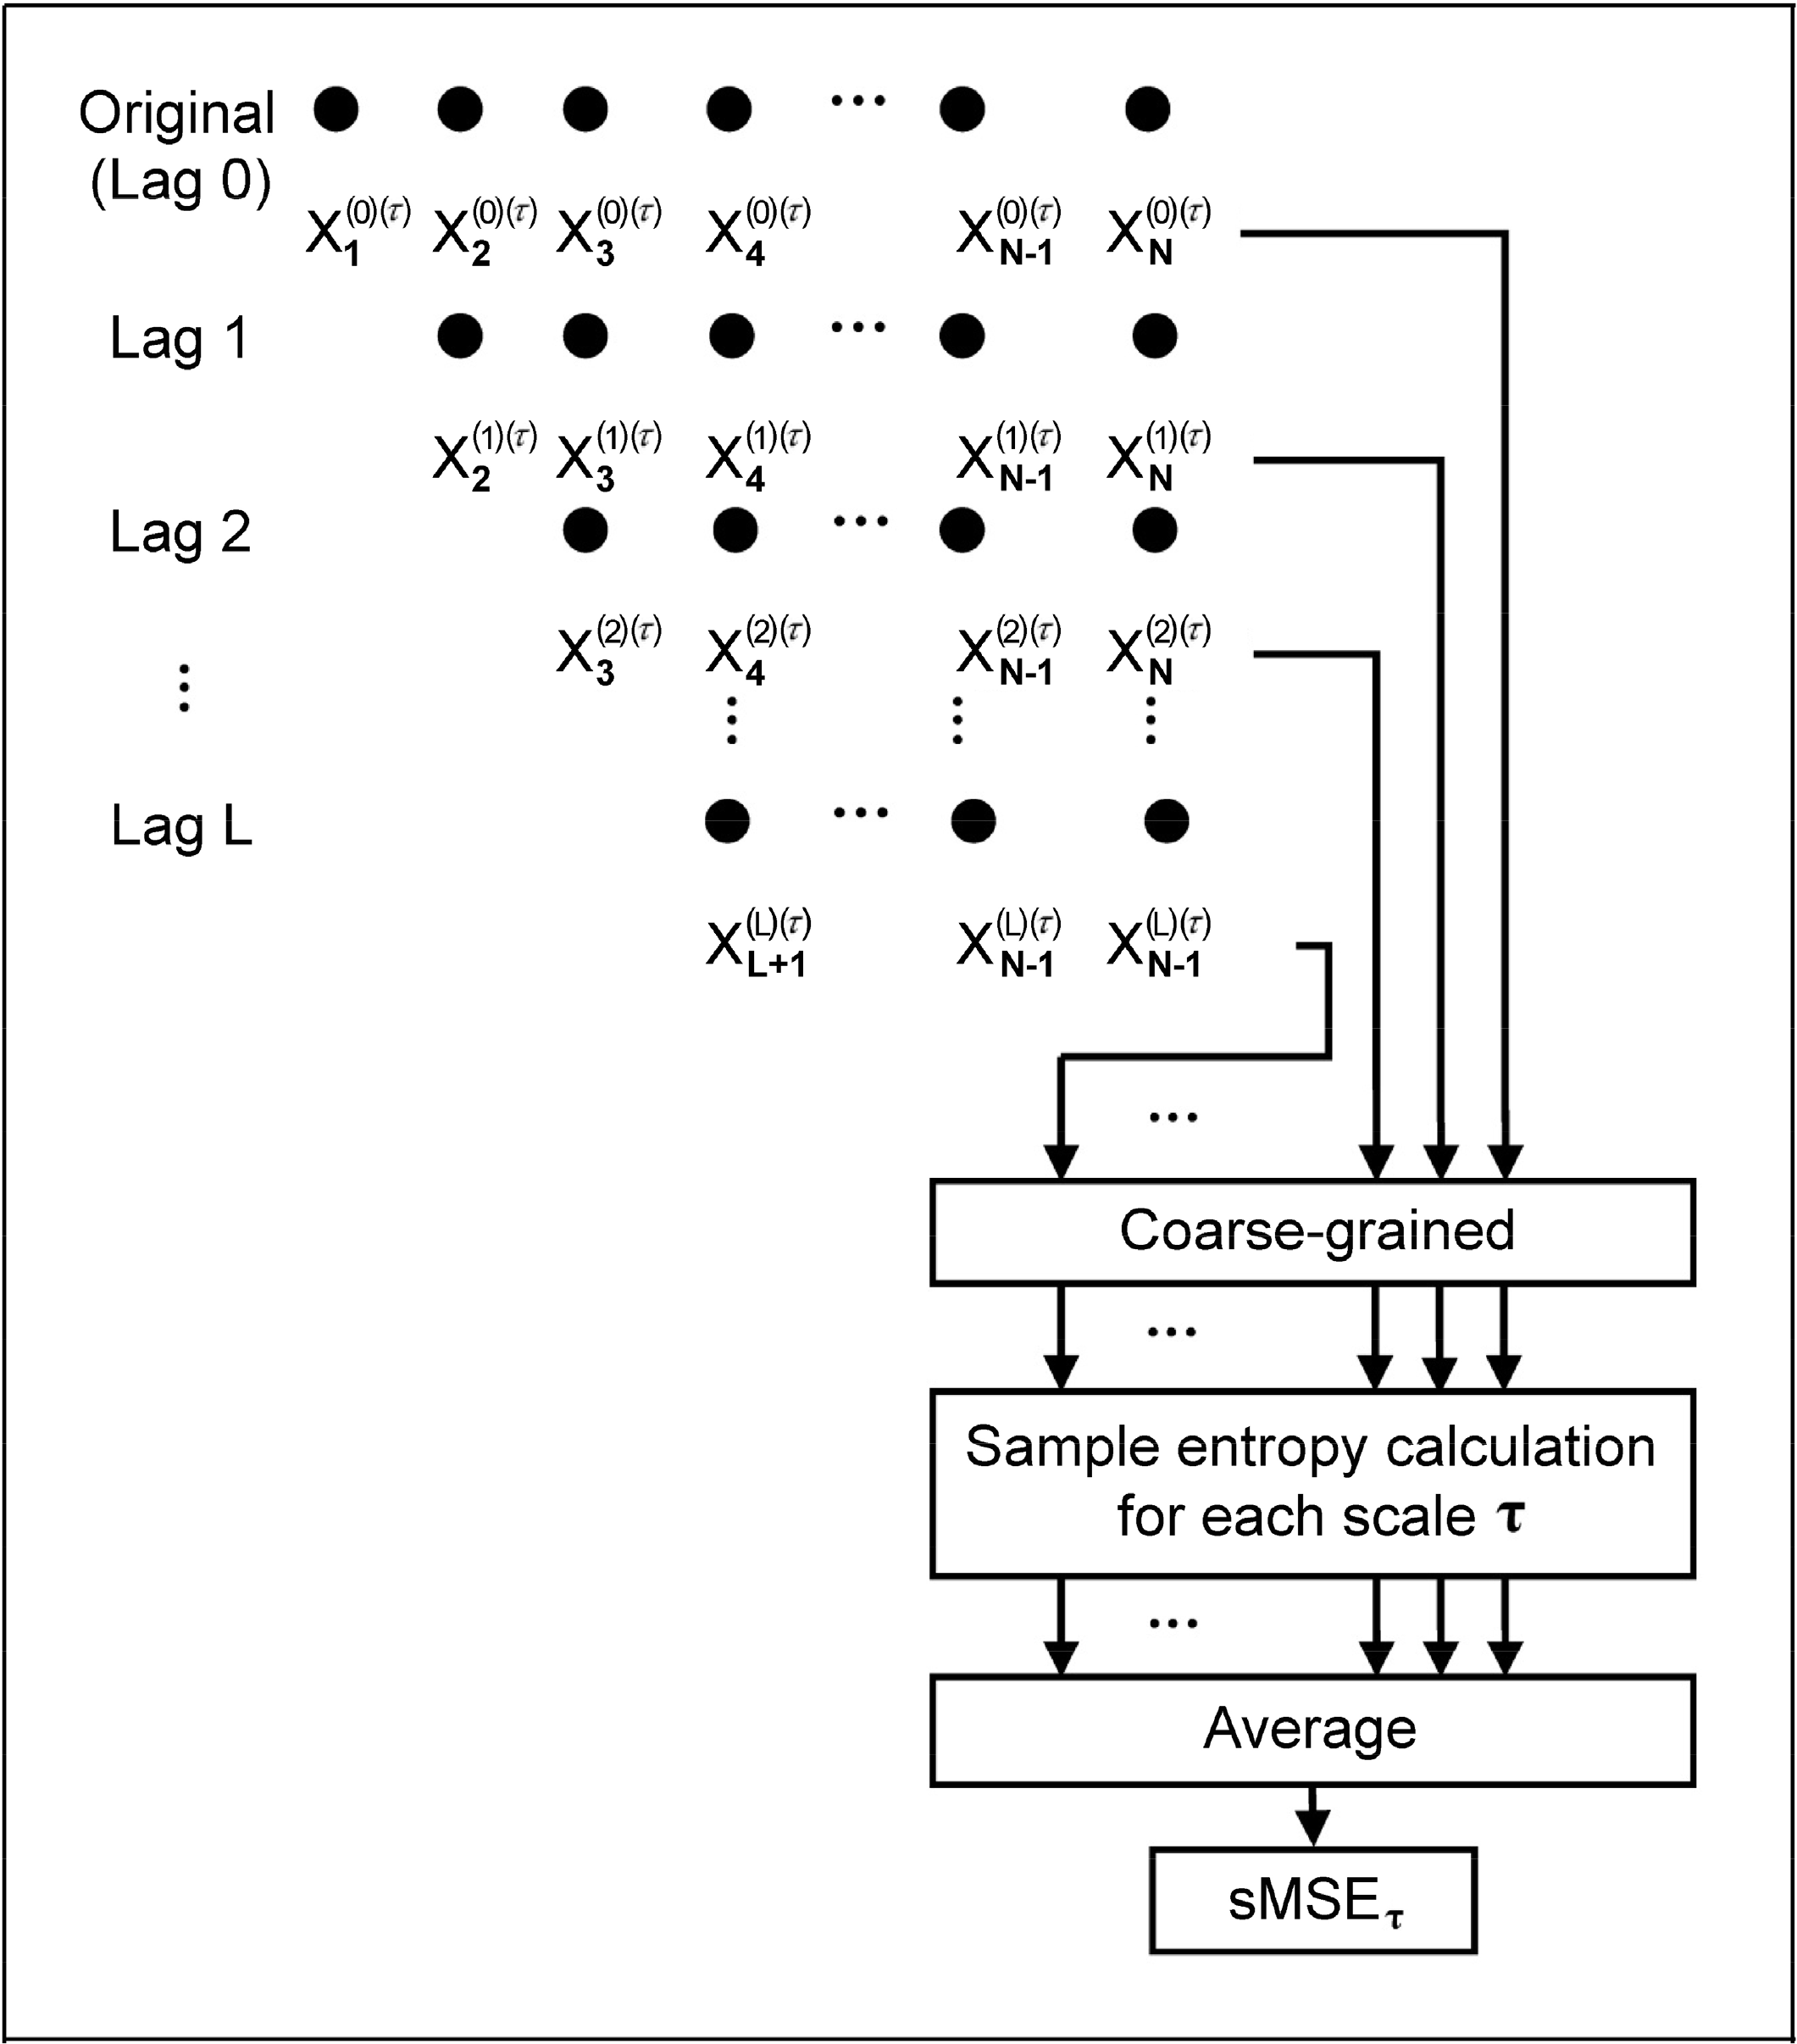
2.3. Short Time Multiscale Entropy (sMSE)

The original MSE comprises of two steps: (1) coarse-graining the signals using different time scales; (2) quantifying the degree of irregularity in each coarse-grained time series using sample entropy (SE) [15] which is a new family of statistics measuring complexity and regularity of clinical and experimental time series data. SE statistics provide an improved evaluation of time series regularity and should be a useful tool in studies of the dynamics of human cardiovascular physiology. SE is not defined unless template and forward matches occur and is not necessarily reliable for small numbers of matches. SE (m, r, N) calculation was a process of sampling information about regularity in the time series. It used sample statistics to inform us of the reliability of the calculated result. The complexity of scale factors (τ = 1, 2, …, 10) was calculated using SE.
On the other hand, the major challenge of MSE in clinical application is the need of massive data for reliability. Short time multiscale entropy (sMSE) is a novel computational approach that enables the use of large scale factor for analysis on data acquired through a shortened time period. The acquired time series then undergo Sample Entropy (SE) [15] computation with steady values of entropy obtained (Figure 1).
Through altering the number of Lag from 0 to L (where L = τ – 1, τ = coarse-grained scale factor) on the native time series (1), a new time series, T(P), can be obtained (2). Thus, the number of new time series generated is L + 1:
T N = { X 1 , X 2 , , X N 1 , X N }
T ( P ) = { X k , X k + 1 , X k + 2 , , X N 1 , X N } , k = p + 1 , p = 0 , 1 , 2 , , L
The L + 1 time series acquired then undergo coarse-grained processing with a scale factor τ (3), giving the time series of y(p)(τ). Hence:
y j ( p ) ( τ ) = 1 τ k = ( j 1 ) τ + 1 + p j τ + p X k , 1 j N P τ , p = 0 , 1 , 2 , , L
The L + 1 y(p)(τ) are then subjected to Sample Entropy computation and averaged, giving sMSE of scale factor τ in (4):
sMSE τ = 1 L + 1 p = 0 L S E ( y ( p ) ( τ ) )

2.4. Short Time Multi-scale Entropy Index (sMEI) Using PWV Series

The results of MSE from 1000 successive PWV signals were compared with those of sMSE acquired from computation on the first 600 PWV signals using the novel computation approach in the current study. Utilizing a scale factor of 10, the present study categorized scale factors into short time multi-scale entropy index with small scale (sMEISS, scale1 to scale5) (5) and short time multi-scale entropy index with large scale (sMEILS, scale 6 to scale 10) (6) that were used to compare with the respective values of MEISS and MEILS from our previous study using MSE [11]:
sMEISS = 10 ( τ = 1 5 sMSE τ )
sMEILS = 10 ( τ = 6 10 sMSE τ )

2.5. Study Design

The study comprised two parts. The first part involved the design of the sMSE method with simulation signals of white noise and 1/f noise using the MATLAB R2008b package (MathWorks, Natick, MA, U.S.A.). The second part focused on computation of PWV-based multiscale entropy index in study subjects with small scale and that with large scale using MSE method on 1000 successive PWV signals that are referred to as MEISS (PWV1000) and MEILS (PWV1000), respectively. The computation has been previously described [11]. Utilizing the same approach, 600 successive PWV signals were obtained for the calculation of MEISS (PWV600) and MEILS (PWV600). Comparisons were first made between MEISS (PWV1000) and MEISS (PWV600) as well as between MEILS (PWV1000) and MEILS (PWV600) to study if a reduction in available data would affect the ability of differentiation among different groups. In addition, MEISS (PWV600) and MEILS (PWV600) were compared with sMEISS (PWV600) and sMEILS (PWV600), respectively, to investigate possible enhancement in sensitivities using the novel method for data processing.

2.6. Statistical Analysis

Average values are expressed as mean ± SD. Statistical Package for the Social Science (SPSS, version 14.0 for Windows, SPSS Inc., Chicago, IL, USA) was used for statistical analysis. Independent t-test was adopted for the determination of the significance of difference in study parameters among different groups. A probability value, p, of <0.05 represents statistical significance.

3. Results

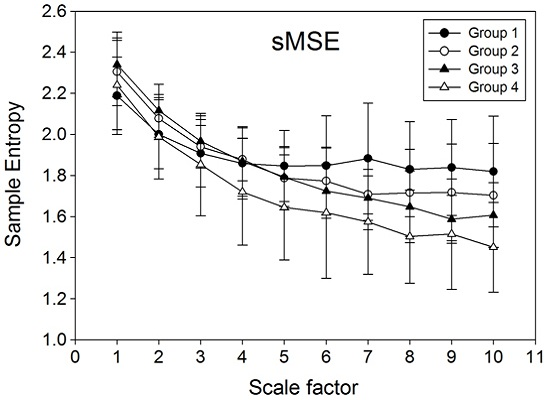
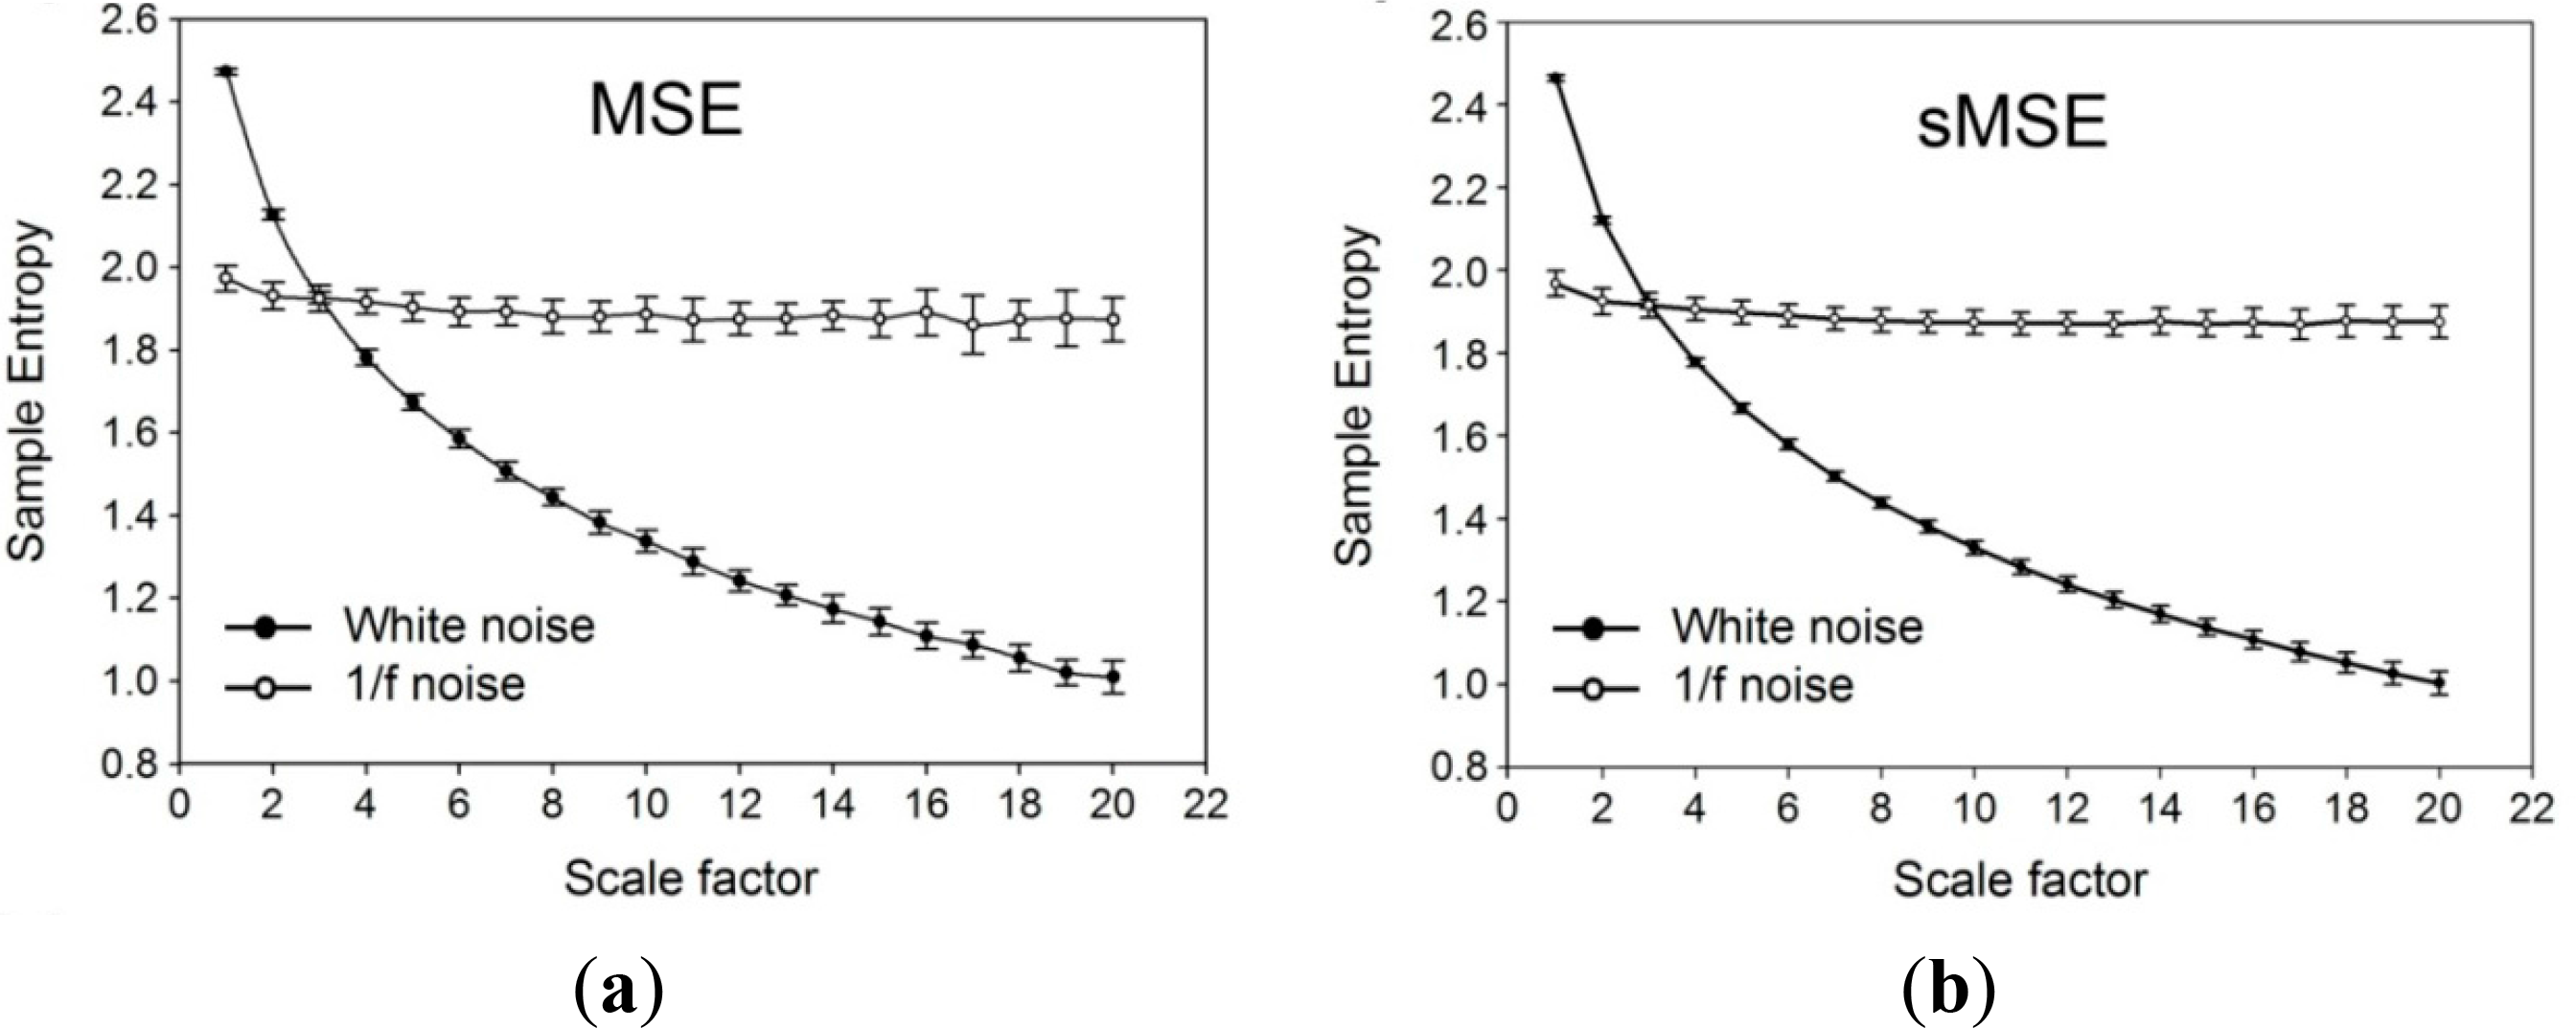
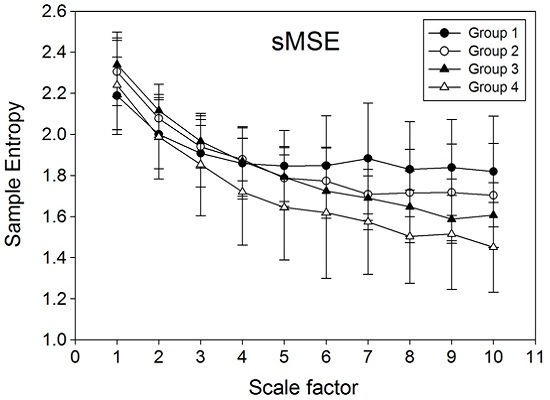
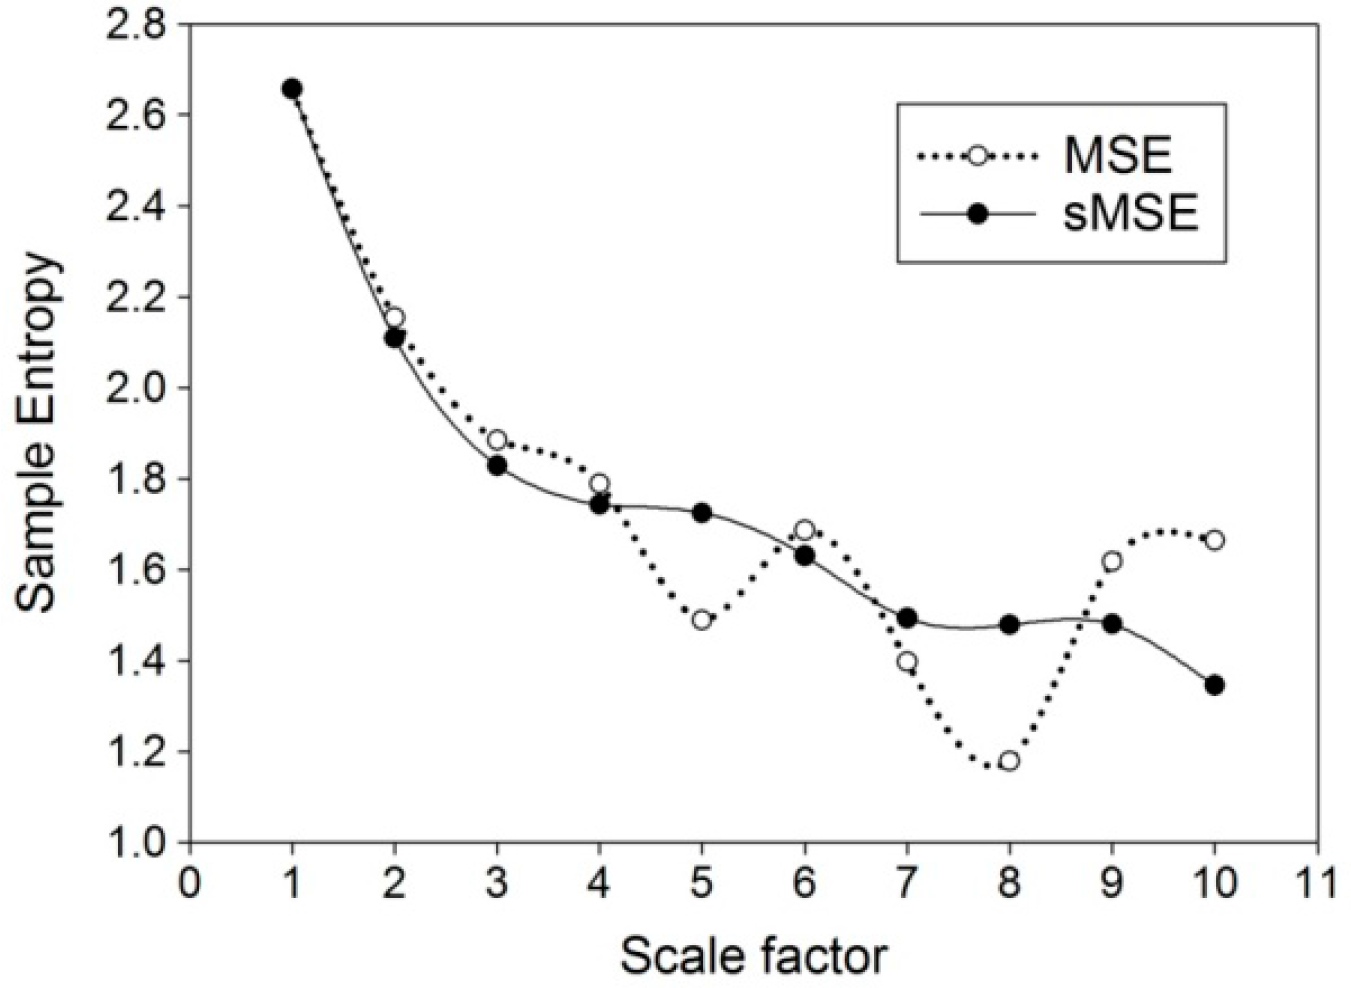
3.1. Computation of Sample Entropy Using Multi-Scale Entropy (MSE) and Short Time Multi-Scale Entropy (sMSE) Methods on Simulation Signals

Values of sample entropy were acquired through multi-scale entropy (MSE) (Figure 2a) and short time multi-scale entropy (sMSE) (Figure 2b) methods using simulation white noise and 1/f noise with different scale factors on 30 sets of 1000 successive signals. The results showed that the values of sample entropy decreased with an increase in values of the coarse grained scale factor, regardless of the method used. On the other hand, computation with 1/f noise eliminated the effect of scale factor, giving a value of around 2 for both methods (Figure 2a,b). Comparison of changes in values of sample entropy using multi-scale entropy (MSE) and short time multi-scale entropy (sMSE) approaches with different scale factors on 600 successive white noise signals (Figure 3) showed a steady drop in sample entropy as the scale factor increased from 1 to 4. From the scale factor 5 onwards, sample entropy from MSE began to exhibit remarkable fluctuations, while that from sMSE showed a relatively steady decrease.

3.2. Demographic and Biochemical Parameters

Subjects in Group 3 was significantly older than those in Group 2 who, in turn, were significantly older than those in Group 1 (all p < 0.001) (Table 1). The duration of diagnosed diabetes was significantly longer in Group 4 than that in Group 3 (p < 0.001). Although there was no significant difference in body mass index (BMI) among the four groups, the waist circumference was significantly larger with systolic blood pressure higher in individuals in Group 3 compared to those in Group 2 (both p = 0.005). Besides, the pulse pressure was also substantially higher in Group 3 than that in Group 2 (p = 0.001). Moreover, the levels of HbA1c were significantly different among the four groups with Group 4 being the highest, followed by Group 3, Group 2, and Group 1 (Group 1 vs. Group 2, p = 0.007; Group 2 vs. Group 3 and Group 3 vs. Group 4, p < 0.001), although the parameter was within normal range (i.e., <6.0%) in Group 1 and Group 2. Serum triglyceride levels were also significantly higher in Group 4 than in Group 3 (p = 0.037). Furthermore, fasting blood sugar level was highest in Group 4, followed by Group 3 and Group 2, while there was no notable difference between Group 1 and Group 2 (Group 2 vs. Group 3, p < 0.001; Group 3 vs. Group 4, p = 0.003).

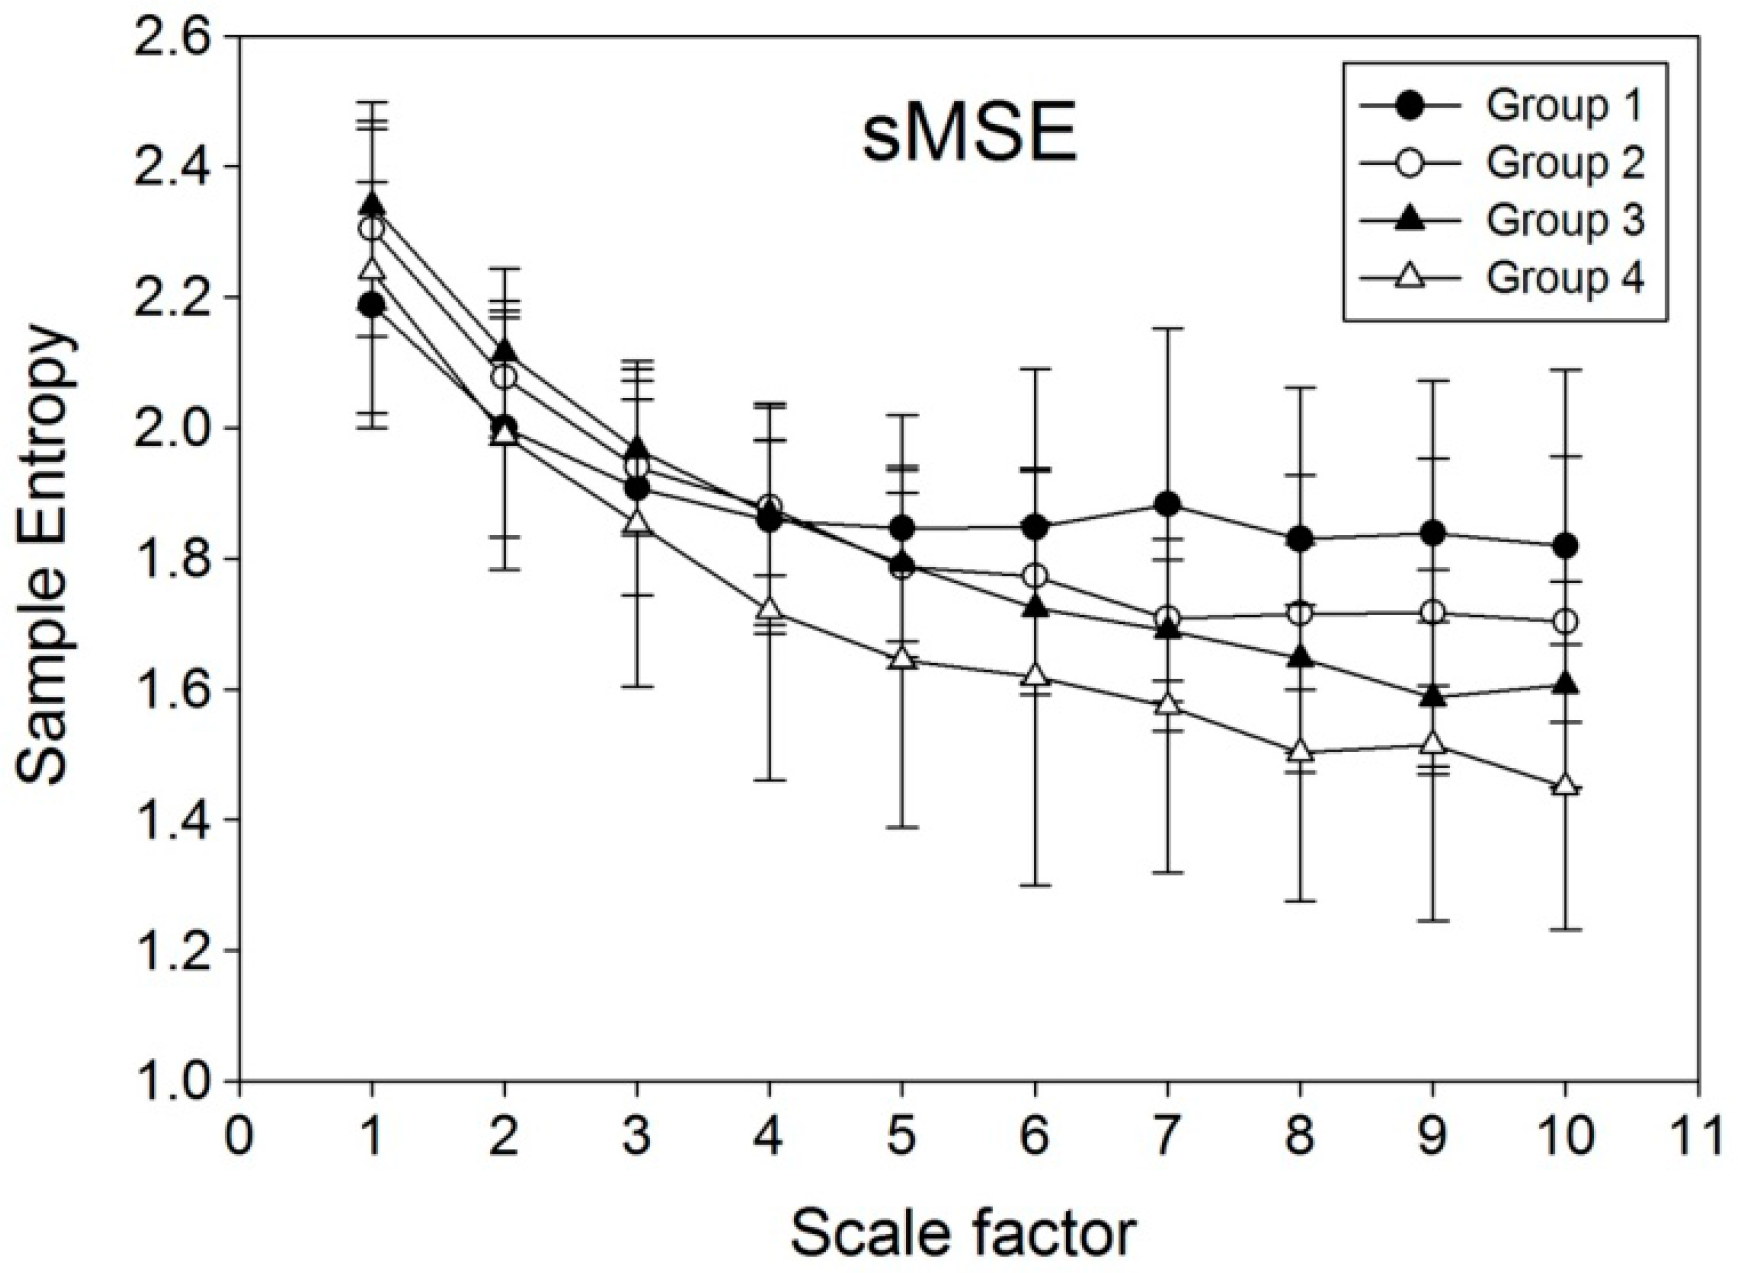
3.3. Comparisons among PWV1000, MEISS (PWV1000), MEILS (PWV1000), MEISS (PWV600), MEILS (PWV600), sMEISS (PWV600) and sMEILS (PWV600)

Unlike PWV1000 and MEISS (PWV1000), MEILS (PWV1000) was higher in Group 1 than that in Group 2 (p = 0.03), significantly higher in Group 2 than that in Group 3 (p = 0.016), and higher in Group 3 compared to that in Group 4 (p = 0.04). Moreover, unlike MEISS (PWV600), MEILS (PWV600), and sMEISS (PWV600), sMEILS (PWV600) was significantly higher in Group 1 than that in Group 2 (p = 0.029), higher in Group 2 than that in Group 3 (p = 0.045), and higher in Group 3 than that in Group 4 (p = 0.045) (Table 2).
There was an overall reduction in sample entropy with an increase in scale factors (Figure 4). While no significant difference among the four groups was noted on a scale factor less than 6, significant differences began to emerge when the scale factor was 6 or above. The value of sample entropy was highest in Group 1, followed by that of Group 2, Group 3, and Group 4.

4. Discussion

Pulse wave velocity (PWV) is one of the most popular noninvasive assessment tools for the assessment of atherosclerosis [2,5,16] that operates on the assumption that PWV is a stationary parameter. However, after analyzing the data on PWV over 1000 cardiac cycles within 30 min, our previous study [11] demonstrated that PWV is a non-stationary parameter, the variability of which may reflect subtle atherosclerotic change that was missed by taking only the mean value for analysis. That study explored the possibility of combining MSE and PWV in assessing sugar control and progression of vascular pathology in diabetic patients and elderly to allow timely therapeutic intervention. Other than MSE, various tools for non-linear data analysis are available, including Ensemble Empirical Mode Decomposition (EEMD) [17,18], linguistic [19,20] and fractal [21,22] analyses.
Albeit sensitive in differentiating healthy, aged, and diabetic subjects, one of the pitfalls of applying MSE for PWV signal analysis is the relatively long time needed for data collection that involves the acquisition of 1000 successive points of PWV series in 30 min [11]. Our experience showed that, although a scale factor of 10 can be used for analyzing 1000 successive PWV signals to produce significant outcomes, the use of scale factor 10 on a smaller sample size acquired within a shorter time period would give aberrant results (Figure 3). In an attempt to solve the problem, the current study introduced a novel non-linear computational method, sMSE, that gave values of sample entropy comparable to those obtained through MSE from a relatively long period of simulation signals (Figure 2a,b). The results, therefore, are consistent with those from the study of Peng et al. that also demonstrated similar results in simulation study on healthy subjects and those with cardiac diseases [23]. Using a relatively small simulation sample size of 600, the changes in sample entropy acquired with MSE and sMSE were compared (Figure 3). The results showed spiking increases in entropy at a scale factor of 6, 9, and 10 using the MSE method, while sample entropy from sMSE exhibited a relatively steady reduction throughout the elevation in scale factor from 1 to 10. Compared to traditional MSE, the significantly reduced standard deviation of sMSE indicates the reduction of the cost of the experimentation. Therefore, despite a smaller sample size, sMSE could still produce results similar to that of MSE on a large sample (Figure 2a). The results highlight the applicability of sMSE in the analysis of signals acquired through a long time period and also those from a relatively short period (i.e., 600 consecutive points of PWV series) using a scale factor of 10 to produce steady results that could not be obtained through the original MSE approach. The results from simulation studies are consistent with those from human subjects. Although MEISS (PWV600) and MEILS (PWV600) failed to reproduce the significant results from MEISS (PWV1000) and MEILS (PWV1000) after curtailing the sampling size, sMEISS (PWV600) and sMEILS (PWV600) were found to be as sensitive as MEISS (PWV1000) and MEILS (PWV1000) in differentiating among the four groups. Failure in differentiation among the four groups using MEILS (PWV600) (Table 2) may be due to the marked fluctuations in sample entropy at large scale factors (Figure 3). Furthermore, consistent with the findings of previous studies [11], the results of the present study also demonstrated a reduction in signal complexity with age and the severity of diabetes (Figure 4).
Regarding the physiological significance of the non-stationarity of biological signals, previous studies have utilized MSE in the evaluation of cardiac variables including R–R interval, heart rate, and heart rate variability [2325] and revealed a decrease in signal complexity (SE) with an increase in age and disease conditions such as atrial fibrillation and congestive heart failure [2326]. Reduction in physiological complexity, therefore, reflects impaired physiological responses of an individual to changes in the external environment. Consistently, there have been previous reports regarding MSE analyses in diabetic patients, indicating impaired autonomic neural activities in the diabetic population [2729]. Based on this knowledge, the current study investigated the feasibility of shortening the time for data acquisition in differentiating among the healthy, aged, and diabetic populations compared using a novel method of computation.
The present study has its limitations. First, compared with MSE, the method of sMSE requires a larger amount of computation. Second, although we have established a signal-to-scale factor ratio of 100 (i.e., 1000 successive signals/scale factor 10) as a minimal requirement for successful computation using the MSE approach and a reduced ratio of 60 for sMSE in this study, whether aberrancy would arise from sMSE using a ratio below 60 remains to be elucidated.

5. Conclusions

The present study demonstrated that, using a novel sMSE approach for PWV signal analysis, the time for data acquisition can be substantially reduced from 1000 to 600 cardiac cycles with remarkable preservation of sensitivity in differentiating among the healthy, aged, and diabetic populations compared with the conventional MSE method.

Acknowledgments

This study was financially supported by a research grant from the National Science Council, Taiwan, (Grant No. 102-2221-E-259-004, Grant No. NSC 102-2221-E-008-008, NSC 102-2911-I-008-001), joint foundation of CGH and NCU (Grant No. CNJRF-101CGH-NCU-A4 and VGHUST103-G1-3-3).

Author Contributions

Yi-Chung Chang, Men-Tzung Lo and Cheuk-Kwan Sun designed the study. Hsien-Tsai Wu, Hong-Ruei Chen and An-Bang Liu were responsible for data collection and analysis. Jung-Jen Yeh, Jen-Ho Tsao, Chieh-Ju Tang and I-Ting Tsai reviewed relevant literature and interpreted the acquired data. Yi-Chung Chang, Men-Tzung Lo and Cheuk-Kwan Sun drafted the manuscript. All authors have read and approved the final manuscript.

Conflicts of Interest

The authors declare no conflict of interest.

References

  1. Blacher, J.; Asmar, R.; Djane, S.; London, G.M.; Safar, M.E. Aortic pulse wave velocity as a marker of cardiovascular risk in hypertensive patients. Hypertension 1999, 33, 1111–1117. [Google Scholar]
  2. Laurent, S.; Boutouyrie, P.; Asmar, R.; Gautier, I.; Laloux, B.; Guize, L.; Ducimetiere, P.; Benetos, A. Aortic stiffness is an independent predictor of all-cause and cardiovascular mortality in hypertensive patients. Hypertension 2001, 37, 1236–1241. [Google Scholar]
  3. Yamashina, A.; Tomiyama, H.; Takeda, K.; Tsuda, H.; Arai, T.; Hirose, K.; Koji, Y.; Hori, S.; Yamamoto, Y. Validity, reproducibility, and clinical significance of noninvasive brachial-ankle pulse wave velocity measurement. Hypertens. Res 2002, 25, 359–364. [Google Scholar]
  4. Mitchell, G.F.; Parise, H.; Benjamin, E.J.; Larson, M.G.; Keyes, M.J.; Vita, J.A.; Vasan, R.S.; Levy, D. Changes in arterial stiffness and wave reflection with advancing age in healthy men and women the Framingham Heart Study. Hypertension 2004, 43, 1239–1245. [Google Scholar]
  5. Tsai, W.C.; Chen, J.Y.; Wang, M.C.; Wu, H.T.; Chi, C.K.; Chen, Y.K.; Chen, J.H.; Lin, L.J. Association of Risk Factors With Increased Pulse Wave Velocity Detected by a Novel Method Using Dual-Channel Photoplethysmography*. Am. J. Hypertens 2005, 18, 1118–1122. [Google Scholar]
  6. Wu, H.T.; Hsu, P.C.; Liu, A.B.; Chen, Z.L.; Huang, R.M.; Chen, C.P.; Tang, C.J.; Sun, C.K. Six-channel ECG-based pulse wave velocity for assessing whole-body arterial stiffness. Blood Press 2012, 21, 167–176. [Google Scholar]
  7. Costa, M.; Goldberger, A.; Peng, C.K. Multiscale entropy to distinguish physiologic and synthetic RR time series. Proceedings of the IEEE Computers in Cardiology, Memphis, TN, USA, 22–25 September 2002; pp. 137–140.
  8. Costa, M.; Goldberger, A.L.; Peng, C.K. Multiscale entropy analysis of complex physiologic time series. Phys. Rev. Lett 2002, 89. [Google Scholar] [CrossRef]
  9. Costa, M.; Healey, J. Multiscale entropy analysis of complex heart rate dynamics: discrimination of age and heart failure effects. Proceedings of the IEEE Computers in Cardiology, Thessaloniki Chalkidiki, Greece, 21–24 September 2003; pp. 705–708.
  10. Costa, M.; Peng, C.K.; Goldberger, A.L. Hausdorff JM Multiscale entropy analysis of human gait dynamics. Physica A 2003, 330, 53–60. [Google Scholar]
  11. Wu, H.T.; Hsu, P.C.; Lin, C.F.; Wang, H.J.; Sun, C.K.; Liu, A.B.; Lo, M.T.; Tang, C.J. Multiscale entropy analysis of pulse wave velocity for assessing atherosclerosis in the aged and diabetic. IEEE Trans. Biomed. Eng 2011, 58, 2978–2981. [Google Scholar]
  12. Ho, Y.L.; Lin, C.; Lin, Y.H.; Lo, M.T. The Prognostic Value of Non-Linear Analysis of Heart Rate Variability in Patients with Congestive Heart Failure—A Pilot Study of Multiscale Entropy. PLOS ONE 2011, 6. [Google Scholar] [CrossRef]
  13. Yuan, H.K.; Lin, C.; Tsai, P.H.; Chang, F.C.; Lin, K.P.; Hu, H.H.; Su, M.C.; Lo, M.T. Acute increase of complexity in the neurocardiovascular dynamics following carotid stenting. Acta Neurol. Scand 2011, 123, 187–192. [Google Scholar]
  14. Escudero, J.; Abásolo, D.; Hornero, R.; Espino, P.; López, M. Analysis of electroencephalograms in Alzheimer’s disease patients with multiscale entropy. Physiol. Meas 2006, 27, 1091–1106. [Google Scholar]
  15. Richman, J.S.; Moorman, J.R. Physiological time-series analysis using approximate entropy and sample entropy. Am. J. Physiol.Heart Circ. Physiol 2000, 278, 2039–2049. [Google Scholar]
  16. Cecelja, M.; Chowienczyk, P. Dissociation of aortic pulse wave velocity with risk factors for cardiovascular disease other than hypertension a systematic review. Hypertension 2009, 54, 1328–1336. [Google Scholar]
  17. Chang, K.M.; Liu, S.H. Gaussian noise filtering from ECG by Wiener filter and ensemble empirical mode decomposition. J. Signal Process. Syst 2011, 64, 249–264. [Google Scholar]
  18. Wu, Z.; Huang, N.E. Ensemble empirical mode decomposition: a noise-assisted data analysis method. Adv. Adapt. Data Anal 2009, 1, 1–41. [Google Scholar]
  19. Lei, W.K.; Li, B.N.; Dong, M.C.; Vai, M.I. AFC-ECG: An adaptive fuzzy ECG classifier. In Soft Computing in Industrial Applications, Proceedings of The 12th Online World Conference on Soft Computing in Industrial Applications (WSC12), 16–26 October 2007; Springer: Berlin, Germany, 2007; pp. 189–199. [Google Scholar]
  20. Yang, A.C.C.; Hseu, S.S.; Yien, H.W.; Goldberger, A.L.; Peng, C.K. Linguistic analysis of the human heartbeat using frequency and rank order statistics. Phys. Rev. Lett 2003, 90. [Google Scholar] [CrossRef]
  21. Goldberger, A.L.; Amaral, L.A.; Hausdorff, J.M.; Ivanov, P.C.; Peng, C.K.; Stanley, H.E. Fractal dynamics in physiology: Alterations with disease and aging. Proc. Natl. Acad. Sci. USA 2002, 99, 2466–2472. [Google Scholar]
  22. Tapanainen, J.M.; Thomsen, P.E.B.; Køber, L.; Torp-Pedersen, C.; Mäkikallio, T.H.; Still, A.M.; Lindgren, K.S.; Huikuri, H.V. Fractal analysis of heart rate variability and mortality after an acute myocardial infarction. Am.J. Cardiol 2002, 90, 347–352. [Google Scholar]
  23. Costa, M.; Goldberger, A.L.; Peng, C.K. Multiscale entropy analysis of biological signals. Phys.Rev. E 2005, 71. [Google Scholar] [CrossRef]
  24. Cheng, D.; Tsai, S.J.; Hong, C.J.; Yang, A.C. Reduced physiological complexity in robust elderly adults with the APOE ε4 allele. PLOS ONE 2009, 4. [Google Scholar] [CrossRef]
  25. Costa, M.D.; Peng, C.K.; Goldberger, A.L. Multiscale analysis of heart rate dynamics: Entropy and time irreversibility measures. Cardiovasc. Eng 2008, 8, 88–93. [Google Scholar]
  26. Manor, B.; Costa, M.D.; Hu, K.; Newton, E.; Starobinets, O.; Kang, H.G.; Peng, C.; Novak, V.; Lipsitz, L.A. Physiological complexity and system adaptability: evidence from postural control dynamics of older adults. J. Appl. Physiol 2010, 109, 1786–1791. [Google Scholar]
  27. Javorka, M.; Trunkvalterova, Z.; Tonhajzerova, I.; Javorkova, J.; Javorka, K.; Baumert, M. Short-term heart rate complexity is reduced in patients with type 1 diabetes mellitus. Clin. Neurophysiol 2008, 119, 1071–1081. [Google Scholar]
  28. Skinner, J.E.; Weiss, D.N.; Anchin, J.M.; Turianikova, Z.; Tonhajzerova, I.; Javorkova, J.; Javorka, K.; Baumert, M.; Javorka, M. Nonlinear PD2i heart rate complexity algorithm detects autonomic neuropathy in patients with type 1 diabetes mellitus. Clin. Neurophysiol 2011, 122, 1457–1462. [Google Scholar]
  29. Tarvainen, M.P.; Cornforth, D.J.; Kuoppa, P.; Lipponen, J.A.; Jelinek, H.F. Complexity of heart rate variability in type 2 diabetes-effect of hyperglycemia. In Engineering in Medicine and Biology Society (EMBC), Proceedings of 35th Annual International Conference of the IEEE Engineering in Medicine and Biology Society (EMBC’13), Osaka, Japan, 3–7 July 2013; pp. 5558–5561.
Figure 1. Method of short time multi-scale entropy (sMSE) computation.
Entropy 16 04032f1
Figure 2. Simulation signals. (a) Values of sample entropy acquired through multi-scale entropy (MSE) computation using white noise and 1/f noise with different scale factors on 30 sets of 1000 successive signals. (b) Values of sample entropy acquired through short-time multi-scale entropy (sMSE) computation using white noise and 1/f noise with different scale factors on 30 sets of 1000 successive signals.
Entropy 16 04032f2
Figure 3. Comparison of changes in values of sample entropy using multi-scale entropy (MSE) and short time multi-scale entropy (sMSE) methods with different scale factors on 600 successive simulated white noise signals.
Entropy 16 04032f3
Figure 4. Values of sample entropy obtained through computation using short time multi-scale entropy (sMSE) method on 600 successive pulse wave velocity (PWV) signals from human subjects. Group 1: Healthy young subjects without known cardiovascular disease; Group 2: Healthy middle-aged subjects without known cardiovascular disease; Group 3: Middle-aged individuals with well-controlled diabetes mellitus type 2; Group 4: Middle-aged patients with poorly-controlled diabetes mellitus type 2.
Entropy 16 04032f4
Table 1. Comparison of anthropometric, hemodynamic, serum biochemical, arterial stiffness parameters among the testing subjects.
ParameterGroup 1Group 2Group 3Group 4
Number24301822
Ages (years)25.8 ± 5.652.6 ± 6.6 **56.5 ± 9.357.9 ± 9.5
Duration of Diabetes (years)006.8 ± 3.811.7 ± 6.8 ++
Circumference (cm)79.9 ± 10.884.3 ± 10.192.2 ± 10.1 ε96.7 ± 12.8
BMI (kg/m2)22.6 ± 3.524.2 ± 3.926.9 ± 3.728.4 ± 5.2
SBP (mmHg)115.5 ± 9.8115.5 ± 14.4129.8 ± 22.0 ε125.7 ± 19.4
DBP (mmHg)70.1 ± 6.673.9 ± 10.078.5 ± 13.675.5 ± 10.8
PP (mmHg)44.5 ± 6.641.1 ± 9.451.2 ± 12.3 ε45.1 ± 6.7
HbA1c (%)5.5 ± 0.25.8 ± 0.4 *6.8 ± 0.7 εε9.53 ± 1.9 ++
HDL (mg/dL)41.7 ± 11.549.4 ± 14.139.9 ± 11.443.2 ± 14.9
Triglyceride (mg/dL)100.6 ± 74.0106.0 ± 54.9107.0 ± 51.7156.9 ± 74.3 +
Fasting Blood Sugar (mg/dL)92.4 ± 8.496.1 ± 9.9128.5 ± 28.1 εε182.8 ± 61.9 +
Group 1: Healthy young subjects without known cardiovascular disease; Group 2: Healthy middle-aged subjects without known cardiovascular disease; Group 3: Middle-aged individuals with well-controlled diabetes mellitus type 2; Group 4: Middle-aged patients with poorly-controlled diabetes mellitus type 2. Values are expressed as mean ± SD. BMI = body mass index; SBP = systolic blood pressure; DBP = diastolic blood pressure; PP = pulse pressure; HbA1c = glycosylated hemoglobin; HDL = high-density lipoprotein.
*p < 0.05: Group 1 vs. Group 2,
εp < 0.05: Group 2 vs. Group 3,
+p < 0.05: Group 3 vs. Group 4,
** p < 0.001: Group 1 vs. Group 2,
εεp < 0.001: Group 2 vs. Group 3,
++p < 0.001: Group 3 vs. Group 4
Table 2. Comparison of multiple entropy parameters among the testing subjects.
ParameterGroup 1Group 2Group 3Group 4
PWV1000(m/s)4.4 ± 0.34.7 ± 0.4 *5.0 ± 0.3 ε5.1 ± 0.6
MEISS (PWV1000)96.5 ± 4.497.4 ± 4.398.4 ± 6.791.5 ± 12.5+
MEILS (PWV1000)89.4 ± 7.384.3 ± 6.3 *79.6 ± 9.2 ε71.9 ± 12.6+
MEISS (PWV600)97.0 ± 7.699.1 ± 4.3100.9 ± 8.393.3 ± 12.4+
MEILS (PWV600)88.3 ± 10.886.1 ± 12.885.2 ± 11.082.9 ± 11.6
sMEISS (PWV600)95.9 ± 10.096.8 ± 7.196.9 ± 11.389.2 ± 12.1+
sMEILS (PWV600)92.2 ± 8.986.8 ± 11.3 *80.5 ± 6.2 ε73.7 ± 11.4+
PWV1000 = The mean of 1000 successive points of PWV series using the distance from the sternum to the second toe divided by the time difference between R wave on Lead IIof ECG to the corresponding foot point of pulse wave of second toe; MEISS (PWV1000) = 1000 successive PWV-based multiscale entropy index with small scale; MEILS (PWV1000) = 1000 successive PWV-based multiscale entropy index with large scale; MEISS (PWV600) = 600 successive PWV-based multiscale entropy index with small scale; MEILS (PWV600) = 600 successive PWV-based multiscale entropy index with large scale; sMEISS (PWV600) = 600 successive PWV-based short time multiscale entropy index with small scale; sMEILS (PWV600) = 600 successive PWV-based short time multiscale entropy index with large scale.

