Article

Fast Rate Estimation for RDO Mode Decision in HEVC

by
Maxim P. Sharabayko
1,* and
Oleg G. Ponomarev
2,3
1
Tomsk Polytechnic University, 634050, Lenin Avenue, 30, Tomsk, Russia
2
Tomsk State University, 634050, Lenin Avenue, 36, Tomsk, Russia
3
Tomsk State University of Control Systems and Radioelectronics, 634050, Lenin Avenue, 40, Tomsk, Russia
*
Author to whom correspondence should be addressed.
Entropy 2014, 16(12), 6667-6685; https://doi.org/10.3390/e16126667
Submission received: 19 August 2014 / Revised: 3 December 2014 / Accepted: 17 December 2014 / Published: 19 December 2014
(This article belongs to the Section Information Theory, Probability and Statistics)

Abstract

:
The latter-day H.265/HEVC video compression standard is able to provide two-times higher compression efficiency compared to the current industrial standard, H.264/AVC. However, coding complexity also increased. The main bottleneck of the compression process is the rate-distortion optimization (RDO) stage, as it involves numerous sequential syntax-based binary arithmetic coding (SBAC) loops. In this paper, we present an entropy-based RDO estimation technique for H.265/HEVC compression, instead of the common approach based on the SBAC. Our RDO implementation reduces RDO complexity, providing an average bit rate overhead of 1.54%. At the same time, elimination of the SBAC from the RDO estimation reduces block interdependencies, thus providing an opportunity for the development of the compression system with parallel processing of multiple blocks of a video frame.

1. Introduction

The H.265/HEVC video compression standard is able to provide approximately two-times [13] better compression efficiency compared to the current industrial video compression standard, H.264/AVC. HEVC is an evolution of the AVC standard, which introduces larger coding block sizes (64 ×64 pixels instead of 16 ×16 in AVC), improves intra-prediction and motion compensation, and refines arithmetic coder. Accurate separation of image redundancy regions is performed with quad-tree partitioning of the larger coding block, called coding tree unit (CTU). The CTU of 64 ×64 pixels can be partitioned into smaller coding units (CUs) of 32 ×32, 16 ×16 and 8 ×8 pixels. The total number of different possible CUs in a CTU partitioning is 85 (one CU of 64 ×64 pixels, four CUs of 32 ×32 pixels, 16 CUs of 16 ×16 pixels and 64 CUs of 8 ×8 pixels). In case of intra-prediction, an 8 ×8 CU can contain four prediction units of 4 ×4 pixels, which results in a total of 341 possible blocks in a CTU partitioning.
To find the most efficient CTU partitioning, rate-distortion optimization (RDO) is applied. The technique is based on the estimation of the compression rate (R) and the compression distortion (D). Block compression options are compared with each other through the Lagrangian RDO cost [4]:
J R D = D + λ R ,
where λ is the Lagrangian multiplier. Its value is usually determined empirically, as [57]:
λ = 0.85 2 ( Q P 12 ) / 3 ,
where QP is the quantization parameter used in compression data-flow. The RDO estimates the trade-off between compression rate and compression distortion, thus providing a criterion of choosing the best coding option. However, it is a performance bottleneck of almost any encoder. Since HEVC has much more coding options than AVC, its dependency on RDO becomes stronger. To find the optimal coding option, all 341 possible sub-blocks should be estimated, leading to a poor compression performance. Therefore, an efficient algorithm for RDO mode decision becomes essential.
One of the main contributions to this field is presented in [8] with the table-based bit estimation for the arithmetic coder in H.265/HEVC, that eventually was included in the HEVC test model (HM) reference encoder. The original algorithm for the RDO mode decision involves the SBAC engine to count a number of bits in each block coding option and to estimate compression rate R. The proposal simplifies the bit counting procedure, wherein bit counts are estimated using tables that reflect the self-information of a symbol to code with regard to the current state of the SBAC. The simplification does not impact rate-distortion performance, while reducing the encoding time by 1% to 5%.
On the other hand, in [9], the authors partially substitute the SBAC in the bit counting procedure by the empirical approach to the bit-size estimation of the residual information. The approach reduces RDO time (not the encoding time) by 46%, providing the average compression bitrate overhead of 1.93%.
While both works provide useful results, there seems to be a way to further reduce the complexity of the RDO estimation procedure. In this paper, we introduce the fast rate estimation technique for the RDO mode decision in HEVC. The remainder of the paper is organized as follows. In Section 2, we get into the analysis of RDO estimation difficulties in H.265/HEVC video compression. We show that while distortion estimation does not have significant bottlenecks, rate estimation involves arithmetic coding and drastically reduces the potential RDO estimation speed-up. In Section 3, we provide our rate estimation observations for H.265/HEVC compression, and in Section 4, we describe our approach to fast rate estimation in RDO mode decision for H.265/HEVC. We implement our RDO modification in the HM v. 13.0 reference encoder [10], discuss compression efficiency results and provide a comparison to other approaches in Section 5.

2. RDO Bottlenecks in H.265/HEVC

The general RDO estimation data-flow is illustrated in Figure 1. Initial block prediction P is subtracted from the original block CUORG being compressed. Residuals CURES are subject to transform (T) and quantization (Q). The encoder should compress data B with the help of the binary arithmetic coder (BAC) in order to estimate the compression bit rate R. Meanwhile, the compression distortion D involves the inverse quantization (IQ) and inverse transform (IT). Restored residuals are summed up with the block prediction P to get the reconstructed block CUREC. The distortion metric D is based on the comparison of the initial block CUORG and the reconstructed block CUREC. Estimated values R and D are used to get the rate-distortion cost RDcost of a block coding decision.
Considering that each RDcost value estimation in fact requires full block compression, it can be estimated that there are at least 341·35=11,935 extra compressions of the same CTU in the intra-coding algorithm with full RDO (35 intra-prediction modes for 341 possible sub-blocks). Needless to say, none of the industrial compression systems utilize full RDO, as it does not provide any reasonable compression time. The number of RDO candidates is usually reduced [11]. However, still, the complexity of the compression algorithm remains rather high.
The most computationally expensive part of RDO is accurate rate R estimation, as it involves binary arithmetic coding represented by SBAC (syntax-based binary arithmetic coder) in HEVC. SBAC distinguishes input symbols (bins) by syntax groups. The least probable symbol (LPS) and the most probable symbol (MPS) values, as well as the probability of their occurrence within each syntax group are determined by the separate context probability model. At the same time, some bins are coded with the fixed probability of 50% in the so-called ‘bypass’ mode and do not depend on the probability state of SBAC. The SBAC is an adaptive arithmetic coder, which means that each coded bin updates the state of the context probability model and the probability interval of the arithmetic coder. The need to update the SBAC state produces strong raster-order interdependencies between the blocks and requires its serial processing. To estimate the bit rate of the nth block, all previous (n − 1) blocks should be processed; otherwise, the probability interval and context probability models are not yet known.
Rate R estimation also requires preserving the state of SBAC within a process of rate estimation, which leads to a big amount of copy operations. Suppose we make a decision on how to code the n–th block. The state S0 of SBAC is determined after coding the block (n − 1). In a conventional decision algorithm, we have to estimate the compression rate after each of 35 intra-predictions of the n–th block to choose the coding option with the least RDcost. Let bi correspond to the data to be arithmetically coded for a coding option with intra-prediction mode i, i ∈ [0; 34], i = Z. Then, ri corresponds to the number of bits that SBAC produces to represent the i–th coding option. To get RDcost for the zeroth coding option, we need to estimate r0 by coding each binarized symbol of b0 and changing the state of SBAC. Let the state of SBAC after coding all symbols of b0 be S0,0. Once we have r0, we are able to calculate RDcost for the zeroth coding option.
The next step is the similar rate estimation procedure for the first coding option. We need to restore the state S0 of SBAC as soon as it is the only correct state for estimation of this coding option. The only way to restore the SBAC state is to preserve it beforehand and copy back the values of the coding interval and all context models. Preserving the state of SBAC requires copying at least 512 bytes (at least one byte for each of the 512 context models). The same rate estimation operations are performed for the rest of the 33 intra-prediction modes of this very block. Then, the state of SBAC is updated, and the 35 intra-coding options for the block (n + 1) are estimated. Given that there are 341 possible blocks in a CTU partitioning, this copying consumes a considerable part of the RDO time.
The described computationally-expensive operations of a conventional rate estimation algorithm have a negative impact on RDO computation speed and require serial block processing. Furthermore, the objective of rate estimation is to count the number of bits on the output of SBAC for correct RDcost calculation. The usage of SBAC as a bit counter requires not only state preserving, but also produces extra operations of interval calculations (at least 24 bytes per operation).
It is well known from information theory that arithmetic coding provides the number of bits per symbol very close to the information entropy of the symbols. This fact is used in [8] to substitute calculations of the coding interval with the precalculated self-information of a symbol to be coded with regard to the state of the context model. Thus, it is possible to accurately estimate the number of bits on the output of SBAC without arithmetic coding itself. However, the need to update probability context states remains.
We want to further broaden the usage of entropy estimation to exclude SBAC entirely from the rate estimation procedure. The estimation of the information entropy of symbols is less expensive than the arithmetic coding, as it only requires the calculation of symbol probabilities in the initial message. Therefore, accurate entropy estimation of those symbols should result in an approach toward a faster rate estimation for the RDO mode decision in HEVC. Given that SBAC processes input symbols using different probability models in different syntax groups of symbols, we need to analyze the structure of data B in more detail.

3. Rate Estimation Observations

Observations on the rate estimation are held in regard to SBAC. Data B (Figure 1) to be coded are subject to binarization, which results in a sequence of bins on the input of SBAC. The arithmetic coding of those bins produces bits of a coded bit stream. Binarization is a simple and well-determined process [12] that does not require the arithmetic coder at all, while arithmetic coding involves expensive SBAC state preserving and restoring.
As soon as the separate context probability models are used for arithmetic coding of data B, the entropy of the symbols of different syntax groups should be handled separately. Generally, rate R estimation of data B can be divided into rate estimation of splitting information, prediction information and transformed residual information.

3.1. Splitting Data Rate Estimation

Splitting information describes the CTU quad-tree structure. Basically, a split decision is just a flag indicating whether to split the CU or not. This flag takes up a small part of the coded CTU bit-size. Furthermore, CU splitting involves additional prediction data to be coded, thus adding bit overhead for a split decision. Therefore, evaluation of the CU split flag may be neglected in terms of the rate R estimation.

3.2. Prediction Data Rate Estimation

The information on intra-prediction also contains the indication of the CU partitioning on prediction units or PUs. Each PU is a region of pixels on a video frame to perform the single type of prediction. PU indicates the intra-prediction mode for luma and chroma samples separately.
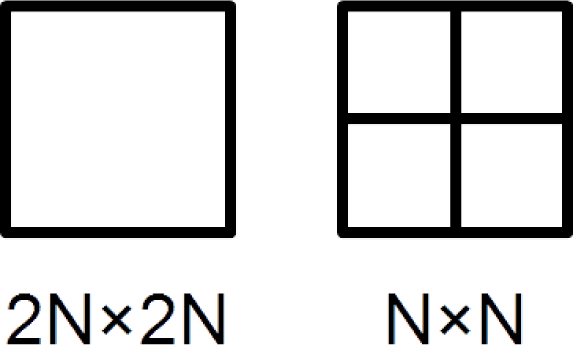
In the case of intra-prediction, there are two possible CU partitions of PUs: 2N × 2N or N × N (Figure 3). The 2N × 2N partitioning forms one PU with the size of the CU, while the N × N partitioning forms four PUs with half the size of the CU being split. However, the N × N intra-partitioning is only possible for the bottom-level CU of a minimal size within the given coding configuration.
The minimum size that the CU can have is 8 × 8 pixels. In the case of 2N × 2N partitioning, one PU covers the whole 8 × 8 CU, and in the case of N × N partitioning, four 4 × 4 PUs cover the 8 × 8 CU. It is also possible to restrict the minimum CU size to 16 ×16 or even 32 × 32, but this configuration does not find real applications.
The arithmetic coding of CU partitioning makes sense only for the CUs at the bottom level of the partitioning quadtree, i.e., 8 × 8 CUs. The SBAC codes one context-dependent symbol to indicate the PU partition mode. The value of one indicates the 2N × 2N partitioning, while the value of zero indicates the N × N partitioning.
Prediction data stored in a PU specify the intra-mode used for the prediction of luma samples within the PU. There are a total of 35 possible intra-prediction modes. Without arithmetic coding, the indication of the chosen intra-prediction mode would take six bits in the bitstream.
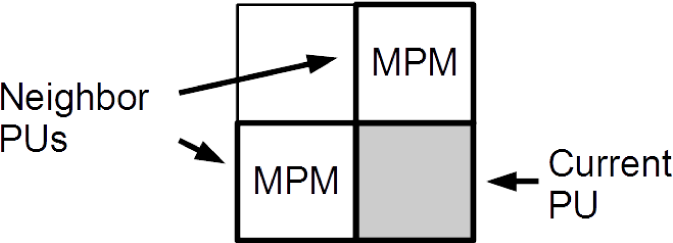
The SBAC distinguishes intra-prediction modes from the most probable modes (MPM) and the rest. To simplify the presentation of the arithmetic coding, we will refer to those that are “not MPM” as the least probable modes or LPM.
A list of MPM contains three elements. Generally, the MPM list depends on whether the left and the above neighbor PUs (Figure 4) are available for the current PU. Their intra-prediction modes form two elements of the MPM list. Unavailable neighbor PUs or neighbor PUs with inter-prediction are substituted with the DC predictor. The derivation process for the rest of elements in the MPM list can be found in [13].
The arithmetic coding of the PU intra-prediction mode starts with the context-dependent bin. When this bin is equal to one, the intra-prediction mode is included in the MPM list. When the bin is equal to zero, the intra-prediction mode is LPM. It takes 1–2 bypass bins to code the index of the corresponding intra-mode in the MPM list. In the case of LPM, it takes five bypass bins to code the remainder of the intra-prediction mode: given that the selected prediction mode is not one of the three MPM modes, only 35 − 3 = 32 = 25 possible modes are left.
It is not a problem to count the number of bypass-coded bins that directly corresponds to the number of bits in the coded sequence. At the same time, the accurate entropy estimation for the context-dependent bin is of a high value.
Intra-prediction of chroma samples is performed separately from the prediction of luma samples. Intra-prediction for chroma planes is indicated by the first PU in a CU in the case of 4:2:0 subsampling. However, the chroma intra-prediction mode depends on the one chosen for luma prediction and is indicated in the corresponding syntax element of the H.265/HEVC video sequence [13]. The first bin of this syntax element is context-dependent. The value of zero unambiguously means that the chroma intra-prediction mode is identical to the luma intra-prediction mode of the first PU within a CU and that no other bins follow. The value of one means that the chroma intra-prediction mode is different from the luma intra-prediction mode. In this case, its value can be planar, DC, vertical, horizontal or vertical down-left (Mode 34) [13]. In the latter case, the context-dependent bin is followed by the two bypass-coded bins.
We collected statistics on the average self-information of the described context-dependent bins with the HM v.13.0 [10] reference encoder and JCT-VCtest video sequence set [14,15]. Class E* test sequences correspond to the older test set [15], but we included them in our experiments for the completeness of the obtained results. The average results combined within Classes A–F [14] of the sequences are given in Table 1.
Obviously, 2N × 2N is the most probable partitioning mode for the bottom level CU, as soon as the self-information of the corresponding bin value is less than the self-information of the N × N partitioning bin value. On average, the indication of 2N × 2N partitioning takes 0.65 bits in the coded sequence, while the indication of N × N partitioning takes 2.06 bits. However, on several video sequences, the situation is different. For the sequences Cactus, Kimono (Class C) and Four People (Class E), N × N partitioning produces less bits per context-dependent bin compared to 2N × 2N partitioning. At the same time, Class C video sequence RaceHorses produces almost an identical number of bits for both partitioning modes. Those video sequences have more details, and 4 × 4-pixel prediction is used more often than in other sequences. Therefore, the obtained estimation of the entropy value when used in RDO will increase the RDcost of 4 × 4 prediction units, and they will be chosen less often. This influence of RDcost might change the frequency of N × N partitioning selection and provide a higher bit rate overhead for the mentioned video sequences.
Algorithm 1. Estimation of the luma prediction header size.
Entropy 16 06667f11
The indication of the MPM happens more often for most of the test video sequences, providing the average self-information of the corresponding context-dependent bin equal to 0.58. There are no cases in the test video sequences set for which LPM is more probable. However, the sequences, PartyScene (Class C), RaceHorses, BQSquare and BlowingBubbles (Class D), have almost equal probability of MPM and LPM. The replacement of BAC-based estimation with the precalculated entropy estimation should force the encoder to increase the selection of MPM in the RDO process for those sequences.
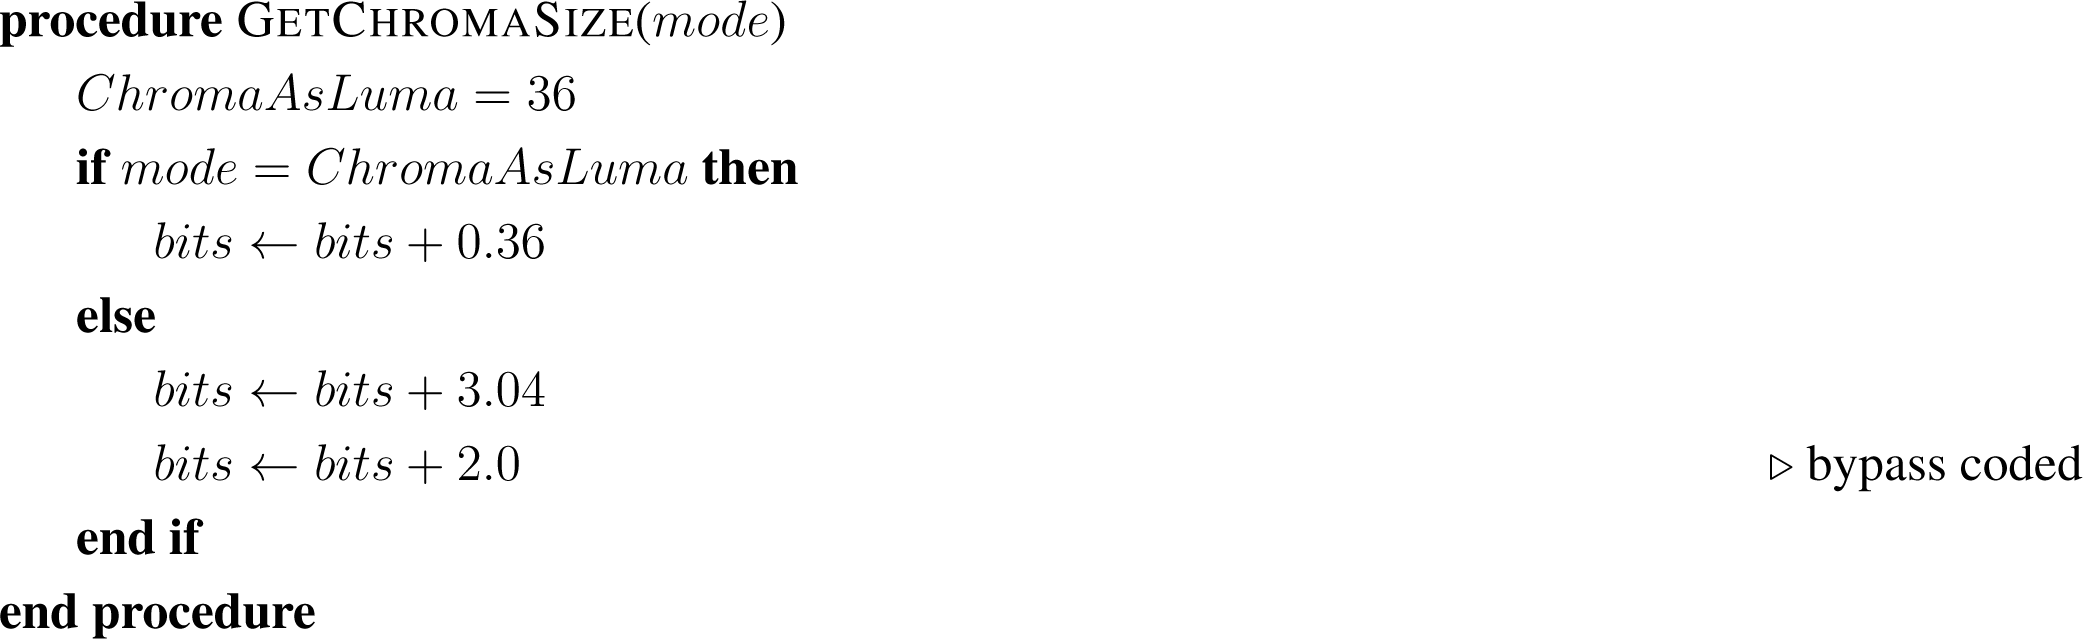
The average self-information of the context-dependent bin to indicate the intra-prediction of the chroma plane is 0.36, which means that this value is the most probable and the most commonly used.
Algorithm 2. Estimation of the chroma prediction header size.
Entropy 16 06667f12
It looks reasonable to substitute the arithmetic coding of the prediction header with the bit counting procedure of bins after binarization. A bit counting of bypass-coded bins consists of counting the number of these bins, as they directly correspond to one bit on the input of SBAC. Bit counting of context-dependent bins is built upon the calculated average self-entropy of the bin values without consideration of the probability states of the context models of the arithmetic coder itself.
The algorithm of luma intra-prediction bit counting is given in Algorithm 1, while the bit counting algorithm for the intra-prediction of the chroma plane is given in Algorithm 2.

3.3. Residual Data Rate Estimation
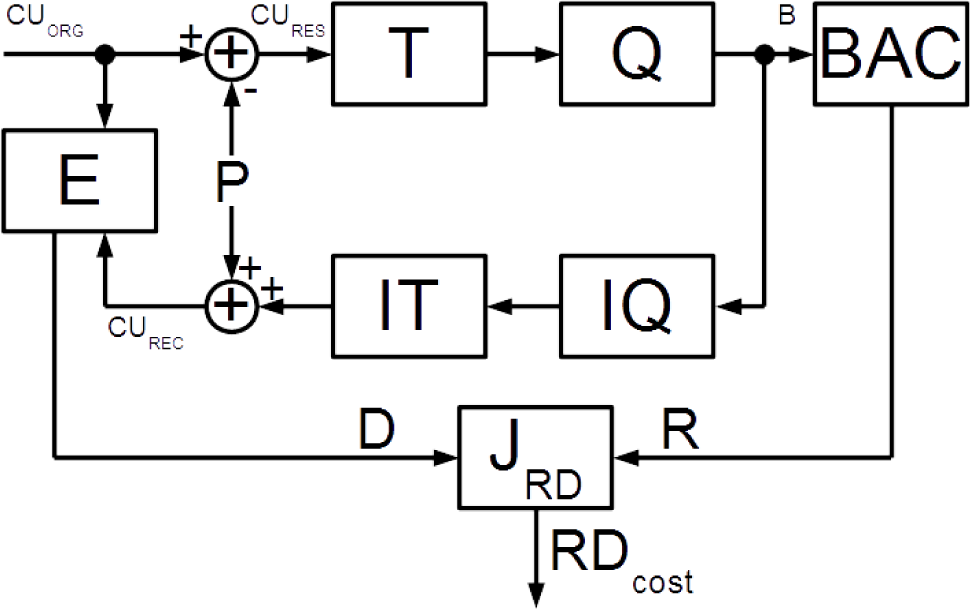
Residual data (CURES on 
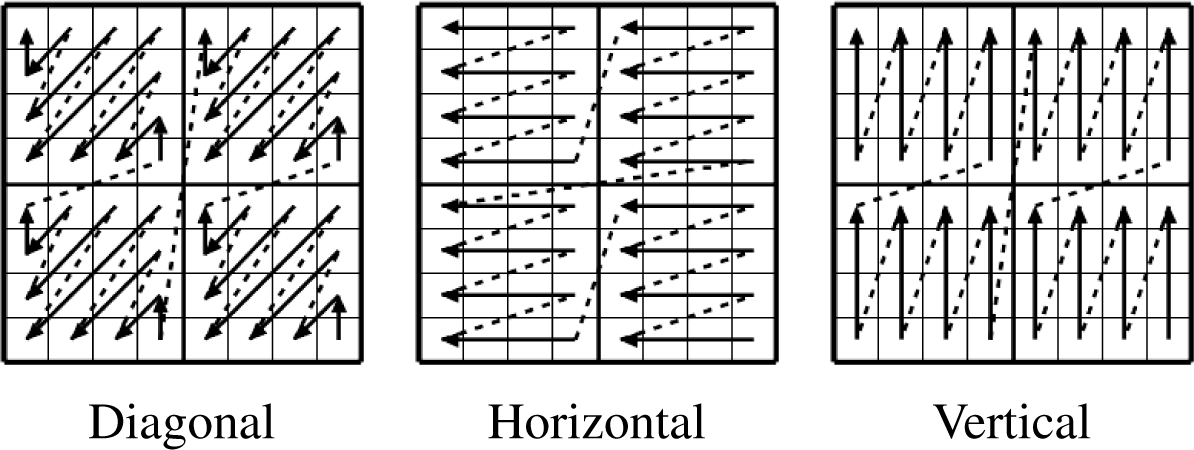
Figure 1) is the data left after the subtraction of predicted pixel values from the original pixel values of a coding unit. The residual pixel values are subject to discrete transform and quantization. Residual data coding in HEVC is performed on the level of a transform block (TB). TB is a matrix of transformed and quantized residuals. Its size can be 32 ×32, 16 ×16, 8 ×8 or 4 ×4. The coefficients are scanned in diagonal, horizontal or vertical order depending on the intra-prediction mode (Figure 5). Any TB is scanned within 4 ×4 sub-blocks. The diagonal scan starts from the bottom right corner and proceeds to the top left corner, scanning each diagonal line in the direction from top right to bottom left. The scan pattern consists of a diagonal scan of the 4 ×4 sub-blocks and a diagonal scan within each of the 4 ×4 sub-blocks [16]. Horizontal and vertical scans (Figure 5) may also be applied in the intra-case for 4 ×4 and 8 ×8 TBs. The horizontal and vertical scans are defined row-by-row and column-by-column, respectively, within the 4 ×4 sub-blocks. The scan over the 4 ×4 sub-blocks is the same as within the sub-block.
Transform block coding in H.265/HEVC requires data relegation to eight syntax groups:
  • Significant coefficient flag (SC);
  • Significant coefficients group flag (SG);
  • Last significant coefficient position X (PX);
  • Last significant coefficient position Y (PY);
  • “Coefficient value greater that one” flag (G1);
  • “Coefficient value greater than two” flag (G2);
  • Coefficients signs (SIGNS);
  • Remaining coefficient level (RL).
At first, the XY position of the last significant coefficient in a scan order is determined and arithmetically coded (PX and PY). A coefficient group (CG) is defined as a set of 16 consecutive coefficients (corresponds to a 4 ×4 sub-block) in the scan order. A group having at least one non-zero coefficient is considered significant (SG). Second, each group of significant coefficients is coded by flags indicating whether the coefficients are significant (SC), thus forming a map of significant coefficients. Then, for each significant coefficient, a flag indicating whether its absolute value is greater than one (G1) is coded consequently. After that, for the first coefficient with an absolute value greater than one, an additional flag for whether its absolute value is greater than two is coded (G2). To determine the signs of the coefficients, a sign map (SIGNS) is coded. Finally, the remaining values of the coefficients (RL) are coded.
The symbols of each syntax group are coded with a separate probability context, except for SIGNS, RL and part of PX and PY. Those symbols are coded in the bypass mode: the probabilities of symbol 0 and symbol 1 are considered equal; therefore, the usual update of the SBAC state is skipped.
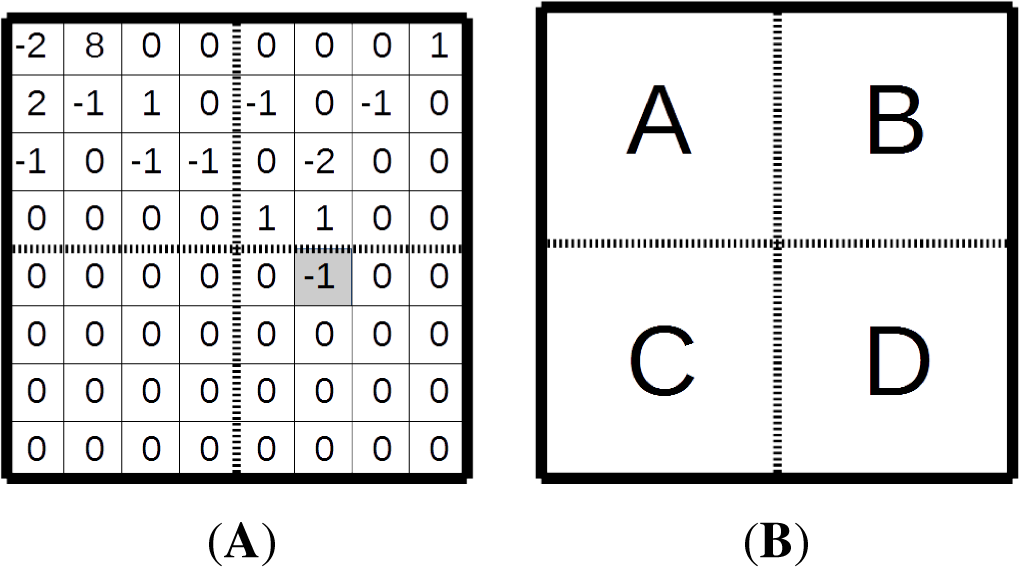
For example, let us consider the arithmetic coding of a sample 8 ×8 matrix of quantized transform coefficients depicted in Figure 6A. The position (5;4) of the last significant coefficient, −1, is highlighted. It is coded first. Let us assume that the scanning order is diagonal. The TB has four 4 ×4 sub-blocks, A, B, C and D, in Figure 6B. The first significant coefficient group, Group D, has a non-zero element. The significant coefficients group flag 1 is not coded, as it obviously equals one for the group containing the last significant coefficient. The map of significant coefficients does not include the last significant coefficient and consists of two flags, both zero. The absolute value of −1 is not greater than one; therefore the G1 flag equals zero. The final bin is the sign flag 1 of the coefficient.
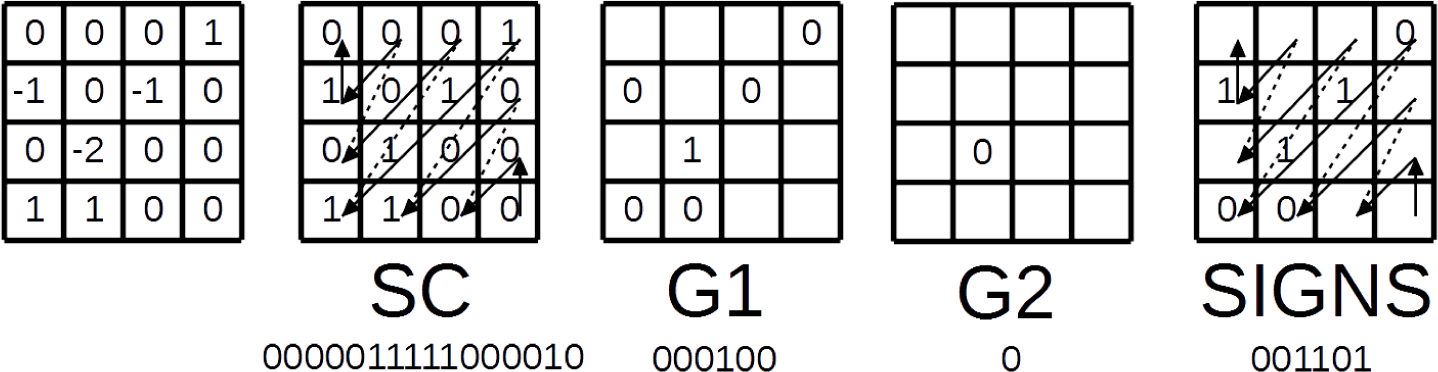
The next CG in diagonal scan order is Group B (Figure 6B). It has non-zero coefficients; therefore, the SG flag is one. The coding of the map of significant coefficients is illustrated in Figure 7. SC flag values and the bins on the input of SBAC are shown under the corresponding blocks on Figure 7. For the significant coefficients, the flags of whether they are greater that one are coded. For this particular block, the G1 bins would be 000100. For the first coefficients greater than one, the G2 flag 0 is coded. Finally, the coefficient sign bins would be 001101.
The next CG in the diagonal scan order is Group C (Figure 6B). It consists of zero coefficients; therefore, the SG flag is 0, and no more bins are coded for this group.
The coding of Group A (Figure 6B) has the same order as Group B, so we would skip the detailed description.
The symbols generated to describe residual data are coded with SBAC using a total of seven context groups:
  • Significant coefficient flag (SC);
  • Significant coefficient group flag (SG);
  • Last significant position X (PX);
  • Last significant position Y (PY);
  • Coefficient value greater that one flag (G1);
  • Coefficient value greater than two flag (G2);
  • Bypass mode (BP)
In fact, each context group has several probability subgroups, but we omit them to simplify the algorithm.
With the HM reference encoder, we collected the statistics on the number of bins by context groups on the input of SBAC for the JCT-VC test video sequences. The results are almost the same for all of the test sequences; therefore, in 
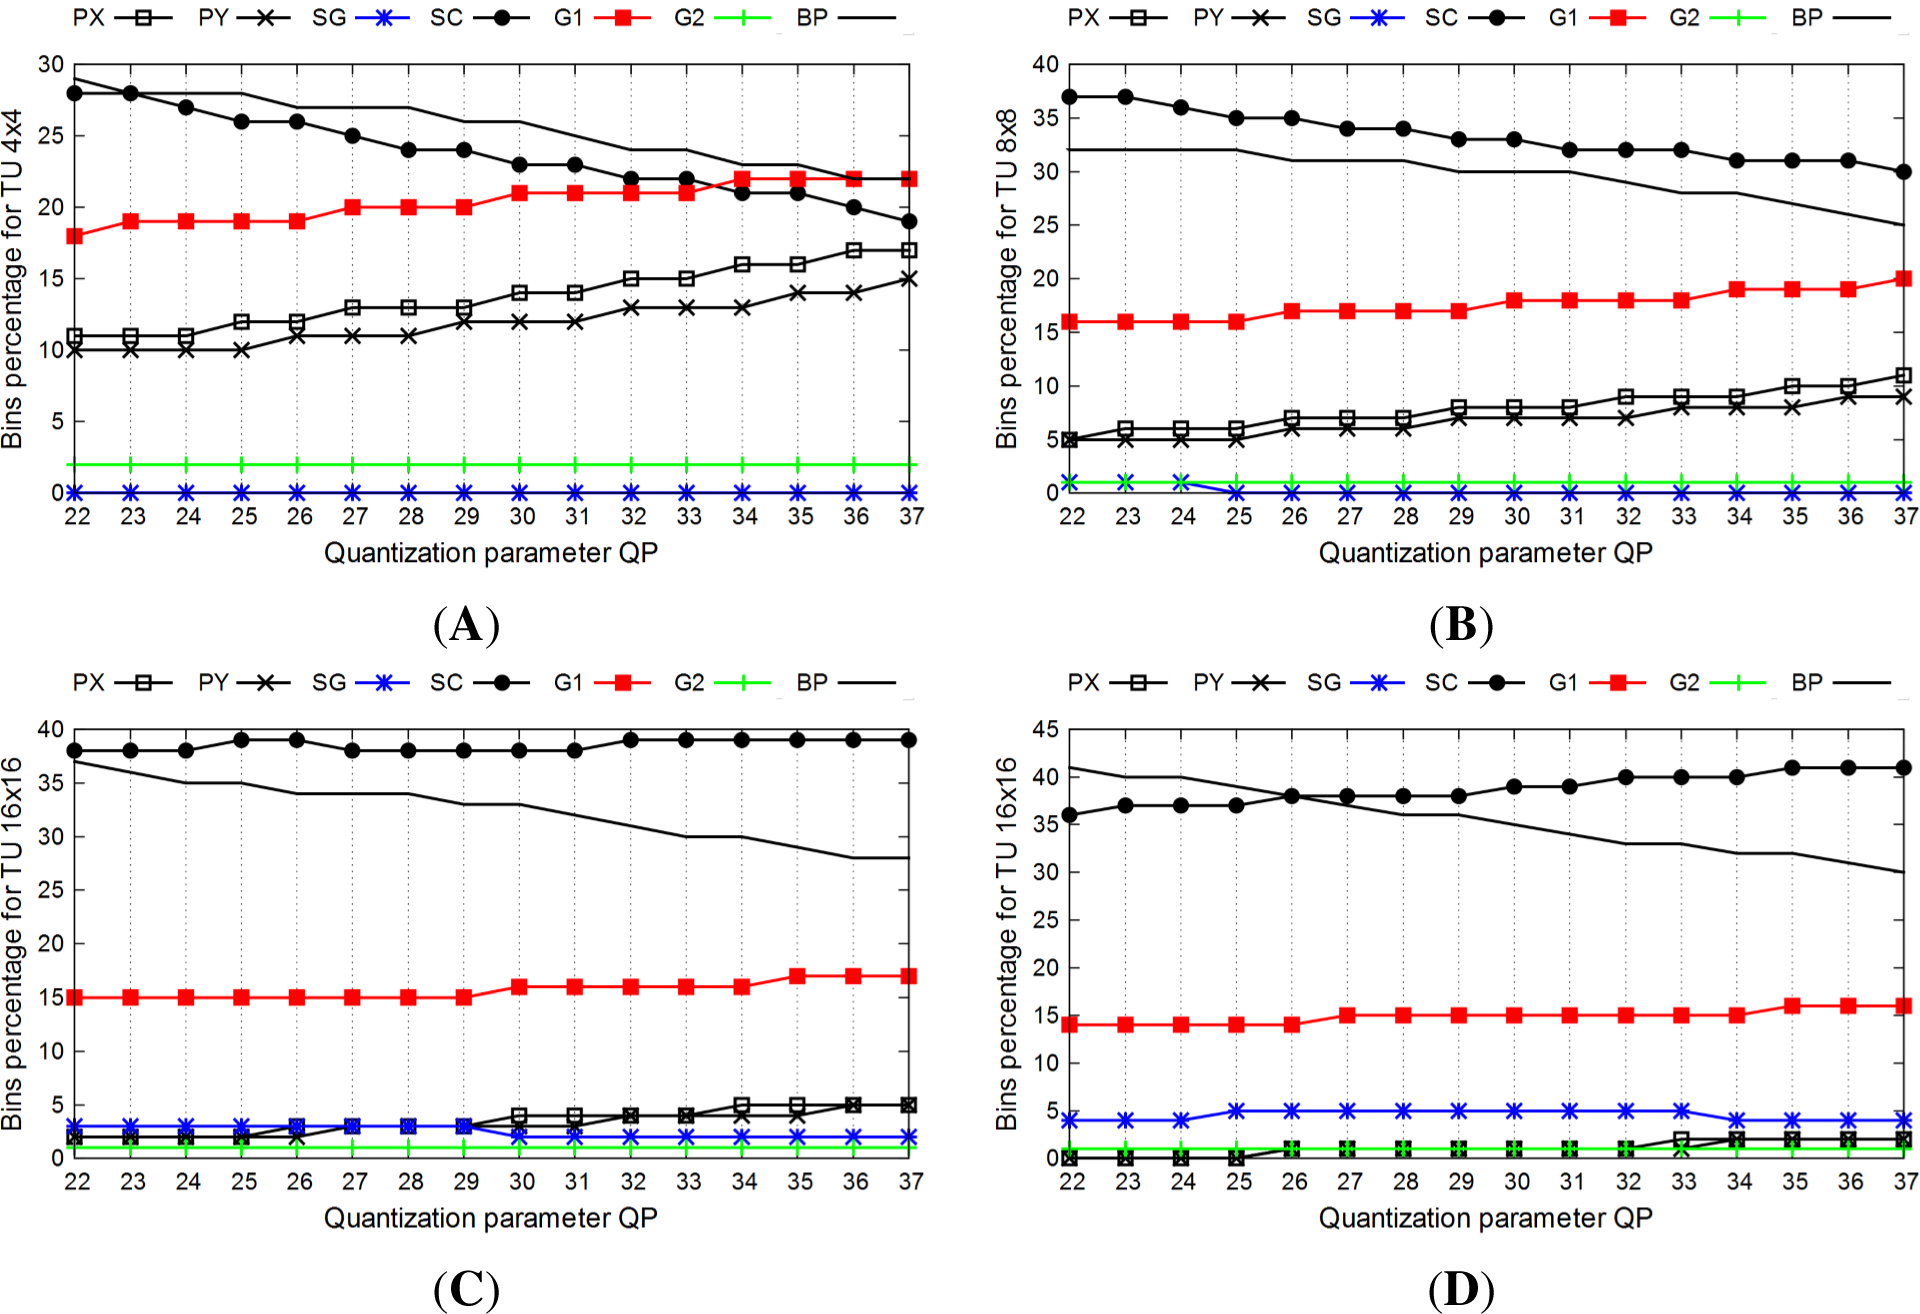
Figure 8, we illustrate an example of a bin distribution by context groups for the BasketballDrill video sequence for 4 ×4, 8 ×8, 16 ×16 and 32 ×32 transform units (TUs). The bypass-coded bins and SC bins take most part of the message to arithmetically code: approximately 20–40% each. The higher the block size is, the less the part of the information on the last significant coefficient position taken. On 4 ×4 TUs, almost 20% of the bins are PX or PY. While on the 8 ×8 TUs, this information takes only 10% and even less on the bigger TUs. Furthermore, the percentage of those bins increases with the increase of the quantization parameter.
To get the value of R, the full arithmetic coding must be performed. We suggest estimating the information entropy H(Bi) of the symbols Bi within the i–th context group [4,17]:
H ( B i ) = J = 0 1 p i ( j ) l o g 2 p i ( j ) ,
where pi(j) is the occurrence probability of the symbol jZ, 0 ≤ j ≤ 1 in the message Bi. Considering that Ni = S(Bi) is the total number of symbols in the message Bi, the estimated bit rate will be:
R ^ ( B ) = i = 1 7 H ( B i ) S ( B i )
where H(B7) = 1.0 for bypass-coded bins, and seven is the number of context groups.
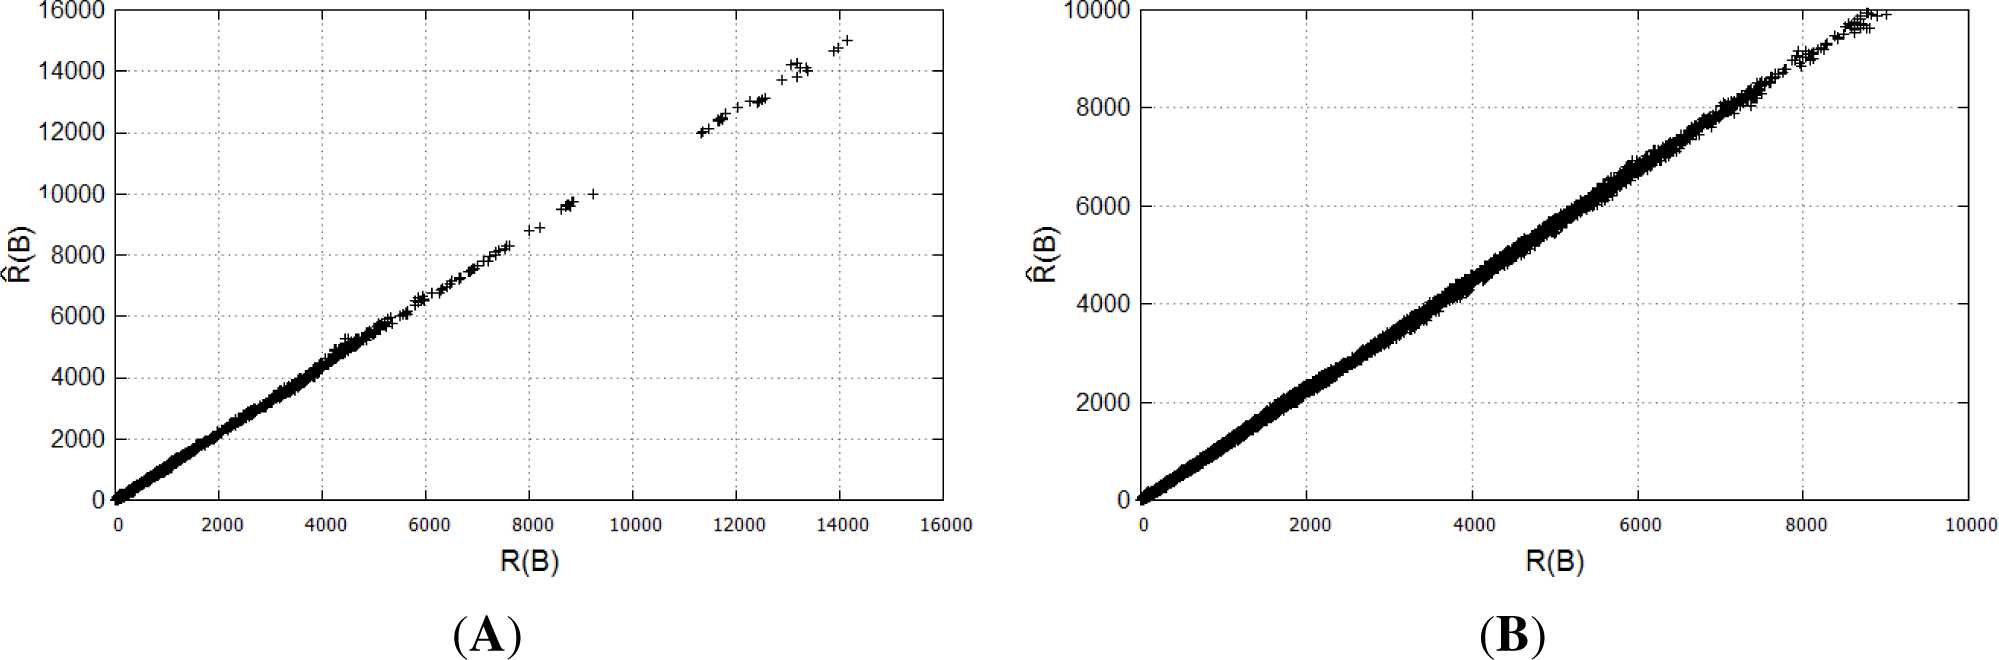
We compared our estimation R ^ ( B ) with the real rate value R(B) for each estimated block in the HM reference encoder [10] on the JCT-VC test sequences [18]. A scatter plot showing the distribution of values R ^ ( B ) and R(B) for the BasketballDrill and PeopleOnStreet test sequences is given in Figure 9. Estimation of R ^ ( B ) has almost a linear relation with R(B). On the JCT-VC test sequences, we gathered statistics on R(B) of a coding unit and its evaluation R ^ ( B ). We estimated the correlation coefficient as:
c o r r ( R ^ ( B ) , R ( B ) ) = c o v ( R ^ ( B ) , R ( B ) ) σ R ^ σ R
where c o v ( R ^ ( B ) , R ( B ) ) is a covariance of R ^ ( B ) and R(B), while σ R ^ and σR are the corresponding standard deviations. The correlation coefficient between our estimation R ^ ( B ) and real value R(B) for all test sequences roughly equals 0.999.
A high correlation between the rate evaluation R ^ ( B ) and the real rate value R(B) provides an opportunity to accurately approximate a scatter plot of the rate estimation with a linear dependency R ^ ( B ) = a R ( B ) + b. Approximation parameters a and b determine the offset of the evaluation R ^ ( B ). We evaluated the average values of the parameters a and b for the estimation R ^ ( B ) on the JCT-VC test sequences. The experiment showed that, on average, the value of b → 0, and the value of a ≈ 1.08. With the value of a not equal to one, we overestimate the real value R(B), which is equivalent to the change of the parameter λ in Equation (1). Therefore, to compensate for the overestimation, we introduce the normalization coefficient k = 1/a = 0.93.

4. Proposed Fast Rate Estimation Algorithm

The proposed algorithm of fast rate estimation is given in Algorithm 3. Based on the observations made in Section 3, we suggest estimating the rate R by calculating a message entropy within each syntax group Bi. The entropy value H(Bi) of bins in the Bi syntax group is used to estimate the bit rate of a message. We also count the bit size of the prediction header as described in Subsection 3.2. The overall estimation R ^ ( B )
of the rate R(B) is the sum of the entropy-based estimation of the syntax group rate and the bit counting of the prediction header size. The proposed algorithm does not involve arithmetic coding, which simplifies the JRD estimation. Furthermore, the elimination of the arithmetic coder reduces block interdependencies that might be used in the development of the RDO estimation algorithm with the parallel processing of several blocks.

5. Results and Discussion

The research was carried out with the HM [10] reference software on the JCT-VC [18] test sequences. The comparisons were made with the Bjontegaard delta rate [19]. Table 2 shows the loss of the compression efficiency of the HM reference encoder with the proposed fast RDO estimation algorithm.
Algorithm 3. Fast rate estimation.
Entropy 16 06667f13
The “intra-Main” configuration was selected with the rate-distortion optimized quantization (RDOQ) option turned off. The BD-RATE column corresponds to the Bjontegaard delta rate with regard to average peak signal-to-noise ratio (PSNR) value of luma and chroma. The combined PSNR (PSNRYUV) is calculated as the weighted sum of the PSNR per picture of the individual components (PSNRY, PSNRU and PSNRV) [20]:
P S N R Y U V = ( 6 P S N R Y + P S N R U + P S N R V ) / 8 ,
where PSNRY, PSNRU and PSNRV are each computed as:
P S N R = 10 l o g 10 ( 2 B 1 M S E A V G ) ,
with B = 8 and B = 10 the number of bits per sample of the video signal to be coded for 10-bit (Nebuta and SteamLocomotive) and eight-bit video sequences, and MSEAVG is the average MSE value for the video frames:
M S E A V G = 1 N i = 1 N M S E i ,
where N is the number of video frames in a sequence, and the MSE is the sum of squared differences (SSD) divided by the number of samples in the signal [20].
We also evaluate Bjontegaard delta rate with regard to the PSNRY value of the luma color component (BD-RATE (Y)). Furthermore, we calculate Bjontegaard delta PSNR values BD-PSNR (Y) and BD-PSNR (UV) as an average delta PSNR for the luma and chroma components, respectively. The value ∆T represents the average savings of the compression time of the HM reference encoder for a certain test sequence:
Δ T T O u r H M T O r i g i n a l H M T O r i g i n a l H M 100 %
For the cases when the compression efficiency of the modified HM encoder is very close to the original, the Bjontegaard delta rate metric starts showing incorrect results [21] if only four quantization parameters are used, as suggested in [14]. Therefore, we obtained results for all quantization parameters in the range [22; 37] and performed rate-distortion (RD-curve) approximation using the fourth order polynomial. This resulted in more reliable results, given in Table 2.
The average bit rate overhead on the JCT-VC test sequences, including Class E*, is 1.54% and 1.56% without Class E* test sequences. The compression efficiency loss on the 10-bit sequences, Nebuta and SteamLocotive, is only 0.43% and 0.41%, respectively. These sequences have smooth textures that neglect the mode decision errors. On the other hand, sequences BQMall, PartyScene, BQSquare, BlowingBubbles, BasketballPass and SlideEditing have a lot of details that reveal the mode decision errors. This results in a 1.96%–2.35% bit rate overhead.
Figure 10 provides sample RD-plots for several test sequences. Illustration of RD-plots for the sequences, BQTerrace (Figure 10A) and Nebuta (Figure 10B), is recommended in [21]. The highest compression efficiency loss of the HM encoder is 2.35% on the SlideEditing test sequence (Figure 10C). The second highest bit rate overhead for the BQSquare test sequence (Figure 10D) is 2.24%.
Since our rate estimation eliminates arithmetic coding from the RDO estimation process, we do not preserve the SBAC state and, therefore, do not perform exhaustive copying operations. This results in the reduction of the total compression time of the HM encoder by 12–25%.
The proposed algorithm basically consists of the size estimation of the prediction information and the residual information. While the total bit rate overhead is 1.54%, the prediction header estimation errors provide 0.09% overhead [22], while the rest is provided by the residuals estimation errors.
The elimination of the arithmetic coder from the rate estimation also influences RDOQ. As our research is dedicated to proper rate estimation, we provided comparison results for the HM reference encoder with RDOQ turned off. Due to our research, RDOQ, on average, provides 3.5% bit rate savings. With our entropy-based rate estimation, it is possible to perform the RDOQ step based on the initial SBAC probabilities. With this approach, we achieved 3.3% bit rate savings, on average.
Additionally, as soon as our RDO approach eliminates block interdependencies and enables multithreading, there is a possibility of the quasi-linear speed-up of the compression algorithm. The overall compression time strongly depends on the implementation of the compression dataflow, memory management and multithreading model; therefore, we did not implement multithreading encoding in the HM reference encoder, which is known to have shortcomings in those parts. Obviously, the proposed algorithm provides parallel block estimation possibilities itself and may be further combined with other approaches, including the wavefront parallel processing (WPP). In all of those cases, the simplified rate estimation for RDO mode decisions is able to provide 17% time savings on average for each computing thread of block estimation.
The experimental results for our RDO estimation algorithm are given with respect to the HM v.13.0 reference encoder, which simplifies the rate estimation with the table-based bit estimation for the arithmetic coder, introduced in [8]. In this approach, the bit counting procedure is simplified, wherein bit counts are estimated using tables. This simplification does not impact rate-distortion performance, while reducing the encoding time by 1 to 5%. However, it still requires SBAC state handling for correct estimation.
In [9], low-complexity RDO algorithms for HEVC intra-prediction are presented. Generally, the algorithms are based on the residual data rate estimation on the center of mass for the transformed and quantized coefficients. Rate estimation for the intra-prediction header is still performed by the SBAC. The proposed algorithms are said to provide 1.93% bit rate overhead, which is slightly higher compared to our proposed algorithm. Furthermore, the authors estimate the time savings of the RDO algorithm only, but not for the total coding time, which makes it difficult to compare our estimation of the total compression time reduction. Furthermore, the implementation of out bit counting procedure for the size estimation of the intra-prediction header could benefit the time savings in [9], providing the ability to eliminate SBAC entirely from the bit counting procedure.

6. Conclusions

The proposed approach for the fast rate estimation at the RDO stage in the H.265/HEVC compression process provides an average bit rate overhead of 1.54% for the JCT-VC test sequences. The approach does not involve arithmetic coding for rate estimation; therefore, we were able to eliminate exhaustive SBAC state preserving and restoring operations. This gave us a 17.07% speed up of the HM reference encoder in the “intra-Main” configuration.
It is worth mentioning that elimination of the SBAC from the RDO estimation reduces block interdependencies, thus providing an opportunity for the development of the compression system with parallel processing of multiple blocks of a video frame.

Acknowledgments

The results were obtained at Tomsk State University of Control Systems and Radioelectronics as part of the complex project, ‘Provision of multimedia broadcasting services in Internet public networks, based on peer-to-peer network technology and adaptive data streaming’ with the financial support of the Ministry of Education and Science of the Russian Federation.
The authors would like to thank Nikolay G. Markov for the general review of the experimental results. The authors also would like to thank Vladislav V. Marchenko, for the review of the final paper.

Author Contributions

M.P. Sharabayko performed the development of the algorithm and provided the main contributions to the writing of the article. O.G. Ponomarev supervised the results of the experiments and contributed to the research data analysis and verification. Both authors have read and approved the final manuscript.

Conflicts of Interest

The authors declare no conflict of interest.

References

  1. Sharabayko, M.; Ponomarev, O.; Chernyak, R. Intra-Compression Efficiency in VP9 and HEVC. Appl. Math. Sci. 2013, 7, 6803–6824. [Google Scholar]
  2. Grois, D.; Marpe, D.; Mulayoff, A.; Itzhaky, B.; Hadar, O. Performance Comparison of H.265/MPEG-HEVC, VP9, and H.264/MPEG-AVC Encoders. Proceedings of 30th Picture Coding Symposium 2013 (PCS 2013), San Jose, CA, USA, 8–11 December 2013; pp. 394–397.
  3. Sharabayko, M. Next Generation Video Codecs: HEVC, VP9 and DAALA. In Youth and Contemporary Information Technologies; Tomsk Polytechnic University: Tomsk, Russia, 2013; Volume 13, pp. 35–37. [Google Scholar]
  4. Berger, T. Rate Distortion Theory: Mathematical Basis for Data Compression (Prentice-Hall Series in Information and System Sciences); Prentice-Hall: Endlewood Cliffs, NJ, USA, 1971; p. 352. [Google Scholar]
  5. Stockhammer, T.; Kontopodis, D.; Wiegand, T. Rate-distortion optimization for JVT/H.26L video coding in packet loss environment. In International Packet Video Workshop on Packet Loss Environment; Munich University of Technology: Munich, Germany, 2002; pp. 1–12. [Google Scholar]
  6. Sullivan, G.J.; Wiegand, T. Rate-distortion optimization for video compression. IEEE Signal Process. Mag. 1998, 15, 74–90. [Google Scholar]
  7. Wiegand, T.; Girod, B. Lagrange multiplier selection in hybrid video coder control. In Proceedings of International Conference on Image Processing; IEEE: Thessaloniki, Greece, 2001; Volume 3, pp. 542–545. [Google Scholar]
  8. Bossen, F. CE1: Table-based bit estimation for CABAC. In Document of ITU-T Q.6/SG16 JCTVC-G763; ITU-T: Geneva, Switzerland, 2011. [Google Scholar]
  9. Sheng, Z.; Zhou, D.; Sun, H.; Goto, S. Low-Complexity Rate-Distortion Optimization Algorithms for HEVC intra-Prediction. In MultiMedia Modeling; Springer International Publishing: Berlin, Germany, 2014; Lecture Notes in Computer Science; Volume 8325, pp. 541–552. [Google Scholar]
  10. HEVC software repository. Available online: https://hevc.hhi.fraunhofer.de/svn/svn_HEVCSoftware/ accessed on 17 December 2014.
  11. Zhao, L.; Zhang, L.; Ma, S.; Zhao, D. Fast mode decision algorithm for intra-prediction in HEVC. Proceedings of Conference of Visual Communications and Image Processing (VCIP), Tainan, Taiwan, 6–9 November 2011; pp. 1–4.
  12. Sole, J.; Joshi, R.; Nguyen, N.; Ji, T.; Karczewicz, M.; Clare, G.; Henry, F.; Duenas, A. Transform Coefficient Coding in HEVC. IEEE Trans. Circ. Syst. Video Tech. 2012, 22, 1765–1777. [Google Scholar]
  13. Recommendation ITU-T H.265: High Efficiency Video coding. 2013. Available online: http://www.itu.int/dms_pubrec/itu-t/rec/h/T-REC-H.265-201304-S!!SUM-HTM-E.htm accessed on 19 December 2014.
  14. Bossen, F. Common test conditions and software reference configurations. ITU-T SC16/Q6, 11th JCT-VC Meeting, Shanghai, China, 10–19 October 2012. Doc. JCTVC-K1100.
  15. Bossen, F. Common test conditions and software reference configurations. ITU-T SC16/Q6, 2nd JCT-VC Meeting, Geneva, Switzerland, 21–28 July 2010. Doc. JCTVC-B300.
  16. Sole, J.; Joshi, R.; Karczewicz, M. Non-CE11: Diagonal Sub-Block Scan for HE Residual Coding. Input Document to JCT-VC JCTVC-G323, 7th Joint Collaborative Team on Video Coding (JCT-VC) Meeting, Geneva, Switzerland, 2011.
  17. Shannon, C.E. A mathematical theory of Communication. Bell Sys. Techn. J 1948, 27, 379–423. [Google Scholar]
  18. JCT-VC test sequences. Available online: ftp://ftp.tnt.uni-hannover.de/testsequences accessed on 17 December 2014.
  19. Bjontegaard, G. Improvements of the BD-PSNR model. ITU-T SC16/Q6, 35th VCEG Meeting, Berlin, Germany, 16–18 July 2008. Doc. VCEG-AI11.
  20. Ohm, J.; Sullivan, G.; Schwarz, H.; Tan, T.K.; Wiegand, T. Comparison of the Coding Efficiency of Video Coding Standards—Including High Efficiency Video Coding (HEVC). IEEE Trans. Circ. Syst. Video Tech. 2012, 22, 1669–1684. [Google Scholar]
  21. Wang, J.; Yu, X.; He, D. On BD-Rate calculation. Presented at 6th JCT-VC Meeting, Torino, Italy, 14–22 July 2011. Doc. JCTVC-F270.
  22. Sharabayko, M.; Ponomarev, O. Intra Prediction Header Bits Estimation Algorithm for RDO in H.265/HEVC. Appl. Math. Sci. 2014, 8, 8721–8736. [Google Scholar]
Figure 1. Rate-distortion optimization (RDO) block estimation data-flow.
Entropy 16 06667f1
Figure 2. SBAC abstraction as a Mealy machine.
Entropy 16 06667f2
Figure 3. Coding unit (CU) partitioning on prediction units (PUs) in the case of intra-prediction.
Entropy 16 06667f3
Figure 4. Illustration of the neighbor PUs, whose intra-prediction modes are the MPM (most probable mode) for the current PU.
Entropy 16 06667f4
Figure 5. Scan patterns for an 8 ×8 transform block.
Entropy 16 06667f5
Figure 6. Residual data block example with (A) coefficients and (B) coefficient groups.
Entropy 16 06667f6
Figure 7. Arithmetic coding of coefficient Group “B”.
Entropy 16 06667f7
Figure 8. Average percentage of bins by context groups for the input of the SBAC on the BasketballDrill video sequence for (A) 4 ×4 transform unit (TU), (B) 8 ×8 TU, (C) 16 ×16 TU and (D) 32 ×32 TU.
Entropy 16 06667f8
Figure 9. Scatter plot of the rate estimation on the (A) BasketballDrill and (B) PeopleOnStreet test sequences.
Entropy 16 06667f9
Figure 10. Rate-distortion plots for the (A) BQTerrace, (B) Nebuta, (C) SlideEditing and (D) BasketballDrive test sequences.
Entropy 16 06667f10
Table 1. Average self-information of the context-dependent bins of the prediction unit. LPM, least probable mode.
ClassPartition modeLuma predictionChroma prediction
2N × 2NN × N1 (MPM)0 (LPM)0 (as luma)1
A0.602.140.541.940.333.14
B0.851.660.472.140.372.95
C0.532.470.691.620.512.48
D0.482.230.811.370.492.38
E0.961.320.531.900.243.45
E*0.831.810.511.970.164.01
F0.372.660.492.090.323.28
Average0.652.060.581.860.363.04
Table 2. Compression efficiency loss of the proposed rate estimation algorithm. BD-RATE, Bjontegaard delta rate.
ClassSequenceResolutionHM intra-main
BD-RATE,
%
BD-RATE
(Y), %
BD-PSNR
(Y), dB
BD-PSNR
(UV), dB
T, %
ATraffic2560×16001.271.23−0.07−0.05−15.43
PeopleOnStreet1.471.51−0.09−0.05−16.68
Nebuta0.430.41−0.03−0.02−21.00
SteamLocomotive0.410.46−0.030.00−17.73
BKimono1920×10800.640.50−0.02−0.03−12.29
ParkScene1.411.44−0.06−0.04−16.55
Cactus1.611.58−0.06−0.04−16.98
BQTerrace1.701.73−0.10−0.04−19.66
BasketballDrive1.581.60−0.04−0.03−13.98
CRaceHorses (C)832×4801.351.32−0.09−0.06−18.79
BQMall2.021.89−0.12−0.10−19.00
PartyScene1.961.88−0.15−0.11−23.75
BasketballDrill1.761.67−0.08−0.08−17.20
DRaceHorses (D)416×2401.701.56−0.11−0.11−19.32
BQSquare2.242.17−0.19−0.12−24.21
BlowingBubbles1.961.81−0.11−0.10−20.52
BasketballPass2.021.93−0.11−0.10−17.36
EFourPeople1280×7201.601.64−0.09−0.06−15.33
KristenAndSara1.671.67−0.08−0.06−12.85
Johnny1.481.46−0.06−0.04−13.36
E*Vidyo11280×7201.451.52−0.07−0.03−13.16
Vidyo31.391.50−0.08−0.02−13.75
Vidyo41.291.43−0.06−0.02−12.84
FBaskeballDrillText832×4801.721.60−0.09−0.09−16.96
ChinaSpeed1024×7681.601.39−0.13−0.16−18.21
SlideEditing1280×7202.352.25−0.36−0.26−22.06
SlideShow1.571.48−0.09−0.07−11.89
Average1.541.50−0.10−0.07−17.07

