Article

Self-oscillating Water Chemiluminescence Modes and Reactive Oxygen Species Generation Induced by Laser Irradiation; Effect of the Exclusion Zone Created by Nafion

by
Sergey V. Gudkov
1,2,3,
Maxim E. Astashev
1,2,4,
Vadim I. Bruskov
1,2,
Valeriy А. Kozlov
3,5,
Stanislav D. Zakharov
4,6,7 and
Nikolai F. Bunkin
3,4,5,*
1
Institute of Theoretical and Experimental Biophysics, Russian Academy of Sciences, Pushchino, Institutskaya 3, Moscow Region, 142290, Russia
2
Pushchino State Natural Scientific Institute Pushchino, Nauki prospekt 1, Moscow Region, 142290, Russia
3
Prokhorov General Physics Institute, Russian Academy of Sciences, Moscow, Vavilova 38, 119991, Russia
4
Institute of Cell Biophysics, Russian Academy of Sciences, Pushchino, Institutskaya 3, Moscow Region, 142290, Russia
5
Bauman Moscow State Technical University, Moscow, Second Baumanskaya, 5, 105005, Russia
6
Lebedev Physical Institute, Russian Academy of Sciences, Moscow, Leninskiy prospekt 53, 119991, Russia
7
National Research Nuclear University "MEPhI", Moscow, Kashirskoye shosse 31, 115409, Russia
*
Author to whom correspondence should be addressed.
Entropy 2014, 16(11), 6166-6185; https://doi.org/10.3390/e16116166
Submission received: 20 August 2014 / Revised: 30 October 2014 / Accepted: 17 November 2014 / Published: 21 November 2014
(This article belongs to the Special Issue Entropy and EZ-Water)

Abstract

:
Samples of water inside and outside an exclusion zone (EZ), created by Nafion swollen in water, were irradiated at the wavelength λ = 1264 nm, which stimulates the electronic transition of dissolved oxygen from the triplet state to the excited singlet state. This irradiation induces, after a long latent period, chemiluminescence self-oscillations in the visible and near UV spectral range, which last many hours. It occurs that this effect is EZ-specific: the chemiluminescence intensity is twice lower than that from the bulk water, while the latent period is longer for the EZ. Laser irradiation causes accumulation of H2O2, which is also EZ-specific: its concentration inside the EZ is less than that in the bulk water. These phenomena can be interpreted in terms of a model of decreasing O2 content in the EZ due to increased chemical activity of bisulfite anions (HSO3), arisen as the result of dissociation of terminal sulfonate groups of the Nafion. The wavelet transform analysis of the chemiluminescence intensity from the EZ and the bulk water gives, that self-oscillations regimes occurring in the liquid after the latent period are the determinate processes. It occurred that the chemiluminescence dynamics in case of EZ is characterized by a single-frequency self-oscillating regime, whereas in case of the bulk water, the self-oscillation spectrum consists of three spectral bands.

1. Introduction

At present the proton-exchange membrane Nafion®, developed by the DuPont™ Company, is widely used in the manufacture of low-temperature (i.e., < 1000 °С) hydrogen fuel cells [1]. Nafion is a sulfonated tetrafluoroethylene-based fluoropolymer-copolymer. Its unique ionic properties result from incorporation of perfluorovinyl ether groups terminated with sulfonate groups onto a tetrafluoroethylene backbone [2] (Figure 1).
In Figure 1, n is the number of side chains. Channels with sizes of 2~3 nm are formed in the process of soaking a Nafion plate in water, and the water-swollen Nafion plate is transformed into a membrane. At the same time, a terminal sulfonate group SO3H dissociates in water with detachment of a proton:
R SO 3 H + Н 2 О R SO 3 + H 3 О +
i.e., the internal interface of those channels appears to be charged negatively. This is why the positive ions are attracted to the channels, while the negative ions are repelled, which gives rise to the ion-exchange properties of the membrane. This phenomenon has attracted much interest from biophysicists, since cell membranes behave similarly—selectively transmitting ions of a certain type, and repelling the ions of other type [3]. Additionally, Nafion, being in contact with water, exhibits well expressed hydrophilic properties, i.e., it should affect the near-surface molecular layers of water. It is worth noting that the problem of interaction of a surface having hydrophilic or hydrophobic properties with polar liquids is still beyond a complete comprehension, see, for example, the study [4] and the references therein. Nonetheless, the conventional point of view concerning the hydrophilic hydration radius (i.e., the spatial scale, where the molecular structure of water, contacted with a solid interface, can be treated as an ordered one) consists in this size is about several tens of nanometers due to the effect of the short-range dispersion forces.
In this connection it is necessary to note that according to numerous experimental results obtained by Prof. G.H. Pollack group at the University of Washington (Seattle, WA, USA), the spatial scale of the water layer adjacent to the Nafion interface, where the water is believed to be structured, can amount to hundreds of microns [513]. Particularly, it was shown that near to the “Nafion-polar liquid” a so-termed “exclusion zone (EZ)” interface is formed from the liquid side; the macroscopic characteristics of this area essentially differ from those in the bulk liquid. Colloidal particles at the micron scale are effectively pushed out of the EZ boundary (hence in study [5] this area was referred to as the exclusion zone); the effective size of this area was determined as the distance between the Nafion interface and the border of the colloidal particles suspension and was found with the help of a transmission optical microscope. This technique revealed that for water the EZ radius is 220 μm [5,6], and depends on the diameter of colloid particles, their concentration and the material they are made of [10]. Finally, as was shown in [10,11], a light absorption band centered at a wavelength λ = 270 nm, arises in the EZ. It is important that the EZ scale the grows with time, and the rate of this growth essentially increases provided that the liquid sample is irradiated at a wavelength absorbed by that liquid, see [5,6]. It can be said, as was indicated in [12], that the capability of pushing out the colloidal microspheres was found not only for the “Nafion–water” interface, but also for the case of water close to polyacrylic acid gel, biological tissue, and hydrophilic monolayer with COOH groups. Exclusion zones have also been seen close to collagen gels and vascular endothelium, which was found by using both colloid microspheres and erythrocytes. This fact has allowed the authors of [513] to assume that the EZ effect should be observed for a wide class of hydrophilic substrates.
According to the results of [13], water inside the EZ is a very specific phase of water; this is why the book [13], written by G.H. Pollack, was entitled “The fourth phase of water: beyond solid, liquid, and vapor”. In our recent works [14,15] we show that the water layer adjacent to the Nafion interface has an increased (with respect to ordinary water) refractive index; furthermore, it was found that the EZ water exhibits birefringence properties, which implies the quasi-crystalline structure of that liquid (note that the birefringence of water inside the EZ was first observed in [9]). In our recent luminescent spectroscopy experiments [16] we demonstrated that these intriguing effects can be attributed to the formation of colloidal crystals in the EZ; such crystals are composed of negatively charged rod-like particles—the Nafion polymeric chains—which are disentangled in the bulk of water and are packed with a certain order. It is straightforward to assume that a large class of physical effects, which have been reliably observed in the bulk of liquid water, will exhibit some specificity in the EZ. One of these effects is the chemiluminescence stimulation from a water sample exposed to a short-run (within 5 min) laser irradiation at a wavelength λ = 1264 nm with an intensity of 1 mW/cm2 [17]; the absorption coefficient of water at this wavelength is approximately 1 cm−1. Thus the radiation is effectively absorbed in water, which in accordance with the results of [5,6], can result in an increase in the EZ size. This radiation stimulates the emission of light in the blue—near UV spectral range (more detailed information about the spectrum, unfortunately, was not obtained since the level of measured signal corresponds to only a few tens of photons per second over the entire spectral range); note that this signal eventually (by t0 = 1.5~2.5 h after completing the irradiation of the water sample) comes to a certain stationary level, which is characterized by a self-oscillating dynamic of the emission intensity; the time t0 between the termination of the light exposure and the actual start of chemiluminescence, during which the emission intensity is preserved only on a background level, was termed in [17] as a latent period. The duration of the latent period decreases with increasing temperature, with an increase in the input energy radiation at the mentioned wavelength and with growing content of dissolved molecular oxygen. The stationary regime of the emission was observed within a few hours. According to the results of [17], the effect of the emission stimulation is resonant, i.e., it is most efficiently excited with the wavelength λ = 1264 nm. Furthermore, irradiation at this wavelength results in the accumulation of hydrogen peroxide in water: its content increases from 5 to 18 nM within 6 h after irradiation. The increase in the H2O2 concentration can be due to the following reactions [18]:
3 О 2 + h ν 1 O 2
1 O 2 + H HO 2
O 2 + H + HO 2
HO 2 + HO 2 H 2 O 2 + 1 O 2 .
OH + OH H 2 O 2
2 H 2 O 2 + h ν 1 O 2 + 2 H 2 O
H 2 O 2 + O 2 OH + OH + 1 O 2
The first reaction is related to the photoexcitation of dissolved molecular oxygen with the help of quantum at the wavelength λ = 1264 nm in accordance with the transition 3 Σ g 1 Δ g; as is well known [19], molecular oxygen is transferred from the triplet ground state 3O2 (total electron spin is equal to unity) to the first excited singlet state 1O2 (total electron spin is zero) with the energy of 0.98 eV. The spectrum of molecular oxygen is characterized by a set of fairly narrow absorption bands in the visible and infrared spectral ranges, and the singlet 1O2 state can be achieved for each of these bands, but, as was shown in [20], this transition is most effectively excited by irradiation at the wavelength λ = 1264 nm. The increased content of H2O2 and the resonant nature of the emission excitation allowed the authors [17] to associate the observed effects with photoexcitation of triplet oxygen 3O2 and its transition to singlet oxygen 1O2, followed by accumulation of other reactive oxygen species (ROS) of the electronically excited radical anion O2•−, electronically excited hydroperoxide radical HO2, electronically excited hydroxyl radical HO and hydrogen peroxide H2O2, see (2)–(6). Emerging ROS are luminescent-active in the UV and visible spectral ranges: in the gas phase at the temperatures of several thousand of Kelvin there exist vibronic transitions for O2: B3ΣuX3Σgwithin the range of 130~535 nm, and A3Σu+X3Σg within 243~488 nm (the Schumann–Runge band), and for OH: A2Σ+X2П within 261~411 nm, see tables in the book [21]. Furthermore, electronic excitation of water molecules is achieved in powerful ultrasonic fields, see [22]. Namely, H2O + E→ H2O*OН + H, where E is the excitation energy of the vibrational sublevels of water molecules, which is taken from the ultrasonic wave. The basic contribution to the chemiluminescence, stimulated by the ultrasonic excitation, is made by the following processes [23]:
OH + H + M [ OH M H ] H 2 O + M + h ν ( λ = 250 700 nm )
here M is third particle (molecule of water or dissolved gas):
OH + OH H 2 O 2 + h ν ( λ = 250 ~ 420 nm )
H 2 O OH + H + h ν ( λ = 200 ~ 310 nm )
Note that these transitions occur inside the gas bubbles at very high temperatures. Unfortunately, we have no information about the excitation of these transitions at room temperature; we currently conduct experiments on a detailed characterization of the chemiluminescence spectra from water induced by the wavelength λ = 1264 nm radiation. Summarizing, the emission of light, reported in [17,24], is caused by the radiative recombination of the ROS. In the study [17] the periods of changing the chemiluminescence intensity were measured; these periods appear to be equal to 300 and 1150 s. These times correspond to the oscillation periods of the concentration ratio for the ortho and para spin isomers of water molecules [25]; below (in Section 3.4) we qualitatively discuss the correlation between these processes.
As was shown in our previous work [15], bisulfite anions are effectively accumulated in the EZ. Bisulfite anion interacts with the dissolved molecular oxygen by the reaction:
2 HSO 3 + O 2 2 HSO 4
resulting in a reduction of O2 content in the EZ. Thus we expect a decrease in the chemiluminescence intensity, as well as an increase in the duration of the latent period. Furthermore, since the EZ is a special phase of water, it is natural to expect that the characteristic self-oscillation periods in the chemiluminescence intensity from the EZ can differ from the periods of these self-oscillations from the bulk water. The aim of this work is to find features of the chemiluminescence excitation by the radiation at λ = 1264 nm in the EZ. We decided on this experiment, because it looks rather simple to implement. Indeed, Nafion is an optically transparent polymer, i.e., Nafion plates can be used as the windows of our experimental cell and the cell itself can be manufactured in such a way that the thickness of the liquid layer in the cell can be about the EZ size.

2. Results and Discussion

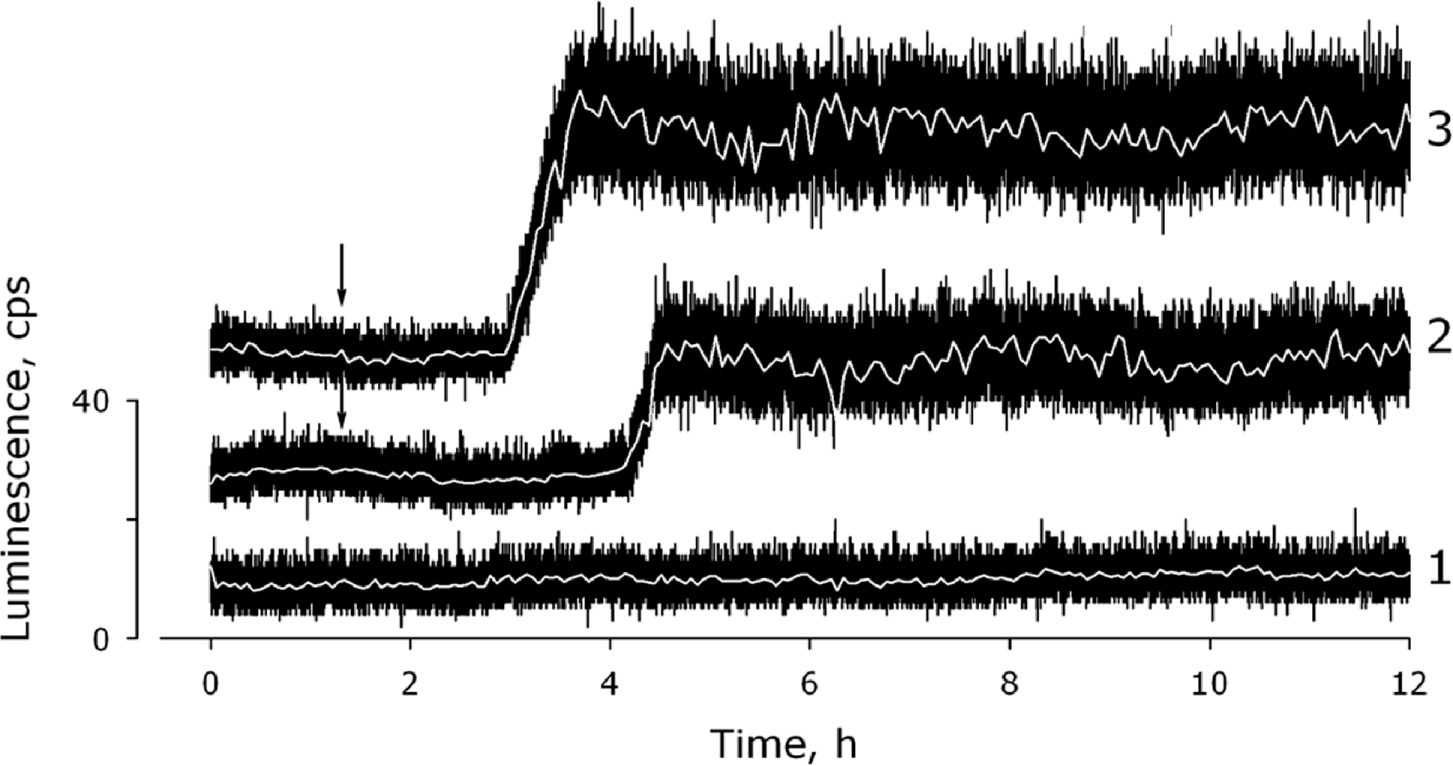
2.1. Measurement of the Chemiluminescence Intensity and the Hydrogen Peroxide Concentration

Figure 1 shows the results of measuring the chemiluminescence intensity from water irradiated by laser at the wavelength λ = 1264 nm with a radiating power of 5 mW during 5 min; the end of the irradiation process is indicated by the vertical arrow. We can see here a long latent period between the end of irradiation and the start of chemiluminescence; this time is about 1.5~2.5 h. During the latent period the chemiluminescence intensity remains at a background level, and its intensity is virtually unchanged. After completing this period the chemiluminescence intensity starts to grow for about 1 h and then reaches a steady level, which is characterized by a set of regular self-oscillating modes, see below. Thus, after irradiation at this wavelength we can distinguish three phases of the chemiluminescence from water: the latent period, when the average intensity of the emission corresponds to the background level, the growth and reaching the steady-state (stationary) level of the chemiluminescence intensity; the latter regime is characterized by the self-oscillatory modes. If the liquid sample has not been exposed to the laser radiation, the chemiluminescence intensity is not significantly changed within at least 12 h; this intensity is kept on the level of 12 ± 6 counts per second (cps), see Figure 2 (Plot 1).
If the aqueous samples contacting the Nafion interface were irradiated (Plot 2 in Figure 2), we can see a long latent period (2.5~3.0 h), followed by the chemiluminescence intensity growth up to an average level of 31 ± 3 cps. Upon irradiating the aqueous samples not in contacted with the Nafion interface, see Figure 2 (Plot 3); for that purpose polyethylene film was placed between the Nafion interface and water), the latent period is 1.5~2.0 h. After completing this period the emission intensity increases to the level of 54 ± 5 cps. White lines in the graphs shows the time-smoothed signals (obtained using the SigmaPlot software package).
To find the spectral range of the chemiluminescence emission, sets of optical filters with transmissivity in different spectral ranges were mounted between the cell and the photodetector. It was established that the chemiluminescence emission is related to a range of 380~520 nm, which can be interpreted by means of chemical reactions (9)–(11). At the moment we carry out experiments for a more detailed characterization of the spectral range of the observed chemiluminescence.
As follows from the graphs in Figure 2, if the samples contact the Nafion interface, the stationary level of the chemiluminescence intensity is approximately two times lower than that for the samples not in contact with the Nafion. Within the framework of our model, this can only be attributed to a decrease in the dissolved oxygen content in the samples contacting Nafion.
For a quantitative estimation of the role of dissolved oxygen in the chemiluminescence excitation, aqueous samples with different contents of the dissolved oxygen were examined. These samples were prepared by mixing proportional volumes of ordinary bidistilled water and the same water, but processed beforehand by the helium washing routine (see [26]). As was shown in this work, in such water all dissolved molecular gases are completely replaced by helium, i.e., the dissolved oxygen content in this water is zero. Figure 3 shows the dependence of the average level of the chemiluminescence intensity (it was measured 5~6 h after irradiating the samples) on the dissolved O2 content in the samples. As is seen in this graph, the chemiluminescence intensity increases with growing O2 content. Therefore, reducing the level of emission for the samples, contacting the Nafion interface, can be explained by a decrease in the dissolved oxygen content in these samples. This may occur due to the chemical reaction (12); as was shown in our work [15], when Nafion is soaked in water, not only protons pass into the bulk of water from the Nafion interface, but bisulfite anions HSO3 do the same. These anions are oxidized, thus forming HSO4 anions. According to [15], the concentration of bisulfite anions in the EZ is about 10 times higher than the concentration of these anions in the bulk water. This concentration changes jump-like exactly on the EZ boundary (see Figure 5a in [15]; as shown in this paper, the EZ size can be found just as a coordinate of such a jump). It is thus necessary to carry out some additional experiments, where one could measure the dependence of the content of dissolved O2 on the EZ contribution to the system.
For this purpose, we studied the time behavior of the dissolved oxygen concentration in the liquid samples, contacting or not contacting the Nafion interface, with an Oxygraph-2k device (Oroboros Instruments Corp., Innsbruck, Austria) [27,28], capable of measuring the content of dissolved oxygen in real time. We used glass cylindrical cells with radius R = 7 mm and a height h, which were filled with water in such a way that the free volume missed. After filling the cells were hermetically sealed, i.e., access of atmospheric air into the liquid samples was excluded. The experimental results are exhibited in Figure 4. Here the top plot is related to the control measurements, when the liquid sample did not contact Nafion; this graph just gives the equilibrium concentration of dissolved oxygen in water. The bottom plot is related to the situation when a Nafion plate of thickness d = 175 μm was fixed along the inner cylindrical surface of the cell, and thus the water sample was in contact with the Nafion interface. Measurements were carried out for 4 h. The choice for this time was not physically specified; intuition, however, suggests that this time must exceed the duration of the latent period, see Figure 2.
As is seen from the graphs, the concentration of O2 decreases slowly in the presence of Nafion. We assume this is due to the reaction (12), which is manifested in such a way in this experiment. According to our model, an important parameter in this experiment is δ = VEZ/V0, the ratio of the EZ volume VEZ to the total volume V0, occupied by the liquid. In accordance with the data of [5,6], the EZ size l ≈ 220 μm; so we have δ = (π(R2 − (Rl)2)h) / πR2h = 2l/R ≈ 0.06. Assuming as a zero-order approximation, that the dependence 2 is a straight line, we arrive at:
y = a α δ t
here а = 250 μM is the equilibrium content of the dissolved oxygen in water, and the coefficient α has dimension of [M/s] and therefore has nothing to do with the geometry of the cell. In accordance with the graphs, if the water sample contacted the Nafion interface, the dissolved oxygen content after 4 h was reduced from 250 to about 248 μM, i.e., reduction was ~1 %. Then for the coefficient α we have the estimate α ≈ 10 μM/h = 3·10−9 M/s. Let us now estimate the parameter δ for the cell, where the chemiluminescence regimes, occurring after exposing the water sample to the radiation at a wavelength λ = 1264 nm, were investigated (see Figure 9 in Section 3.1 below). In this case δ = 2Sl/(SΔ0) where S is the square of the Nafion plate, Δ0 = 0.6 mm is the transverse dimension of this cell. In this case the estimate gives δ ≈ 0.6. Substituting this value into Equation (13), we find that for 4 h (i.e., during the time, surpassing the latent period, see Figure 2) the content of dissolved oxygen in that cell should be reduced from 250 to about 220 μM. In accordance with the data shown in the graph of Figure 3, the average chemiluminescence intensity should hereby be reduced to approximately two-fold, as was actually observed in our experiment (see Plots 2 and 3 in Figure 2). Thus, reducing the average level of the chemiluminescence intensity in our experiments can be interpreted as the decrease in the concentration of dissolved oxygen due to the fact that the medium inside the EZ has an enhanced chemical activity.
Finally, within the framework of the same model we can qualitatively explain the increase in the duration of the latent period for the chemiluminescence onset (see Figure 2) for the samples contacting the Nafion interface. Assuming that chemiluminescence is caused by radiative recombination of ROS (see Equations (9)(11)), it is necessary to investigate the time dynamics of these reactions for the water samples, contacting (or non-contacting) the Nafion interface. We have investigated the dynamics of the generation of hydrogen peroxide, see Equation (10). Indeed, an important characteristic of ROS in the irradiated samples is the concentration of H2O2. In these experiments, a Nafion plate with a total area S and the thickness d = 175 μm was placed in a polypropylene vials (Beckman Coulter, Inc., Brea, CA, USA), containing V0 = 5 mL of water, and was irradiated at the wavelength λ = 1264 nm within 5 min. Just after irradiating the sample, we measured the H2O2 concentration as the function of time. Experiments were carried out for δ1 = 0.12 and δ2 = 0 (in the latter case the Nafion was absent in the cell). The corresponding graphs are shown in Figure 5; the origin of time corresponds to the end of the irradiation. As can be seen from the graphs, the formation of hydrogen peroxide is slower in case of the presence of Nafion. Since the experimental dependencies should be solutions to the chemical kinetics equations, we can represent these dependencies as:
y i = a + c i ( 1 exp ( b i t ) )
where i = 1 and 2, a ≈ 5 nM, bi and ci are dimensional coefficients. Let us assume that the coefficient ci means a total (with the account for the initial concentration, i.e., at t = 0) equilibrium concentration of H2O2, which is produced by the reaction (10). Since in the presence of Nafion the molecular oxygen is effectively “burnt out” (see above), the inequality c2 < c1 should be met; indeed, graphical analysis gives c1 = 12 nM, and c2 = 7 nM. Further, the coefficient bi is proportional to the rate constant of the reaction (10), but the kinetics of this reaction should be also controlled by the reaction (12). The graphical analysis shows that in the absence of Nafion in the liquid sample b1 ≈ 0.7 h−1 ≈ 2·10−4 s−1, while in the presence of Nafion in the sample b2 ≈ 0.5 h−1 ≈ 1.4·10−4 s−1. Unfortunately, we do not know the explicit dependence b ( δ ), so further evaluations look meaningless because of their obvious speculative character. However, on a qualitative level, it is clear that it should be a decreasing function. Therefore, in our opinion, the increase in the latent period for the samples contacting the Nafion interface, can also be qualitatively interpreted in the framework of the hypothesis of “burning out” the dissolved molecular oxygen in the EZ in accordance with reaction (12). Further analysis is devoted to the correlation and spectral (wavelet transform) analysis of the self-oscillating regimes, manifested in the dynamics of the chemiluminescence intensity. In the case of samples, irradiated at the wavelength λ = 1264 nm, we analyzed the data corresponding to the chemiluminescence intensity on the stationary level, and for the non-irradiated samples we researched the background chemiluminescence. A massive of experimental data was presented in the form of discrete time series, for which the treatment was carried out by the algorithms described in Sections 3.5–3.7.

2.2. Time Series Analysis Using Detrended Fluctuation Analysis (DFA)

All the data on the chemiluminescence intensity were presented as a series { X i } and processed according to the algorithm described in Section 3.5; results are shown in Figure 6. For each graph shown in this figure, at least five experimental series were analyzed, and series themselves contain at least l =15,000 points. In experiments with radiation at the wavelength λ = 1264 nm we examined the stationary chemiluminescence data (this regime starts at the time t = 4~5 h, see Figure 2). Furthermore, we studied the data, which were stochastically mixed over all experiments. In the case where the liquid sample has been irradiated and contacted with Nafion (Figure 2 (Plot 3)), the Hurst exponent H = 0.80 ± 0.07, which indicates a regular (not a random) nature of the process, see [29]. In the case where the sample was irradiated and was in contact with Nafion (Figure 2 (Plot 2)), H = 0.71 ± 0.06, which also indicates a determinate variation of the emission intensity. For the control experiments (Figure 2 (Plot 1)) we obtained H = 0.51 ± 0.01. This situation is typical of a random process; we specially verified that for randomly mixed time series the Hurst exponent H = 0.50 ± 0.01. The error in the mean index H for mixed series (~2 %) characterizes the accuracy of the DFA method. Thus, the time variation of the chemiluminescence intensity from water in the presence or absence of Nafion is a determinate rather than a random process. For the spectral analysis of the determinate process, we used the method of complex wavelet transform, which is the most adequate method for problems of this kind (see, for example, [30]).

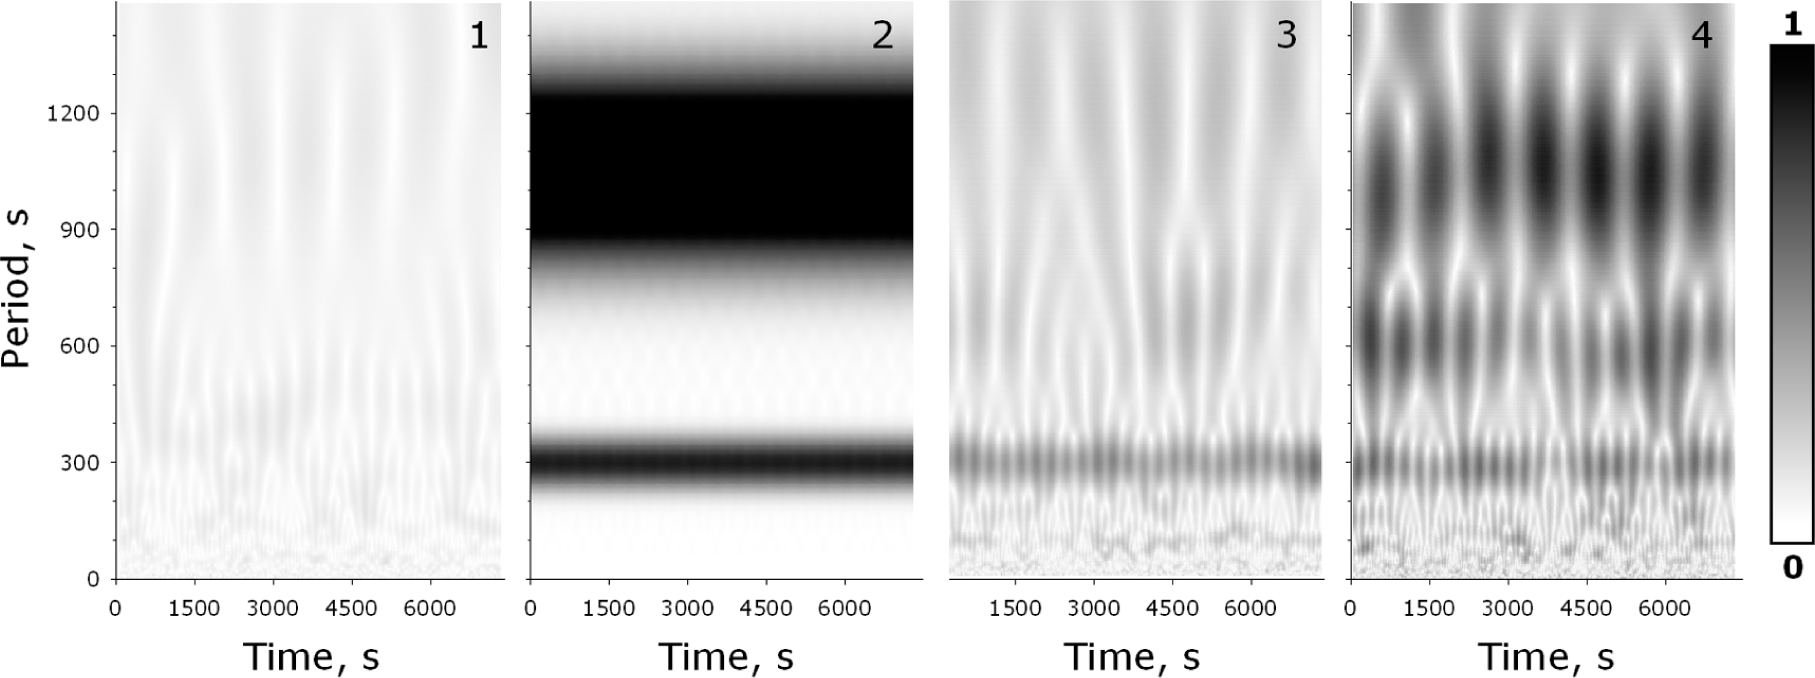
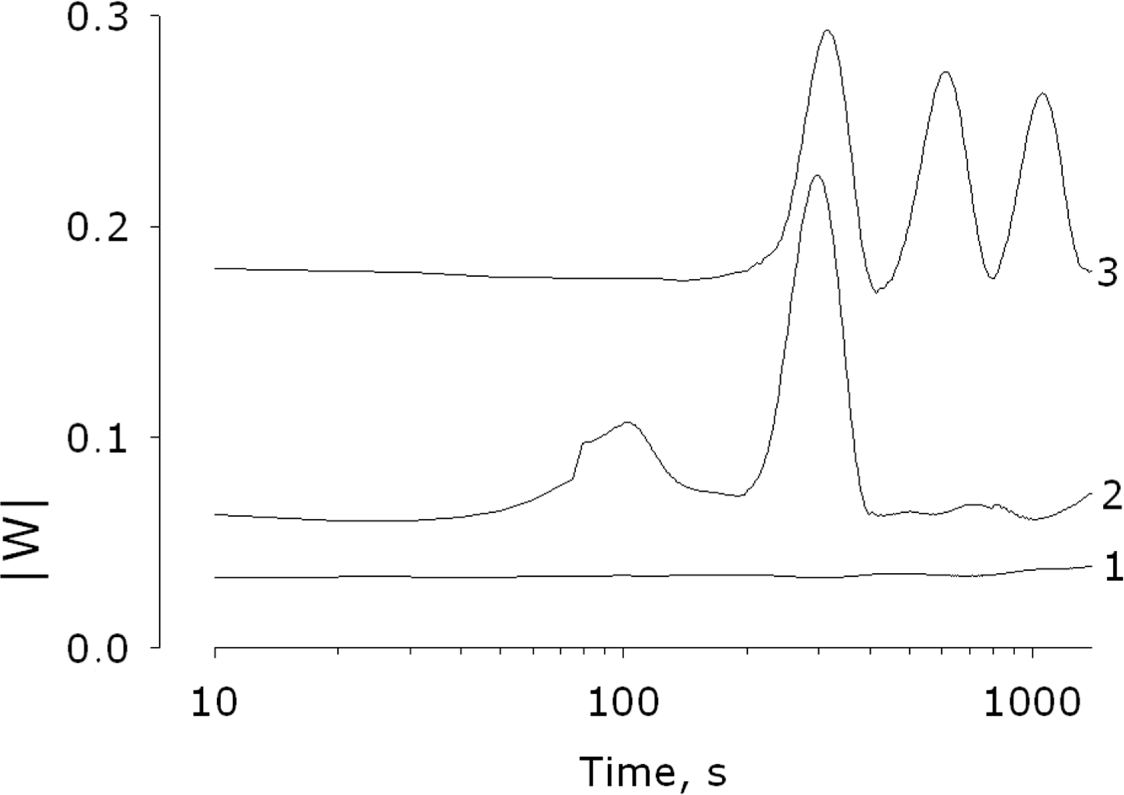
2.3. Time Series Analysis by Using the Wavelet Transform

As earlier, we analyzed here the dataset of the chemiluminescence intensities by using the algorithm described in Section 3.6. The results are shown in Figure 7 (Patterns 1–4). The gray color scale, presented to the left from the patterns, shows the value of the modulus of the complex wavelet coefficient. To identify the characteristic time domains in the experimental data series we used a model signal containing two distinguished frequencies y = sin(2πt/l1) + sin(2πt/l2), where l1 = 300, l2 = 1050 s, see Figure 7 (Pattern 2). As it should be, there are two stable horizontal stripes on the wavelet pattern in this case. The wavelet pattern for the control measurements, depicted in Figure 2 (Pattern 1)), is shown in Figure 7 (Pattern 1); it is clear that in this case it is impossible to identify any characteristic time domain, which indicates the random nature of the chemiluminescence intensity dynamics in this case (see also the previous Section). It is important that the data, obtained in the control experiments, were mixed with the model signal data; in this case it also was not possible to extract the characteristic time domains. At the same time, in all experiments, where the samples were irradiated at wavelength λ = 1264 nm, we found the characteristic time domains. Namely, for the irradiated samples in contact with Nafion we observed the self-oscillating mode with the mean period ⟨T⟩ = 300 s, and less pronounced mode with the mean period ⟨T⟩ = 100 s, see Figure 7 (Pattern 3). For the irradiated samples without Nafion we observed the self-oscillating modes with mean periods ⟨T⟩ = 300, 600, and 1050 s, see Figure 7 (Pattern 4). Figure 8 exhibits the wavelet coefficient distribution over the entire set of experimental data.

2.4. Analysis of the Coherence of the Self-Oscillating Modes

An important question about synchronization of the self-oscillations with periods 300 s, 600 s and 1050 s arises here. If such a synchronization does exist, it may indicate the presence of single source for these oscillations. In accordance with the algorithm described in Section 3.7, coherence coefficients are ρ(300, 600) = 0.80 ± 0.03, ρ(300, 1050) = 0.81 ± 0.06, ρ(600, 1050) = 0.79 ± 0.11. Such high values of the coherence coefficients means almost constant phase shifts between the signals, having those frequencies, i.e., these signals are coherent and hence are indeed caused by the presence of single regular source.
Thus, chemiluminescence signal from the irradiated water samples contain three characteristic time periods, while the samples in contact with the Nafion are characterized by a single self-oscillating mode. Indeed, in the latter case we can obviously neglect by the oscillations with a mean period T = 100 s, i.e., chemiluminescence from the excluded zone is a quasi-monochromatic process. It is clear that this effect cannot be attributed to the chemical reaction represented by Equation (12); as we know, there is no physical mechanism for the frequency filtering due to chemical reactions. However, as shown in [13] (see also our recent work [16]), the water in the EZ has a quasicrystalline structure. Therefore, the dynamics of the processes responsible for the chemiluminescence (the radiative ROS recombination, see Formulas (9)–(11)), has its own specificity in the EZ as compared with the bulk water.
Let us consider the spin dynamics of the water molecules, which have the property of the nuclear spin isomers. Namely, there exist two possible states of water molecules with parallel or antiparallel orientation of the spins of the protons [31]: one with its two spins of protons aligned parallel (ortho-hydrogen), and the other one with its two proton spins aligned antiparallel (para-hydrogen). Since there is only one possibility, each para-hydrogen level has a spin degeneracy of one and is said to be non-degenerate. The equilibrium ratio between the ortho and para forms is about 3:1 under normal conditions; this ratio just reflects the spin degeneracies. At the same time, the concentration of the ortho and para spin isomers fluctuates, so their concentration ratio should oscillate around the equilibrium value 3:1. As was already noted in the Introduction, it was shown in [24] that the characteristic period of such oscillations is approximately equal to 300 s. One can imagine that the magnetic disturbances in the immediate vicinity of the dissolved O2 molecules, caused by the oscillating transitions from the ortho to the para state, can affect the dynamics of transitions from the triplet (magnetic) spin state to the singlet (nonmagnetic) state for these molecules. Intuition suggests that in case of a quasi-crystalline matrix such dynamic changes should be of a co-operative character, i.e., the spectral band, associated with these processes in crystal should be narrower as compared to that in the disordered medium. An obvious analogy with the Mössbauer effect [32], known in nuclear physics, occurs here. Unfortunately, at the moment we do not have a more comprehensive interpretation for the process of narrowing the spectral bands for the low-frequency self-oscillations, associated with the chemiluminescence from the EZ.

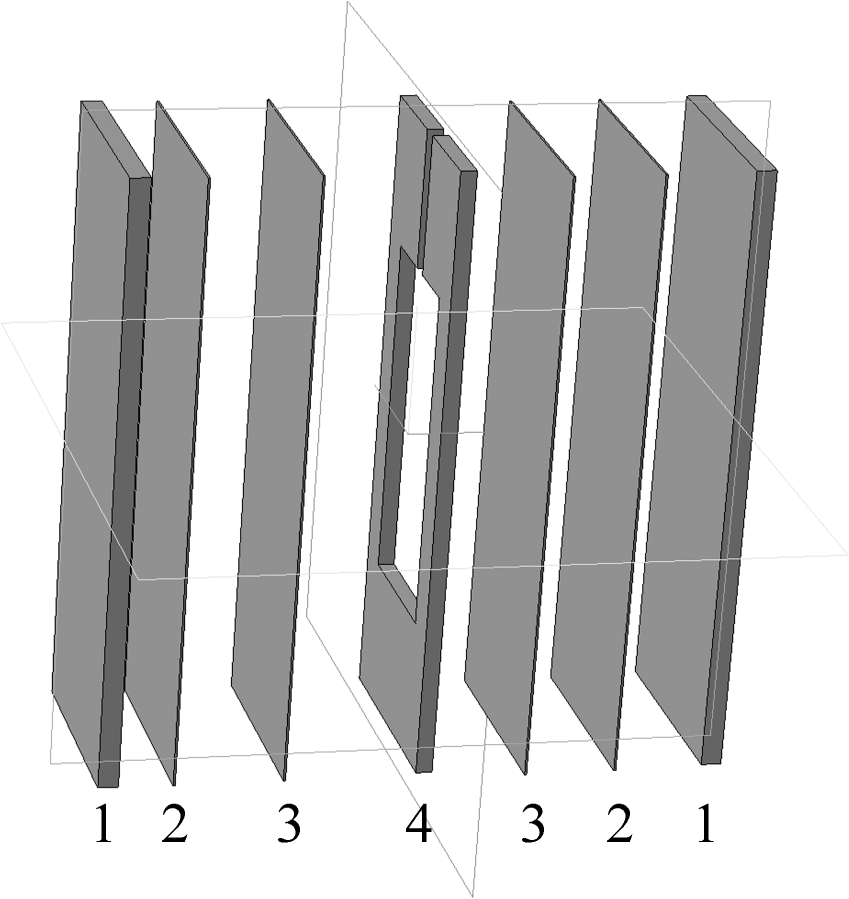
3. Experimental Section

3.1. Sample Preparation

In the experiments we used samples of Nafion® (DuPont™) of thickness d = 175 μm; prior to the measurements, all samples of Nafion were soaked in water within 5 h. We used deionized water with a resistivity of 7 MΩ·cm and pH = 5.5~5.8. For measuring the intensity of chemiluminescence from a thin layer water close to the Nafion interface, an experimental cell with a special (sandwich-like) design was made (Figure 9). The cell consisted of two windows made of potassium-free glass (18 × 45 × 1 mm3) (Figure 9 (Unit 1)), two plates of Nafion (18 × 45 × 0.175 mm3) (Figure 9 (Unit 2)) and the cavity filled with water (12 × 30 × 0.6 mm3; the cavity was filled with water through the slit 12 × 2 × 0.6 mm3 on the top of this element (4)) (Figure 9 (Unit 4)). In some experiments, to prevent contact between the liquid sample and the Nafion interface an inert polyethylene film with thickness of about 50 μm was placed between the two (Figure 8 (Unit 2)). All of the cell elements were fastened with micro-clamps; we of course did not use any glue while designing the cell. Assuming, based upon the data of [5,6], that the characteristic EZ size l = 200 μm, we have for the thickness of the liquid layer in the cell Δ = 200 μm, i.e., the volume of water inside the EZ exceeds only twice the volume of water outside the EZ, i.e., the EZ makes an essential contribution to the experimental data.

3.2. Irradiation

A liquid sample was irradiated through the open water surface during 5 min by a 5 mW diode laser (λ = 1264 nm). The light beam was directed by means of a multimode quartz light guide; the experiments were carried out in complete darkness at room temperature. The distance between the light guide edge and the liquid sample was about 10 mm, and the average intensity of the light on the water surface was 1 mW/cm2. A laser beam cross section was visualized using an IRDC-AS-22 card; the laser spot size was about 50 μm.

3.3. Measurement of Luminescence

A vial with an irradiated sample was placed in a high-sensitivity chemiluminometer (Biotoks-7AM, Elektrozavod, Moscow, Russia) operating in the photon counting regime within a spectral band of 380~710 nm [33]. The time of the signal accumulation and the periodicity of recording the data was 1 s. The efficiency of counting photons was about 10 %, as determined by the calibration experiments with Cherenkov radiation from the isotope 32P [34]. The luminescence spectral range was estimated by using blue or red optical filters with the 99 % transmission of the light flow at 380~520 and 590~800 nm, respectively [28].

3.4. Measurement of Hydrogen Peroxide

The concentration of hydrogen peroxide was determined by the method of enhanced chemiluminescence in a “luminol/4-iodophenol/peroxidase” system [35,36]. Chemiluminescence intensity was measured by using a Beta-1 liquid scintillation counter (Medapparatura, Moscow Region, Russia) in the photon-counting operation mode [37]; calibration was carried out with hydrogen peroxide samples of known concentration [38].

3.5. Method of Detrended Fluctuation Analysis

A search for latent correlations in the time series of data, related to the chemiluminescence intensity, was performed by the method of detrended fluctuation analysis (DFA) [39] with a modification [40]. In this method, the fluctuation function Fd(l) is plotted in accordance with equation:
F d ( l ) ~ l H
where l is the time window (length of splitting, see below), H is the so-termed Hurst exponent [29], which is determined from the slope of function Fd(l) plotted in doubly logarithmic coordinates. The function Fd(l) is formed as follows. First we choose the experimentally obtained time series of the chemiluminescence intensity values { X i } , where i = 1/l, and l is the length of the series. Then we find the mean value of the series:
m = 1 l i = 1 l X i ,
and create a mean-adjusted series Y i = X i m . Next we calculate the cumulative deviate series:
Z j = i = 1 j Y i ,
where j = 1/l, and compute the range R(l) of l values in the series:
R ( l ) = max ( Z 1 , Z 2 , ... , Z l ) min ( Z 1 , Z 2 , ... , Z l ) .
After finding the standard deviation:
S ( l ) = 1 l i = 1 l ( X i m ) 2 , s
we calculate the rescaled (dimensionless) range R(l)/S(l) and average this over all the partial time series of length l. The expected value (ensemble average) E[R(l)/S(l)] gives the fluctuation function Fd(l). The reliability of the conclusions obtained by DFA was controlled by randomly mixing the initial series of data. The procedure of mixing consists in the following steps:
  • Two integer random numbers (a and b) in the range 1/l were generated.
  • The values of the series Xa and Xb were interchanged.
  • Steps 2 and 3 were repeated 1000 × l times, which provided a complete mixing of the initial series.

3.6. Wavelet Transform

The wavelet transform of the time series {Xi}of the luminescence intensity values makes it possible to reveal the amplitude-frequency and phase-frequency characteristics of signals locally with time [40]. The result of the wavelet transform represents the expansion of the time series {Xi} over the basis of soliton-like functions (the so-called Morlet basis):
ψ ( r ) = e i k 0 r e r 2 2 ,
where k0 is the coefficient of angular selectivity of the wavelet, see [41,42]. We took k0 = 2π; thus, with r = 1, the harmonic component of the wavelet has a unit wavelength. For further analysis it is convenient to rescale the function Morley, presenting it in the form:
ψ i ( a ) = | a | 1 / 2 ψ ( i a )
where a is the scale coefficient equal to the wavelength of the harmonic component of the wavelet, and i is the number of the element of { X i } . With allowance for the discrete character of the time series and limitation of the integration range, the equitation for the calculation of wavelet coefficients takes the form:
W ( a , b ) = i = l / 2 l / 2 X i + b ψ i ( a )
where b is the parameter of temporal shift, Xi is the ith element of the initial monomeric signal, l is the length of the filter, which was determined from the relation l = 5a. Transforming a monomeric signal by the complex basis function yields dimeric arrays of values of the module and phase of coefficients of the form:
W ( a , b ) = | W ( a , b ) | e i φ ( a , b ) ,
where the arguments a and b have the dimension of time. Further the module |W (а,b)| of the wavelet transform coefficients was analyzed.
It is noteworthy that the algorithm for computing the wavelet coefficients was developed in such a way that for extremely short wavelengths it degenerates to a discrete wavelet pattern (the so-termed Haar wavelet, see [43]), which is a superposition of two meander-like pulses. Therefore, the minimum wave period, which can still be resolved, exceeds twice the sampling period. However, the accuracy of calculating the coefficients in this case dramatically drops. At the same time, at resolving the wave period, which 10 times exceeds the sampling period, the accuracy is quite acceptable. In our case it means that we can reliably determine the characteristic wave periods of about 10 s or more.

3.7. The Method of Cross-Correlation

In this method, the coherence factor is calculated according to the formula:
ρ ( T 1 , T 2 ) = | exp j ( φ 1 φ 2 + ( 2 π T 2 2 π T 1 ) t ) |
where T1 and T2 are some fixed time periods that are revealed in the wavelet analysis, φ1 and φ2 are the phases of the complex wavelet transform coefficients, calculated for the periods T1 and T2, respectively.

4. Conclusions

In this paper, we performed for the first time experiments on the excitation of chemiluminescence in the visible and near UV range from the EZ close to the surface of Nafion in water; chemiluminescence has been excited by laser light at the wavelength λ = 1264 nm and is related to the radiative recombination of ROS. The data obtained for the EZ were compared with similar data obtained for bulk water. It is shown that the latent period of chemiluminescence for the EZ exceeds by approximately two-fold this value for the bulk water, and the average intensity of the emission at the stationary level in the case of EZ is also about two times lower than the same value for the bulk water. Both of these effects can be attributed to the high chemical activity of the medium inside the EZ: molecular oxygen is effectively “burnt out” in the EZ in accordance with the reaction 2HSO3 + O2 → 2HSO4, which leads to an effective decrease in the ROS content. Finally, the DFA and wavelet analysis data show that the chemiluminescence from bulk water and from the EZ is a regular (determinate) self-oscillating process and the spectrum of this process in the case of the EZ is much narrower than the same spectrum for bulk water.

Acknowledgments

The authors are indebted to G.H. Pollack for his permanent interest to our work and very fruitful discussions about the results. This study was supported in part by the Russian Foundation for Basic Researches, Grants Numbers 13-02-00731 A, 13-04-00730 A, 14-02-31208 mol_A, and Presidium of Russian academy of sciences Program 28, “The origin of life and the formation of the biosphere” (subprogram I, the subject “Physics, Chemistry and Biology of Water”).
PACS Codes: 05; 47; 68; 82

Author Contributions

Sergey V. Gudkov carried out the chemiluminescence experiments and participated in writing the manuscript. Maxim E. Astashev performed mathematical analysis of the experimental data. Vadim I. Bruskov performed the polarographic experiments. Valeriy A. Kozlov manufactured the samples of the helium-washed water and took part in the experiments with chemiluminescence. Stanislav D. Zakharov participated in discussion of the results. Nikolai F. Bunkin carried out general management and wrote the manuscript. All authors have read and approved the final published manuscript.

Conflicts of Interest

The authors declare no conflict of interest.

References

  1. Heitner-Wirguin, C. Recent advances in perfluorinated ionomer membranes: Structure, properties and applications. J. Membr. Sci. 1996, 120, 1–33. [Google Scholar]
  2. Mauritz, K.A.; Moore, R.B. State of understanding of Nafion. Chem. Rev. 2004, 104, 4535–4586. [Google Scholar]
  3. Ivanov, V.G.; Berestovskii, T.N. Lipidnyi Bisloi biologicheskih Membrane; Nauka: Moscow, USSR, 1982; In Russian. [Google Scholar]
  4. Ninham, B.W.; Lo Nostro, P. Intermolecular Forces and Self Assembly in Colloid, Nano Sciences and Biology; Cambridge University Press: New York, NY, USA, 2010. [Google Scholar]
  5. Chai, B.; Yoo, H.; Pollack, G.H. Effect of radiant energy on near-surface water. J. Phys. Chem. B. 2009, 113, 13953–13958. [Google Scholar]
  6. Chai, B.; Pollack, G.H. Solute-free interfacial zones in polar liquids. J. Phys. Chem. B. 2010, 114, 5371–5375. [Google Scholar]
  7. Bhalerao, A.S.; Pollack, G.H. Light-induced effects on Brownian displacements. J. Biophotonics. 2011, 4, 172–177. [Google Scholar]
  8. Yoo, H.; Paranji, R.; Pollack, G.H. Impact of hydrophilic surfaces on interfacial water dynamics probed with NMR spectroscopy. J. Phys. Chem. Lett. 2011, 2, 532–536. [Google Scholar]
  9. Yoo, H.; Baker, D.R.; Pirie, C.M.; Hovakeemian, B.; Pollack, G.H. Water: The Forgotten Biological Molecule; Pan Stanford Publishing: Denver, CO, USA, 2011. [Google Scholar]
  10. Zheng, J.; Pollack, G.H. Long-range forces extending from polymer-gel surfaces. Phys. Rev. E. 2003, 68, 031408. [Google Scholar]
  11. Chai, B.; Zheng, J.; Zhao, Q.; Pollack, G.H. Spectroscopic studies of solutes in aqueous solution. J. Phys. Chem. A. 2008, 112, 2242–2247. [Google Scholar]
  12. Zheng, J.; Chin, W.C.; Khijniak, E.; Khijniak, E., Jr.; Pollack, G.H. Surfaces and interfacial water: Evidence that hydrophilic surfaces have long-range impact. Adv. Colloid Interface 2006, 127, 19–27. [Google Scholar]
  13. Pollack, G.H. The Fourth Phase of Water: Beyond Solid, Liquid, and Vapor; Ebner and Sons Publishers: Seattle, WA, USA, 2013. [Google Scholar]
  14. Bunkin, N.F.; Kozlov, V.A.; Ignat’ev, P.S.; Suiazov, N.V.; Shkirin, A.V.; Atakhodzhaev, I.A. Refraction Coefficient of Water and Aqueous Solutions in the Optical Frequency Range in the Vicinity of Nafion. Biophysics 2012, 57, 733–749. [Google Scholar]
  15. Bunkin, N.F.; Ignatiev, P.S.; Kozlov, V.A.; Shkirin, A.V.; Zakharov, S.D.; Zinchenko, A.A. Study of the phase states of water close to Nafion interface. Water 2013, 4, 129–154. [Google Scholar]
  16. Bunkin, N.F.; Gorelik, V.S.; Kozlov, V.A.; Shkirin, A.V.; Suyazov, N.V. Colloidal crystal formation at the “Nafion-Water” interface. J. Phys. Chem. B. 2014, 118, 3372–3377. [Google Scholar]
  17. Gudkov, S.V.; Bruskov, V.I.; Astashev, M.E.; Chernikov, A.V.; Yaguzhinsky, L.S.; Zakharov, S.D. Oxygen-dependent auto-oscillations of water luminescence triggered by the 1264 nm radiation. J. Phys. Chem. B. 2011, 115, 7693–7698. [Google Scholar]
  18. Atkinson, R.; Baulch, D.L.; Cox, R.A.; Hampson, R.F., Jr.; Kerr, J.A.; Rossi, M.J.; Troe, J. Evaluated kinetic and photochemical data for atmospheric chemistry: Supplement VI. IUPAC subcommittee on gas kinetic data evaluation for atmospheric chemistry. J. Phys. Chem. Ref. Data. 1997, 26, 1329–1499. [Google Scholar]
  19. Schweitzer, C.; Schmidt, R. Physical mechanisms of generation and deactivation of singlet oxygen. Chem. Rev. 2003, 103, 1685–1758. [Google Scholar]
  20. Zakharov, S.D.; Ivanov, A.V. Light-oxygen effect in cells and its potential applications in tumour therapy (review). Quantum Electron 1999, 29, 1031–1053. [Google Scholar]
  21. Kuznetsova, L.A.; Kuz’menko, N.E.; Kozakov, W.E.; Plastinin, Y.A. The Probability of Optical Transitions of Diatomic Molecules; Nauka: Moscow, USSR, 1980; In Russian. [Google Scholar]
  22. Margulis, M.A. Sonochemistry and Cavitation; Gordon and Breach Science Publishers: Langhorne, PA, USA, 1995. [Google Scholar]
  23. Saksena, T.K.; Nyborg, W.L. Sonoluminescence from Stable Cavitation. J. Chem. Phys. 1970, 53, 1722–1734. [Google Scholar]
  24. Bruskov, V.I.; Gudkov, S.V.; Chalkin, S.F.; Smirnova, E.G.; Yaguzhinskii, L.S. Self-oscillating water luminescence induced by laser irradiation. Dokl. Biochem. Biophys. 2009, 425, 114–116. [Google Scholar]
  25. Morre, D.J.; Orczyk, J.; Hignite, H.; Kim, C. Regular oscillatory behavior of aqueous solutions of Cull salts related to edects on equilibrium dynamics of ortho/para hydrogen spin isomers of water. J. Inorg. Biochem. 2008, 102, 260–267. [Google Scholar]
  26. Bunkin, N.F.; Ninham, B.W.; Babenko, V.A.; Suyazov, N.V.; Sychev, A.A. Role of dissolved gas in optical breakdown of water: Differences between effects due to helium and other gases. J. Phys. Chem. B. 2010, 114, 7743–7752. [Google Scholar]
  27. Belosludtsev, K.N.; Belosludtseva, N.V.; Agafonov, A.V.; Astashev, M.E.; Kazakov, A.S.; Saris, N.E.; Mironova, G.D. Ca(2+)-dependent permeabilization of mitochondria and liposomes by palmitic and oleic acids: A comparative study. Biochim. Biophys. Acta. 2600–2606.
  28. Belosludtsev, K.N.; Belosludtseva, N.V.; Kondratyev, M.S.; Agafonov, A.V.; Purtov, Y.A. Interaction of phospholipase A of the E. coli outer membrane with the inhibitors of eucaryotic phospholipases A2 and their effect on the Ca2+-induced permeabilization of the bacterial membrane. J. Membr. Biol. 2014, 247, 281–288. [Google Scholar]
  29. Feder, J. Fractals; Plenum Press: New York, NY, USA, 1988. [Google Scholar]
  30. Peng, C.-K.; Buldyrev, S.V.; Havlin, S.; Simons, M.; Stanley, H.E.; Golberger, A.L. On the mosaic organization of DNA sequences. Phys. Rev. E. 1994. [Google Scholar]
  31. Rock, P.A. Chemical Thermodynamics; MacMillan: New York, NY, USA, 1969. [Google Scholar]
  32. Mössbauer, R.L. Kernresonanzfluoreszenz von Gammastrahlung in Ir191. Zeitschrift für Physik 1958, 151, 124–143, In German. [Google Scholar]
  33. Gudkov, S.V.; Shtarkman, I.N.; Chernikov, A.V.; Usacheva, A.M.; Bruskov, V.I. Guanosine and inosine (riboxin) eliminate the long-lived protein radicals induced X-ray radiation. Dokl Biochem. Biophys. 2007, 413, 50–53. [Google Scholar]
  34. Bruskov, V.I.; Popova, N.R.; Ivanov, V.E.; Karp, O.E.; Chernikov, A.V.; Gudkov, S.V. Formation of long-lived reactive species of blood serum proteins by the action of heat. Biochem. Biophys. Res. Commun. 2014, 443, 957–961. [Google Scholar]
  35. Garmash, S.A.; Smirnova, V.S.; Karp, O.E.; Usacheva, A.M.; Berezhnov, A.V.; Ivanov, V.E.; Chernikov, A.V.; Bruskov, V.I.; Gudkov, S.V. Pro-oxidative, genotoxic and cytotoxic properties of uranyl ions. J. Environ. Radioact. 2014, 127, 163–170. [Google Scholar]
  36. Shtarkman, I.N.; Gudkov, S.V.; Chernikov, A.V.; Bruskov, V.I. Effect of amino acids on X-ray-induced hydrogen peroxide and hydroxyl radical formation in water and 8-oxoguanine in DNA. Biochemistry-Moscow 2008, 73, 470–478. [Google Scholar]
  37. Chernikov, A.V.; Gudkov, S.V.; Shtarkman, I.N.; Bruskov, V.I. Oxygen effect in heat-mediated damage to DNA. Biofizika 2007, 52, 244–251. [Google Scholar]
  38. Gudkov, S.V.; Garmash, S.A.; Shtarkman, I.N.; Chernikov, A.V.; Karp, O.E.; Bruskov, V.I. Long-lived protein radicals induced by X-ray irradiation are the source of reactive oxygen species in aqueous medium. Dokl Biochem. Biophys. 2010, 430, 1–4. [Google Scholar]
  39. Kantelhardt, J.W.; Zschiegner, S.A.; Koscielny-Brude, E.; Bande, A.; Halvin, S.; Stanley, E. Multifractal detrended fluctuation analysis of nonstationary time series. Physica A 2002, 316, 87–114. [Google Scholar]
  40. Moskalev, A.; Shaposhnikov, M.; Snezhkina, A.; Kogan, V.; Plyusnina, E.; Peregudova, D.; Melnikova, N.; Uroshlev, L.; Mylnikov, S.; Dmitriev, A.; et al. Mining gene expression data for pollutants (dioxin, toluene, formaldehyde) and low dose of gamma-irradiation. PLoS One 2014, 9, e86051. [Google Scholar]
  41. Astaf’eva, N.M. Wavelet analysis: Basic theory and some applications. Phys. Usp. 1996, 39, 1085–1096. [Google Scholar]
  42. Bandrivskyy, A.; Bernjak, A.; Mcclintock, P.; Stefanovska, A. Wavelet phase coherence analysis: Application to skin temperature and blood flow. Cardiovasc. Eng. 2004, 4, 89–93. [Google Scholar]
  43. Haar, A. Zur Theorie der orthogonalen Funktionensysteme. Mathematische Annalen 1910, 69, 331–371. [Google Scholar]
Figure 1. Schematic diagram of chemical structure of commercially available DuPont™ Nafion®.
Entropy 16 06166f1
Figure 2. Effect of laser irradiation on the intensity of chemiluminescence from water. 1—The time dependence of the emission intensity in the samples, not exposed to laser light (control measurements); 2—The time dependence of the intensity of emission from the samples irradiated at the wavelength λ = 1264 nm, and contacting the Nafion interface; 3—Time dependence of the intensity of emission from the samples irradiated at the wavelength λ = 1264 nm, and non-contacting the Nafion interface.
Entropy 16 06166f2
Figure 3. Dependence of the average chemiluminescence intensity upon the dissolved oxygen content. Comments are in the text.
Entropy 16 06166f3
Figure 4. The time dependence of the concentration of O2 in the absence (top plot) and in the presence of Nafion (bottom plot) in the cell with the liquid sample. Comments are in the text.
Entropy 16 06166f4
Figure 5. The time dependence of the H2O2 concentration, stimulated by the radiation at the wavelength λ = 1264 nm for δ1 = 0 (Plot 1; water is not in contact with the Nafion interface), and δ2 = 0.12 (Plot 2; water is in contact with the Nafion interface). Experimental points lie on curves y1 = 5 + 12(1 – exp (−0.7t)) and y2 = 5 + 12(1 – exp (−0.5t)) respectively. Comments are in the text.
Entropy 16 06166f5
Figure 6. Dependence of the fluctuation function Fd on the time window length l in the double-logarithmic scale as was obtained by DFA. 1—experiment with irradiated samples, non-contacting the Nafion interface; 2—experiment with the irradiated samples, contacting the Nafion interface; 3—control measurements. Explanations are in the text.
Entropy 16 06166f6
Figure 7. Patterns of the wavelet coefficients for the chemiluminescence signal from water. The Y-axis gives the wave periods found by the analysis. The X-axis gives the time shift parameter, which determines the location of harmonics along the time axis. 1—Pattern of the wavelet coefficients for the chemiluminescence intensity from the non-irradiated samples (control measurements); 2—Pattern of the wavelet coefficients for the model signal y = sin(2πt/l1) + sin(2πt/l2), where l1 = 250; l2 = 1250 s; 3—Pattern of the wavelet coefficients for the chemiluminescence intensity from the irradiated water, contacted the Nafion interface; 4—Pattern of the wavelet coefficients for the chemiluminescence intensity from the irradiated water, non-contacted the Nafion interface.
Entropy 16 06166f7
Figure 8. Time distribution of the wavelet coefficients. 1—non-irradiated samples (control measurements); 2—irradiated sample in contact with the Nafion; 3—irradiated samples, not being in contact with Nafion.
Entropy 16 06166f8
Figure 9. Schematic diagram of the cell for measuring the chemiluminescence intensity from water samples close to the Nafion interface. 1—potassium-free glass; 2—plate of Nafion; 3—inert film made of polyethylene; 4—cavity for filling with water.
Entropy 16 06166f9

