1. Introduction
The unusual physical properties of metal nanostructures embedded in solid matrices show potential application in optical devices. Fabrication and characterization of metal nanostructures embedded in glass matrices have been performed by many researchers [
1,
2]. Photoluminescence can be enhanced by metal nanostructures dispersed in an active medium through local field enhancement and/or energy transfer. Surface Plasmon Resonance (SPR) arising from metallic nanoparticles results in giant and highly localized electric fields around nanoparticles. This intense localized electric field can enhance the yield of optical transition of nearby rare-earth ions, a phenomenon known as local field enhancement (LFE) [
3]. Metal nanoparticles (NPs) can also enhance the luminescence spectrum by energy transfer to emitting ions. In addition to isotropic spherical NPs, optically coupled NPs and also anisotropic NPs with sharp edges by confinement of the local surface electric field at their sharp edges are fascinating for nanometal enhanced fluorescence (NMEF) studies [
4,
5]. The synthesis of directional nanostructures such as nanorods, nanowires and nanobelts of various materials have attracted material scientists and led to many challenging studies [
6]. However, fabrication of non-spherical metallic nanostructures in glass matrices has had remarkably little success and remains a challenge.
Various fabrication techniques such as chemical processes, ion implantation, irradiation or thermal reduction have been employed to produce nanometals inside solid matrices [
1,
7,
8].
In situ fabrication of metal nanostructures in a glass medium is affected by temperature, and annealing or irradiation time. In this research, thermal treatment of glass specimens has been performed to mutually adjust the glass matrix. Hence the thermally reduced silver ions dissolve in the glassy medium, leading to fabrication of silver nanostructures embedded in Er
3+/Yb
3+ activated GeO
2-PbO glass matrix. In addition, annealing of the glass at a temperature higher than 435 °C, the glass transition temperature [
9], was used to adjust the glass matrix. This technique represents a novel method to produce promising (isotropic and anisotropic) nanostructures embedded in a glass matrix in a more controlled fashion. The UV-Visible absorption, transmission electron microscopy (TEM), X-ray diffraction (XRD) analysis, energy-dispersive X-ray (EDX) spectroscopy, Fourier transform infra-red (FTIR) spectroscopy, and X-ray photoelectron spectroscopy techniques have been employed to study the formation of nanostructures in the glassy network.
2. Results
2.1. UV-Visible Absorption
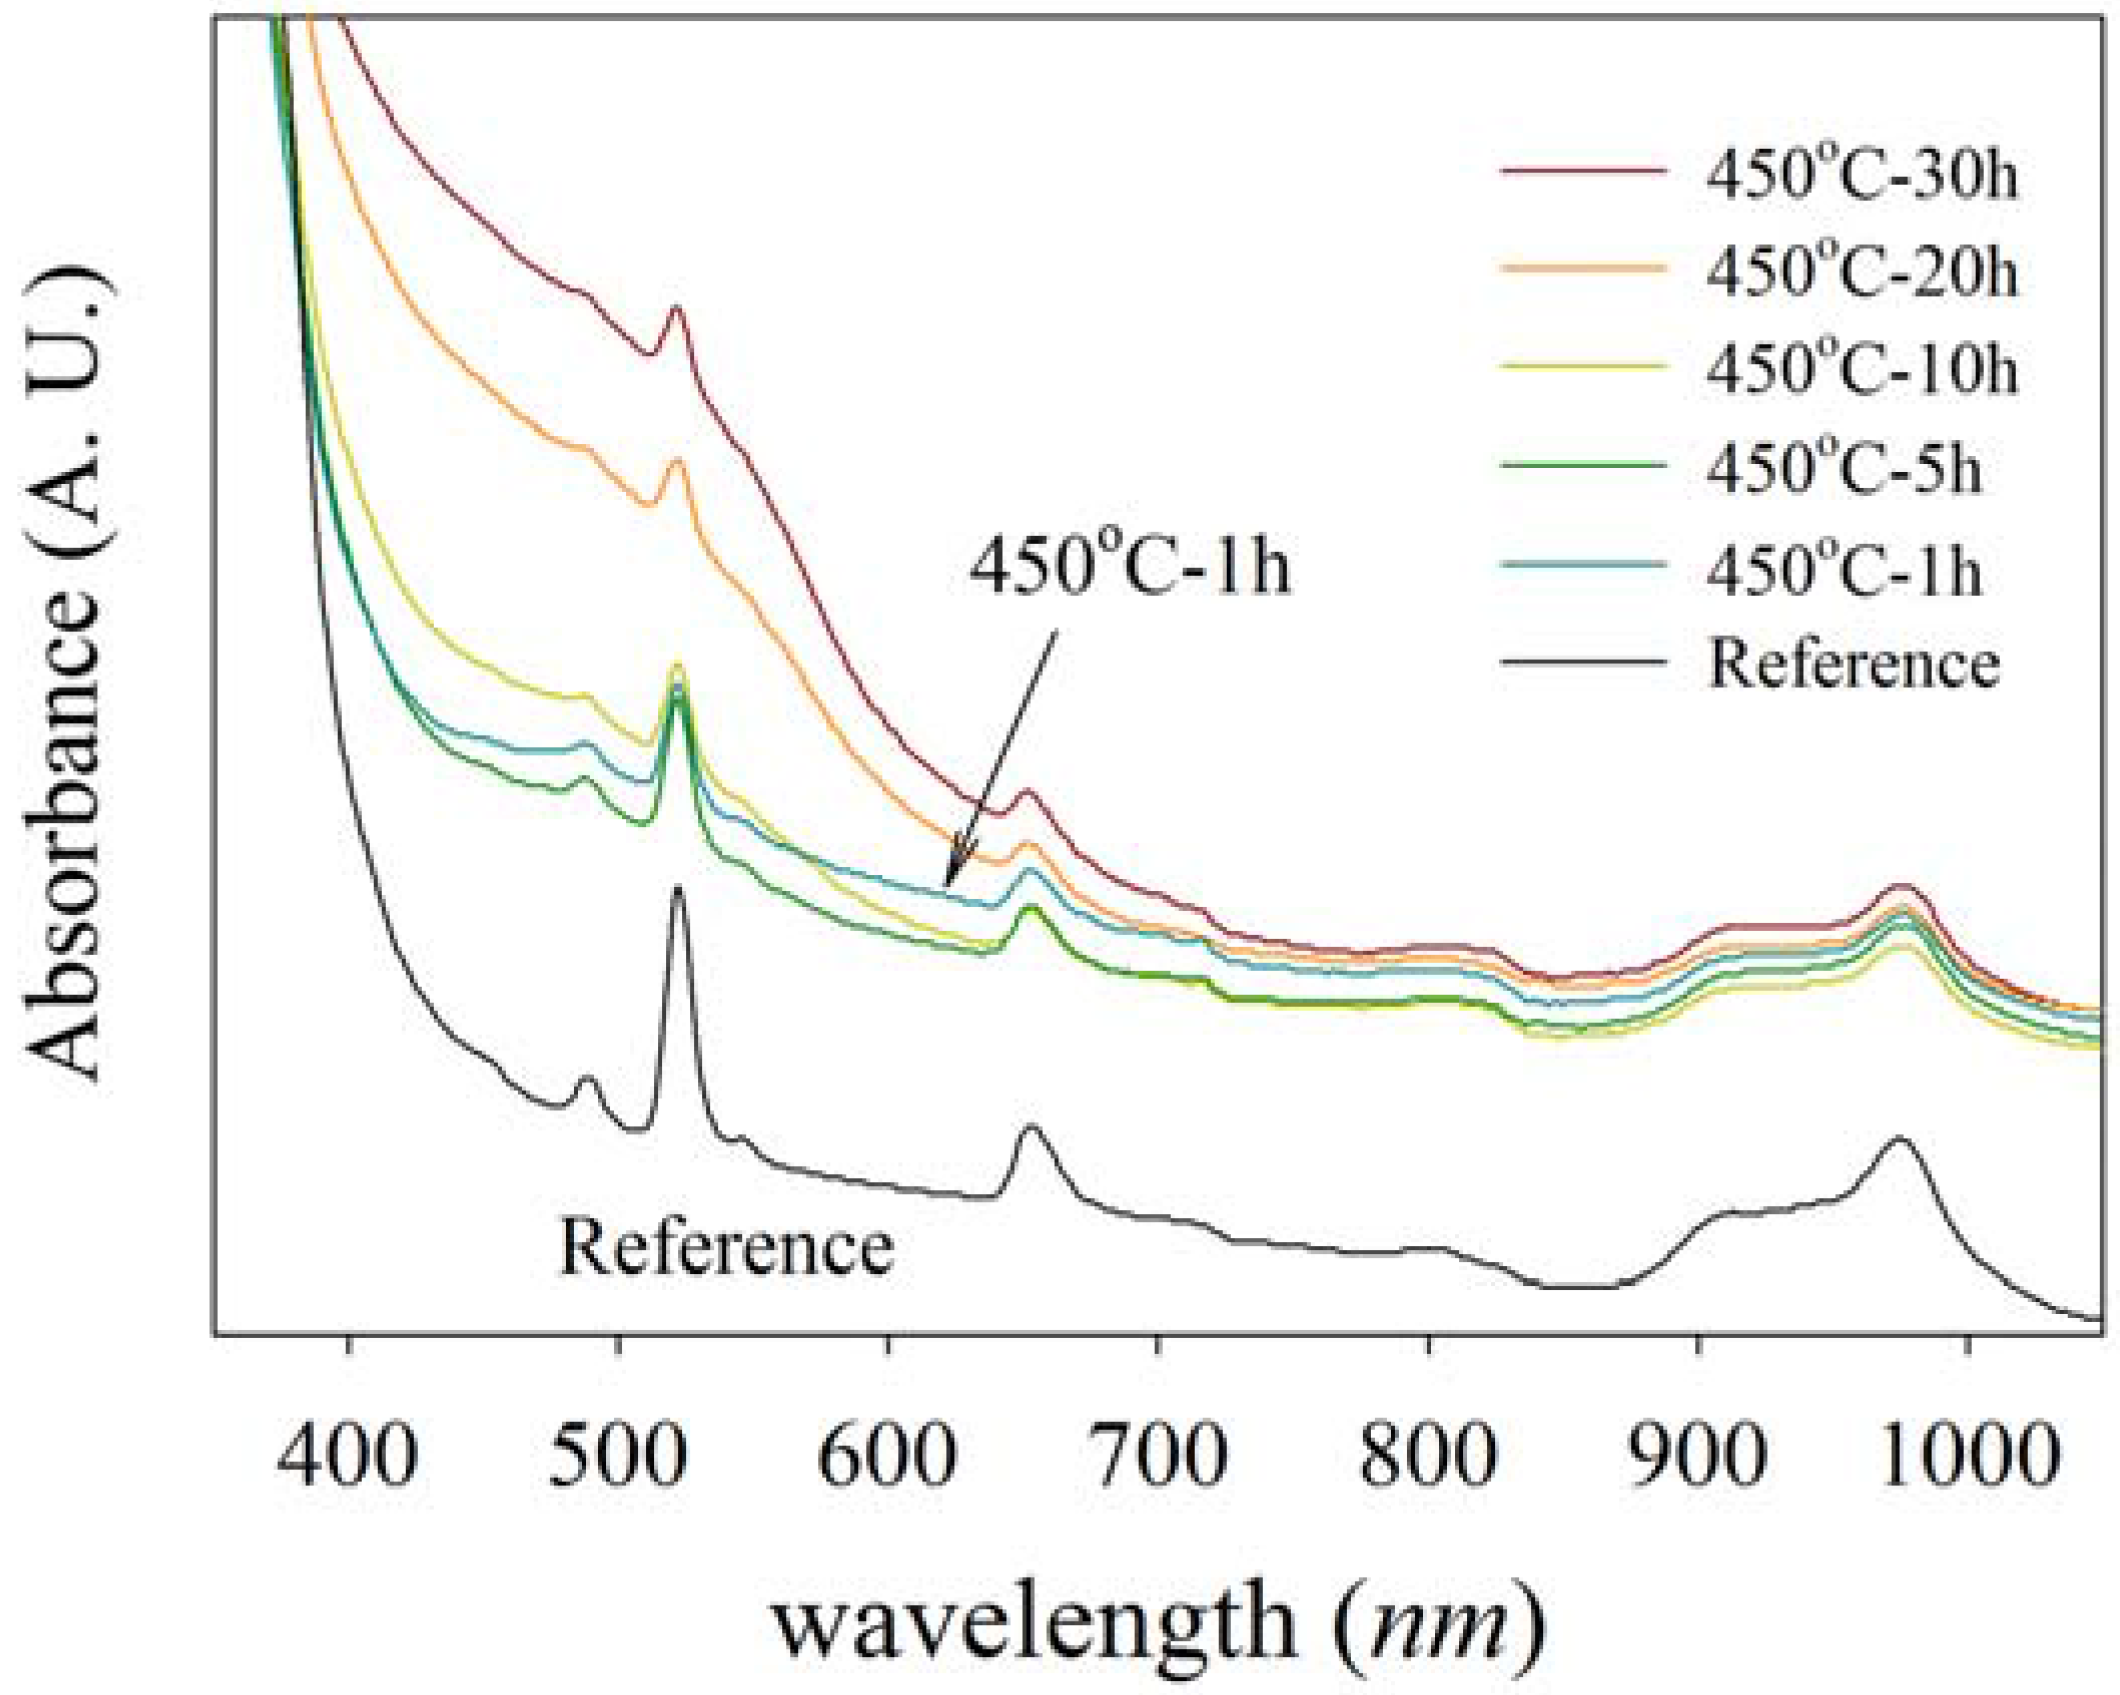
Figure 1 shows the UV-visible absorption of NP-Ag/glass composite samples where a number of sharp absorption peaks are observed in the spectra of all samples. The most intense peaks occur at 490, 523, and 649 nm, which are related to Er
3+ excitations from the ground state
4I
15/2 to
4F
7/2,
2H
11/2, and
4F
9/2 states, respectively [
10]. The characteristic SPR peak of silver nanoparticles at about 410 nm is overlapped by a glass band edge at about 400 nm and forms some shoulder-like peaks seen in the absorption spectra. The absorption at about 400 nm for all samples are higher than in the reference sample, but for the samples prepared by annealing at 450 °C for one hour, it is widened to longer wavelengths. The intensity of the SPR peak increases gradually with increasing of the duration of annealing from 5 h to 30 h.
Figure 1.
UV-visible absorption spectra for Ag-NP doped Er3+/Yb3+ activated GeO2-PbO glasses with different annealing timing. The blue spectrum, specified with an arrow, is related to a specimen annealed at 450 °C for one hour and shows a higher SPR absorption at longer wavelengths. The SPR peak at about 400–500 nm also increases with increasing annealing time.
2.2. TEM
Figure 2 and
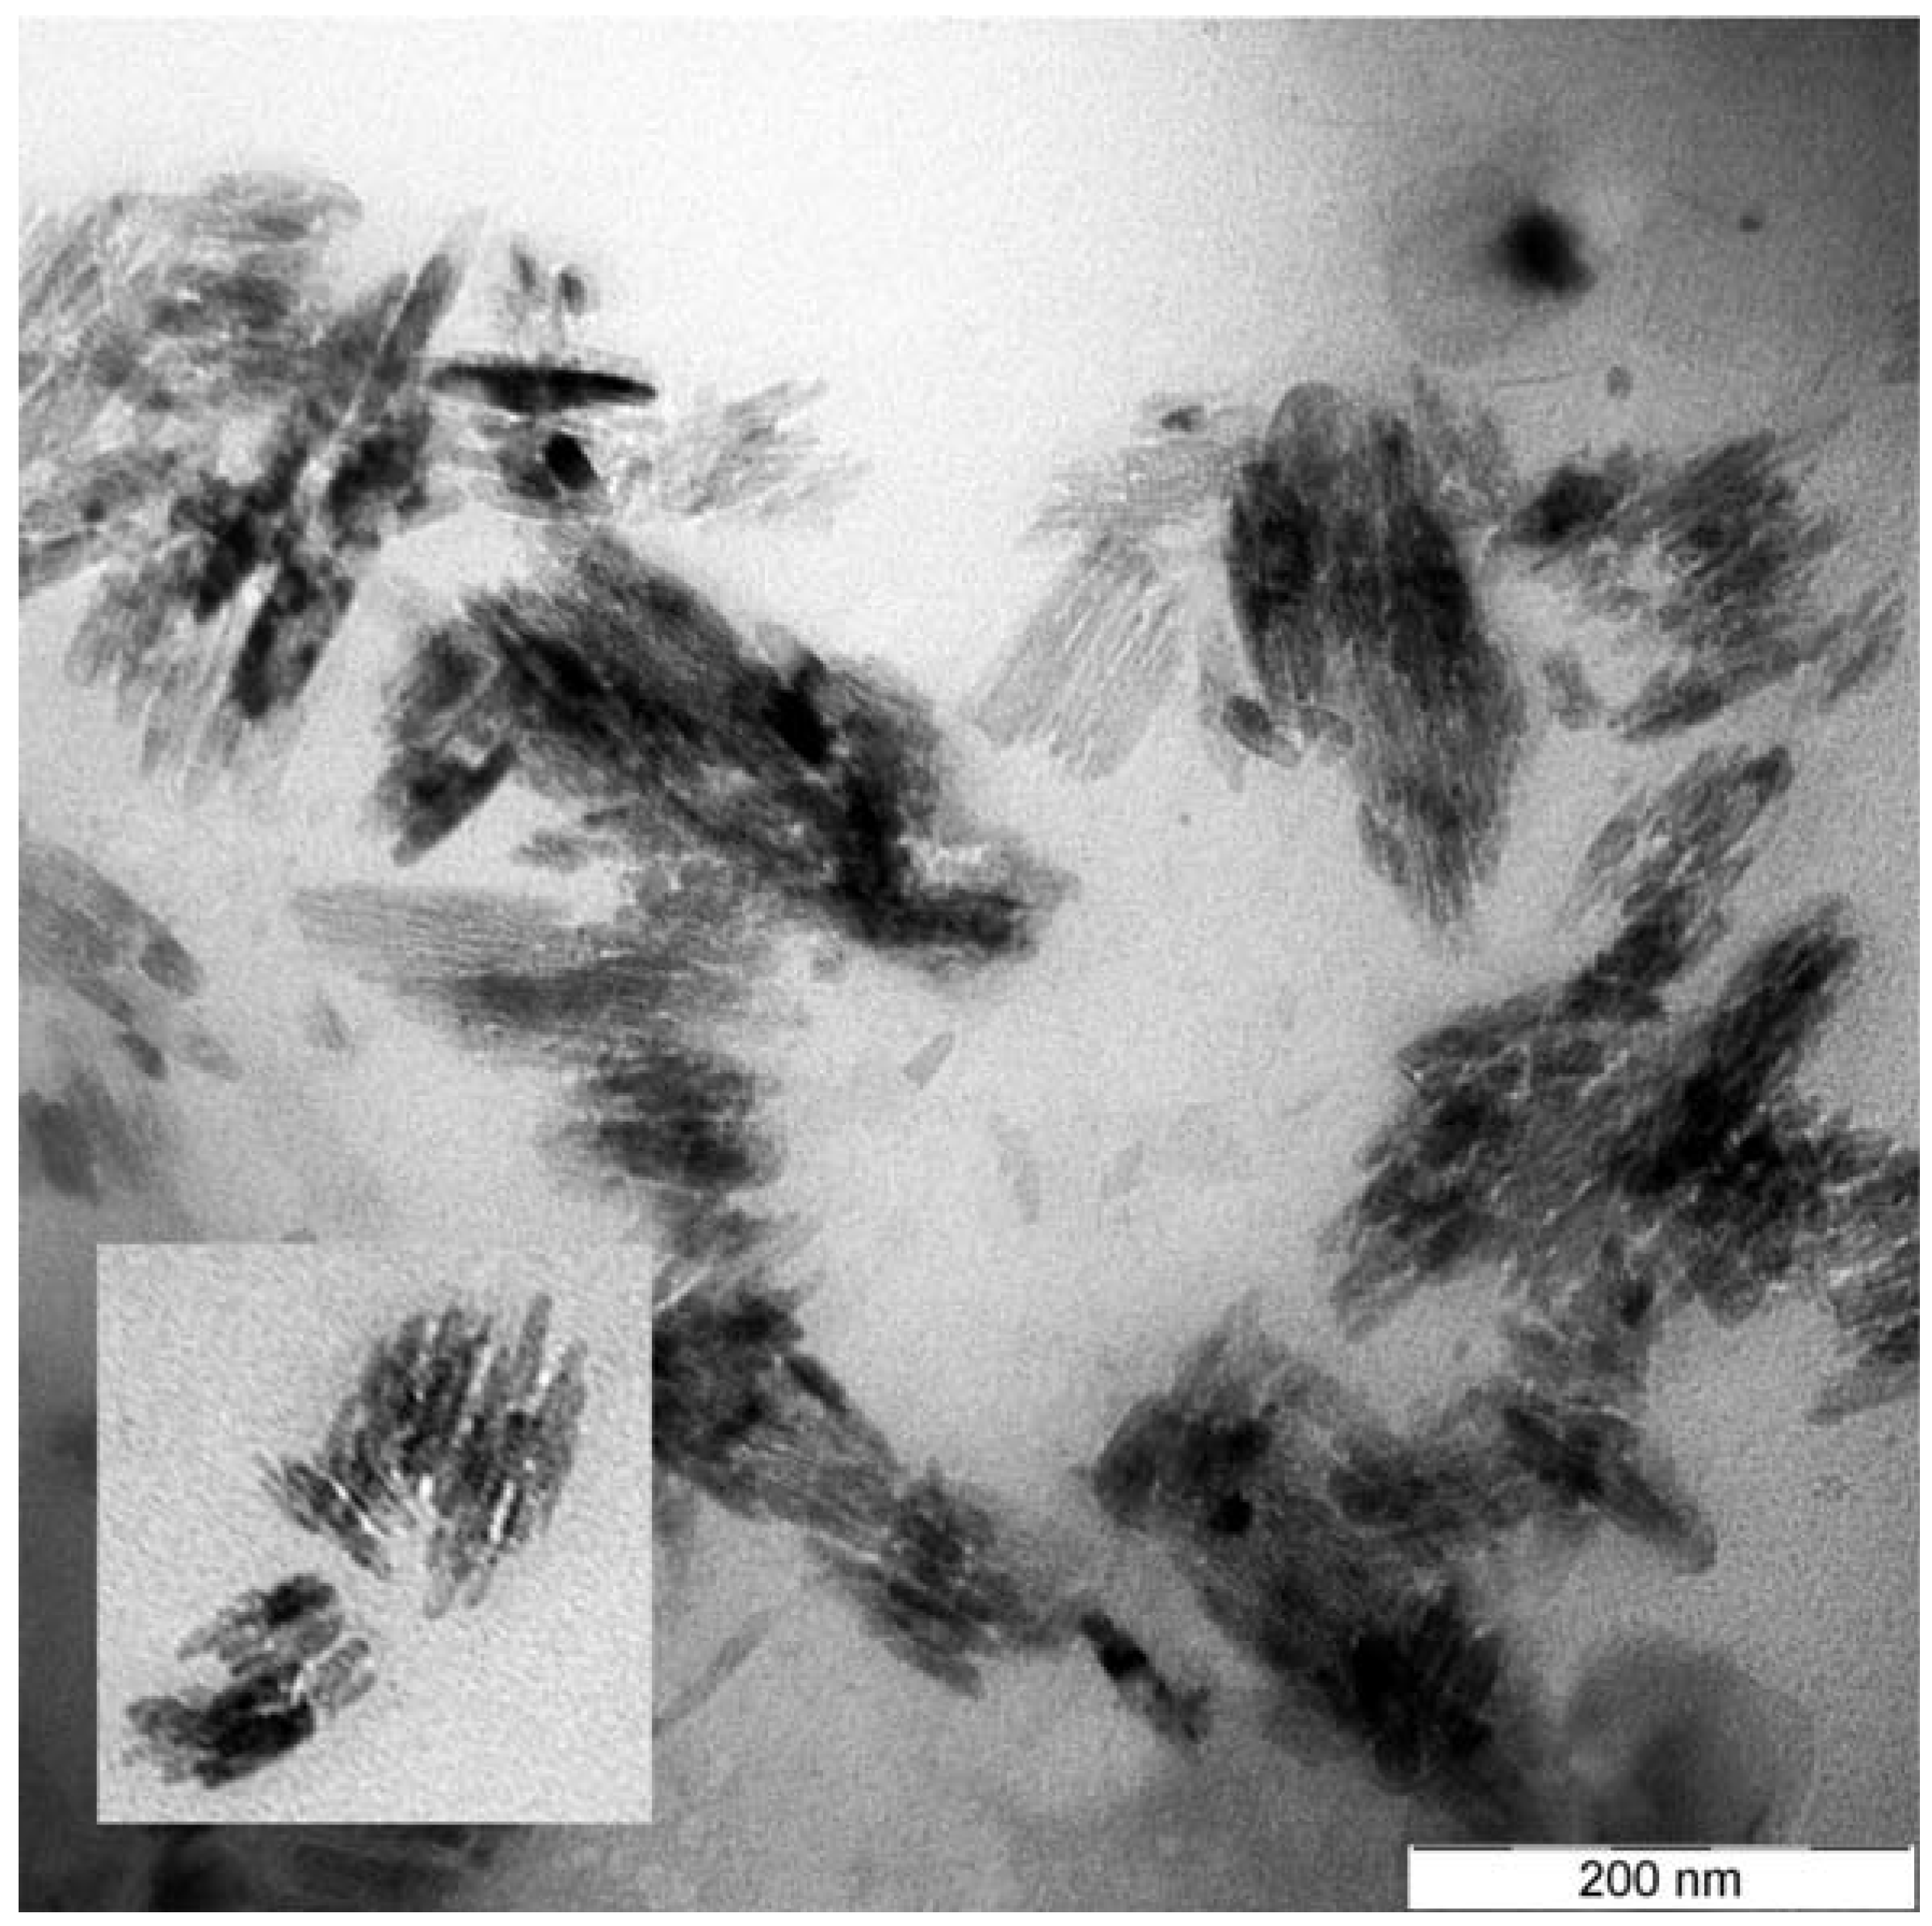
Figure 3 combine TEM images of nanoparticle-doped glass samples and apparently shows the formation of nanostructures embedded in the glass matrix. In
Figure 2 basil-like nanostructures with a mean length and width of 54 nm and 13 nm, respectively, are shown, with neither specific shape nor dense appearance. The TEM picture reveals that the nanobasils consist of many rod-like nanostructures which are joined each other to form a wider basil-like nanostructure.
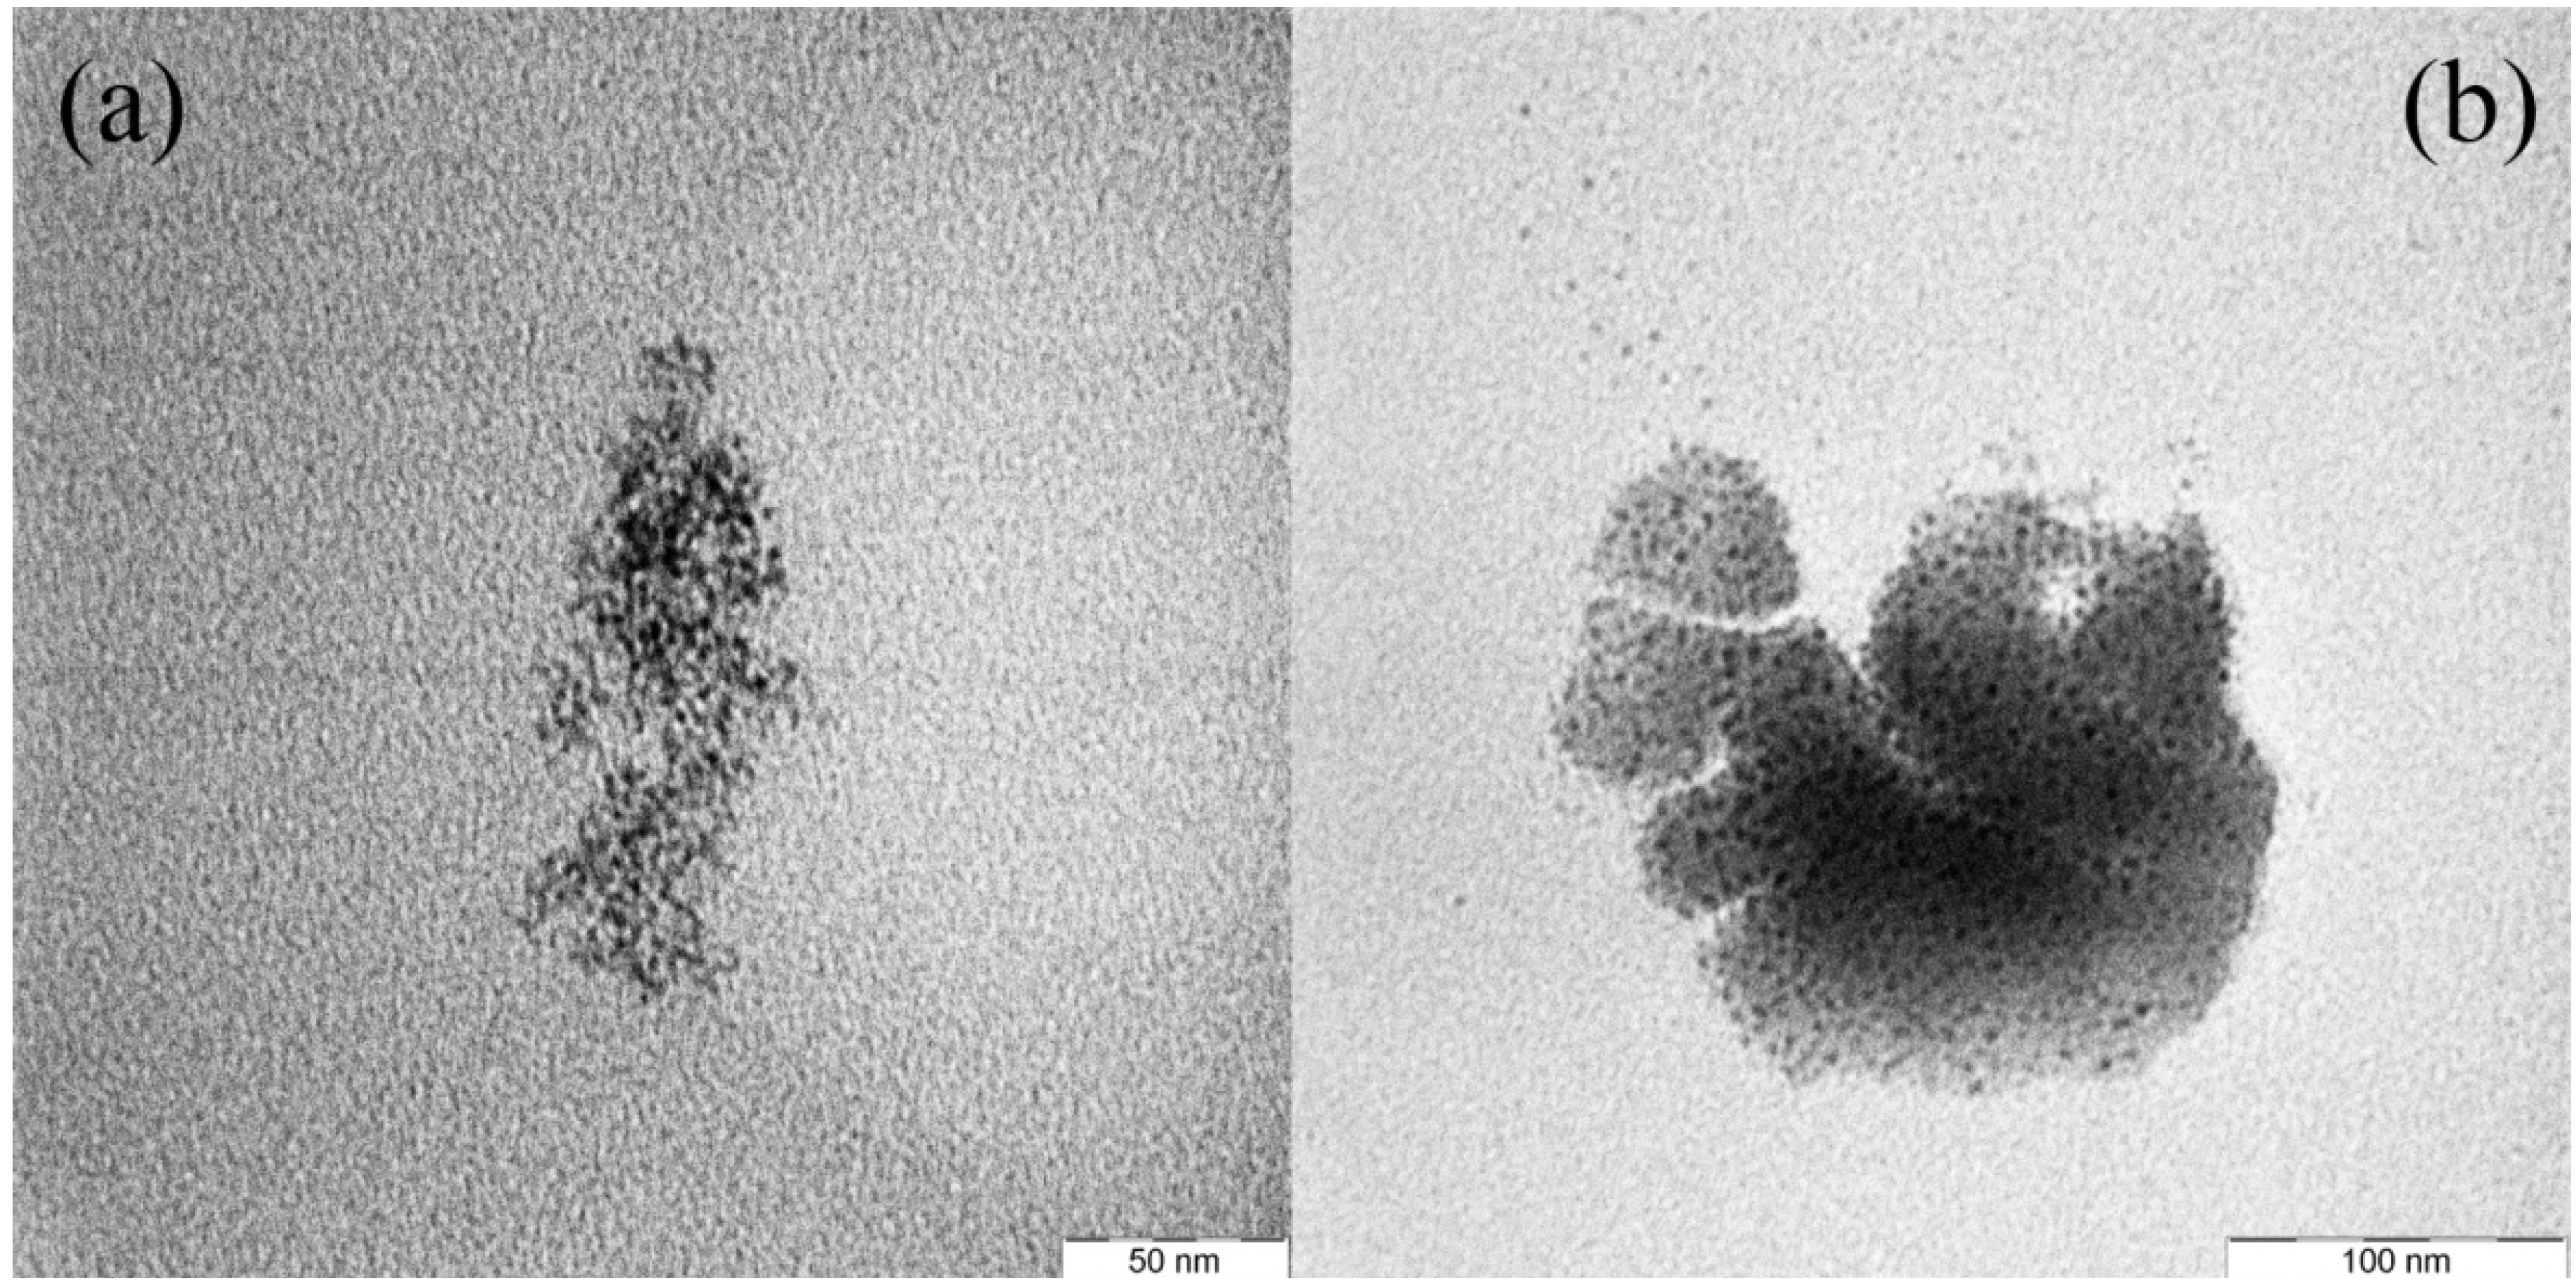
Figure 3a–c shows the nanoparticle formation in the glass matrix by annealing at 450 °C for 5, 10, and 20 h, respectively.
Figure 2.
TEM images for Ag-NP doped RE activated GeO2-PbO glasses annealed at 450 °C for one hour. basil-like silver nanostructures is shown in the figure. More details from this sample are shown in the intercept.
Figure 2.
TEM images for Ag-NP doped RE activated GeO2-PbO glasses annealed at 450 °C for one hour. basil-like silver nanostructures is shown in the figure. More details from this sample are shown in the intercept.
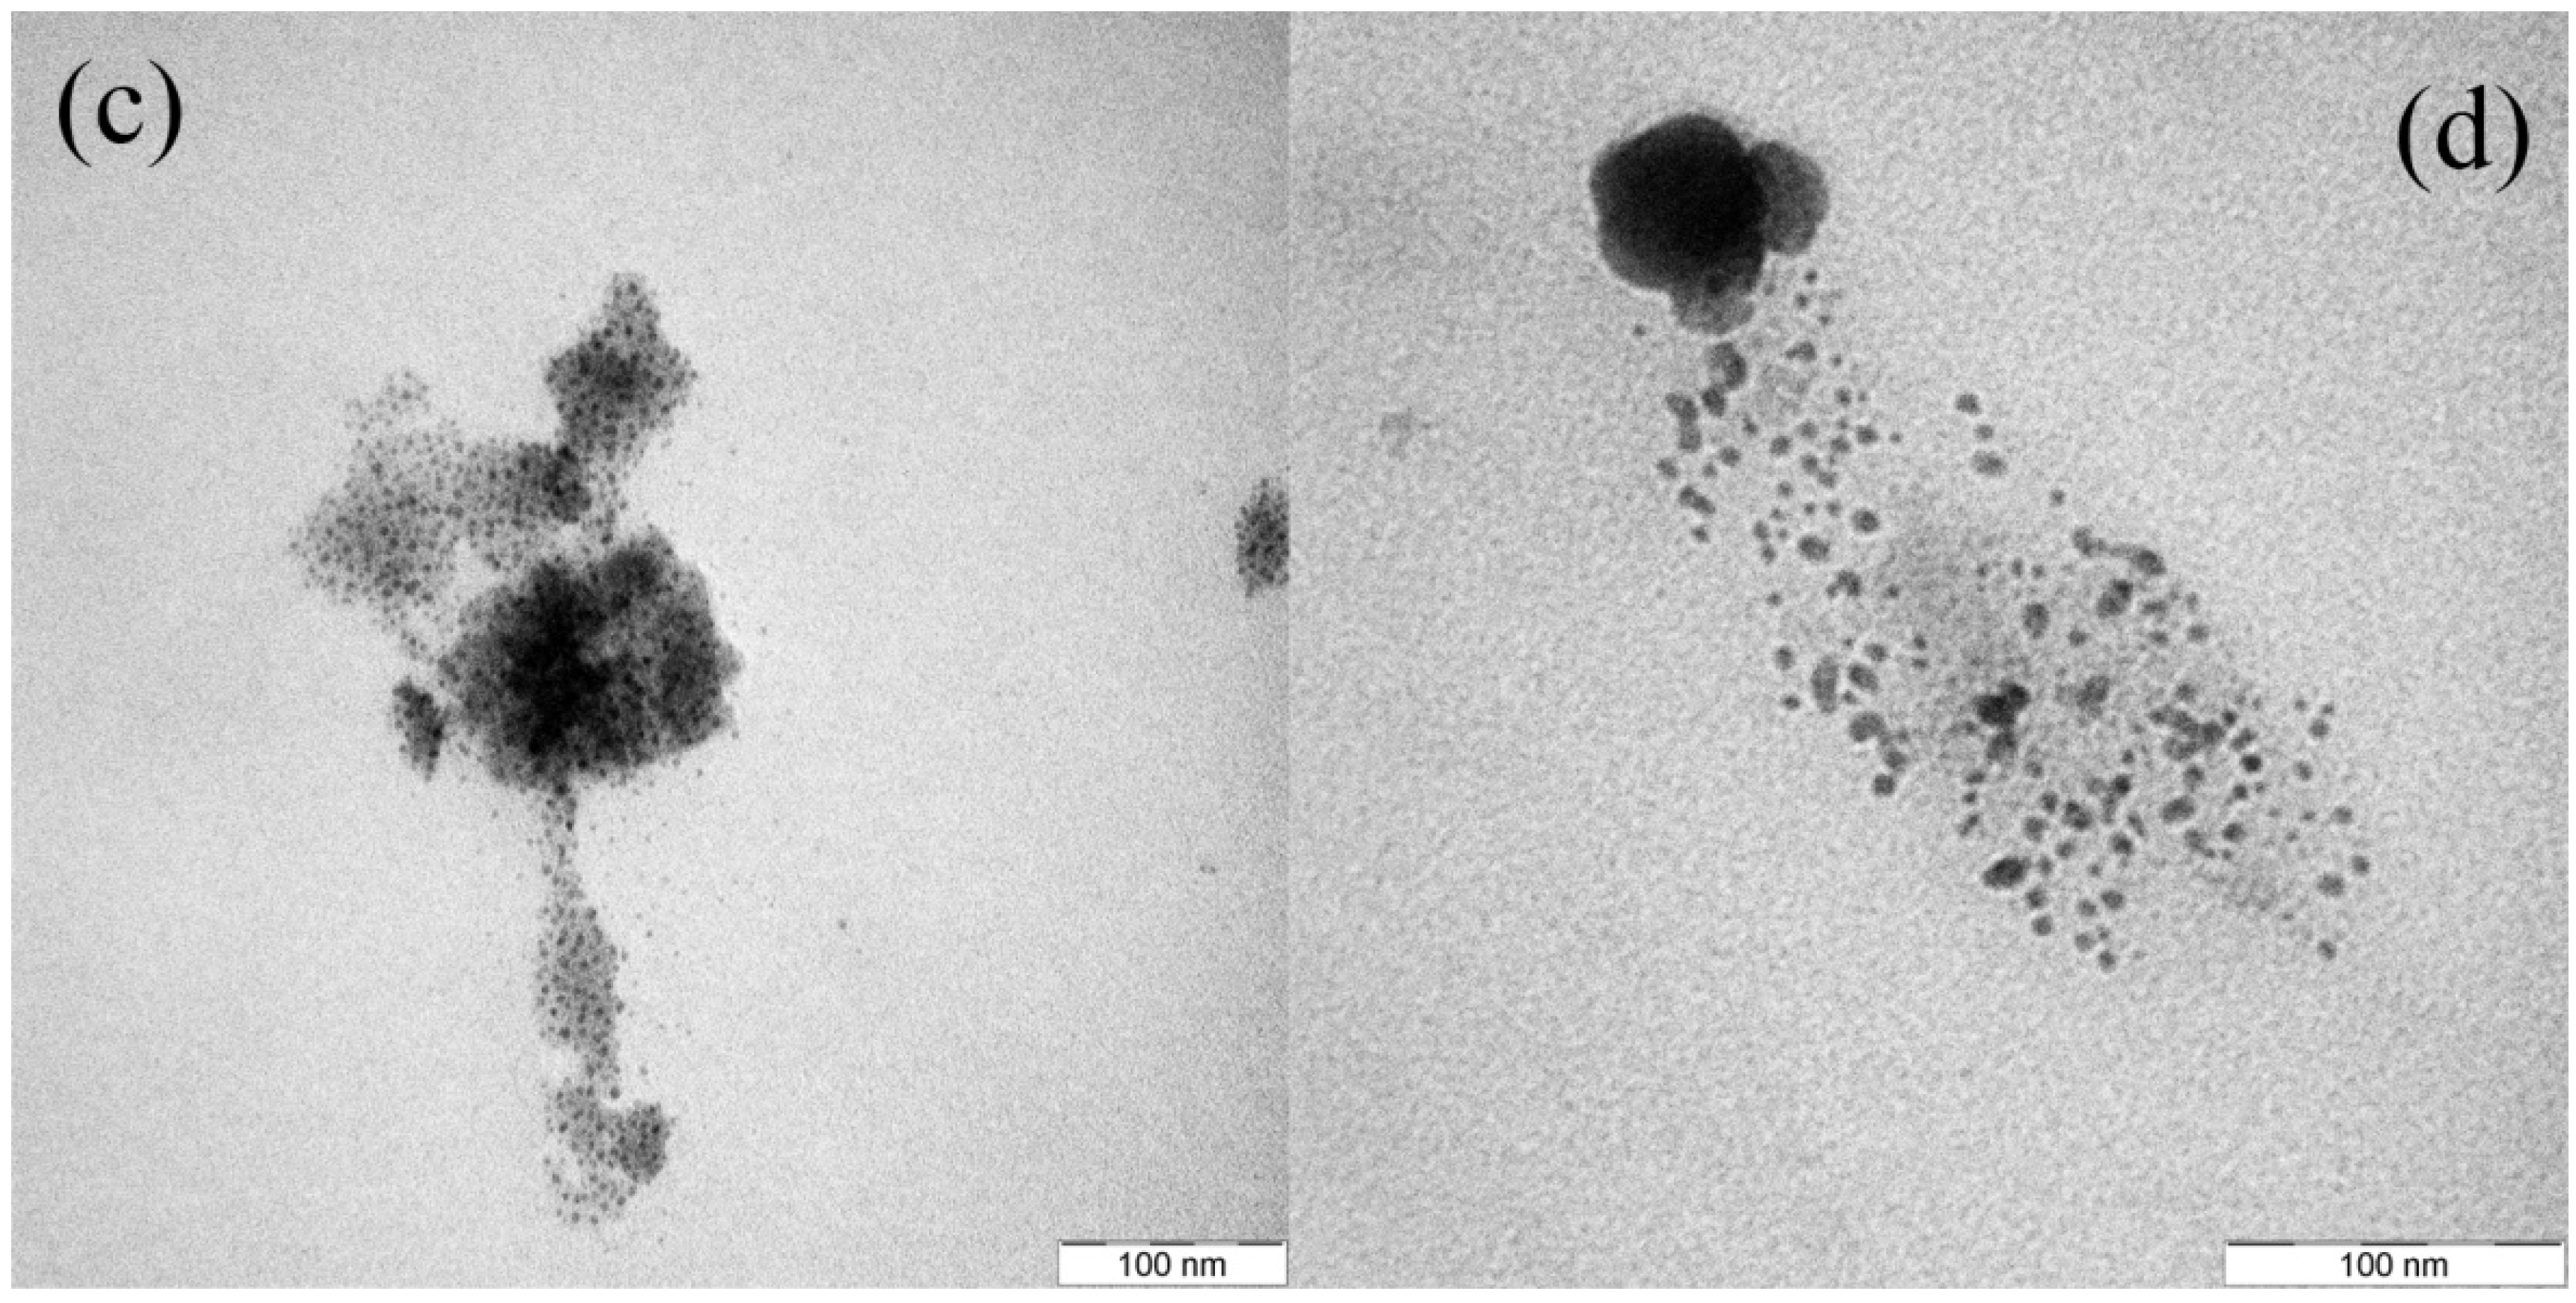
Figure 3.
TEM images for Ag-NP doped RE activated GeO
2-PbO glasses with (
a) 5 hour, (
b) 10 h, (
c) 20 h and (
d) 30 h annealing time. The Ag nanoparticles embedded in glass matrix are shown in the figure. Increasing of annealing duration causes aggregation of small nanoparticles (mean diameter of 3.6 nm) turn to larger particles (5.6 nm) as seen on
Figure 3d.
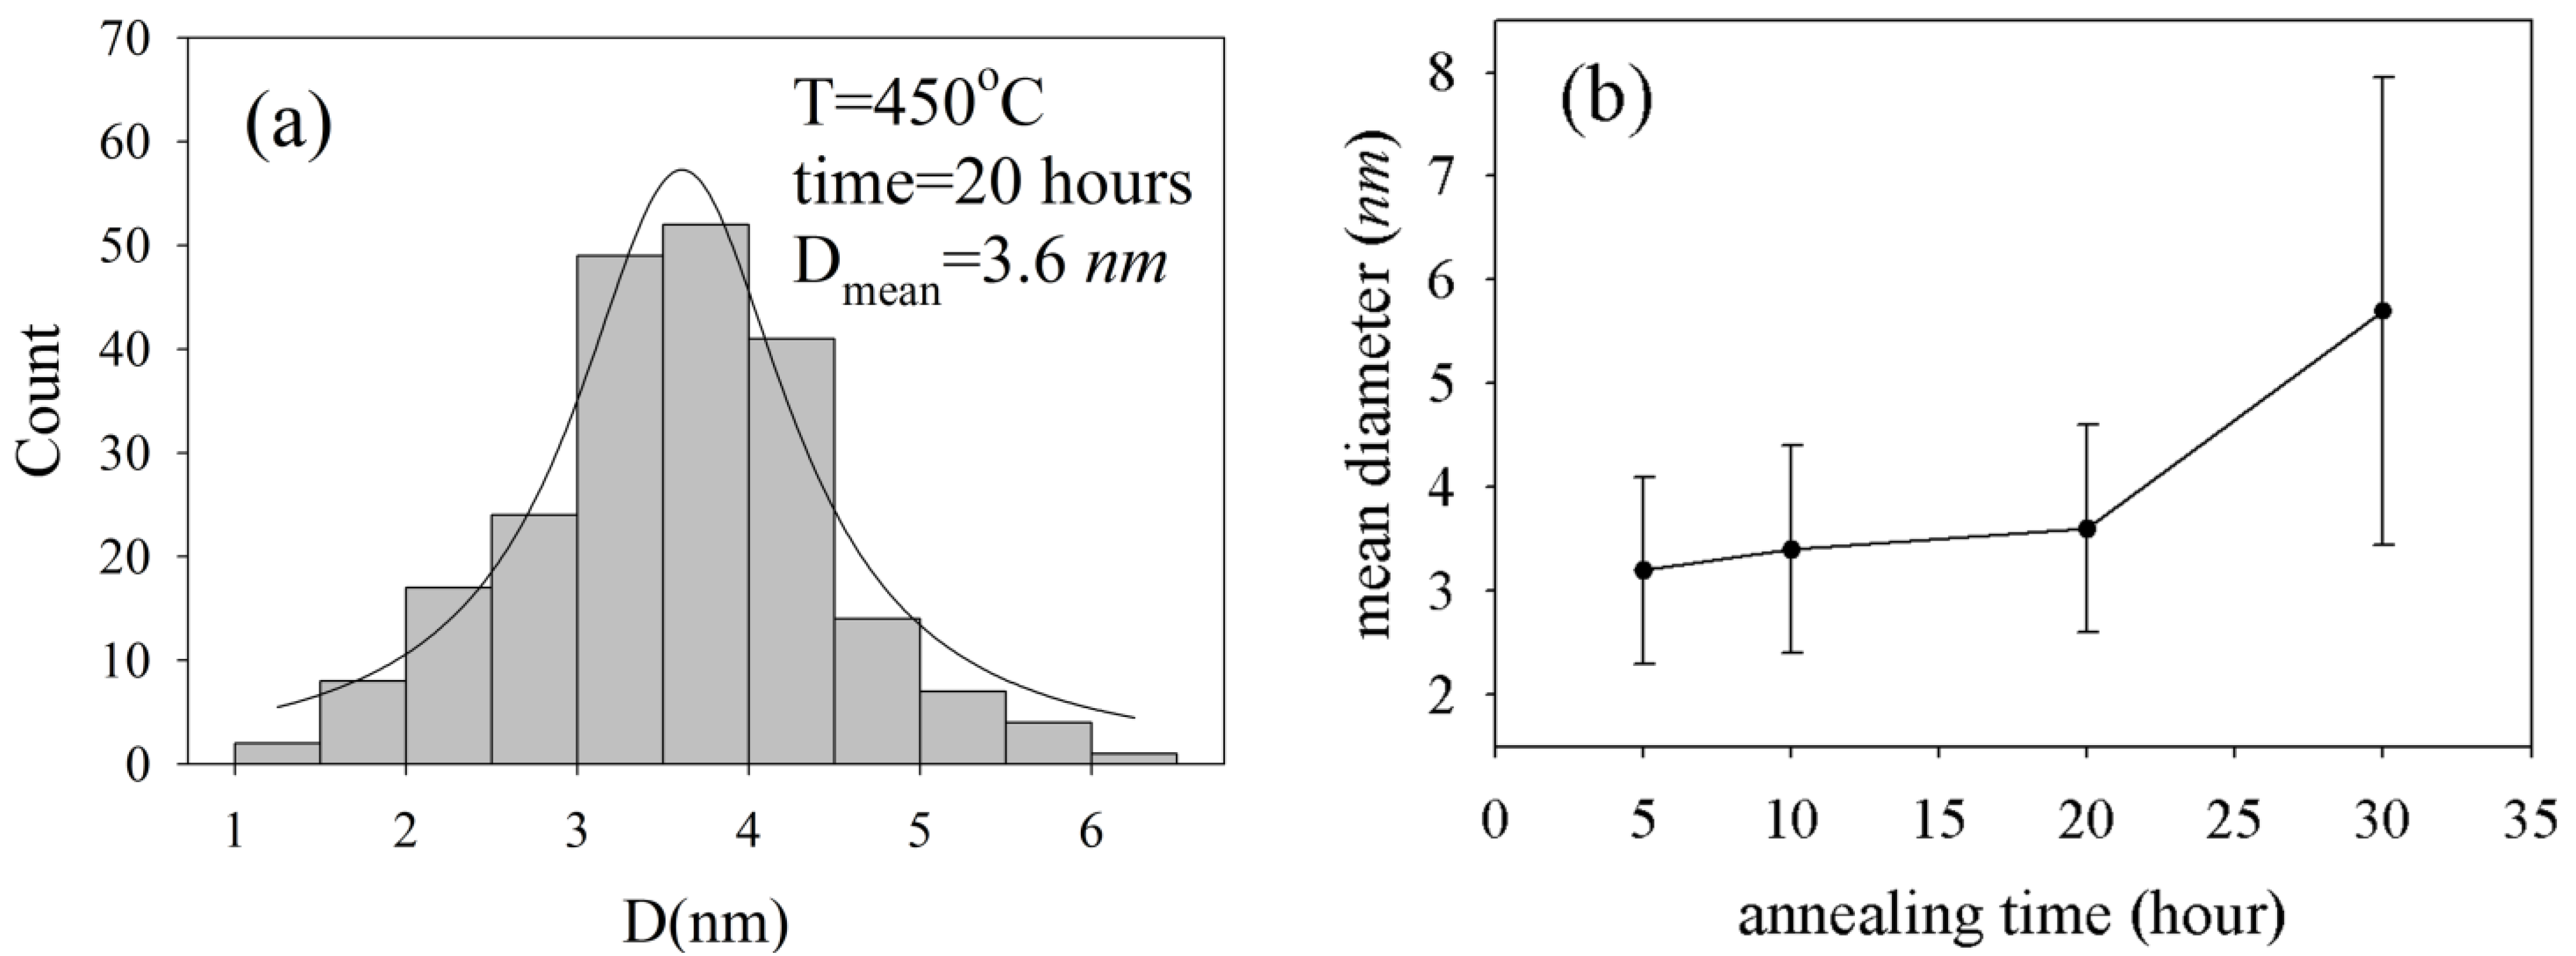
These figures clearly represent pieces of glass-embedded 3–4 nm size spherical silver nanoparticles in their matrix. Particle size distribution and Lorentzian fit for
Figure 3c are depicted in
Figure 4a. This figure shows that particles are uniformly distributed around a mean diameter of 3.6 nm. Based on
Figure 4b, the mean size of nanoparticles does not change considerably with an increase of annealing time up to 30 h. Moreover, when the annealing time increases to 30 h, the silver nanoparticles aggregates turn into bigger, but slightly deformed ones, as shown in
Figure 3d and
Figure 4b.
Figure 4.
(
a) The size distribution of NP particles and Lorentzian fit for TEM image of
Figure 3 b,c. The relation between NP’s mean size and annealing duration. The error bar represents standard deviation of size measurement.
Figure 4.
(
a) The size distribution of NP particles and Lorentzian fit for TEM image of
Figure 3 b,c. The relation between NP’s mean size and annealing duration. The error bar represents standard deviation of size measurement.
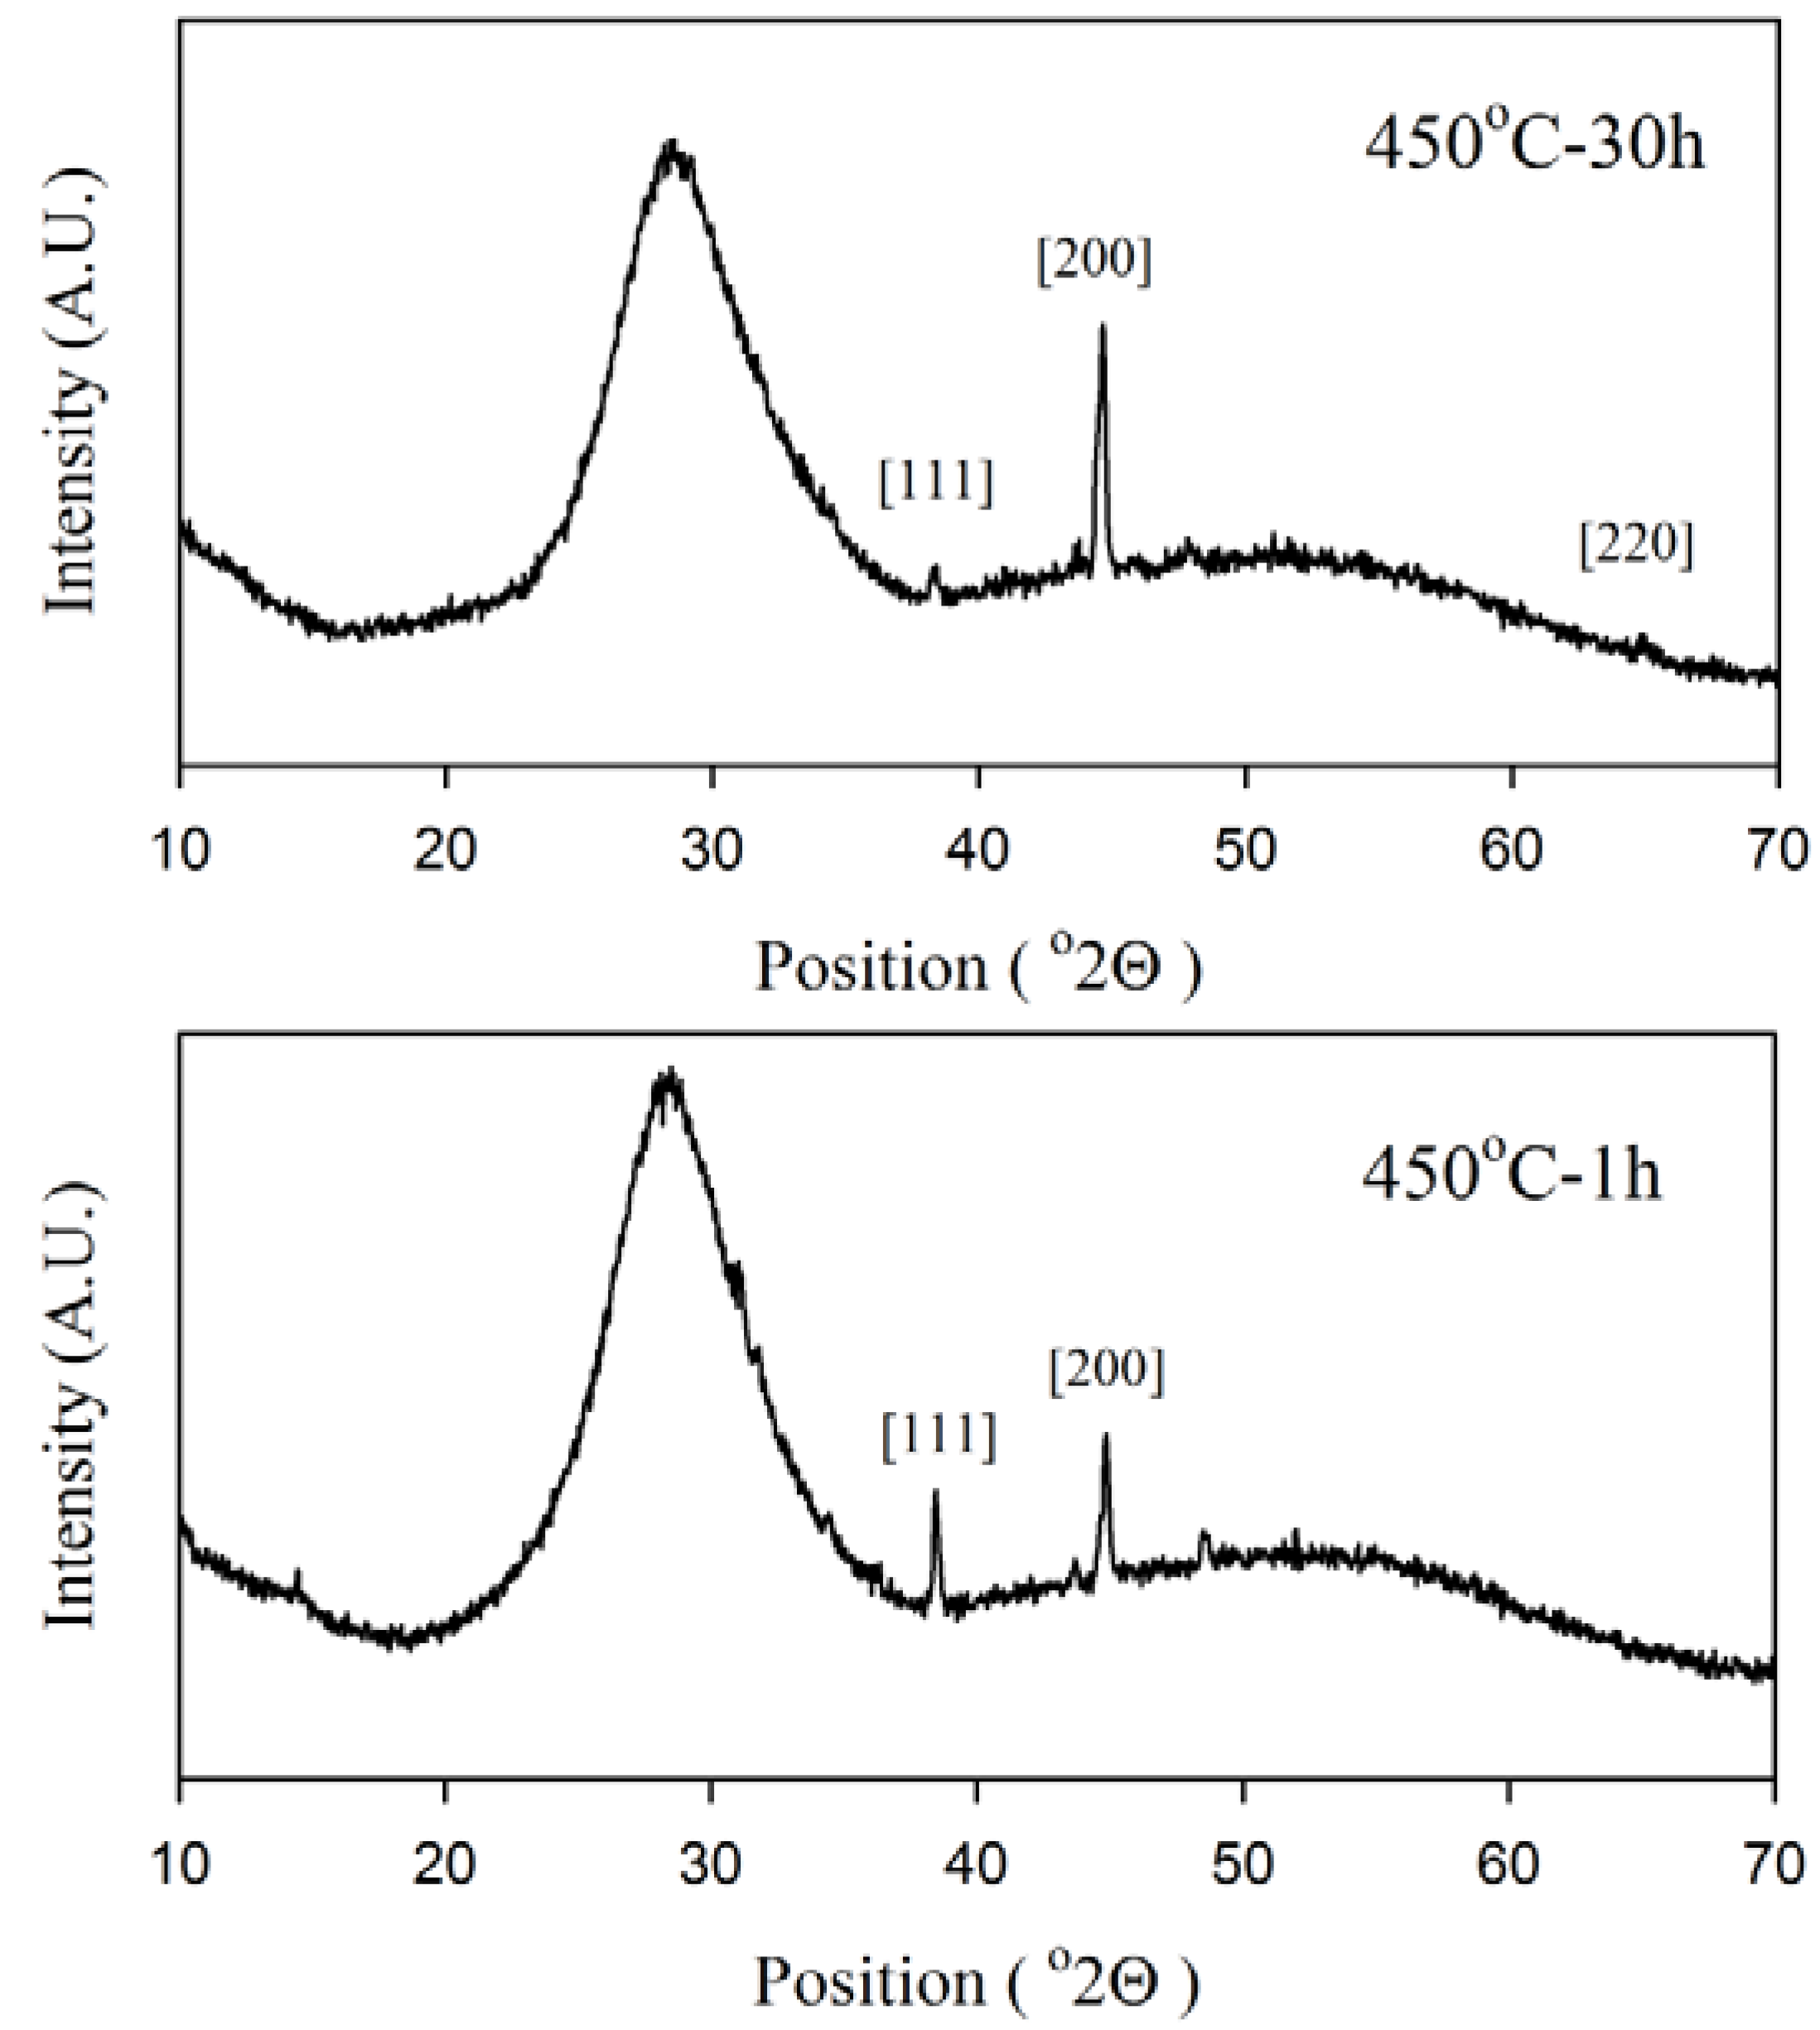
2.3. XRD
Figure 5 shows X-ray diffraction patterns collected from annealed samples. In addition to the amorphous background, sharp peaks at 38.3°, 44.6° and 64.8° were detected in the XRD patterns which show crystallizations in the glass matrix. All peaks were indices of a cubic silver single phase which is in good accordance with XRD reference number (JCPDS 1-87-720). Comparison between two patterns related to minimum and maximum annealing time in
Figure 4 reveal that nanostructures after one hour annealing growth more in the [111] direction due to the higher intensity of the peak at 38.3° in comparison with the 450 °C-30 h sample. In addition, no evidence was obtained from XRD measurements to show the existence of Ag
2O (JCPDS 76-1393) or AgO (JCPDS 84-1108) crystalline phases.
Figure 5.
XRD spectra of Ag-NP doped Er3+/Yb3+ activated GeO2-PbO glass for samples annealed for 1 and 30 h. The sharp peaks were indices according to the crystalline directions of silver.
Figure 5.
XRD spectra of Ag-NP doped Er3+/Yb3+ activated GeO2-PbO glass for samples annealed for 1 and 30 h. The sharp peaks were indices according to the crystalline directions of silver.
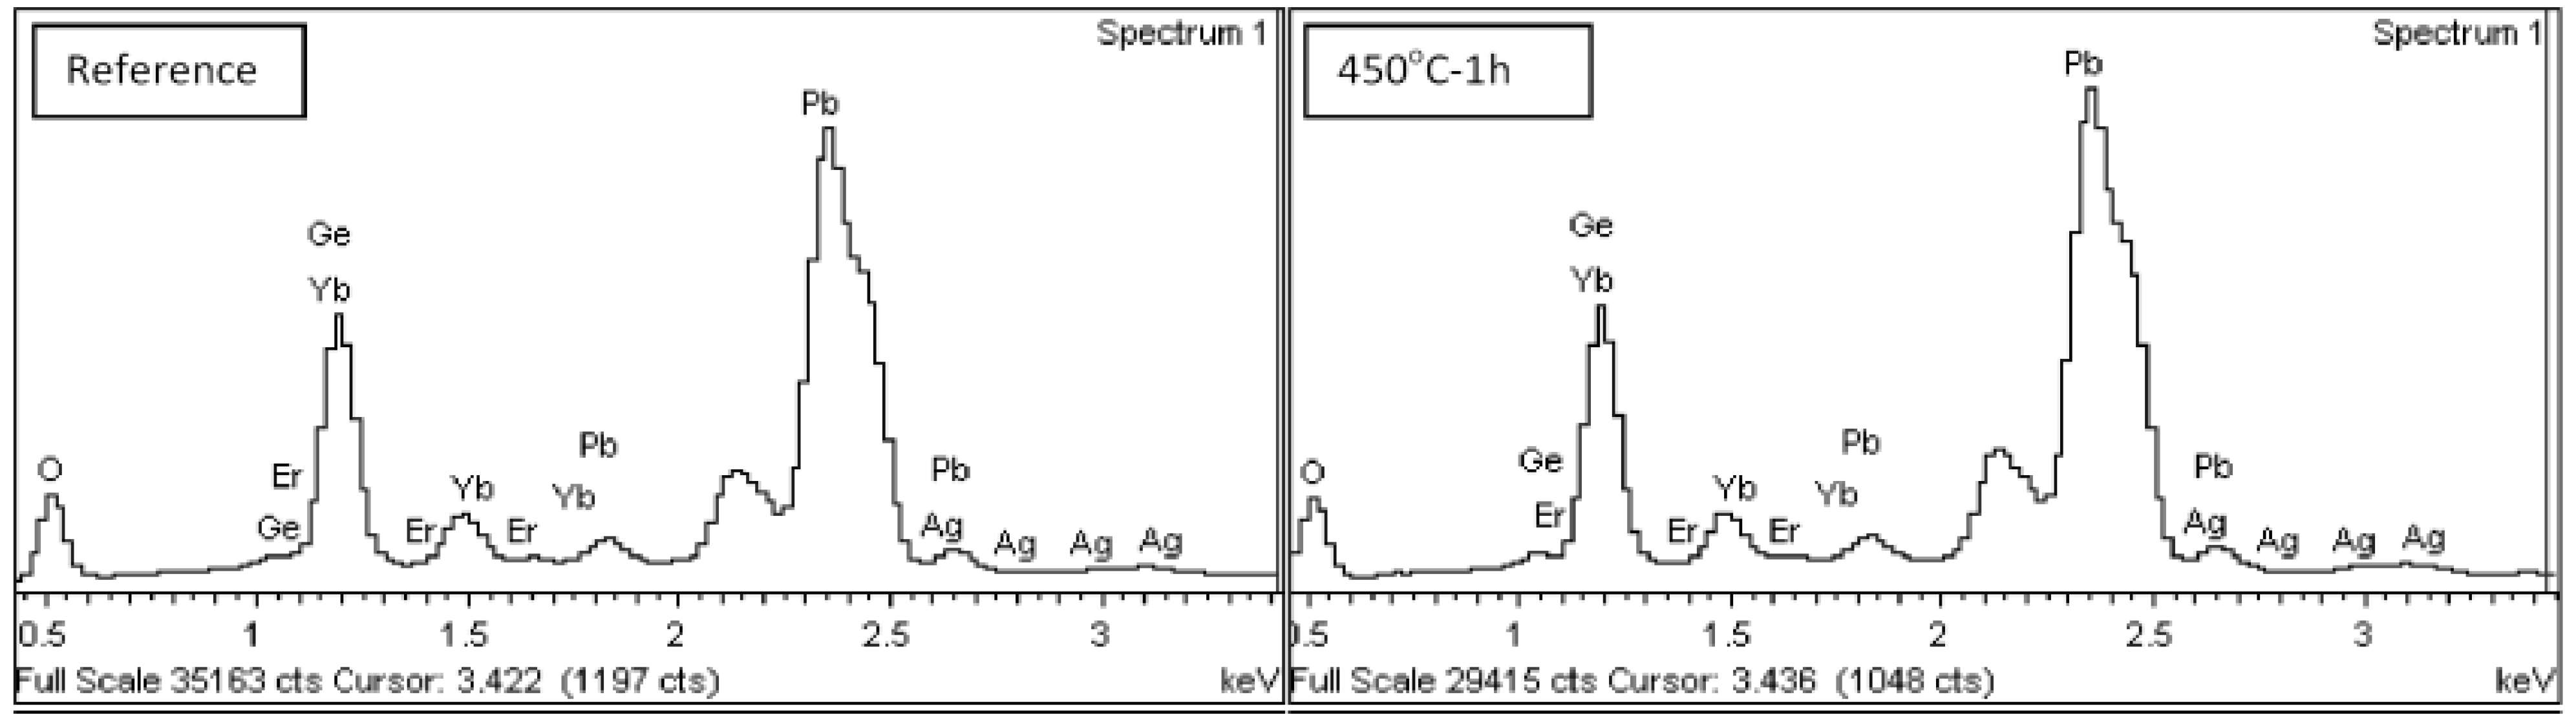
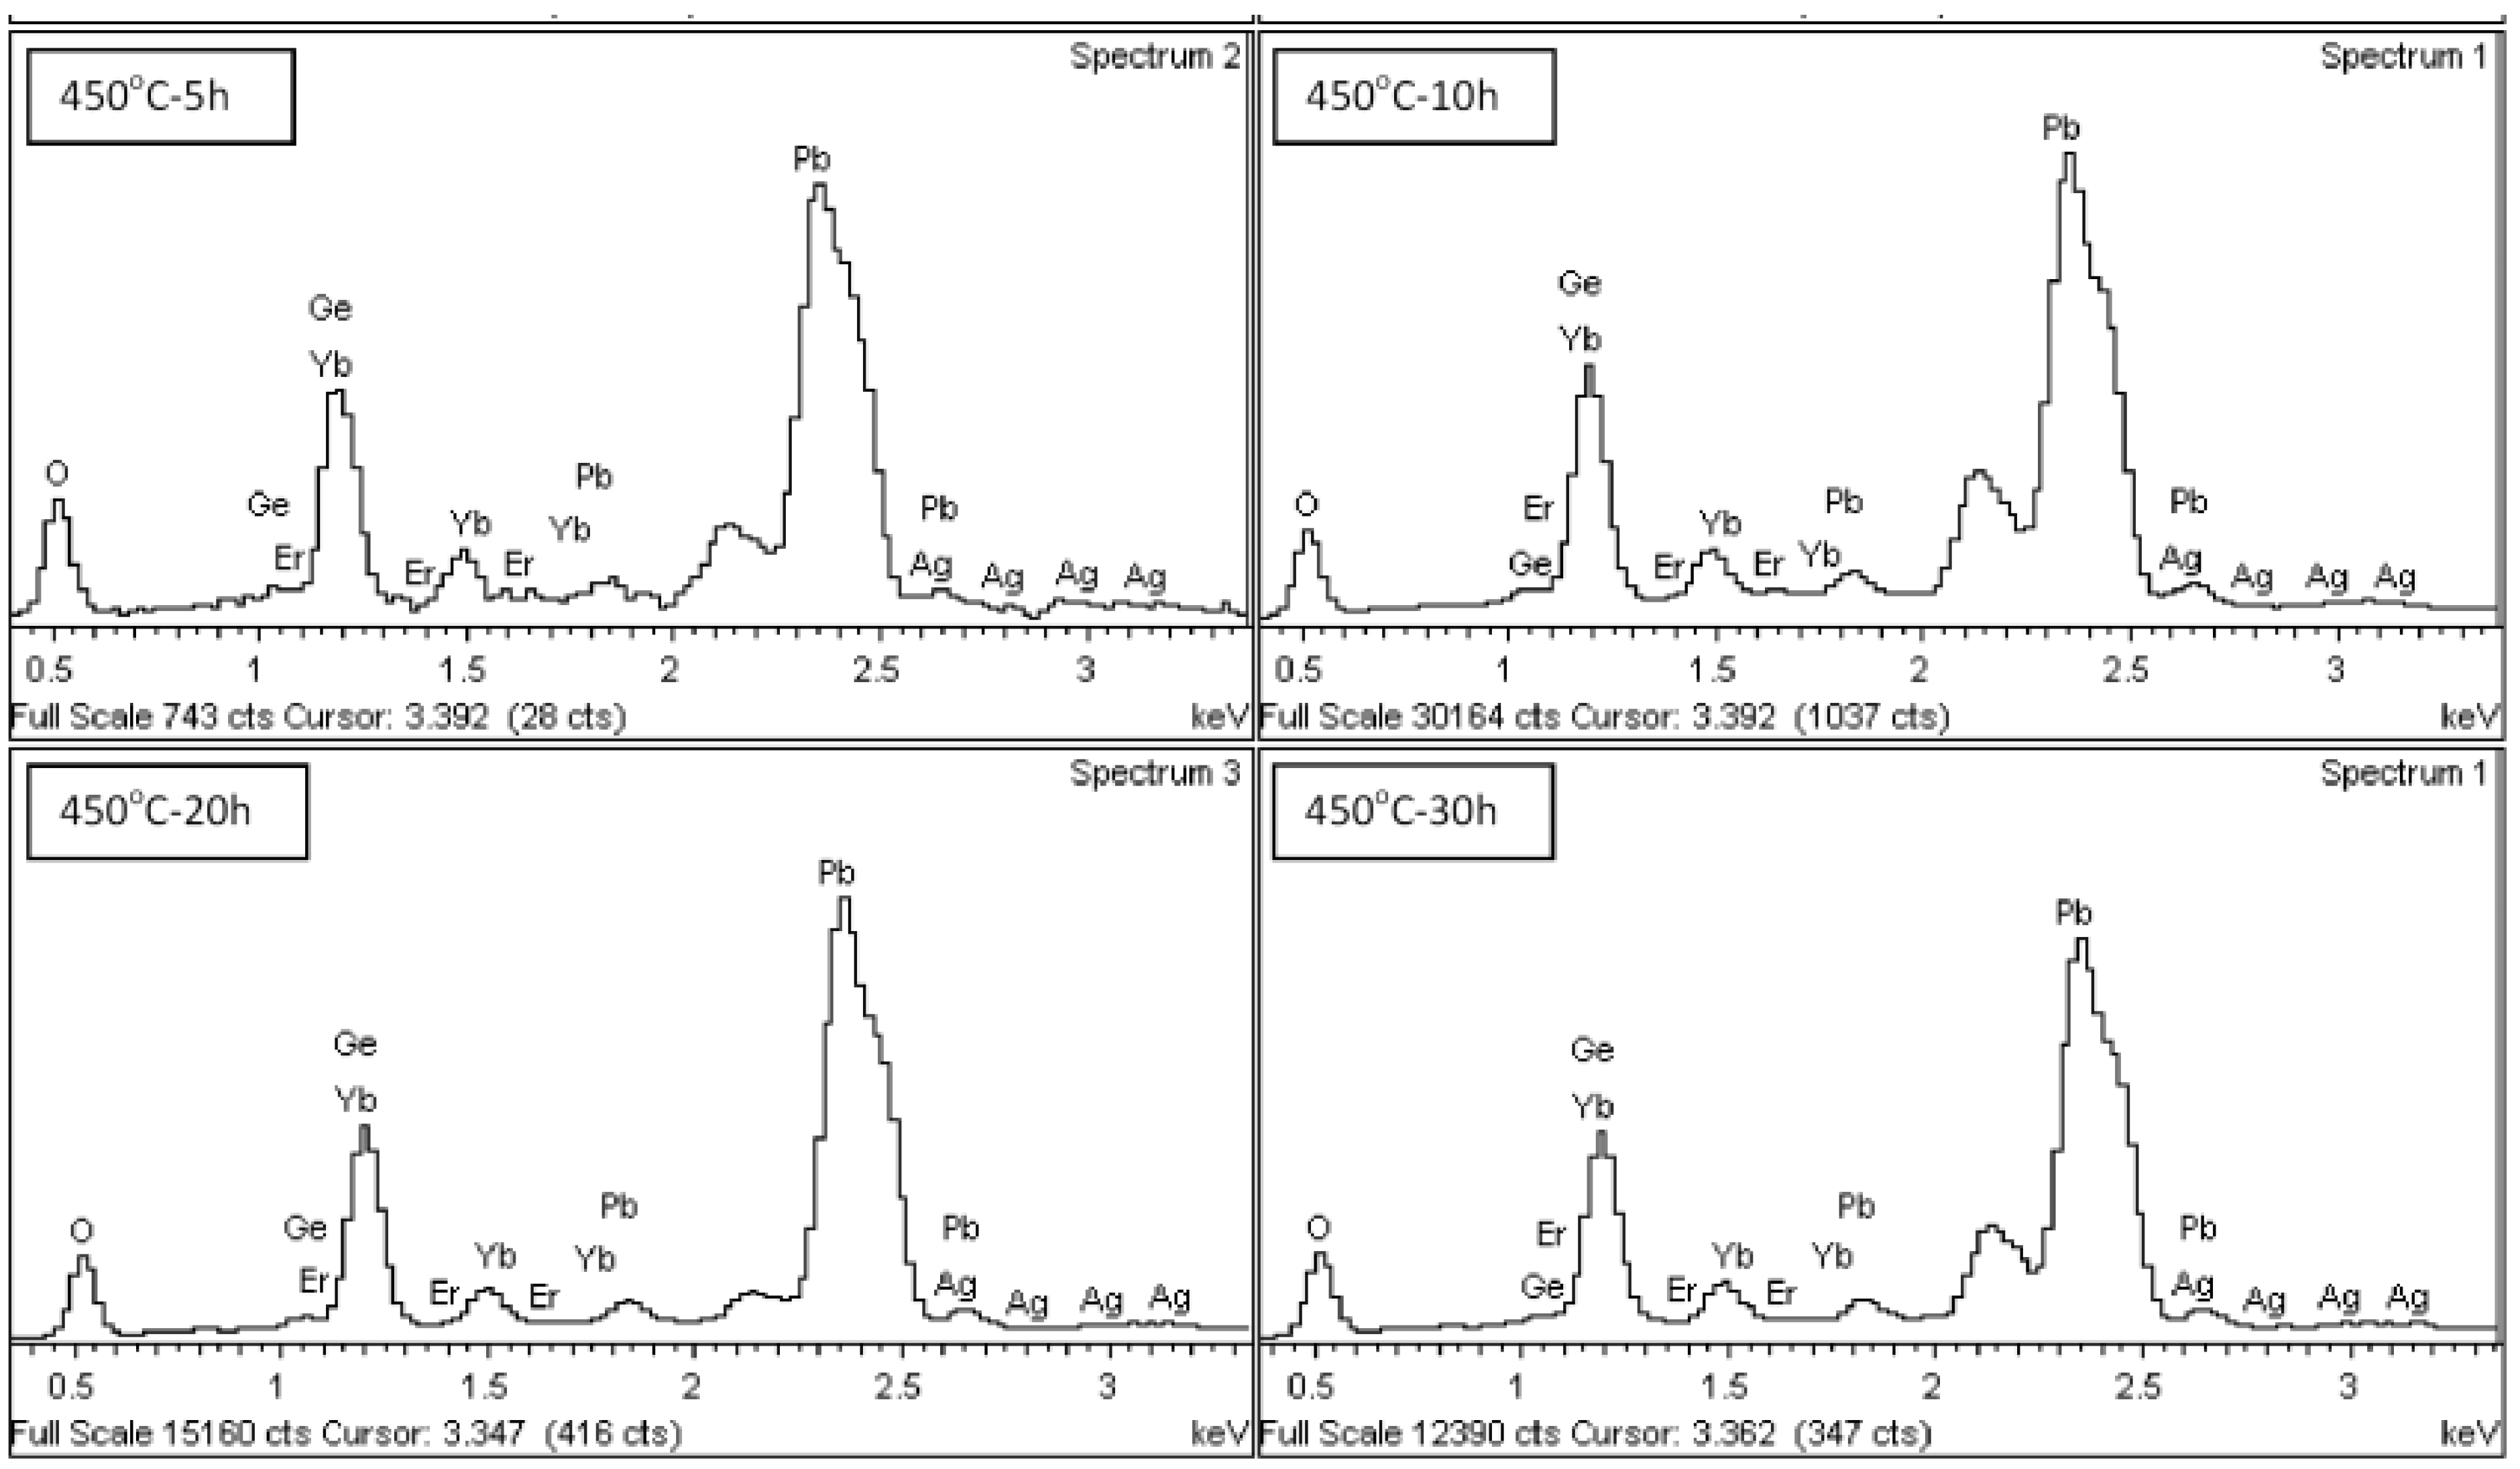
2.4. EDX
Figure 6 shows energy-dispersive X-ray (EDX) spectra collected from Ag-NP doped Er
3+/Yb
3+ activated GeO
2-PbO glass.
Figure 6.
EDX spectra of Ag-NP doped Er3+/Yb3+ activated GeO2-PbO glass.
Figure 6.
EDX spectra of Ag-NP doped Er3+/Yb3+ activated GeO2-PbO glass.
These spectra show the elements participate in the glass material and are summarized in
Table 1 in terms of weight percent. According to EDX data, contribution of all materials which make up the glass matrix (Ge, Pb, and O) and the dopants (Ag, Er, and Yb) is confirmed.
Table 1.
EDX data of Ag-NP doped Er3+/Yb3+ activated GeO2-PbO glass. All values are in weight percent.
Table 1.
EDX data of Ag-NP doped Er3+/Yb3+ activated GeO2-PbO glass. All values are in weight percent.
| Sample | C | O | Ge | Ag | Er | Yb | Pb | Total |
|---|
| Ref | 7.94 | 19.49 | 26.53 | 0.34 | 0.36 | 1.17 | 44.17 | 100.00 |
| 450-1h | 6.83 | 20.79 | 25.36 | 0.35 | 0.24 | 1.47 | 44.96 | 100.00 |
| 450-5h | 7.09 | 14.56 | 30.68 | 0.32 | 0.45 | 1.71 | 45.19 | 100.00 |
| 450-10h | 6.96 | 20.26 | 25.09 | 0.27 | 0.39 | 1.51 | 45.51 | 100.00 |
| 450-20h | 6.6 | 21.02 | 29.72 | 0.34 | 0.32 | 1.46 | 40.54 | 100.00 |
| 450-30h | 7.2 | 21.67 | 23.94 | 0.34 | 0.46 | 1.27 | 45.12 | 100.00 |
2.5. FTIR
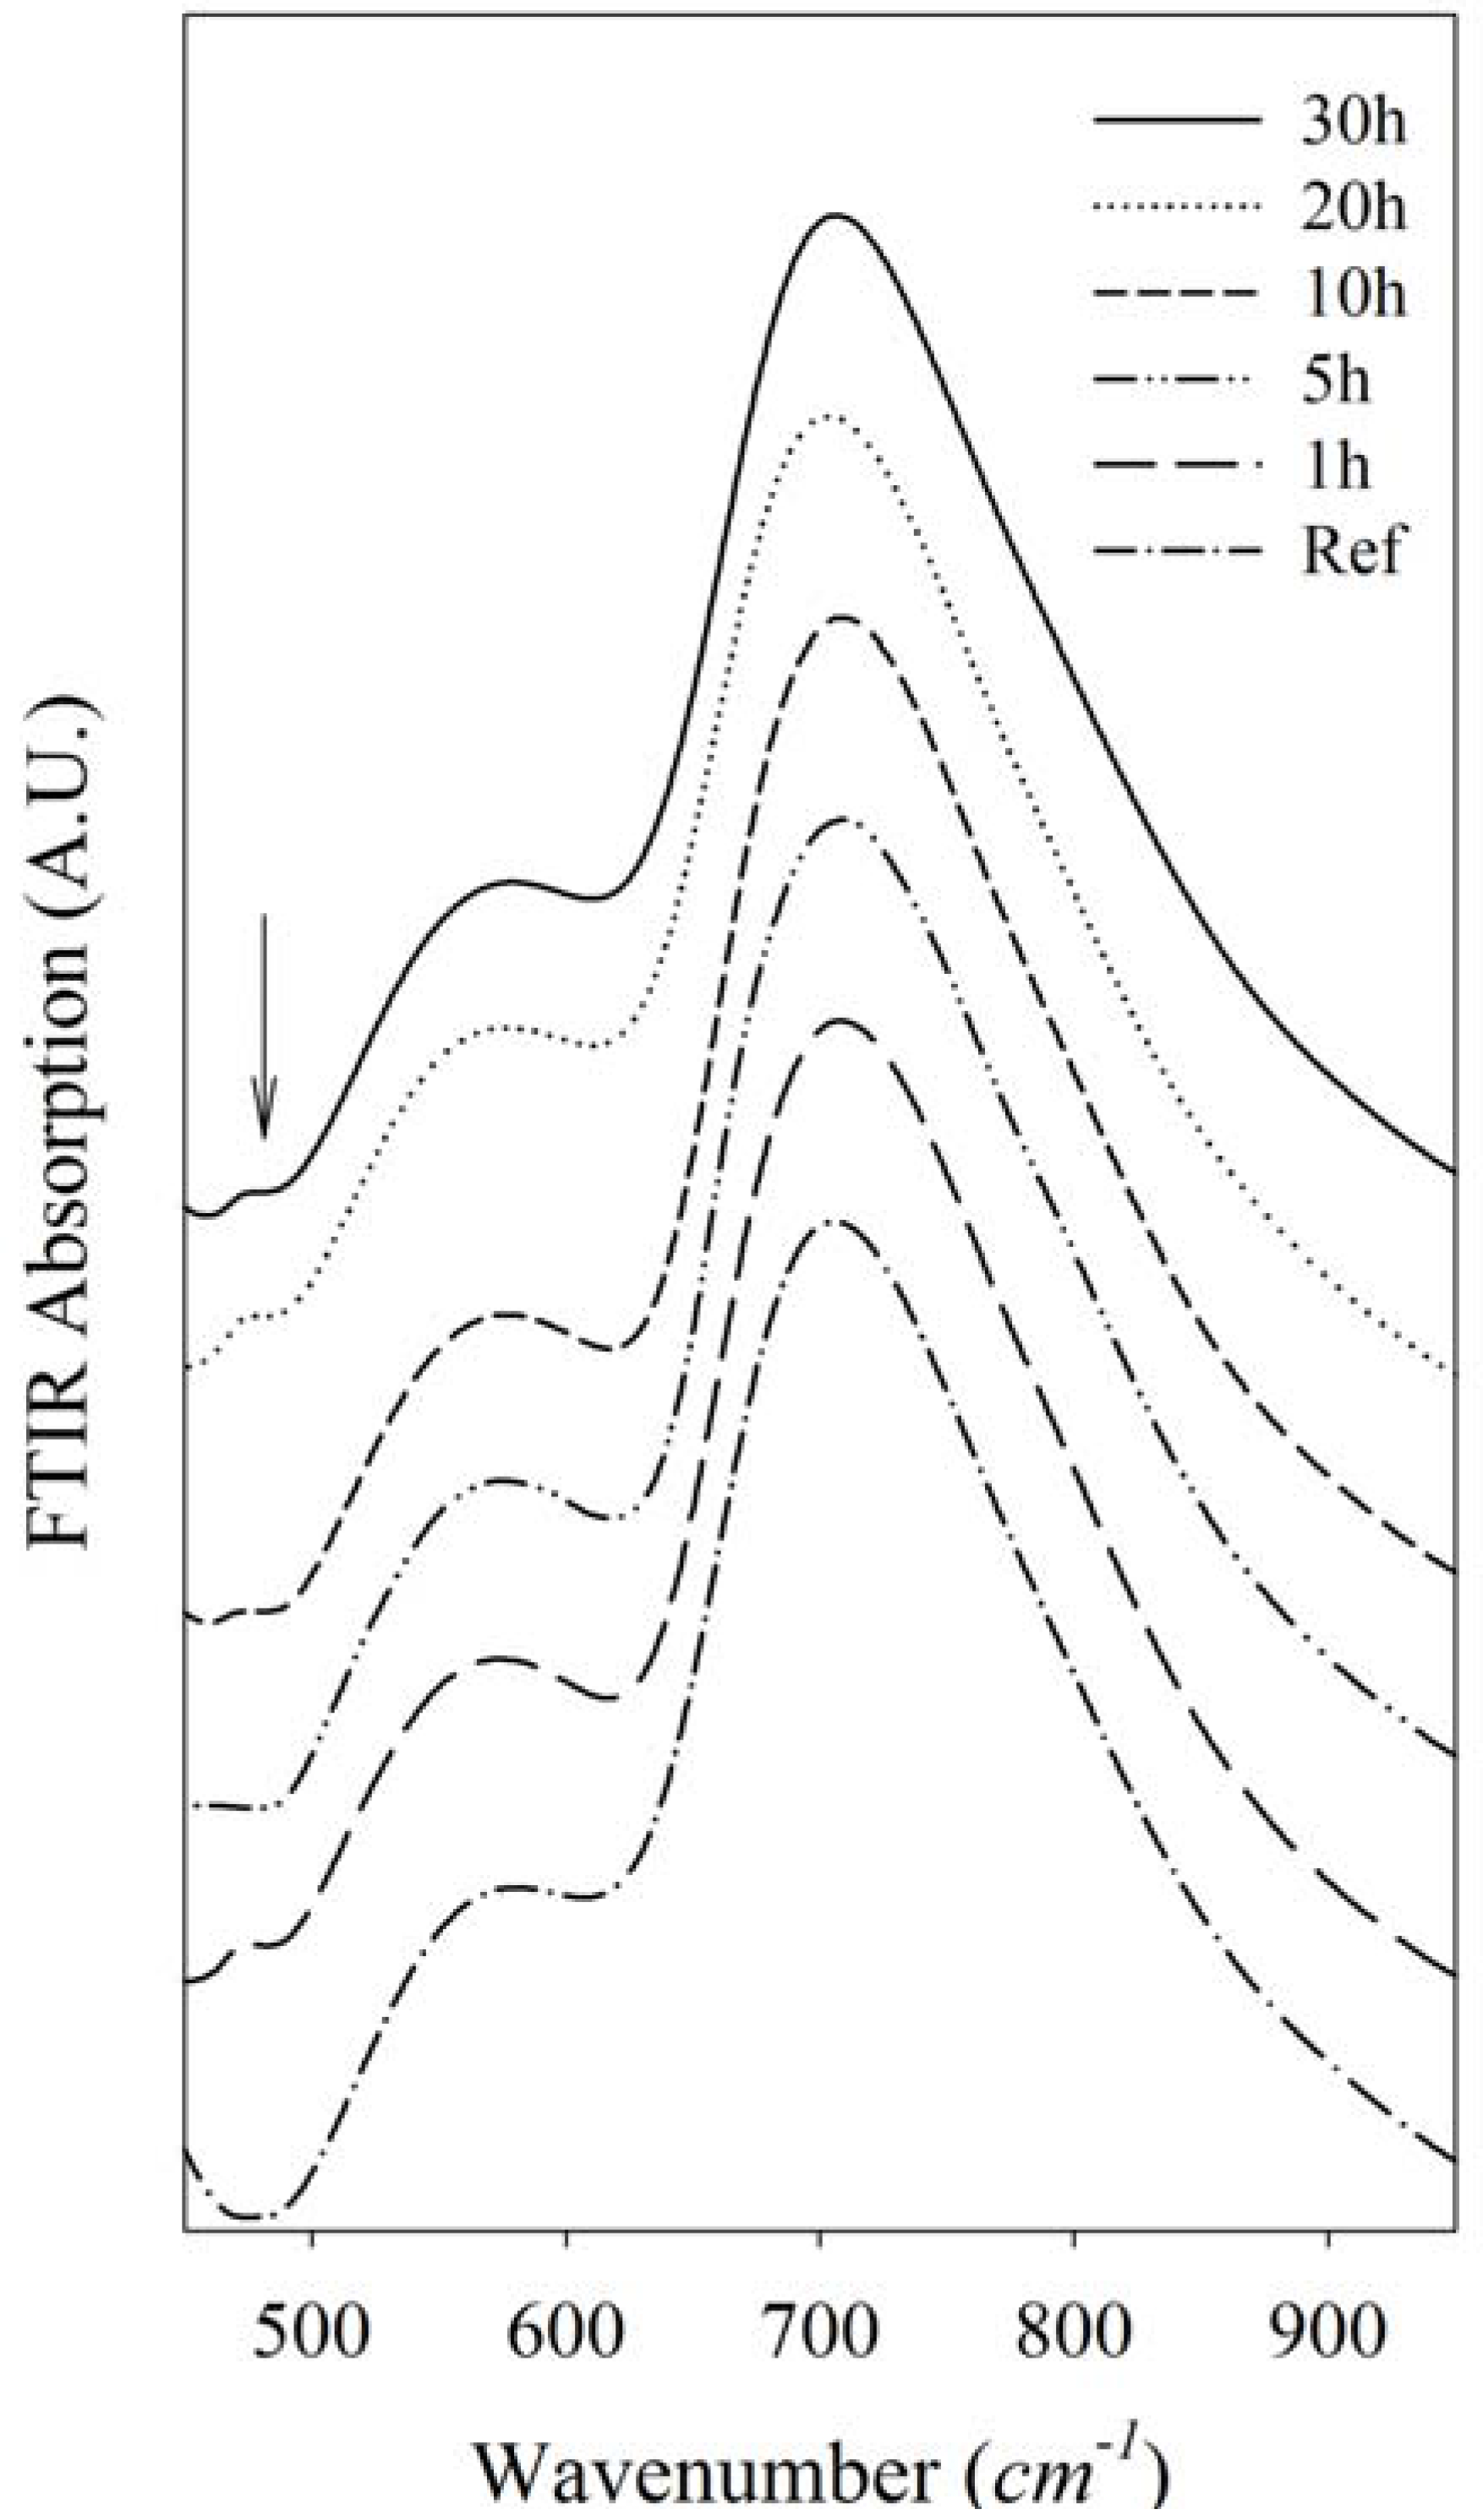
The FTIR absorption spectra of silver nanoparticles actively doped in heavy metal oxide germanate glasses is shown in
Figure 7. A wide and intense band at 650–850 cm
–1 is deconvulated into two peaks at 710 and 770 cm
–1. These peaks are related to the stretching vibration mode of Ge-O-Ge bonds in GeO
6 octahedral units [
11] and antisymmetric stretching vibrations of Ge-O-Ge bonds in GeO
4 tetrahedral units [
12], respectively. This shows the existence of both of four- and six-coordination. The absorption at 500–600 cm
–1 is attributed to the antisymmetrical bending vibration of a Pb-O-Pb chain [
13] and also related to bending, and the symmetric stretching vibration of Ge-O-Ge in the GeO
4 tetrahedral unit [
12]. The weak peak observed at 470 cm
–1 is related to the symmetrical bending vibration of Pb-O in a PbO
4 tetragonal pyramid [
14]. In the germanate-lead oxide system lead ions have a modifier role at low PbO content, but participate in the glass network as PbO chains at higher compositions [
15]. The peak in 470 cm
–1 is related to a PbO covalent bond which is formed when Pb acts the former role in the glass matrix. This peak was not observed in a reference sample, which means that the Pb-O chains did not originally exist in the glass and form in the glass matrix because of the applied heat treatment.
Figure 7.
FTIR spectra of Ag-NP doped Er3+/Yb3+ active GeO2-PbO glass. The arrow in the picture shows the weak peak related to a PbO covalent band that arises after the annealing process.
Figure 7.
FTIR spectra of Ag-NP doped Er3+/Yb3+ active GeO2-PbO glass. The arrow in the picture shows the weak peak related to a PbO covalent band that arises after the annealing process.
2.6. XPS
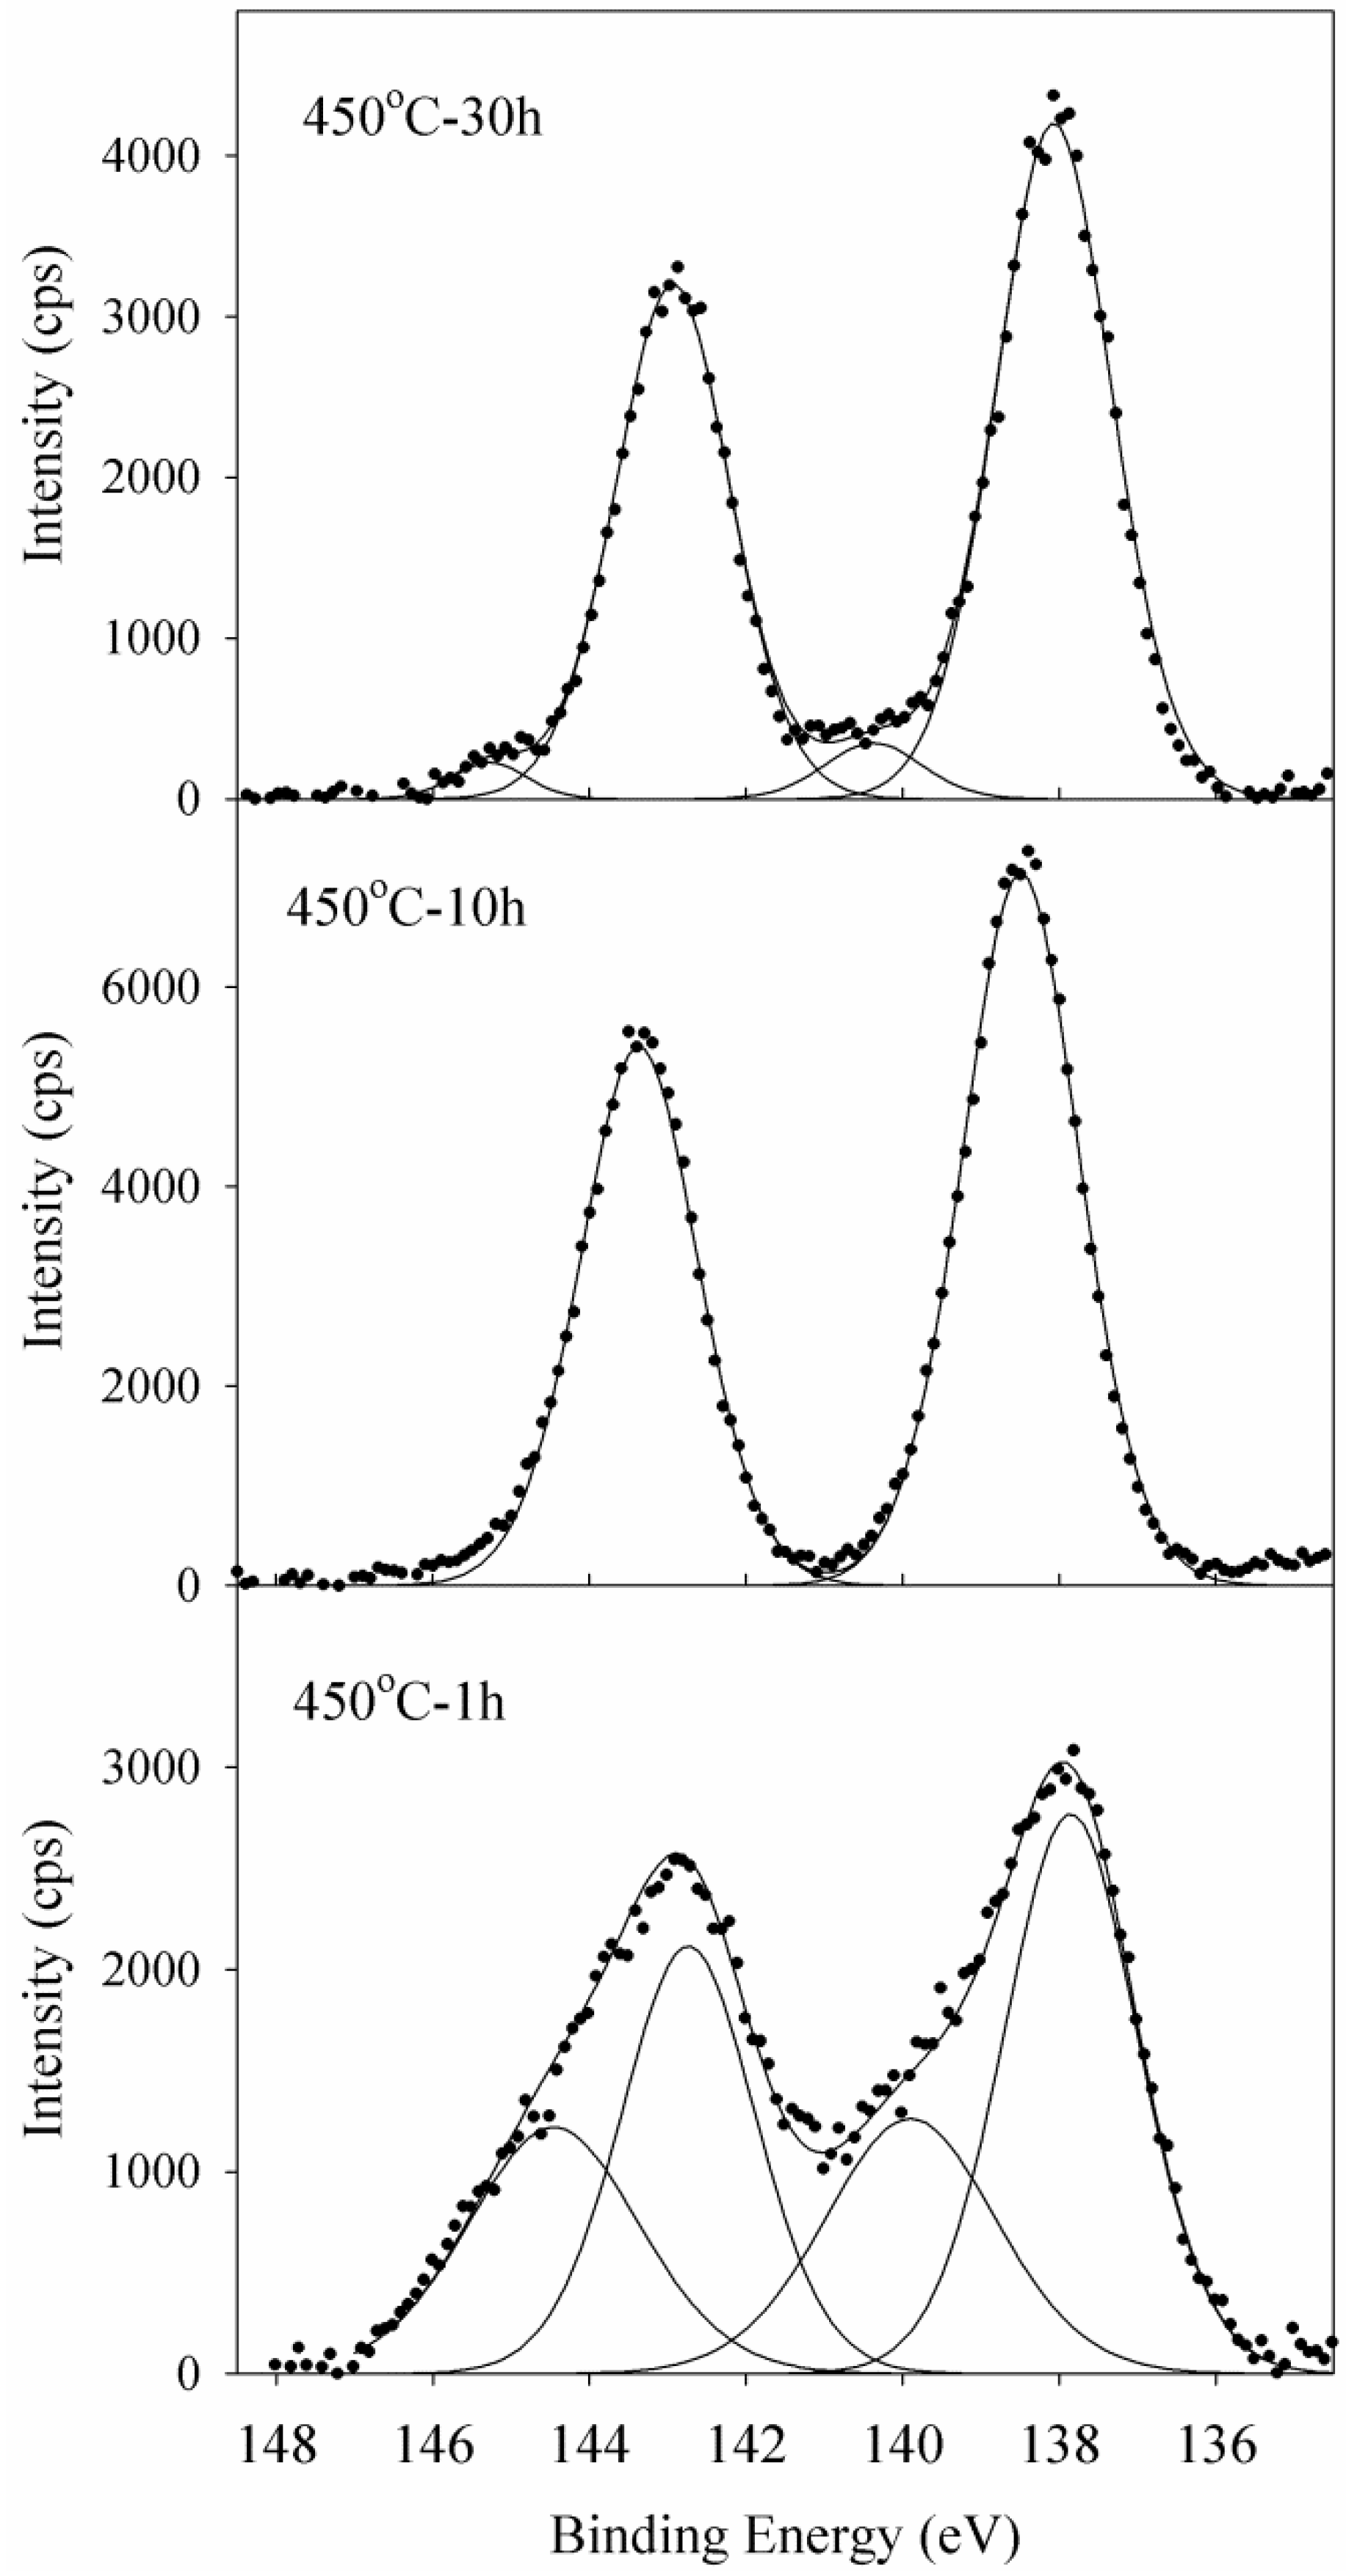
X-ray photoelectron spectroscopy was used as a powerful technique to study the chemical surrounding of Pb atoms and their role in the glass network. XPS collective spectra of Pb 4f
5/2 and Pb 4f
7/2 spin-orbit doublet of selective lead oxide germanate glasses actively doped with silver nanoparticles are shown in
Figure 8. Binding energy of Pb 4f
5/2 and Pb 4f
7/2 in all selected samples are about 143.0 and 138.1 eV, respectively. These binding energies are in good agreement with data previously reported for PbO [
16]. Two Pb 4f peaks of the sample annealed for 10 h are symmetric and are fitted with two single Gaussian-Lorentzian curves. The other samples show a clear asymmetry in their Pb 4f
5/2 and Pb 4f
7/2 spectra and are deconvoluted into two peaks for each spin-orbit doublet (the sample annealed for 1 hour shows more asymmetric behavior). The appearance of these new peaks at quite higher binding energies (144.8 and 140.1 for Pb 4f
5/2 and Pb 4f
7/2 respectively) is related to the existence of a new chemical state due to a change in the Pb-O bonding nature from covalent to ionic form [
17]. A change in the role of cation from former to modifier is typically associated with the formation of an ionic bond with a transfer of electrons from the cations to neighboring oxygens. Owing to the inverse relation of binding energy to local electron density at the site of atoms, the appearance of new peaks at higher energies in samples annealed for 1 and 30 h, are due to the formation of Pb-O ionic bonds and the modifier role of lead in the glass network. In addition, the sample annealed for 10 h shows higher intensities of both Pb 4f peaks relative to other samples. This reveals a more covalent nature of the Pb-O bond in this sample in comparison with the others, because of higher average Pb electron density. The XPS results clearly show that ionic Pb-O bonding that appeared in the glass network during 1 hour of annealing, is transformed into covalent Pb-O chains after heat treatment for 10 h. Some Pb-O chains then, are broken into ionic bonds after 30 h of heat treatment, but to a lesser extent than the sample exposed to 1 hour of annealing duration.
Figure 8.
Experimental XPS spectra of Pb 4f transition and the deconvoluted curves of Ag-NP doped Er3+/Yb3+ active GeO2-PbO glass annealed for 1, 10, and 30 h from bottom to top.
Figure 8.
Experimental XPS spectra of Pb 4f transition and the deconvoluted curves of Ag-NP doped Er3+/Yb3+ active GeO2-PbO glass annealed for 1, 10, and 30 h from bottom to top.
3. Discussion
One of the most well-known modifiers in glass science, silver, dissolves in the glass matrix in ionic form (Ag
+) when the melt of glass forming material cools down rapidly to form a rigid glassy specimen [
13]. These ions can be reduced automatically by heat treatment because the reduction potential (E
0) of the Ag
+/Ag
0 redox system is positive (E
0 = 0.8 mV) [
1]. During the annealing process, the thermally reduced silver atoms collect with each other to form nanoparticle seeds. Continued exposure of the samples at 450 °C leads not only to the seeding process, but also to the growth of nanoparticles based on the existing seeds from additional reduced silver atoms [
6]. When the glass is annealed for just one hour and cooled down slowly in the furnace, the silver atoms do not have enough time to create a large number of seeds, but the growth process still persists even during cooling down to create larger particles. Moreover, our FTIR results showed that Pb acts as a modifier of the glass network before the annealing process took place. According to the XPS data, 1 hour of heat treatment causes the formation of Pb-O ionic bonds and opens the glass network, so silver atoms can move more freely in a glass with an open structure to form more random nanostructures. This is in reasonable agreement with the UV-visible absorption spectra and TEM images. The weak and uniformly wide SPR absorption of the sample annealed for one hour illustrates perfectly the smaller number of particles of various sizes and shapes. The large, uncompressed, basil-like nanostructures observed in the TEM images are well matched with previous results and hence support this evocative mechanism.
Based on the XPS and FTIR data, the Pb-O chains form to recover the glass network during the annealing process. An increase of the duration of annealing causes silver atoms to form more nanoparticle seeds in an environment that is tightened by the formation of Pb-O chains. This leads to the formation of several small nanoparticles which are capped by the glass network to control the NPs’ size. Holding the samples at 450 °C for a longer annealing time causes an increase in the number of nanoparticles with almost the same size, but the highest annealing duration results in aggregation of small NPs to form slightly larger nanoparticles. This mechanism can describe the increase of SPR absorption by increasing of annealing time which indicates an increase in the number of nanoparticles. Slightly larger particles observed in the sample annealed for 30 h may lead to a slight red-shift of the SPR peak which may make the SPR band easy to observe, but it cannot be certainly proven by its absorption spectrum. Enhancement of the seeding process in a tight amorphous glassy environment by increasing of annealing time, results in uniformly distributed cultivation of small NPs embedded in the glass matrix. Holding the samples in 450 °C for 30 h not only enhances NP cultivation, but also gives the small nanoparticles the opportunity to aggregate into larger particles and breakdown the glassy network, which is confirmed by the photoelectron data.
4. Experimental Section
In order to study the silver NP-glass material, one set prepared by a melt and quenching method with different annealing processes. A sample with a composition of (GeO2)0.5(PbO)0.5 triply doped with 0.5, 1.5, 1 wt% of Er2O3, Yb2O3 and AgNO3, respectively, was prepared by the melt and quenching method. The sample was divided into several pieces that were separately annealed in 450 °C for 1, 5, 10, 20 and 30 h which is higher than glass transition temperature of this glass (435 °C), and cooled down inside the furnace to room temperature. Then, they were finely grounded for TEM, FTIR, EDX, XPS and UV-Vis absorption (reflection setup) characterization.
The glass samples’ crystallinity or amorphous nature was investigated by an X’Pert Pro PW 3040 MPD X-ray powder diffraction instrument (PANalytical B.V., Almelo, The Netherlands). The absorption spectrum was probed with an UV-3600, UV-VIS-NIR spectrometer (Shimadzu Scientific instrument Inc., Columbia, MD, USA) from 300 nm to 1,200 nm using a reflection setup. FTIR results were extracted from a Spectrum-100, FT-IR spectrometer (Perkin-Elmer Inc., Waltham, MA, USA) using a UATR accessory as the sampling method. The spectra were taken from 400 cm−1 to 1,000 cm−1 and deconvoluted into Gaussian component bands. Material compositions were probed by energy-dispersive x-ray spectroscopy. The EDX data were collected using a JSM-6400 electron scanning microscope (JEOL Ltd., Tokyo, Japan) working at an accelerating voltage of 20 kV. Morphological evaluation and measurement of size and size distribution was performed with an H-7100 Transmission Electron Microscope (Hitachi, Chula Vista, CA, USA) operating at an accelerating voltage of 120 kV. For TEM experiments the powder sample was dissolved in isopropyl alcohol and a drop of the solution was deposited onto carbon coated copper grids and left to air dry for one day at ambient temperature. The photoelectron and binding energies study was performed using an AXIS-Ultra XPS instrument (Kratos Analytical Ltd., Manchester, UK). The glass samples were measured in an ultra-high vacuum chamber (4.5 × 10⁻¹⁰ Torr) and using a monochromatic Al Kα X-ray source. The binding energy data were calibrated by referencing the main peak of C 1s peak to 284.6 eV.
5. Conclusions
Matrix adjustment thermal reduction fabrication method was introduced as a cheap, easy and swift technique to fabricate various silver nanostructures in GeO2-PbO glass matrices. Annealing the glass sample for one hour provided a loose environment to thermally reduce the Ag+ ions to form basil-like nanostructures with a mean length of 54 nm and mean width of 13 nm according to TEM images. Pb-O chains didn’t appear in the FTIR results for the glass before annealing, but arose in annealed samples. Also, Pb-O ionic bonds appear in the XPS spectrum of the Pb 4f transition for sample annealed for a short time and disappear in the samples exposed to longer annealing. This provides an open environment for fractal nanostructure formation after a short time of annealing. Longer annealing times resulted in formation of 3–4 nm size nanoparticles in a tight glass network that acted as a capping agent. The SPR band of NP silver showed higher values in the extinction spectra against the increase in annealing time, which reveals the formation of more Ag nanoparticles. Holding the glass specimen at 450 °C for 30 h caused aggregation of smaller NPs to form larger but deformed nanoparticles and some loosening in the glass network which was confirmed by the appearance of Pb-O ionic bonds in the XPS data.


