Article

Modeling Dynamics of Diffusion Across Heterogeneous Social Networks: News Diffusion in Social Media

1
Research School of Computer Science, The Australian National University, ACT 0200, Australia
2
CSIRO Centre for Complex Systems Science, CSIRO Marine and Atmospheric Research, The Commonwealth Scientific and Industrial Research Organisation (CSIRO), ACT 2600, Australia
*
Author to whom correspondence should be addressed.
Entropy 2013, 15(10), 4215-4242; https://doi.org/10.3390/e15104215
Submission received: 29 August 2013 / Revised: 13 September 2013 / Accepted: 17 September 2013 / Published: 8 October 2013
(This article belongs to the Special Issue Social Networks and Information Diffusion)

Abstract

:
Diverse online social networks are becoming increasingly interconnected by sharing information. Accordingly, emergent macro-level phenomena have been observed, such as the synchronous spread of information across different types of social media. Attempting to analyze the emergent global behavior is impossible from the examination of a single social platform, and dynamic influences between different social networks are not negligible. Furthermore, the underlying structural property of networks is important, as it drives the diffusion process in a stochastic way. In this paper, we propose a macro-level diffusion model with a probabilistic approach by combining both the heterogeneity and structural connectivity of social networks. As real-world phenomena, we explore instances of news diffusion across different social media platforms from a dataset that contains over 386 million web documents covering a one-month period in early 2011. We find that influence between different media types is varied by the context of information. News media are the most influential in the arts and economy categories, while social networking sites (SNS) and blog media are in the politics and culture categories, respectively. Furthermore, controversial topics, such as political protests and multiculturalism failure, tend to spread concurrently across social media, while entertainment topics, such as film releases and celebrities, are more likely driven by interactions within single social platforms. We expect that the proposed model applies to a wider class of diffusion phenomena in diverse fields and that it provides a way of interpreting the dynamics of diffusion in terms of the strength and directionality of influences among populations.

1. Introduction

User-generated content is both locally and globally interconnected across different types of social media by explicit connections (such as hyperlinks [1,2,3,4]) and/or implicit links between content (such as shared quotes [5] and similar keywords [6,7]). The emergent connectivity of diverse social media is governed by diffusion mechanisms, and the reach of the connections possibly ranges from a single social platform, such as Twitter [8,9,10,11] or the blogosphere [4,6,7], to multiple different kinds of social networks [1,2,3,5].
Document Linkage and Diffusion Space: In this study, we focus on hyperlinks or written URLs in the main text of web documents as explicit spreading behaviors, i.e., indicating references and common behaviors across different types of social media. Such connections enable us to trace document linkages and the content of reference documents. However, these explicit citations do not tell us the original information source of the reference documents. For instance, social media users can be exposed to information by their online friends first and, then, exposed to mainstream news, but they cite to mainstream news articles, not their friends, and vice versa. We consider social media, as a diffusion space, to include news, social networking sites (SNS) and blog media and not limited to single social platforms, such as Twitter, Facebook and LiveJournal. Such a diffusion space provides us with an opportunity to study the emergent diffusion mechanisms on the local and global scale.
Diffusion Process: The diffusion of information is commonly viewed to have two distinct phases: (1) the emergence of information by external influence, such as mass media (e.g., the triangles in Figure 1(a)); and (2) the cascading spread of the information through internal influence, such as interpersonal communications (e.g., the edges in Figure 1(a)) [5,10,12,13,14,15]. Previous studies have mostly focused on diffusion within single social platforms. However, for a better understanding of information diffusion, it is necessary to consider the effects of interactions between different social networks and media types. In this study, we ask the question “if we do not limit a diffusion space to a single social platform (e.g., the squares in Figure 1(a)), but extend it to interconnected social media, such as news, SNS and blog, then how would this affect the diffusion process?” This research question is an attempt to reveal the underlying mechanisms of diffusion across heterogeneous social networks, which requires the resolving of the following main challenges.
Main Challenges and Approaches: First, it is hard to define external and internal influences in interconnected heterogeneous social networks when we collapse the boundaries of social media platforms. Second, the network structure of diverse social networks is hard to obtain, due to privacy issues, various communication channels (e.g., news feeds, mobile applications and web search) and lively changing relations between online users. Third, global diffusion necessarily includes different types of populations, which requires the consideration of meta-population schemes [16]. That is, the way of classifying social networks gives a different interpretation of the dynamics of diffusion across heterogeneous social networks. Finally, diffusion patterns are varied by the context of information [1,10,11].
To address these challenges, we propose a new conceptual framework for diffusion across heterogeneous social networks (dynamic influence), as shown in Figure 1(b), where influences by contact networks (internal influence) are again separated from confounding factors (external influence) [10,17]. Based on this conceptual design, we model macro-level diffusion with a probabilistic approach that incorporates the heterogeneity and structural connectivity of networks into the simple and robust mass-action Bass Model [12,18]. Finally, as a working example, we focus on noteworthy real-world news by using Wikipedia Current Events [19], which covers representative topics of conventional news outlets.
Figure 1. The conceptual design for diffusion across heterogeneous social networks. (a) shows isolated single social platforms where the world is divided into inside and outside of each platform, i.e., dichotomous view, and (b) represents direct interactions between different types of social networks, as if they were in the same networks in a wider diffusion space than their original social networks (locally-isolated homogeneous social networks are merged into globally-interconnected heterogeneous social networks and, thus, external influences (red/dark triangles in (a)) are redefined as internal influences (gray/light triangles in (b)) by hidden interactions between different types of social networks (dashed lines in (b)) and external influences (red/dark triangles in (b)) from outside of the interconnected networks). (a) Isolated social networks (dichotomous view); (b) dynamic influence.
Entropy 15 04215 g001
Experimental Results: As real-world examples of diffusion phenomena, we take cases from news diffusion across news, SNS and blog media. In this regard, we investigate the ICWSM’11 Spinn3r dataset [20], which contains over 386 million web documents covering a one-month period in early 2011. We interpret the global spread of news in social media with categorical differences, namely, (1) politics, (2) business and economy, (3) technology and science, (4) disasters, (5) arts and culture, and (6) sports, by referring to news topics from Wikipedia Current Events. As a result, we find that influence between different media types is varied by the context of information, which leads to different diffusion patterns. For instance, news media are the most influential in the arts and the business and economy categories, while SNS and blog media are in the politics and the culture categories, respectively. Controversial topics, such as political protests in the Middle East and multiculturalism failure, tend to drive concurrent and synchronous diffusion across all social media types, while entertainment topics, such as film releases and celebrities, exhibit internal diffusion within single social platforms (homogeneous social networks). Such macro-level observations covering different types of social media, to the best of our knowledge, are seen for the first time.
Main Contributions: The main contributions of this paper are providing a new conceptual design for diffusion across heterogeneous social networks and, accordingly, modeling a macro-level diffusion by combining the two main features of real-world networks (heterogeneity and connectivity), which has not been studied in previous research. Our proposed model can improve the accuracy of diffusion models dealing with single social platforms alone, since it does not neglect the effects of interactions between different social networks on diffusion within homogeneous social networks. Finally, we provide a way of interpreting the dynamics of information diffusion in terms of the strength and directionality of the influences among meta-populations. We expect that the proposed model applies to a wider class of diffusion phenomena, such as diffusion across local communities/countries in the social sciences and marketing literature and functional brain networks (locally segregated, but globally integrated) in neuroscience.
The remainder of the paper is structured as follows. Section 2 provides the background and context of this paper. By reviewing relevant recent work, Section 3 explains a conceptual structure for diffusion across heterogeneous social networks, and accordingly, Section 4 and Section 5 describe the macro-level diffusion model reflecting the dynamic influences across meta-populations and the dataset used in our experimental study, respectively. Section 6 presents experimental results and their main findings, and Section 7 discusses the limitations and insights of this study. Finally, Section 8 concludes the paper with an outlook toward future research.

2. Related Work

News Media as Online Social Networks: Traditionally, mass media has been regarded as external and offline out-of-network sources, such as radio, TV and newspapers [21]. However, today, mass media is moving from offline into the web ecosystem, which provides researchers with the benefit of quantifying the effect of external influence at a more accurate level than before [10]. Moreover, online news media today have formed their own networks by referring to relevant news articles of collaborative news media owned by the same company or other competitive news media for more reliable and prompt reports [3]. This enables them to be frequently exposed and connected to other types of online social networks, such as SNS and blog. In this study, we consider news media as online social networks, rather than separate and independent information sources.
Bass Model as Fundamental Framework: In the early 1960s, adopting behaviors were classified in the social sciences into five categories in terms of the timing of adoption, such as innovators, early adopters, early majority, late majority and laggards [22]. In the marketing literature, this idea was mathematically represented with a conditional likelihood of adoption by the Bass Model [18]. This model consists of likelihoods of “innovation” and “imitation”, which correspond to external and internal influence, respectively. It has provided realistic and robust estimation of new product growth patterns, and thus, it has been one of the influential diffusion models across diverse areas, such as marketing, computer science, economics and operations research [12,14,15,23,24,25]. Its fundamental assumption is that a population is homogeneous and fully connected in the same way as traditional macro-level diffusion models [15,18,26,27]. This simplicity has enabled intuitive interpretation and has led to a wide range of extensions of the model [12].
Heterogeneity and Structures of Social Networks: Regarding heterogeneity of social networks, one extension of the Bass Model allows mixed populations, such as multinational diffusion of a product. For example, the adoption rate of a consumer product in one country indirectly influences that in another country [14,28]. However, this extension disregards the effect of network topologies on diffusion. The authors of [29] integrated different layers of single social networks into a weighted composite network scheme, such as Bluetooth proximity networks, call log networks, affiliation networks and friendship networks, for 55 university students. They focused on homogeneous social networks represented by multi-layered networks with different levels of importance, but our study covers heterogeneous social networks with intra- and inter-network interactions.
In terms of network structures, there has been interest in the effect of network topologies on the diffusion, such as cluster density and reachability [30,31], and degree distributions [15]. The authors of [15] incorporated degree distributions into the Bass Model, but their assumption of a linear influence of the number of neighboring adopters does not guarantee the probabilistic constraint. Details are discussed in Section 4.2.3. All these studies are still limited to single social networks. The authors of [2] inferred hidden directed networks of real diffusion based on the maximum directed spanning tree of a graph, which requires at least information about weighted network structures. However, it is not only hard to obtain network structures for whole heterogeneous populations, but the structures are also dynamically changing. Our study aims at inferring macro-level trends of influence flow across heterogeneous social networks without such micro-level topologies.
Context of Diffusion: Significant variations in diffusion patterns have been observed between different topics [10,11]. For instance, diffusion of political issues is considerably driven by external influence, while entertainment topics spread through internal communications [10]. The authors of [11] showed that political topics are relatively persistent compared to non-controversial subjects. However, these studies have focused on a single social platform, such as Twitter, so the dynamics of external and internal influences is limited to the local observations. Our study examines global diffusion across different types of social media with comprehensive topics using Wikipedia Current Events [19] and not limited to site-specific trending topics.

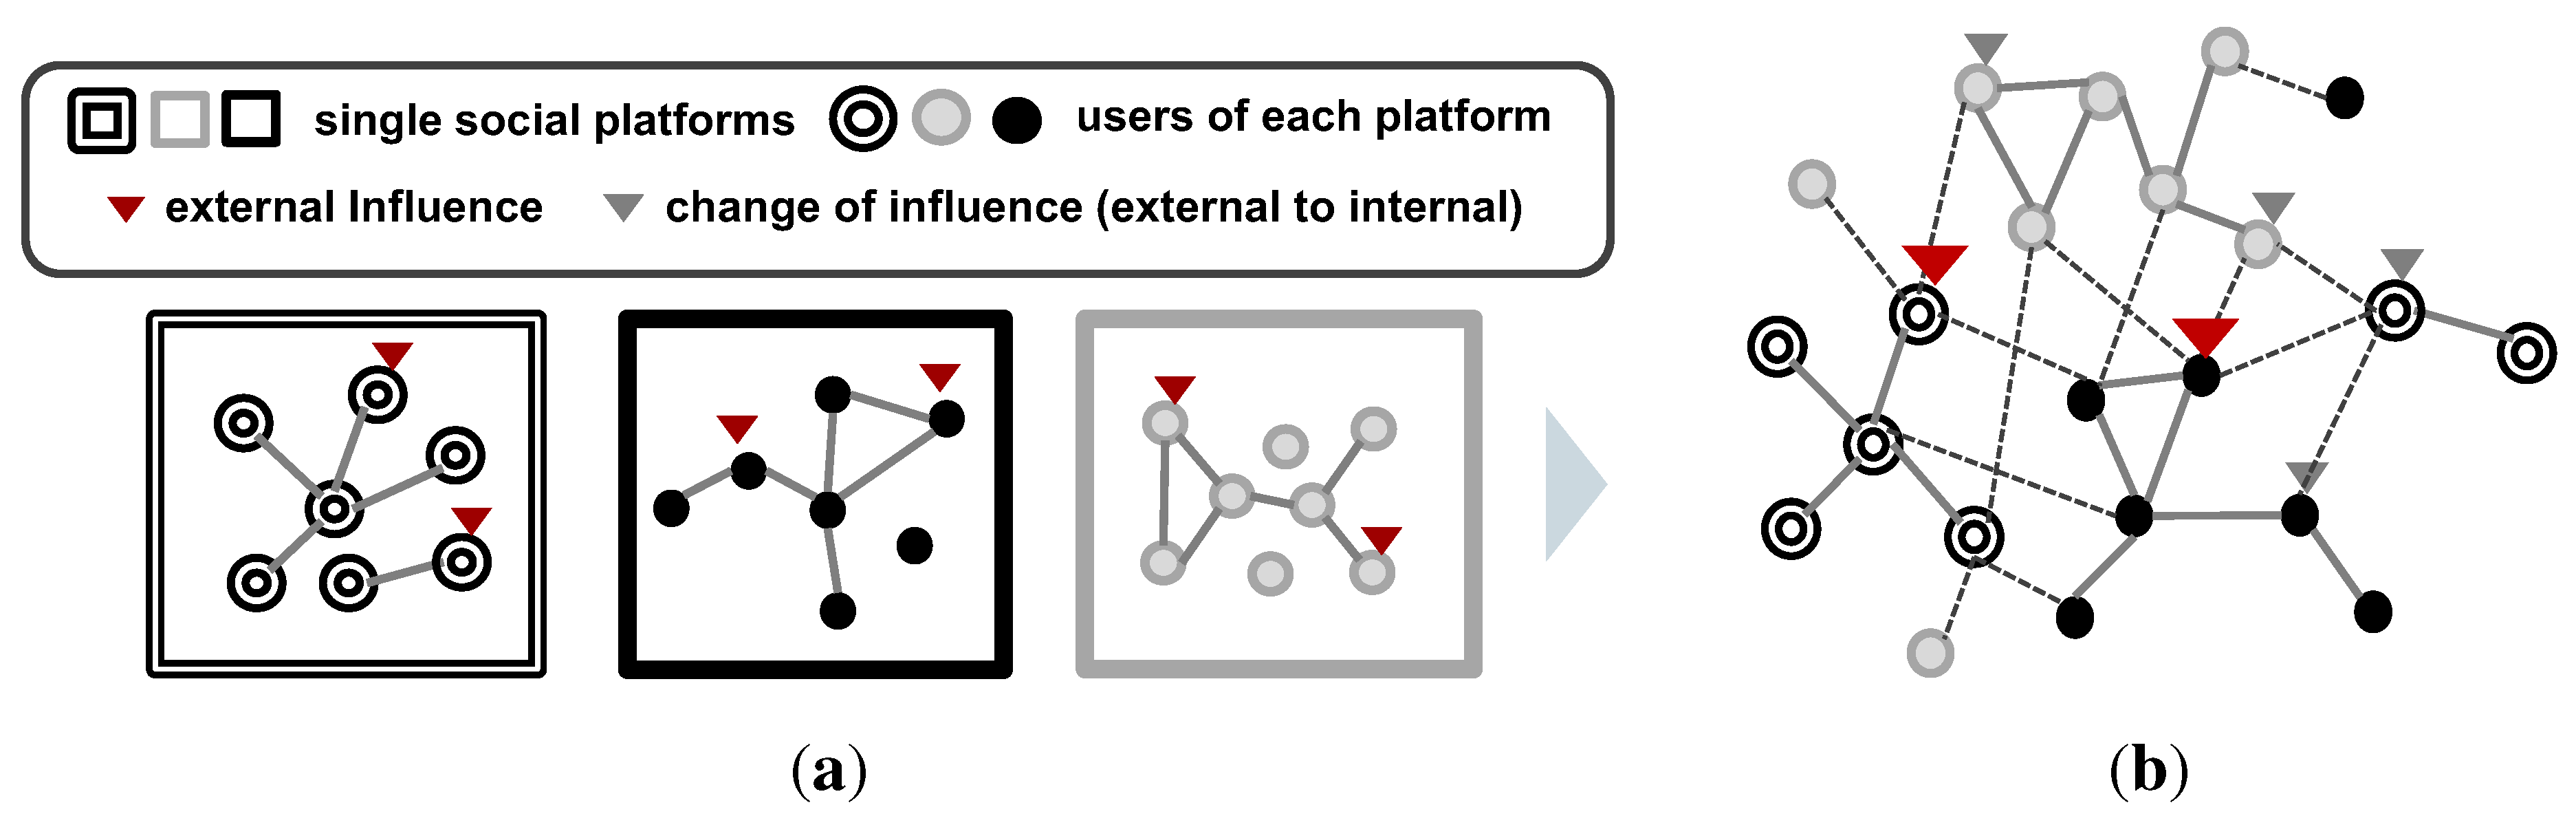
3. Conceptual Design for Diffusion across Heterogeneous Social Networks

Information diffusion across diverse populations makes it challenging to discover its underlying mechanisms, because of two fundamental issues: (1) hidden network structures and (2) the diversity of populations. For a better understanding of macro-level diffusion processes, we propose a new conceptual design for diffusion across heterogeneous social networks, as shown in Figure 1.
Dichotomous View: Figure 1(a) illustrates different types of isolated social networks. From the aspect of a single social platform, the world is divided into inside and outside of each platform, and thus, it does not distinguish the types of social networks outside. The external influence of a single social platform has recently been quantified by [10] as exogenous out-of-the-network effects. Interestingly, it was shown that almost 30% of diffusion regarding some trending topics in Twitter is attributed to external influence. This is ten-times larger than the typical value of external influence (0.03), and it is rather similar to the average value of internal influence (0.38) in the marketing literature [23]. Such a large proportion of out-of-the-network effects supports the fact that the influence outside of a single social platform is not ignorable. In addition, the authors of [32] pointed out that opinions are not always converged, but rather diverged, due to the persistence of minority and neutral groups, which exhibits other different levels of the heterogeneity of populations from the aspect of opinion formation. Thus, it is meaningful to consider the diversity of populations for a better understanding of diffusion with a bird’s eye view, away from the dichotomous view.
Dynamic Influence: We define a framework of dynamic influence in which different types of social networks directly interact with each other as if they were in the same networks, as shown in Figure 1(b). Due to the collapse of the diffusion boundaries of single social platforms, external influences in original social platforms (red/dark triangles in Figure 1(a)) are redefined as internal influences (gray/light triangles in Figure 1(b)) between different types of individuals through their hidden interactions (dashed lines in Figure 1(b)) and external influences (red/dark triangles in Figure 1(b)) from outside of the interconnected heterogeneous social networks. This framework interprets influence between different types of social networks as direct and simultaneous effects on diffusion.
In real-world situations, more and more users come across various types of news content through multiple social networks with the help of web technologies, such as RSS news feeds, social media aggregators (e.g., Meople, HootSuite and Flipboard) and miscellaneous mobile applications, without the need to jump from one to another. This enables users to obtain information from their preferred media sources (e.g., Facebook friends, Google news and journals in Blogspot) in a direct way, not dependent on exposures to information brought by their own contact networks. Such technological environments can be one of the important factors that make diverse online social networks interconnected rather than separated.

4. Proposed Model

In this section, we propose a macro-level diffusion model reflecting the dynamics of heterogeneous social networks as discussed in the previous section. We first describe the Bass Model as a fundamental framework and, then, propose our Dynamic Influence Model.

4.1. Fundamental Framework: Bass Model

Let A ( t ) be the number of cumulative adopters at time t and a ( t ) (= d A ( t ) / d t ) be the number of new adopters, given the n whole population. Accordingly, we denote the proportion of the cumulative adopters by F ( t ) = A ( t ) / n and the proportion of new adopters by f ( t ) = d F ( t ) / d t = a ( t ) / n . Then, the ratio of new adopters to potential adopters at time t is called the hazard function, h ( t ) , in the Bass Model [18]:
h ( t ) = a ( t ) n - A ( t ) = f ( t ) 1 - F ( t )
The Bass Model assumes the hazard function to be a linear form of the proportion of the cumulative adopters [12,18]:
f ( t ) 1 - F ( t ) = p + q F ( t )
The parameter, p, is called the coefficient of innovation, since it does not interact with the cumulative adopter proportion, F ( t ) , and q is called the coefficient of imitation, because it represents the internal influence of previous adopters [12]. Equation (2) has a closed form solution:
F ( t ) = 1 - e - ( p + q ) t 1 + q p e - ( p + q ) t
As Equation (2) shows, the Bass Model assumes a homogeneous and completely connected population. We incorporate the heterogeneity and structural property of real-world networks into the simple and robust mass-action Bass Model at a macro level. This improves the accuracy of diffusion models dealing with either single social networks or heterogeneous, but unstructured populations.

4.2. Dynamic Influence Model

We now formally describe the problem and extend the Bass Model in a probabilistic way.

4.2.1. Problem Statement

In reality, the network structure of diverse social networks is hidden, but dynamic influences among different networks are not ignorable. Thus, the goal is to infer the macro-level diffusion processes within and between different populations in a probabilistic way without the need of detailed network structures, but with a real-world network property. In more detail, given the number of cumulative adopters for each of m populations at time t from one to T, { A i ( t ) } t = 1 T , i = 1 , . . . , m , we aim to infer the unobservable influence between populations, c i i , which denotes the probability that an individual of type i adopts when it is exposed to a previous adopter of type i . Particularly, we assume that the degree distribution of an individual follows a power law, since real-world networks exhibit power-law behavior in their degree distributions [27,33].

4.2.2. Model Formulation

For modeling diffusion across heterogeneous social networks, we begin by interpreting the Bass Model from a probabilistic point of view. The proportion of adopters in the Bass Model is in fact its expectation in the mean-field mass-action kinetics of the model, and thus, it can be thought of as an adoption probability that an average individual adopts at time t:
F ( t ) = P ( a d o p t t )
where a d o p t is a binary random variable for the event of an individual’s adoption, and it will be abbreviated to “a” in the rest of the paper for brevity. Similarly, we can view the hazard function as a new adoption probability, P ( a ¬ a , t ) :
f ( t ) 1 - F ( t ) = t P ( a t ) 1 - P ( a t ) = P ( a ¬ a , t )
where t denotes the partial derivative with respect to t and ¬ stands for the opposite. Therefore, P ( a ¬ a , t ) indicates the probability that an average individual, who has not adopted before, adopts at time t.
By separating external and internal influences and applying the probability of the union of two independent events, i.e., P ( A B ) = P ( A ) + P ( ¬ A ) P ( B ) , we get:
t P ( a | t ) 1 - P ( a | t ) = P ext ( a | ¬ a , t ) + ( 1 - P ext ( a | ¬ a , t ) ) P int ( a | ¬ a , t )
where P ext ( a | ¬ a , t ) and P int ( a | ¬ a , t ) denote the new adoption probabilities by external and internal influence, respectively.
Heterogeneity of Meta-Populations: To deal with the heterogeneity of populations, we introduce a random variable, i = 1 , . . . , m , for different types of m meta-populations and, thus, construct m different equations of new adoption probabilities for each type as:
t P ( a | i , t ) 1 - P ( a | i , t ) = P ext ( a | ¬ a , i , t ) + ( 1 - P ext ( a | ¬ a , i , t ) ) P int ( a | ¬ a , i , t )
Like the coefficient of innovation in the Bass Model, we consider the new adoption probability by external influence as:
P ext ( a | ¬ a , i , t ) = p i
where p i [ 0 , 1 ] .
Structural Connectivity: Now, let us focus on the internal new adoption probability by considering the structural connectivity of contact networks. Suppose that an individual of type i has k neighbors in which j = ( j 1 , . . . , j m ) T neighbors of each individual type have already adopted. Then, from the sum and product rules, the internal new adoption probability is factorized by:
P int ( a | ¬ a , i , t ) = k = 1 n - 1 j P ( a , j , k | ¬ a , i , t ) = k = 1 n - 1 j P ( a | j , k , ¬ a , i , t ) P ( j | k , ¬ a , i , t ) P ( k | ¬ a , i , t )
where n = i = 1 m n i , and n i is the population size of type i.
The distribution of an individual’s exposures to previous adopters in its neighbors is modeled as a binomial distribution, which is consistent with prior diffusion models [10,15]. Thus, each contagion is a Bernoulli trial, and the probability that an individual adopts after j = ( j 1 , . . . , j m ) T contacts is:
p ( a | j , k , ¬ a , i , t ) = 1 - i = 1 m ( 1 - c i i ) j i
where c i i [ 0 , 1 ] denotes the probability that an individual of type i adopts when it is exposed to a previous adopter of type i . Note that it is the probability that an individual is affected by at least one of its adopting neighbors, i.e., one minus the probability of the complementary event that it is not affected by any of the previous adopters in its neighbors. Comparison between our Bernoulli influence model and the linear influence model of [15] will be discussed in Section 4.2.3.
From a macro point of view, the probability distribution of having j adopters in k neighbors is a multinomial distribution:
p ( j | k , ¬ a , i , t ) = k ! j 1 ! · · · j m ! ( k - j ) ! i = 1 m P ( a | i , t ) j i ( 1 - P ) k - j
where j = i = 1 m j i and P = i = 1 m P ( a | i , t ) .
Finally, we assume that the degree distribution of an individual follows a power law, since real-world networks are scale-free networks exhibiting power-law distributions [1,3,4,9,27,33]:
p ( k | ¬ a , i , t ) = 1 ζ ( α i ) k - α
where α is the power law coefficient, and ζ ( α ) = k = 1 n - 1 k - α .
Substituting Equations (10)–(12) into Equation (9) gives the internal new adoption probability:
P int ( a ¬ a , i , t ) = 1 - 1 ζ ( α ) k = 1 n - 1 1 - i = 1 m c i i P ( a | i , t ) k k α
Note that the neighboring adopters, j , in Equation (9) are marginalized out in Equation (13) by the multinomial theorem (see Appendix A for the details). Therefore, our macro-level diffusion model does not require micro-level information, such as local structures of contact networks.
Again, by substituting Equations (8) and (13) into Equation (7), we obtain the system of partial derivative equations for the Dynamic Influence Model. It is not mathematically tractable, and thus, we need to solve it numerically to get the adoption probabilities { P ( a i , t ) } i = 1 m .

4.2.3. Comparison of Influence Assumptions

Before finishing this subsection, it is worth comparing our Bernoulli influence model in Equation (10) with the linear influence model of [15]. The authors of [15] only considered diffusion in homogeneous networks, and thus, the corresponding linear influence model in heterogeneous networks would be:
p ( a | j , k , ¬ a , i , t ) = i = 1 m c i i j i
where c i i 0 is the influence coefficient that an adopter in the neighbors of type i affects an individual of type i. Note that the influence increases linearly with the number of previous adopters in its neighbors.
Technically, it is not a probability distribution, because with fixed { c i i } i = 1 m , it is possible that p ( a | j , k , ¬ a , i , t ) > 1 , if an individual has many adopters in its neighbors. Therefore, it is not an appropriate assumption for a probabilistic model. The benefit of the linear influence model is that it helps simplify the internal new adoption probability in Equation (9) as a linear form of the adoption probabilities:
P int ( a | ¬ a , i , t ) = ζ ( α - 1 ) ζ ( α ) i = 1 m c i i P ( a | i , t )
However, Equation (15) is just the first-order Taylor approximation of Equation (13), which is explained in Appendix B. Thus, the linear influence model is a linear approximation of our Bernoulli influence model when there exist no previous adopters ( i , P ( a | i , t ) = 0 x = 1 ) . Therefore, our Bernoulli influence model is more sophisticated than the linear influence model, and because it is based on a probability distribution, it naturally guarantees the probability constraint, 0 p ( a | j , k , ¬ a , i , t ) 1 .
In this section, we modeled macro-level diffusion based on the conceptual design for diffusion across heterogeneous social networks, which is a generalization of the simple mass-action Bass Model into the dynamics of meta-populations in a probabilistic way by combining the two essential features, the heterogeneity and structural connectivity of social networks.

5. Preparation and Analysis of the Spinn3r Data Set

As real-world examples of diffusion phenomena, we explore instances of news diffusion across different types of social media. In this section, we first describe our dataset collection and preprocessing steps and examine their fundamental statistics.

5.1. Target Data Selection

Our analysis and observations are based on the ICWSM’11 dataset [20], which is freely available to research communities. This dataset consists of over 386 million blog posts, news articles, microblog content, classifieds and forum posts, covering a one-month period in early 2011 (13 January to 14 February). It was collected by Spinn3r, which is a licensed social media crawler. One document record contains information about a title, publication timestamp, written language and the full HTML body. Key fields of the dataset used for this study are described in Table 1.
Table 1. Used key fields of each document in the dataset.
FieldDescriptionMain Usage
TimePublication timeTo validate the direction of links from source to destination documents
LinkDocument URLTo obtain document identity and extract domain name and/or user identity from regular patterns
DescFull HTMLTo extract hyperlinks and written URLs in main text
LangWritten languageTo target English documents only
TypePublisher typeTo target documents of three media types (News, SNS, Blog)
Target Documents: We focus on analyzing news, SNS and blog articles (98.37% of the original dataset), since these are not only the most relevant to real-world news, but we can also observe dynamic interactions among representative types of social media. We extracted nearly 60 million English documents from the Spinn3r dataset of the three media types by filtering out duplicate documents (documents with the same URL and content) for their unique identity. Furthermore, by extracting hyperlinks or written URLs in their main contents, we discovered 4.1 million non-isolated documents that contain at least one hyperlink. In Figure 2, black squares illustrate the distribution of hyperlink cascade sizes for the extracted 60 million English documents, and it shows a heavy tailed distribution; the x-axis indicates the number of weakly connected documents from a single document (isolated due to no hyperlinks in its main content) to the largest connected documents, and the y-axis shows the frequency that the connected document size is equal to or greater than the value of x. The connected documents account for 6.9% of the original 60 million documents. Such a small percentage of connected documents tells us that the majority of documents have no citations and, thus, have no linkage to other documents. Note, however, that 6.9% is not a low percentage compared with the literature, where only 2% of 2.2 million blog posts are not isolated [4]. In fact, our higher percentage results from links between three different types of document sources (News, SNS and blog) based upon a wide range of content types of the ICWSM’11 dataset. Furthermore, to obtain the true identity of hyperlink destinations, we expanded all shortened URLs by extracting the original location from the HTTP header. After extracting all hyperlinks, we remove self-links and out-of-scope links that connect to documents outside of the dataset.
Figure 2. Hyperlink cascade distributions. Black squares indicate the complementary cumulative distribution of hyperlink cascade sizes for all 60 million English documents, while red circles are for documents created by the 6.4 million identified users in Table 2.
Entropy 15 04215 g002
User Identification: As discussed in Section 2, news media are considered as online social networks, and accordingly, one new site is regarded as a super user. Furthermore, an individual who has an account in an SNS or blog media platform is regarded as a user, but identifying individuals with more than one account is out of the scope of this study. In this paper, the term “user” indicates an entity of each media type who produces documents.
There is no universally valid user information, due to the diverse sources that the dataset draws from. In this regard, we chose five SNS and blog domains for each media type, as they are not only popular spaces for social networking and blogging, but we can also write regular patterns for extracting user identities from their produced document URLs. This method generates a significantly large set of users, and it is consistent with prior blog user extraction methods [1]. To identify news sites, we regard second-level domains (e.g., cnn.com, nytimes.com) from document URLs as unique identifiers of news sites when a document’s publisher type (in Table 1) is mainstream news. We extracted 9,225 news sites, which constitute the largest strongly connected network. This strong connection implies that each news site can reach every other news site, which provides news sites with more frequent chances to be connected with each other and, further, to be exposed to other types of social media, such as SNS and blog.
Table 2. Identified users in social media from 60 million English documents covering a one month period in early 2011 (an entity in each medium is considered as a user in this paper). SNS, social networking sites.
Media TypeDomainUser Count
NewsSecond level domains
(largest strongly connected network)
9,225
SNSfacebook.com4,560,800
myspace.com822,998
flickr.com25,613
twitter.com6,169
posterous.com1,876
Blogblogspot.com691,175
livejournal.com158,361
wordpress.com90,803
tumblr.com23,967
typepad.com7,603
Total6,398,590
As shown in Table 2, we eventually identified 6.4 million users in total from the targeted 60 million English documents. These identified users generated 57% (34 million) of the target documents, which are 41% (1.7 million) of non-isolated documents containing at least one hyperlink. In Figure 2, red circles describe the distribution of the number of connected documents that are produced by the identified users. As the figure illustrates, the majority of hyperlink cascades are attributed to the documents generated by the identified users. This means that major news, SNS and blog domains likely contribute to a wide diffusion in social media, and also, these identified users are meaningful for studying diffusion mechanisms in social media.

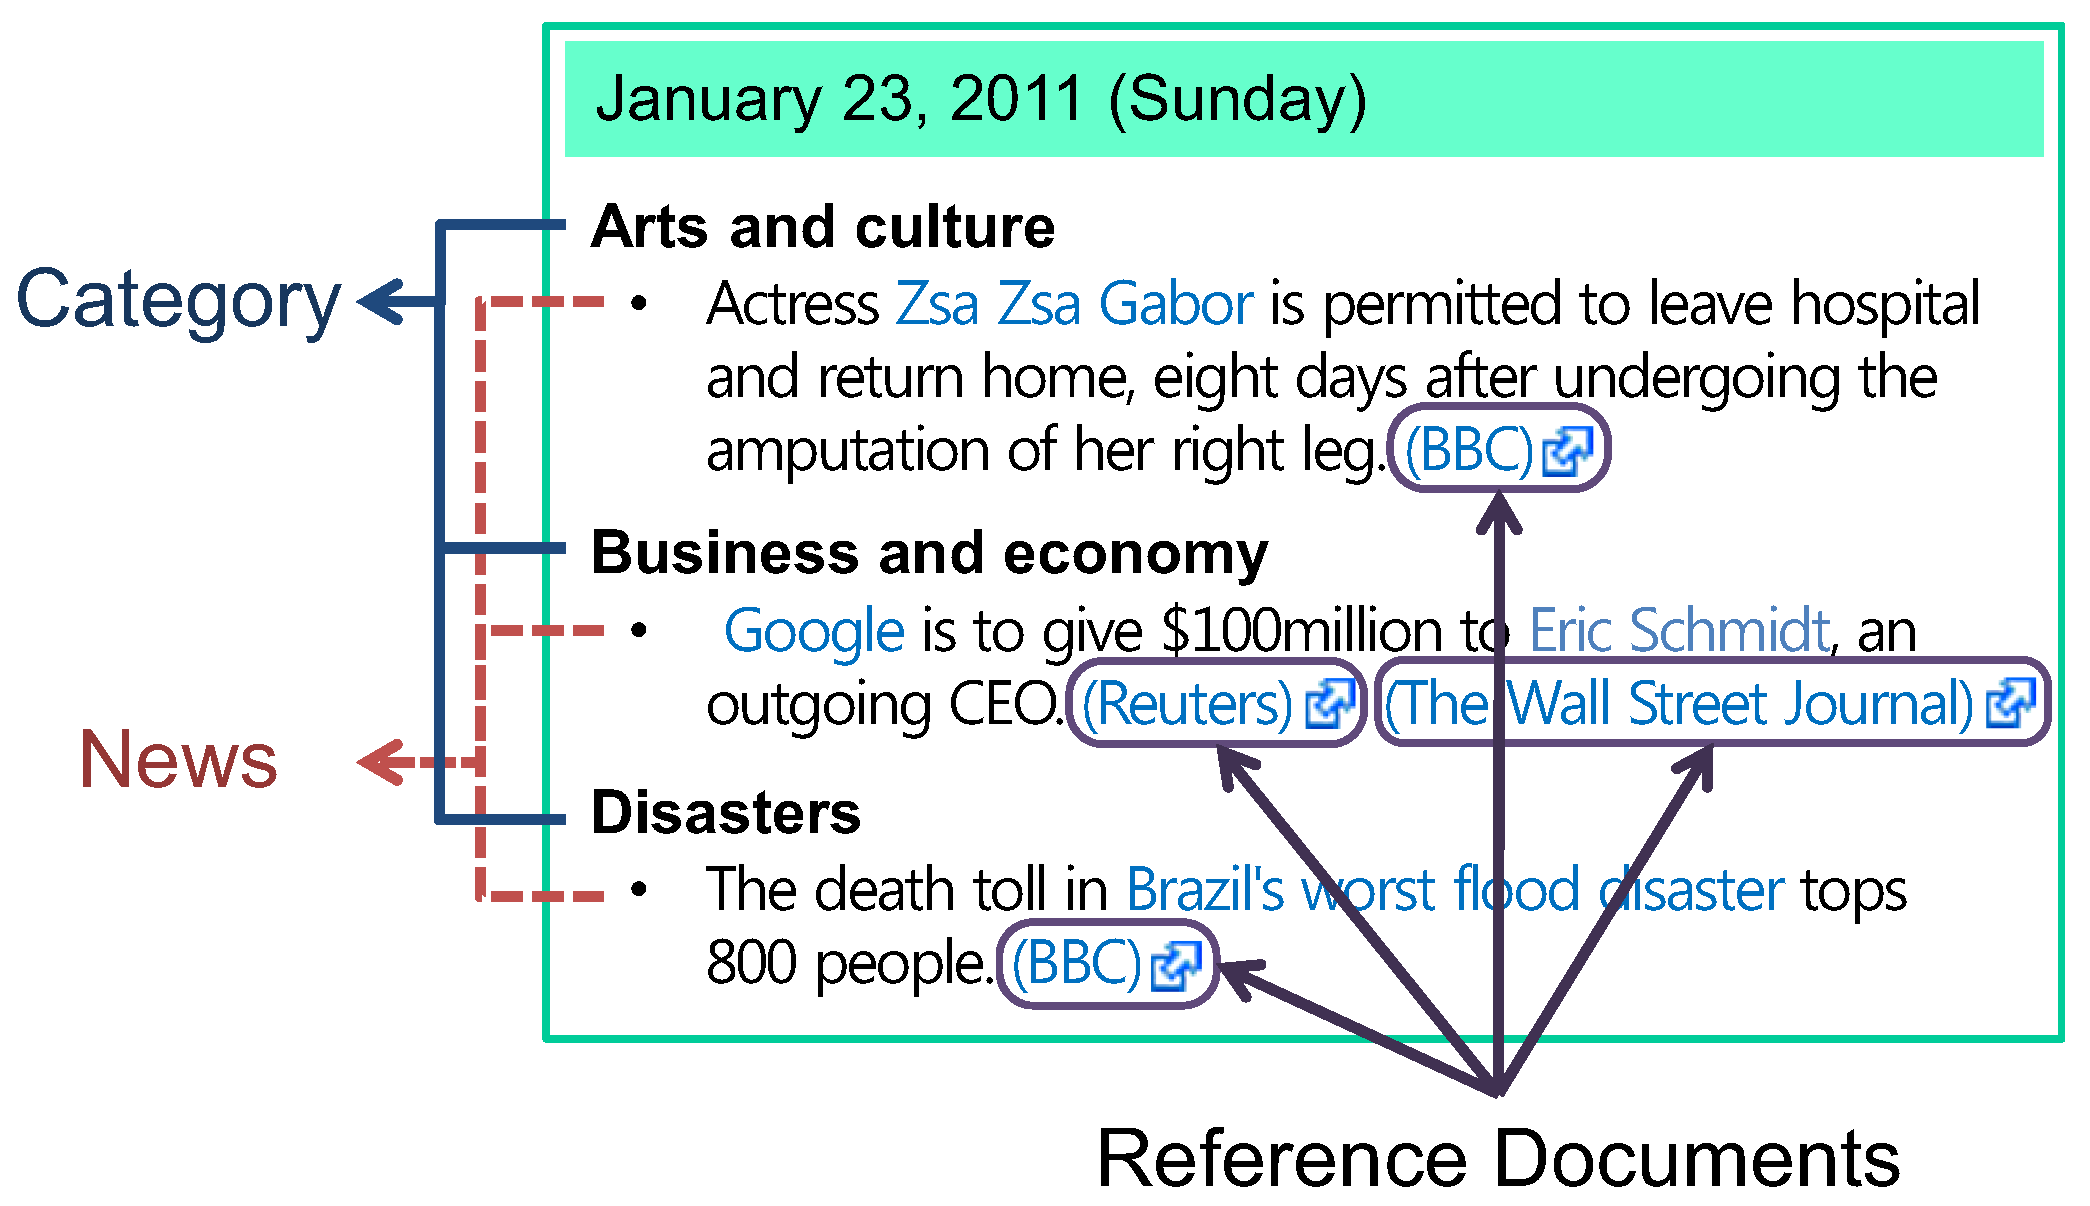
5.2. Document Labeling with Real-world News

The next step is to identify real-world news stories during the dataset period. As a pertinent reference of noteworthy real-world news, we use Wikipedia Current Events [19], which provides chronologically organized event profiles, continuously updated and discussed by volunteers, as shown in Figure 3. Despite the potential selection bias of volunteers, this is a good reference, considering the geographical bias of traditional news agencies, the inaccessibility of retroactive crawling from news aggregation sites and the coverage of representative topics of conventional news outlets. We parsed the Wikipedia event page corresponding to our dataset period and built a real-world news registry along with relevant keywords of each piece of news. Keywords are collected by crawling reference hyperlinks (circles in Figure 3) on the event page, then conducting named entity recognition and resolution [34] with the crawled pages and, finally, extracting key terms from the brief summary of each piece of news (bullet points in Figure 3) on that event page. Finally, we labeled documents with identified news for the trace of news diffusion across social media.
Figure 3. An example of Wikipedia Current Events; each bullet point is referred to as news, which describes a short summary of an event for that day, along with reference hyperlinks (circles), and its category (bold fonts).
Entropy 15 04215 g003
Entity Recognition and Resolution: A news story is well defined by the “5W1H”, i.e., Who, What, Where, When, Why and How, of journalistic practice. Note that among the five W’s, at least three of them (who, where and when) directly correspond to entities, such as a person’s name, an organization, a location, a date and time indicators. Moreover, the rest (what, why and how) often contain entities to make statements precise and credible. Therefore, we represent each piece of news with an entity vector (Figure 4a) whose elements consist of the TFIDF (term frequency-inverse document frequency) score [35] of each entity extracted from the news reference documents (circles in Figure 3). We conducted named entity recognition by using the OpenCalais API [36], which provides up to 116 types of entities (from anniversary to voting results).
An entity name can occur in many different ways among web documents, resulting in multiple dimensions for the same entity. For example, in our data collection, we identify nine name variations for Tunisia’s former president “Zine El Abidine Ben Ali”, including “Zine Al-Abedine Ben”, “Zine Al-Abedine Ben Ali” and “Zine Al-Abdine Ben Ali”. To alleviate this problem, we employ approximate string matching techniques to cluster similar entity names. Such techniques are commonly used in entity resolution and data matching to identify similar strings that refer to the same entity [34]. We finally extracted 4,411 unique entities for 284 news stories from the crawled reference pages and generated both 4,411-dimensional entity vectors and their centroids for each news.
Document Labeling with Identified News: We also represent the target documents as entity vectors with the same dimensions as the news vectors (Figure 4(a)). We then use the vector space model [37] for classifying documents into news stories by calculating the similarity between document vector and news class vector (more precisely, the centroid of news vectors) as shown in Figure 4(b); the most similar centroid vector specifies the most similar news class. Each document can potentially be labeled with none or the most similar news class based on the threshold value ( τ = 0 . 14 ) of the similarity score (see the details in our previous study [3]).
Figure 4. Document labeling with identified news. In (a), web documents are represented with M (= 4,411) dimensional entity vectors, and refdocs indicate reference documents in Figure 3; in (b), similarities between a document and news class vectors are calculated for labeling the document with the most similar news topic. (a) News representation with named entity vectors; (b) labeling documents with vector space model.
Entropy 15 04215 g004
Table 3. The top largest global diffusion of real-world news across social media; news topics and categories are based on Wikipedia Current Events [19]. The numbers in parentheses indicate the number of topics in each category.
CategoryReal-world News Stories (January, 2011)
Politics (15)Protests in Tunisia, Egypt, Sudan and Yemen; Internet shutdown in Egypt; Hosni Mubarak resignation; Tucson shooting; Julian Assange; US Healthcare law, etc.
Business and Economy (8)US bank crisis; Apple profit record; Borders bankruptcy; New Google CEO; Swiss bank account revealed by Wikileaks; Food crisis, etc.
Technology and Science (13)Apple iPad2 release; iPads for education; 10 billion downloads on the App Store; Wikipedia 10th Anniversary; Google technology news; Mammoth revive; Zodiac sign change; Betelgeuse, etc.
Disasters (4)Floods in Australia, Sri Lanka and Brazil; Massive winter storm in US
Arts and Culture (17)Academy Movie Awards; Golden Globe Awards; Screen Actors Guild Awards; Film release; Celebrities; Multiculturalism failure; Conflicts between Muslims and Christian; Cultural change of female education by Taliban; Chinese education, etc.
Sports (6)NFL (National Football League) playoffs; BCS (Bowl Championship Series) Championship; AFC (Asian Football Confederation) Asian Cup; Australian Open; Ashes series winner; Sky Sport sexism scandal
As a result, we chose the top largest diffusion of the 63 news stories, each of which comes up with more than 150 adopters, as shown in Table 3. These selected news topics led to 3.1 million web documents, and 56% of them (1.7 million) are created by identified users. This tells us that over 50% of the largest diffusion of 63 news topics is led by the identified users, which reconfirms the validity of our real dataset to study real-world diffusion mechanisms.

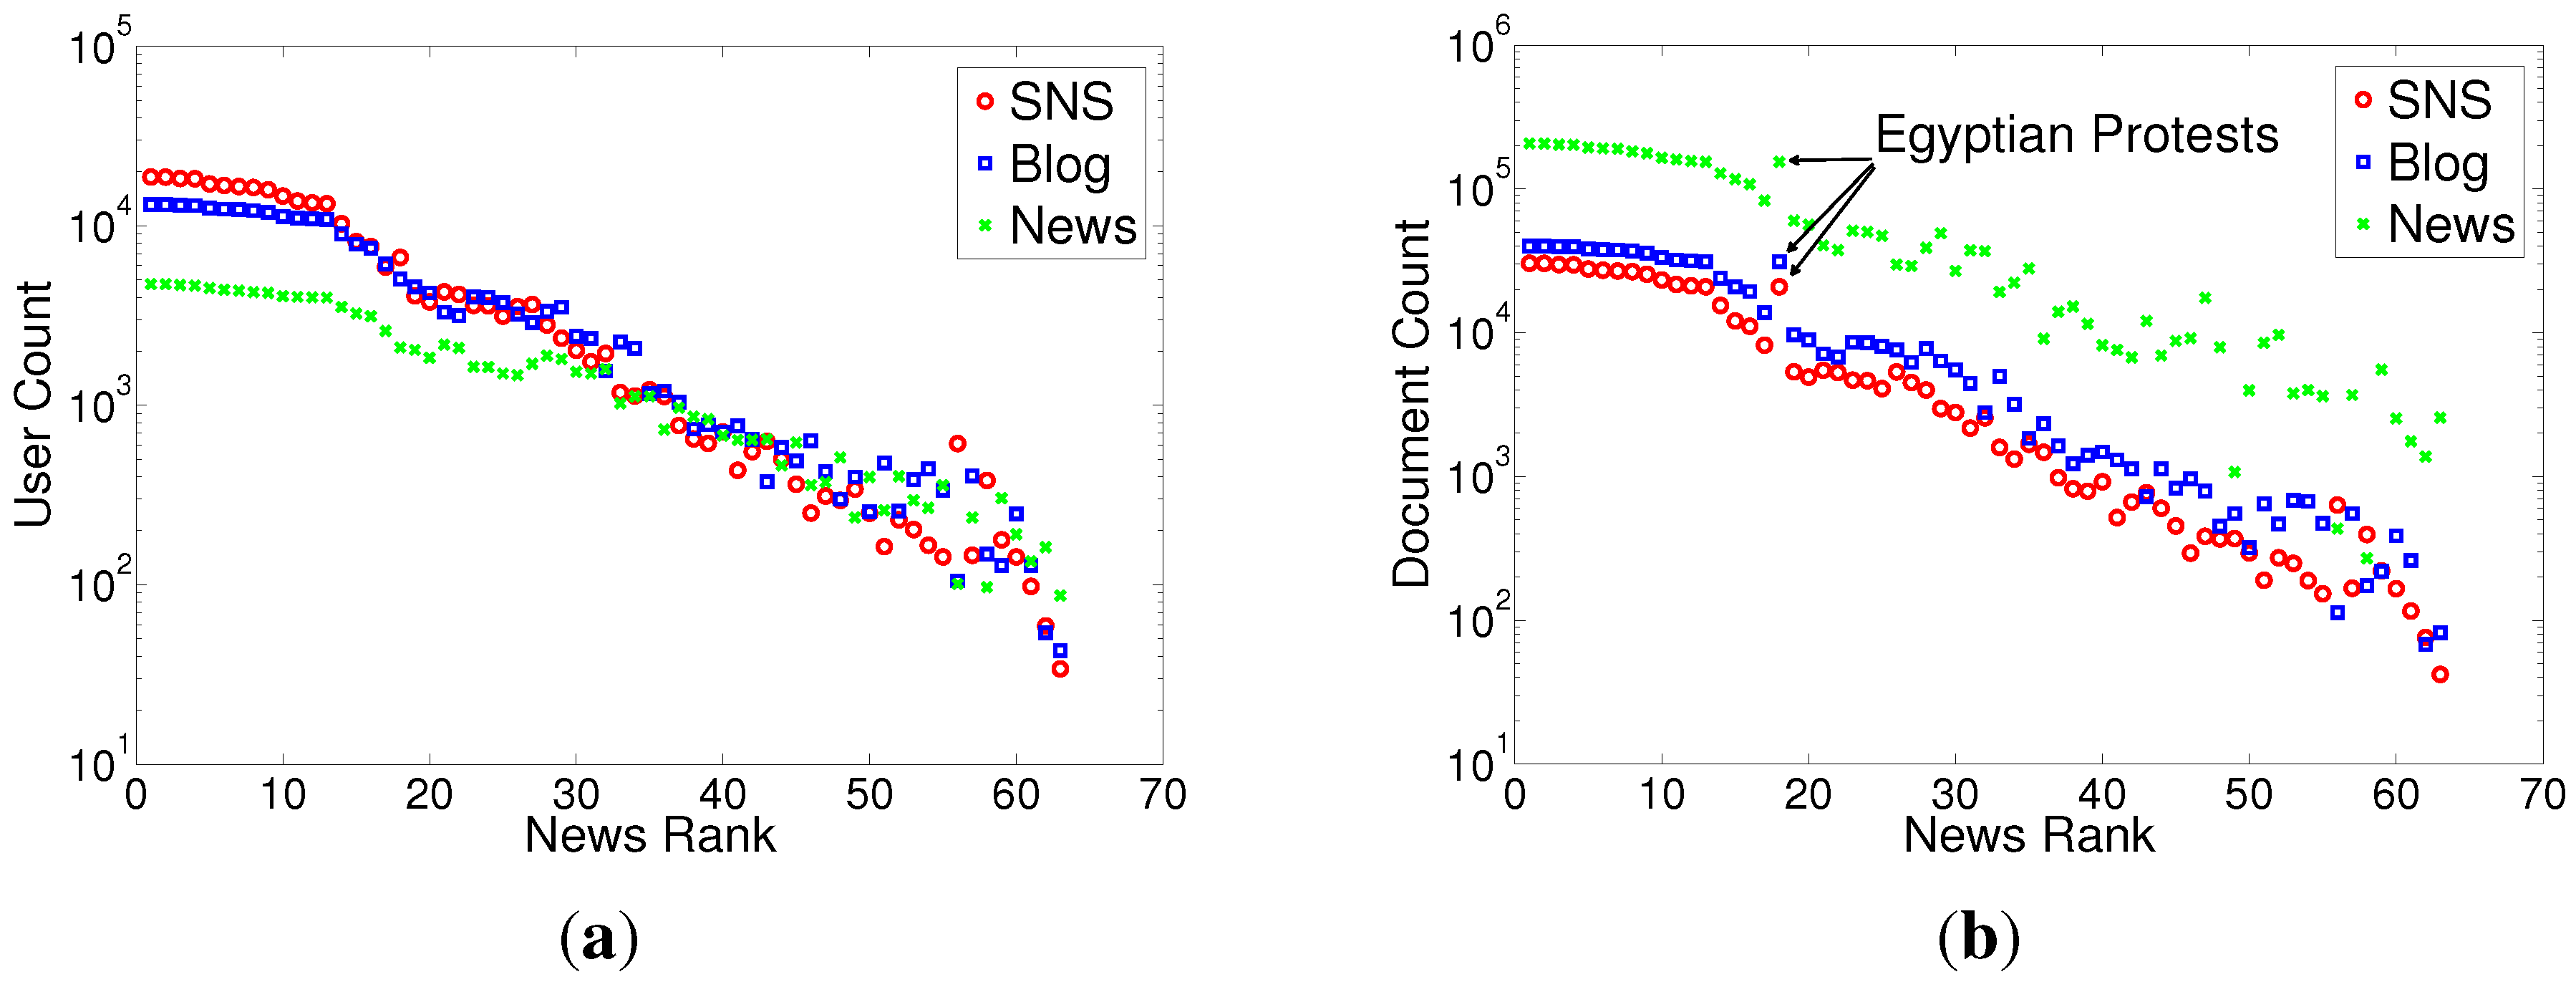
5.3. Global Spread of News in Social Media

We examined which media types are involved in the top 63 largest news diffusions in terms of user and document volume by media type, as shown in Figure 5. The rank of the news is determined by the user volume of each diffusion. As the figure shows, SNS users constitute the largest proportion of the top 20 news diffusions (in Figure 5(a)), but they produced smaller documents than blog users (in Figure 5(b)). Overall, Blog users generate more documents than SNS users and, unsurprisingly, much less than news media. Interestingly, the “Egyptian protests” news led to much more documents, compared to other news topics having a similar user volume (in Figure 5(b)). This means that an increasing number of documents does not always bring in new adopters into diffusion, and rather, there exist active users generating new documents for some trending topics. However, in general, the number of adopters in social media increases as the size of hyperlink cascades grows.
Figure 5. User and document distributions of the 63 largest news diffusions by media type. (a) User distribution; (b) document distribution.
Entropy 15 04215 g005
From these fundamental statistics, we observed that large diffusions of news are attributed to the spreading behaviors of all media types and not limited to a specific type. In this regard, we will further analyze the diffusion mechanisms across all media types by conducting experiments on both synthetic and real datasets in the next section.

6. Experiments

We evaluate our proposed model using both synthetic and real data and compare the results with the Bass Model as a baseline. We fit the models by minimizing the sum of squared errors in an iterative way until the error converges. As evaluation metrics, model fitting errors and parameter errors are used [10,14,15]. After the verification of parameter recovery with generated synthetic datasets, we analyze the real-world news diffusion with the estimated parameter values on the real data.

6.1. Experiments on Synthetic Data

In Section 4, we generalized the Bass Model with a probabilistic approach into the model of diffusion over both heterogeneous and connected social networks. This generalization enables us to estimate unobservable dynamic influence across heterogeneous social networks (meta-populations), only given cumulative adopters for each homogeneous network (one meta-population) over time. The goal of this section is to recover the hidden diffusion processes from generated synthetic datasets. For testing model performance, model fitting errors and parameter errors are evaluated in the experiments. The former describes how closely our model predicts the cumulative number of adopters for each meta-population, while the latter shows how correctly our model infers the ground truth parameters.
Synthetic Data Generation: As we discussed in Section 3, the effects of interactions between different social networks on diffusion are not ignorable, and thus, we can think of all possible directions of influence flow between meta-populations. When it comes to news diffusion across heterogeneous social networks whose types are news, SNS and blog, we can build a 3 × 3 adjacency matrix for representing the existence of influence between two media types, and thus, there are 2 9 possible cases of relational structures among three media types in total. If we also vary the strength of influence, then the number of potential cases becomes intractable. For efficient and meaningful simulation, it is important to generate synthetic datasets reflecting representatives among such numerous possible cases.
Figure 6. Unique structures of dynamic influence flows among three meta-populations, each of which reflects one of the three media types, such as news, SNS and blog, in our real data. All graphs include self-loops (influence between same media types), which are omitted for brevity. Empty links between two different nodes represent very weak connections compared to nonempty links, but they are not ignorable for a more accurate understanding of diffusion across heterogeneous social networks. Thus, they are all directed connections between nodes, but with different strengths. Our synthetic datasets are generated based on these structures.
Entropy 15 04215 g006
For avoiding redundant cases, we first consider unique structures of the relations, which leaves us with 16 dynamic relations, as shown in Figure 6. The dynamic structures include 13 motifs (1–13) and an additional three disconnected graphs (14–16). In this figure, each graph has three self-loops, indicating interactions within meta-populations, but they are all omitted for brevity. We assume that there always exists influence between two media types, but with different strengths. Thus, empty links between two different nodes represent very weak influence compared with nonempty links. Note that the 16th graph has weak connections between nodes, which avoids the most trivial case, i.e., isolated social networks in Figure 1(a). In addition, applying a threshold to the strength of influence can simplify dynamic influence as the presence or absence of influence, which depends on application domains. However, in this study, we do not ignore every weak influence to consider real-world situations exhibiting dynamic relations between heterogeneous social networks.
Accordingly, three variants of link weights are considered as (non-empty-link-weight, empty-link-weight) = { ( 0 . 33 , 0 . 01 ) , ( 0 . 26 , 0 . 05 ) , ( 0 . 18 , 0 . 07 ) } in order to cover exemplary cases, such as (1) dominant influence between the same media types, (2) strong influence of one media type on the others and (3) balanced influence among three media types. We finally generated 48 (= 16 × 3 variants) datasets of cumulative adopters for the diffusion model as { ( A 1 ( t ) , A 2 ( t ) , A 3 ( t ) ) } t = 1 T , as shown in Figure 7. The length of time step T is chosen as one month (30 days) to reflect our real dataset period, and the subscripts 1, 2 and 3 of A ( t ) indicate the three different types of meta-populations. Each link between nodes corresponds to the direction and strength of influence between meta-populations. In our model, they are denoted as c i i [ 0 , 1 ] , which is the probability that an individual of type i adopts when its neighbor of type i has adopted, as discussed in Equation (10).
Figure 7. Synthetic data generation reflecting dynamic influences among three different types of meta-populations. Forty-eight synthetic datasets are generated in total, and the different population sizes of the three meta-populations reflect real-world situations, such as different numbers of adopters in news, SNS and blog media. The generated datasets are illustrated with daily cumulative adopters (left) and the proportion of the corresponding cumulative adopters (right).
Entropy 15 04215 g007
Evaluation Metrics: Let us denote the model parameters by Θ i = { n i , θ i } , i = n , s , b , where n i ( i = n , s , b ) denotes the population size of each media type i, and the definitions of θ i are different in each diffusion model. For example, θ n = { p n , q n } in the Bass Model, while θ n = { p n , c n n , c s n , c b n } in the Dynamic Influence Model. To fit each model to the generated synthetic datasets, we apply nonlinear least squares (NLS) [38], which minimizes the normalized root mean squared errors (RMSE):
RMSE = t = 1 T i A i ( t ) / n i - P ( a | i , t , θ i ) 2 3 T
where P ( a | i , t , θ i ) is the estimated adoption probability of each population at time t. Note that due to the parameter identification problem, where the same results are produced with different settings of parameters, we fix the power law coefficient α to be 2 . 5 , whose value is typically in the range 2 < α < 3 [27,33].
Table 4 shows the averages and standard deviations of model fitting errors (RMSE) of two diffusion models, the Bass Model (BM) and our Dynamic Influence Model (DM), with the generated datasets. The DM outperforms the BM with more acceptable standard deviation, but this is not surprising, since the DM has more degrees of freedom, due to having more parameters than the BM. Therefore, we compared the prediction errors between the two models as shown in Table 5. During a one month period of diffusion, we used the prior 60 and 80 percent of cumulative adoption history in each dataset for training the model parameters and, then, estimated the remaining 40 and 20 percent with the learned parameters, respectively. As the table shows, still, the DM outperforms the BM by one order of magnitude. The estimated parameter errors (averages and standard deviations in Table 6) are also acceptable when compared to typical values of parameters in the BM ( p 0 . 03 , q 0 . 3 and m 3 , 000 ) [23], showing the feasibility of our model to reproduce parameters from the datasets.
Table 4. Averages and standard deviations of model fitting errors (root mean squared errors (RMSE)) with synthetic datasets (BM: Bass Model, DM: Dynamic Influence Model).
BMDM
Mean2.19e-33.74e-4
STD8.77e-41.29e-4
Table 5. Averages and standard deviations of prediction errors (RMSE) with synthetic datasets. Given daily cumulative adopters for 30 days, the prior 60 and 80 percent of the adoption history in each dataset are used for training parameters to predict the remaining 40 (12 days) and 20 percent (6 days), respectively.
Train:Test = 60:40Train:Test = 80:20
BMDMBMDM
Mean2.41e-31.83e-45.99e-44.2e-5
STD2.16e-31.72e-46.06e-44.2e-5
Table 6. Averages and standard deviations of parameter errors of the proposed model with synthetic datasets ( p i : external influence of individuals of type i; n i : population of individuals of type i; c i j : internal influence of neighbors of type i on individuals of type j).
Meta-population 1Meta-population 2Meta-population 3
Par. p 1 c 11 c 21 c 31 n 1 p 2 c 12 c 22 c 32 n 2 p 3 c 13 c 23 c 33 n 3
Avg.3.1e-41.6e-22.8e-21.4e-22.0e-12.7e-42.0e-23.6e-21.6e-22.2e-13.6e-41.3e-22.4e-21.4e-24.1e-1
Std.2.8e-41.9e-23.0e-21.4e-21.9e-12.6e-41.9e-23.4e-21.6e-22.3e-12.7e-41.2e-22.1e-21.4e-23.3e-1

6.2. Experiments on Real Data

In Section 5, we described the preparation and analysis of the Sinn3r dataset. Among the 60 million English documents, we selected documents that contain at least one hyperlink in their main text and are also created by the 6.4 million identified users in Table 2. We labeled these documents with 284 identified real-world news by using Wikipedia Current Events. Eventually, we selected the 63 news topics in Table 3, each of which has driven adoptions of at least 150 identified users across social media. Thus, there are 63 real datasets, each of which consists of daily cumulative adopters for three media types (news, SNS and blog) during a one month period as an input, i.e., { A i ( t ) } t = 1 33 , i = n , s , b .
As we discussed in Section 4, our macro-level diffusion model does not require detailed network structures (see Equation (13) and Appendix A), and what we only need to know is the power-law exponent, α, based on the assumption of a power-law degree distribution. Most real-world networks in their degree distributions have power-law exponents in the range 2 < α < 3 [27,33]. When it comes to social media, the entire Twittersphere, including 41.7 million users, exhibited the exponent of about 2.3 [9], the blogosphere showed the exponents of 2.5 and 2.6 [1,4] and authorship networks in our real data also follow a power-law degree distribution with the exponent of 2.3. Based on the observations from both related works and our study, we set the power-law exponent, α, to be 2.5. With the collected 63 real datasets, we fit the models and further examine how real-world news spreads across social media by comparing different diffusion patterns between six categories in Table 3.
Table 7. Averages and standard deviations of RMSE for both model fitting and prediction errors (train: test = 80:20, for each dataset) with real datasets.
Model Fitting ErrorPrediction Error
BMDMBMDM
Mean2.866e-22.259e-23.207e-22.481e-2
STD1.902e-21.027e-23.698e-21.018e-2
There are no ground truths of parameter values in the real data, so we fit the proposed model (DM) and the baseline model (BM) using nonlinear least squares (NLS), as in the experiments on the synthetic datasets, and evaluate model fitting errors and prediction errors as shown in Table 7. Overall, due to noise in the real datasets, the performance of model fitting and prediction decreased by at least one order of magnitude, compared with those on the synthetic datasets in Table 4 and Table 5. However, our proposed model still performs better than the BM, with more acceptable standard deviations in all cases. This result can be interpreted as news diffusion being influenced by different social networks in a directed way, and thus, the proposed model can improve the accuracy of diffusion models dealing with single social networks.
Figure 8. Example cases of model fitting results with real dataset from “arts and culture” and “politics” categories (BM: Bass Model; DM: Dynamic Influence Model; A: cumulative adopters up to time t). (a) Arts and culture: the film “Black Swan”; (b) arts and culture: multiculturalism failure; (c) politics: Yemen protests.
Entropy 15 04215 g008
Concurrent Diffusion across Social Media: We examine different diffusion patterns by the context of information. Figure 8 shows three example cases of model fitting results from the arts and culture and the politics categories. As Figure 8(a) and Figure 8(b) demonstrate, topics in the same category do not necessarily exhibit similar diffusion patterns. In Figure 8(a), the news about the film “Black Swan” rapidly spreads in news media first, and then, it continues to spread to other social media (more rapidly in SNS than blog). On the other hand, in the case of “multiculturalism” issues in Figure 8(b), the growth rate was not rapid from the beginning, but the diffusion begins to grow sharply and simultaneously across all media types after 23 days, when UK Prime Minister, David Cameron, stated the failure of multiculturalism [39]. Similarly, such concurrent behaviors are observed in the diffusion of political movements in the Middle East, such as Tunisia, Egypt, Sudan and Yemen. As shown in Figure 8(c), the “Yemen protests” demonstrate synchronous diffusion patterns after 15 days.
Without direct interactions across social media, such simultaneous growth unlikely happens. As the figure shows, the BM cannot follow these concurrent growth patterns without considering the effects of influences among heterogeneous social networks. Therefore, influences from different social networks are not ignorable for a better understanding of diffusion processes.
Dynamic Influence in Social Media by Context of Information: By categorizing news topics according to Table 3, we attempt to distinguish different diffusion patterns in terms of the strength and directionality of influence. Figure 9 shows the distributions of estimated parameter values, where c i j in the x-axis indicates the influence of media type i on the other media type, j, and the y-axis represents the probability that the influence of type i on j is equal to or greater than c i j .
Figure 9(a) shows overall trends of interactions among three media types by aggregating parameter values of all news content. In general, news media are influenced by all media types in a balanced way, while SNS and blog, in that order, exhibit stronger internal interactions within the same media types. Considering the characteristics of news media, it seems to be required to monitor and reflect the trends of other media types, narrowing the gaps with them. As discussed earlier, the arts and culture topics demonstrate different diffusion patterns, as shown in Figure 9(b) and Figure 9(c). News media are the most influential in the diffusion of arts topics, such as the Academy Awards, film releases and celebrities. However, regarding the culture category, blog media tend to show strong influence on news and SNS media. Controversial subjects, such as multiculturalism failure and female education in Afghanistan, seem to lead to longer discussions, representing personal opinions, and thus, blog media can be a more suitable space compared to other micro blogs or unbiased news media. Like the arts topics, news media occupied influential positions in the economy topics. Exact statistics or facts about economic status can be well described in news media with reliability. Interestingly, regarding political topics, SNS media exhibit the highest influence on all media types, while the influence of blog media are negligible. Political news generally has great social repercussions, such as the Middle East protests, the Tuscon shooting and Wikileaks. In this respect, the micro-blogging space can be a better medium to distribute urgent issues rapidly, and their prompt proliferation influences news media to focus on the issues. In the technology and science category, internal buzz in SNS media is predominant in contrast to blog media.
In summary, news media are the most influential in the arts and the business and economy categories, while in the politics and the culture categories, SNS and blog media are influential, respectively. SNS media show strong internal interactions regarding the technology and science category in contrast to blog media. However, the characteristics of topics are more important than the categories, as we observed to be the case for the arts and culture category.
Figure 9. Distributions of inferred parameter values with the real dataset by categories. The x-axis indicates value of parameter c i j (the probability of the influence of media type i on j); the y-axis represents the probability of the parameter value more than c i j . (a) All categories; (b) arts; (c) culture; (d) business and economy; (e) politics; (f) technology and science.
Entropy 15 04215 g009
Figure 10. Averages and standard deviations of cumulative adoption rates for all 63 pieces of news content by media types.
Entropy 15 04215 g010
Diffusion Rate of Social Media: Figure 10 shows the averages and standard deviations of cumulative adoption rates for 63 pieces of news content by media types. In general, news media spread information most rapidly, and SNS media follow next. SNS media show almost similar patterns with news, and thus, they tend to be very responsive to the diffusion trends of news media. However, the diffusion rate in blog media grows more slowly compared to the other types.
In this section, by conducting experiments on both synthetic and real data sets, we showed a way of interpreting diffusion in terms of the strength and directionality of influence between populations. As a result, we found that news diffusion in social media is attributed to heterogeneous social networks, which are not separated, but interconnected.

7. Discussions

From the experimental results, we observed that the heterogeneity of social networks has an effect on diffusion, but it also raises issues. First, the collapse of the boundaries of social media platforms brings a concern of identifying borderline users who have more than one account in different social media platforms. However, distinguishing such borderline users is beyond the scope of this study, which is one of the research topics of identifying multi-layered social networks [29]. Second, the structure of diverse social networks are hidden, due to privacy issues, various communication channels (e.g., news feeds, mobile applications and web search) and lively changing relations between online users. Even if we obtain authorship networks in social media, we cannot say that they are real diffusion networks, as discussed in Section 1. In this context, our model assumes a power-law degree distribution, which brings another limitation, due to the unknown topologies. However, we can obtain macro-level trends of diffusion across populations without the need of detailed network structures. Studying the properties of diffusion networks across heterogeneous populations can improve the proposed model further.
Regardless of these limitations, influence between heterogeneous social networks helps to better describe diffusion within homogeneous social networks. This is because external influence on a single social platform is not ignorable (e.g., 30% of exposures in Twitter were attributed to external sources [10]), and some of the external sources play an important role as internal influence, as discussed in Section 3. Frequent and close interactions between heterogeneous networks are possibly due to web technologies that enable various information sources to be more easily accessible and, thus, diverse online social networks to be more interconnected across social platforms. In this complex environment, this study can provide the benefits of excluding detailed network topologies, but considering realistic circumstances by combining the structural property and heterogeneity of real-wold networks in our proposed model.

8. Conclusions

We introduced a new conceptual framework for diffusion across heterogeneous social networks. Accordingly, we incorporated this concept into the simple mass-action Bass Model with a probabilistic approach. This generalization enables us (1) to separate influence between interconnected heterogeneous social networks from arbitrary external influence on homogeneous social networks and, thus, improve the accuracy of a mass-action diffusion model, (2) to obtain a macro-level trend of influences between social networks in terms of directionality and strength and, finally, (3) to compare different diffusion patterns among a great variety of information topics.
The experiments on both synthetic and real datasets showed the feasibility of the proposed model. Dynamic influence between social networks helps to better describe diffusion within a single social platform. Supportive evidences can be found in the diffusion of news regarding political protests and multiculturalism failure, since they tend to drive concurrent and simultaneous diffusion across different types of social media. Such phenomena unlikely happen without direct interactions between different social networks. We also found that there are different diffusion patterns by different news categories. News media are the most influential in the arts and the business and economy categories, while SNS and blog media are in the politics and the culture categories, respectively.
We expect that the proposed model applies to a wider class of diffusion phenomena in diverse areas, including the social sciences, marketing and neuroscience, for interpreting the dynamics of meta-populations at a macro-level. As future work, possible topics are to improve the model by using more accurate information of underlying network structures and to predict future behaviors of heterogeneous social networks based on their interdependence and distinguished patterns.

Conflicts of Interest

The authors declare no conflict of interest.

References

  1. Cha, M.; Pérez, J.; Haddadi, H. Flash Floods and Ripples: The Spread of Media Content through the Blogosphere. In Proceedings of the International AAAI Conference on Weblogs and Social Media, San Jose, CA, USA, 17–20 May 2009.
  2. Gomez-Rodriguez, M.; Leskovec, J.; Krause, A. Inferring networks of diffusion and influence. ACM Trans. Knowl. Discov. Data (TKDD) 2012, 5, 21. [Google Scholar] [CrossRef]
  3. Kim, M.; Xie, L.; Christen, P. Event Diffusion Patterns in Social Media. In Proceedings of the International AAAI Conference on Weblogs and Social Media, Trinity College, Dublin, Ireland, 4–7 June 2012.
  4. Leskovec, J.; McGlohon, M.; Faloutsos, C.; Glance, N.; Hurst, M. Cascading Behavior in Large Blog Graphs. In Proceedings of the Seventh SIAM International Conference on Data Mining, Minneapolis, MN, USA, 26–28 April 2007.
  5. Leskovec, J.; Backstrom, L.; Kleinberg, J. Meme-Tracking and the Dynamics of the News Cycle. In Proceeding of the ACM SIGKDD International Conference on Knowledge Discovery and Data Mining, Paris, France, 28 June–1 July 2009; ACM: New York, NY, USA, 2009; pp. 497–506. [Google Scholar]
  6. Adar, E.; Adamic, L. Tracking Information Epidemics in Blogspace. In Proceedings of the IEEE/WIC/ACM International Conference on Web Intelligence, Compiegne, France, 19–22 September 2005; pp. 207–214.
  7. Gruhl, D.; Guha, R.; Liben-Nowell, D.; Tomkins, A. Information Diffusion through Blogspace. In Proceedings of the International Conference on World Wide Web, New York, NY, USA, 17–22 May 2004; ACM: New York, NY, USA, 2004; pp. 491–501. [Google Scholar]
  8. Kamath, K.Y.; Caverlee, J.; Cheng, Z.; Sui, D.Z. Spatial Influence vs. Community Influence: Modeling the Global Spread of Social Media. In Proceedings of the International Conference on Information and Knowledge Management, Kuala Lumpur, Malaysia, 24–26 July 2012; ACM: New York, NY, USA, 2012; pp. 962–971. [Google Scholar]
  9. Kwak, H.; Lee, C.; Park, H.; Moon, S. What is Twitter, a social network or a news media? In Proceedings of the International Conference on World Wide Web, Raleigh, NC, USA, 26–30 April 2010; ACM: New York, NY, USA, 2010; pp. 591–600. [Google Scholar]
  10. Myers, S.; Zhu, C.; Leskovec, J. Information Diffusion and External Influence in Networks. In Proceeding of the ACM SIGKDD International Conference on Knowledge Discovery and Data Mining, Beijing, China, 12–16 August 2012; ACM: New York, NY, USA, 2012; pp. 33–41. [Google Scholar]
  11. Romero, D.; Meeder, B.; Kleinberg, J. Differences in the Mechanics of Information Diffusion Across Topics: Idioms, Political Hashtags, and Complex Contagion on Twitter. In Proceedings of the International Conference on World Wide Web, Hyderabad, India, 28 March–1 April 2011; ACM: New York, NY, USA, 2011; pp. 695–704. [Google Scholar]
  12. Bass, F. Comments on “A New Product Growth for Model Consumer Durables”: The Bass model. Manag. Sci. 2004, 50, 1833–1840. [Google Scholar] [CrossRef]
  13. Guimera, R.; Uzzi, B.; Spiro, J.; Amaral, L. Team assembly mechanisms determine collaboration network structure and team performance. Science 2005, 308, 697–702. [Google Scholar] [CrossRef] [PubMed]
  14. Kumar, V.; Krishnan, T. Multinational diffusion models: An alternative framework. Market. Sci. 2002, 21, 318–330. [Google Scholar]
  15. Luu, M.; Lim, E.; Hoang, T.; Chua, F. Modeling Diffusion in Social Networks Using Network Properties. In Proceedings of the International AAAI Conferenceon Weblogs and Social Media, Dublin, Ireland, 4–7 June 2012.
  16. Barrat, A.; Barthlemy, M.; Vespignani, A. Dynamical Processes on Complex Networks; Cambridge University Press: Cambridge, UK, 2008. [Google Scholar]
  17. Anagnostopoulos, A.; Kumar, R.; Mahdian, M. Influence and Correlation in Social Networks. In Proceeding of the ACM SIGKDD International Conference on Knowledge Discovery and Data Mining, Las Vegas, NV, USA, 24–27 August 2008; ACM: New York, NY, USA, 2008; pp. 7–15. [Google Scholar]
  18. Bass, F. A new product growth for model consumer durables. Manag. Sci. 1969, 15, 215–227. [Google Scholar] [CrossRef]
  19. Wikipedia Current Events Portal from January, 2011. Available online: http://en.wikipedia.org/wiki/January_2011 (accessed on 29 August 2011).
  20. Spinn3r Dataset. In Proceedings of International AAAI Conference on Weblogs and Social Media (ICWSM’11), Barcelona, Spain, 17–21 July 2011; Available online: http://www.icwsm.org/data/ (accessed on 29 August 2011).
  21. Katz, E. The two-step flow of communication: An up-to-date report on an hypothesis. Public Opin. Q. 1957, 21, 61–78. [Google Scholar] [CrossRef]
  22. Rogers, E. Diffusion of Innovations; The Free Press of Glencoe: New York, 1962. [Google Scholar]
  23. Mahajan, V.; Muller, E.; Bass, F. Diffusion of new products: Empirical generalizations and managerial uses. Market. Sci. 1995, 14, G79–G88. [Google Scholar] [CrossRef]
  24. Niu, S.C. A stochastic formulation of the Bass Model of new-product diffusion. Math. Probl. Eng. 2002, 8, 249–263. [Google Scholar] [CrossRef]
  25. Young, H.P. Innovation diffusion in heterogeneous populations: Contagion, social influence, and social learning. Am. Econ. Rev. 2009, 99, 1899–1924. [Google Scholar] [CrossRef]
  26. Bailey, N. The Mathematical Theory of Infectious Diseases and Its Applications, 2nd ed.; Hafner Press/MacMillian Pub. Co.: New York, USA, 1975; Volume 413. [Google Scholar]
  27. Newman, M. Networks: An Introduction; Oxford University Press: New York, NY, USA, 2010. [Google Scholar]
  28. Putsis, W., Jr.; Balasubramanian, S.; Kaplan, E.; Sen, S. Mixing behavior in cross-country diffusion. Market. Sci. 1997, 16, 354–369. [Google Scholar] [CrossRef]
  29. Pan, W.; Aharony, N.; Pentland, A. Composite Social Network for Predicting Mobile Apps Installation. In Proceedings of the AAAI Conference on Artificial Intelligence, San Francisco, CA, USA, 7–11 August 2011.
  30. Kuperman, M.; Abramson, G. Small world effect in an epidemiological model. Phys. Rev. Lett. 2001, 86, 2909–2912. [Google Scholar] [CrossRef] [PubMed]
  31. Schilling, M.; Phelps, C. Interfirm collaboration networks: The impact of large-scale network structure on firm innovation. Manag. Sci. 2007, 53, 1113–1126. [Google Scholar] [CrossRef]
  32. Sobkowicz, P.; Kaschesky, M.; Bouchard, G. Opinion Formation in the Social Web: Agent-Based Simulations of Opinion Convergence and Divergence. In Agents and Data Mining Interaction; Springer: Berlin, Heidelberg, Germany, 2012; pp. 288–303. [Google Scholar]
  33. Clauset, A.; Shalizi, C.R.; Newman, M.E. Power-law distributions in empirical data. SIAM Rev. 2009, 51, 661–703. [Google Scholar] [CrossRef]
  34. Christen, P. Data Matching. In Data-Centric Systems and Applications; Springer: Berlin, Germany, 2012. [Google Scholar]
  35. Manning, C.; Raghavan, P.; Schutze, H. Introduction to Information Retrieval; Cambridge University Press: Cambridge, UK, 2008; Volume 1. [Google Scholar]
  36. OpenCalais API. Available online: http://www.opencalais.com/calaisAPI (accessed on 29 August 2011).
  37. Salton, G.; Wong, A.; Yang, C.S. A vector space model for automatic indexing. Commun. ACM 1975, 18, 613–620. [Google Scholar] [CrossRef]
  38. Kelley, C.T. Iterative Methods for Optimization; Society for Industrial and Applied Mathematics: Philadelphia, PA, USA, 1999. [Google Scholar]
  39. Multiculturalism Has Failed in Britain. Available online: http://uk.reuters.com/article/2011/02/05/uk-britain-radicalisation-idUKTRE71401G20110205 (accessed on 29 August 2011).

Appendices

A. Proof of Equation (13)

By substituting Equations (10)–(12) into Equation (9):
P int ( a ¬ a , i , t ) = k = 1 n - 1 j P ( a | j , k , ¬ a , i , t ) P ( j | k , ¬ a , i , t ) P ( k | ¬ a , i , t ) = k = 1 n - 1 1 ζ ( α i ) k - α i j 1 - i = 1 m ( 1 - c i i ) j i k ! j 1 ! · · · j m ! ( k - j ) ! i = 1 m P ( a | i , t ) j i ( 1 - P ) k - j = 1 - k = 1 n - 1 1 ζ ( α i ) k - α i j i = 1 m ( 1 - c i i ) j i k ! j 1 ! · · · j m ! ( k - j ) ! i = 1 m P ( a | i , t ) j i ( 1 - P ) k - j = 1 - k = 1 n - 1 1 ζ ( α i ) k - α i j k ! j 1 ! · · · j m ! ( k - j ) ! i = 1 m ( 1 - c i i ) P ( a | i , t ) j i ( 1 - P ) k - j = 1 - k = 1 n - 1 1 ζ ( α i ) k - α i i = 1 m ( 1 - c i i ) P ( a | i , t ) + ( 1 - P ) k (by the multinomial theorem) = 1 - k = 1 n - 1 1 ζ ( α i ) k - α i 1 - i = 1 m c i i P ( a | i , t ) k

B. Proof of Equation (15)

Let the base of the numerator in Equation (13) be x:
x 1 - i = 1 m c i i P ( a | i , t ) , x [ 0 , 1 ]
Then, having the power-law exponent α fixed, the internal new adoption probability can be viewed as a function of x:
P int ( a ¬ a , i , t ) = 1 - 1 ζ ( α ) k = 1 n - 1 x k k α f ( x )
Since the derivative of f ( x ) is:
f ( x ) = - 1 ζ ( α ) k = 1 n - 1 x k - 1 k α - 1
the Taylor expansion of f ( x ) at x = 1 is:
P int ( a ¬ a , i , t ) = f ( x ) f ( 1 ) + f ( 1 ) ( x - 1 ) = - ζ ( α - 1 ) ζ ( α ) ( x - 1 ) = ζ ( α - 1 ) ζ ( α ) i = 1 m c i i P ( a | i , t )
which is equivalent with the Taylor expansion of P int ( a ¬ a , i , t ) at all P ( a | i , t ) = 0 .

