A New Entropy Optimization Model for Graduation of Data in Survival Analysis

Abstract
:1. Introduction
2. Review of Entropy Optimization Principles
 , where
 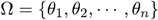 and which is unknown and need to be estimated by some known information denoted by such as mean value, variance, jth moment, etc. Mathematically, MaxEnt can be described as the following optimization model:
3. Data Graduating with Entropy Optimization Principles
 , which is:

 . However, is just an estimation of qx which has to be graduated to approximate the real mortality probability as closely as possible. This process is called graduation of data in life insurance.
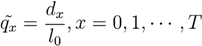
 can meet requirements of probability distribution, and it may be stated that:
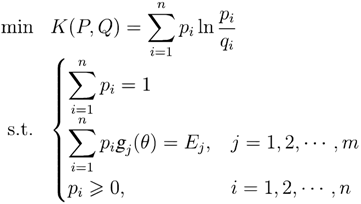
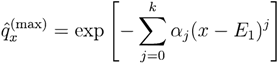
 , the estimation of qx, can achieved once is determined. can be described as:
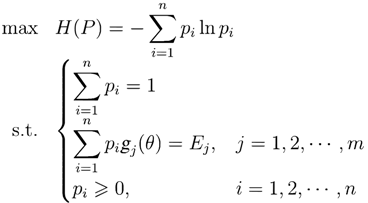
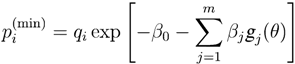
 is the estimation of , E1 is the mean value of sample data and Ej is the jth moment. can be viewed as a prior distribution of death probability, then a MinCEnt model can be established to estimation of as:


| Time Interval(x) | Death Population (dx) | Death Probability ( ) |
|---|---|---|
| 1 | 3 | 0.0144 |
| 2 | 3 | 0.0144 |
| 3 | 6 | 0.0288 |
| 4 | 6 | 0.0288 |
| 5 | 16 | 0.0769 |
| 6 | 14 | 0.0673 |
| 7 | 25 | 0.1202 |
| 8 | 20 | 0.0962 |
| 9 | 32 | 0.1530 |
| 10 | 25 | 0.1202 |
| 11 | 27 | 0.1298 |
| 12 | 13 | 0.0625 |
| 13 | 11 | 0.0529 |
| 14 | 7 | 0.0337 |
| Experiment Data | Results of MaxEnt(up to Ej) | Results of MinCEnt(up to Ej) | |||||||||
|---|---|---|---|---|---|---|---|---|---|---|---|
| x | | E1 | E2 | E3 | E4 | E5 | E1 | E2 | E3 | E4 | E5 |
| 1 | 0.0144 | 0.0447 | 0.0074 | 0.0115 | 0.0131 | 0.0126 | 0.0144 | 0.0144 | 0.0144 | 0.0144 | 0.0144 |
| 2 | 0.0144 | 0.0478 | 0.0147 | 0.0177 | 0.0177 | 0.0180 | 0.0144 | 0.0144 | 0.0144 | 0.0144 | 0.0144 |
| 3 | 0.0288 | 0.0511 | 0.0264 | 0.0271 | 0.0258 | 0.0263 | 0.0288 | 0.0288 | 0.0288 | 0.0288 | 0.0288 |
| 4 | 0.0288 | 0.0546 | 0.0434 | 0.0407 | 0.0386 | 0.0389 | 0.0288 | 0.0288 | 0.0288 | 0.0288 | 0.0288 |
| 5 | 0.0769 | 0.0583 | 0.0648 | 0.0587 | 0.0570 | 0.0567 | 0.0769 | 0.0769 | 0.0770 | 0.0769 | 0.0770 |
| 6 | 0.0673 | 0.0624 | 0.0882 | 0.0806 | 0.0805 | 0.0797 | 0.0673 | 0.0673 | 0.0674 | 0.0674 | 0.0674 |
| 7 | 0.1202 | 0.0667 | 0.1094 | 0.1036 | 0.1058 | 0.1050 | 0.1202 | 0.1202 | 0.1203 | 0.1203 | 0.1204 |
| 8 | 0.0962 | 0.0712 | 0.1237 | 0.1230 | 0.1264 | 0.1265 | 0.0962 | 0.0962 | 0.0962 | 0.0963 | 0.0963 |
| 9 | 0.1538 | 0.0762 | 0.1274 | 0.1329 | 0.1353 | 0.1363 | 0.1538 | 0.1538 | 0.1538 | 0.1538 | 0.1538 |
| 10 | 0.1202 | 0.0814 | 0.1195 | 0.1288 | 0.1284 | 0.1293 | 0.1202 | 0.1202 | 0.1202 | 0.1202 | 0.1201 |
| 11 | 0.1298 | 0.0870 | 0.1022 | 0.1105 | 0.1076 | 0.1076 | 0.1298 | 0.1298 | 0.1297 | 0.1297 | 0.1297 |
| 12 | 0.0625 | 0.0930 | 0.0796 | 0.0827 | 0.0797 | 0.0789 | 0.0625 | 0.0625 | 0.0625 | 0.0624 | 0.0625 |
| 13 | 0.0529 | 0.0994 | 0.0565 | 0.0532 | 0.0527 | 0.0520 | 0.0529 | 0.0529 | 0.0529 | 0.0529 | 0.0529 |
| 14 | 0.0337 | 0.1063 | 0.0366 | 0.0290 | 0.0315 | 0.0321 | 0.0337 | 0.0337 | 0.0337 | 0.0337 | 0.0337 |
| 0.3237 | 0.0432 | 0.0342 | 0.0334 | 0.0334 | 0.0000 | 0.0000 | 0.0000 | 0.0000 | 0.0000 | ||
 | 0.0000 | 0.0000 | 0.0001 | 0.0001 | 0.0001 | 0.6184 | 0.6184 | 0.6184 | 0.6184 | 0.6184 | |
| x | | MaxEnt | MLE | BE |
|---|---|---|---|---|
| 1 | 0.0144 | 0.0126 | 0.0311 | 0.0321 |
| 2 | 0.0144 | 0.0180 | 0.0168 | 0.0173 |
| 3 | 0.0288 | 0.0263 | 0.0244 | 0.0249 |
| 4 | 0.0288 | 0.0389 | 0.0349 | 0.0354 |
| 5 | 0.0769 | 0.0567 | 0.0491 | 0.0496 |
| 6 | 0.0673 | 0.0797 | 0.0676 | 0.0680 |
| 7 | 0.1202 | 0.1050 | 0.0901 | 0.0902 |
| 8 | 0.0962 | 0.1265 | 0.1144 | 0.1140 |
| 9 | 0.1538 | 0.1363 | 0.1351 | 0.1342 |
| 10 | 0.1202 | 0.1293 | 0.1437 | 0.1423 |
| 11 | 0.1298 | 0.1076 | 0.1310 | 0.1297 |
| 12 | 0.0625 | 0.0789 | 0.0953 | 0.0948 |
| 13 | 0.0529 | 0.0520 | 0.0501 | 0.0505 |
| 14 | 0.0337 | 0.0321 | 0.0165 | 0.0170 |
| 0.0334 | 0.0756 | 0.0737 | ||
 | 0.0001 | 0.0008 | 0.0007 | |
- (1)
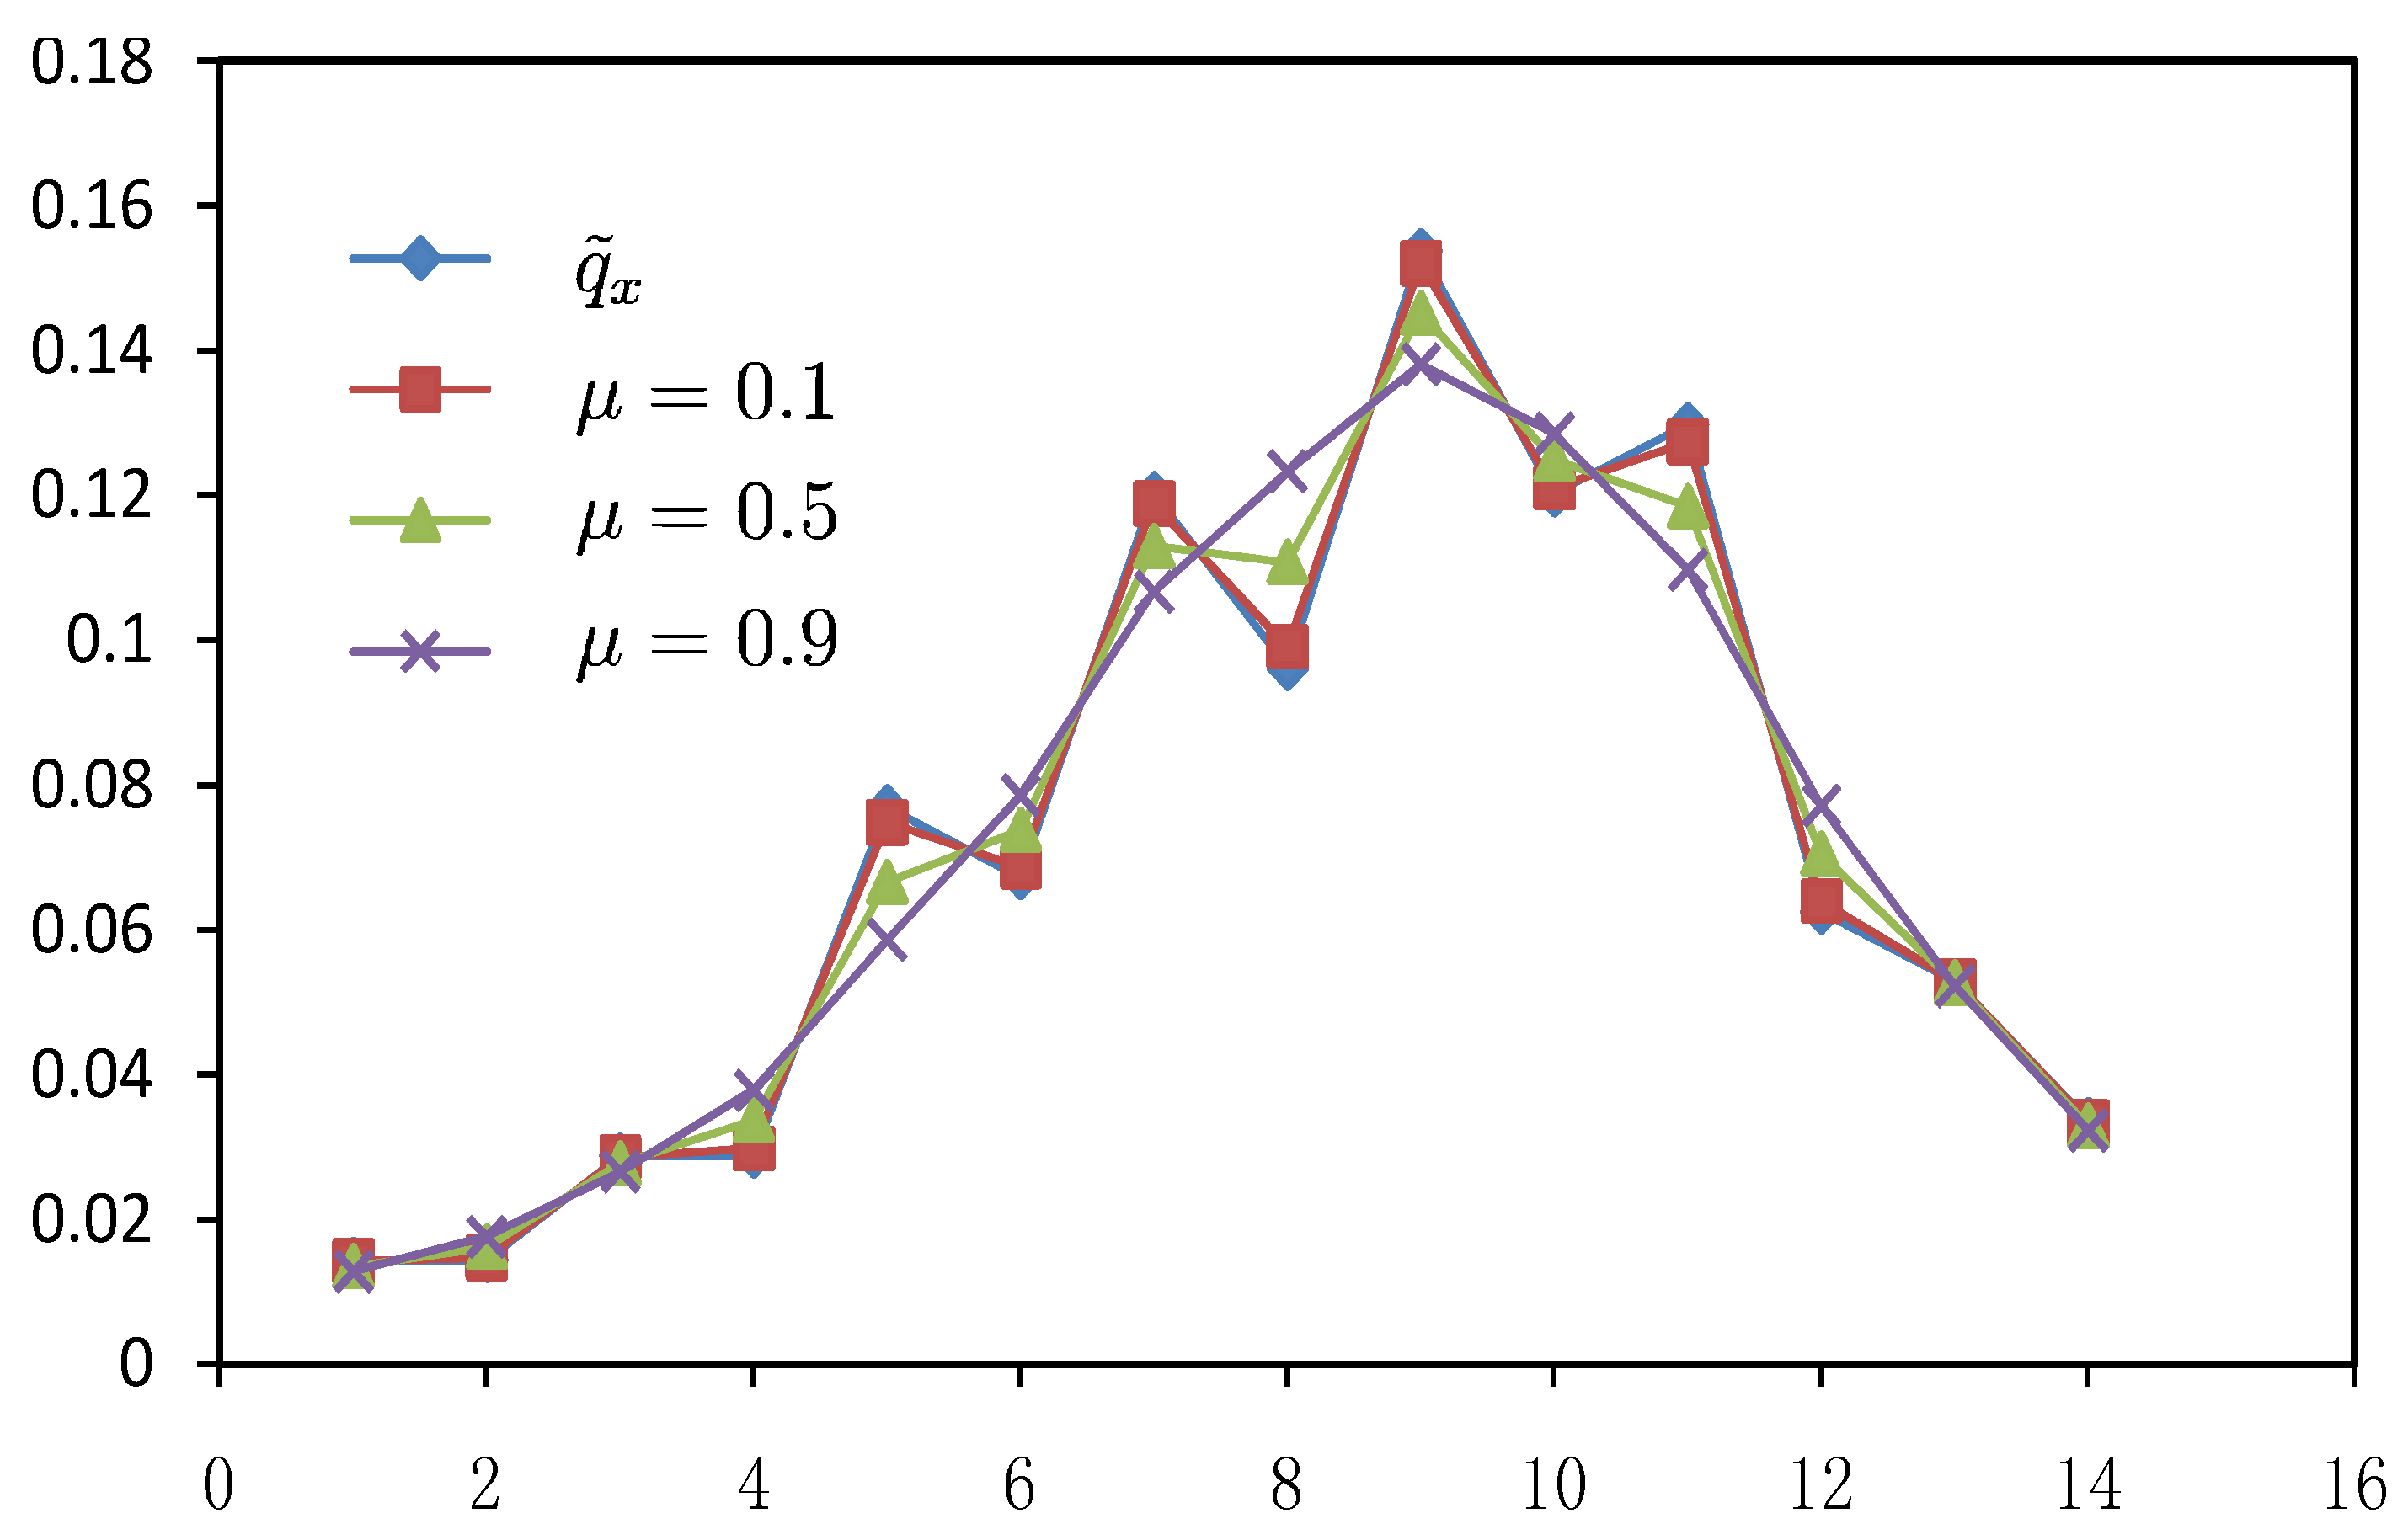
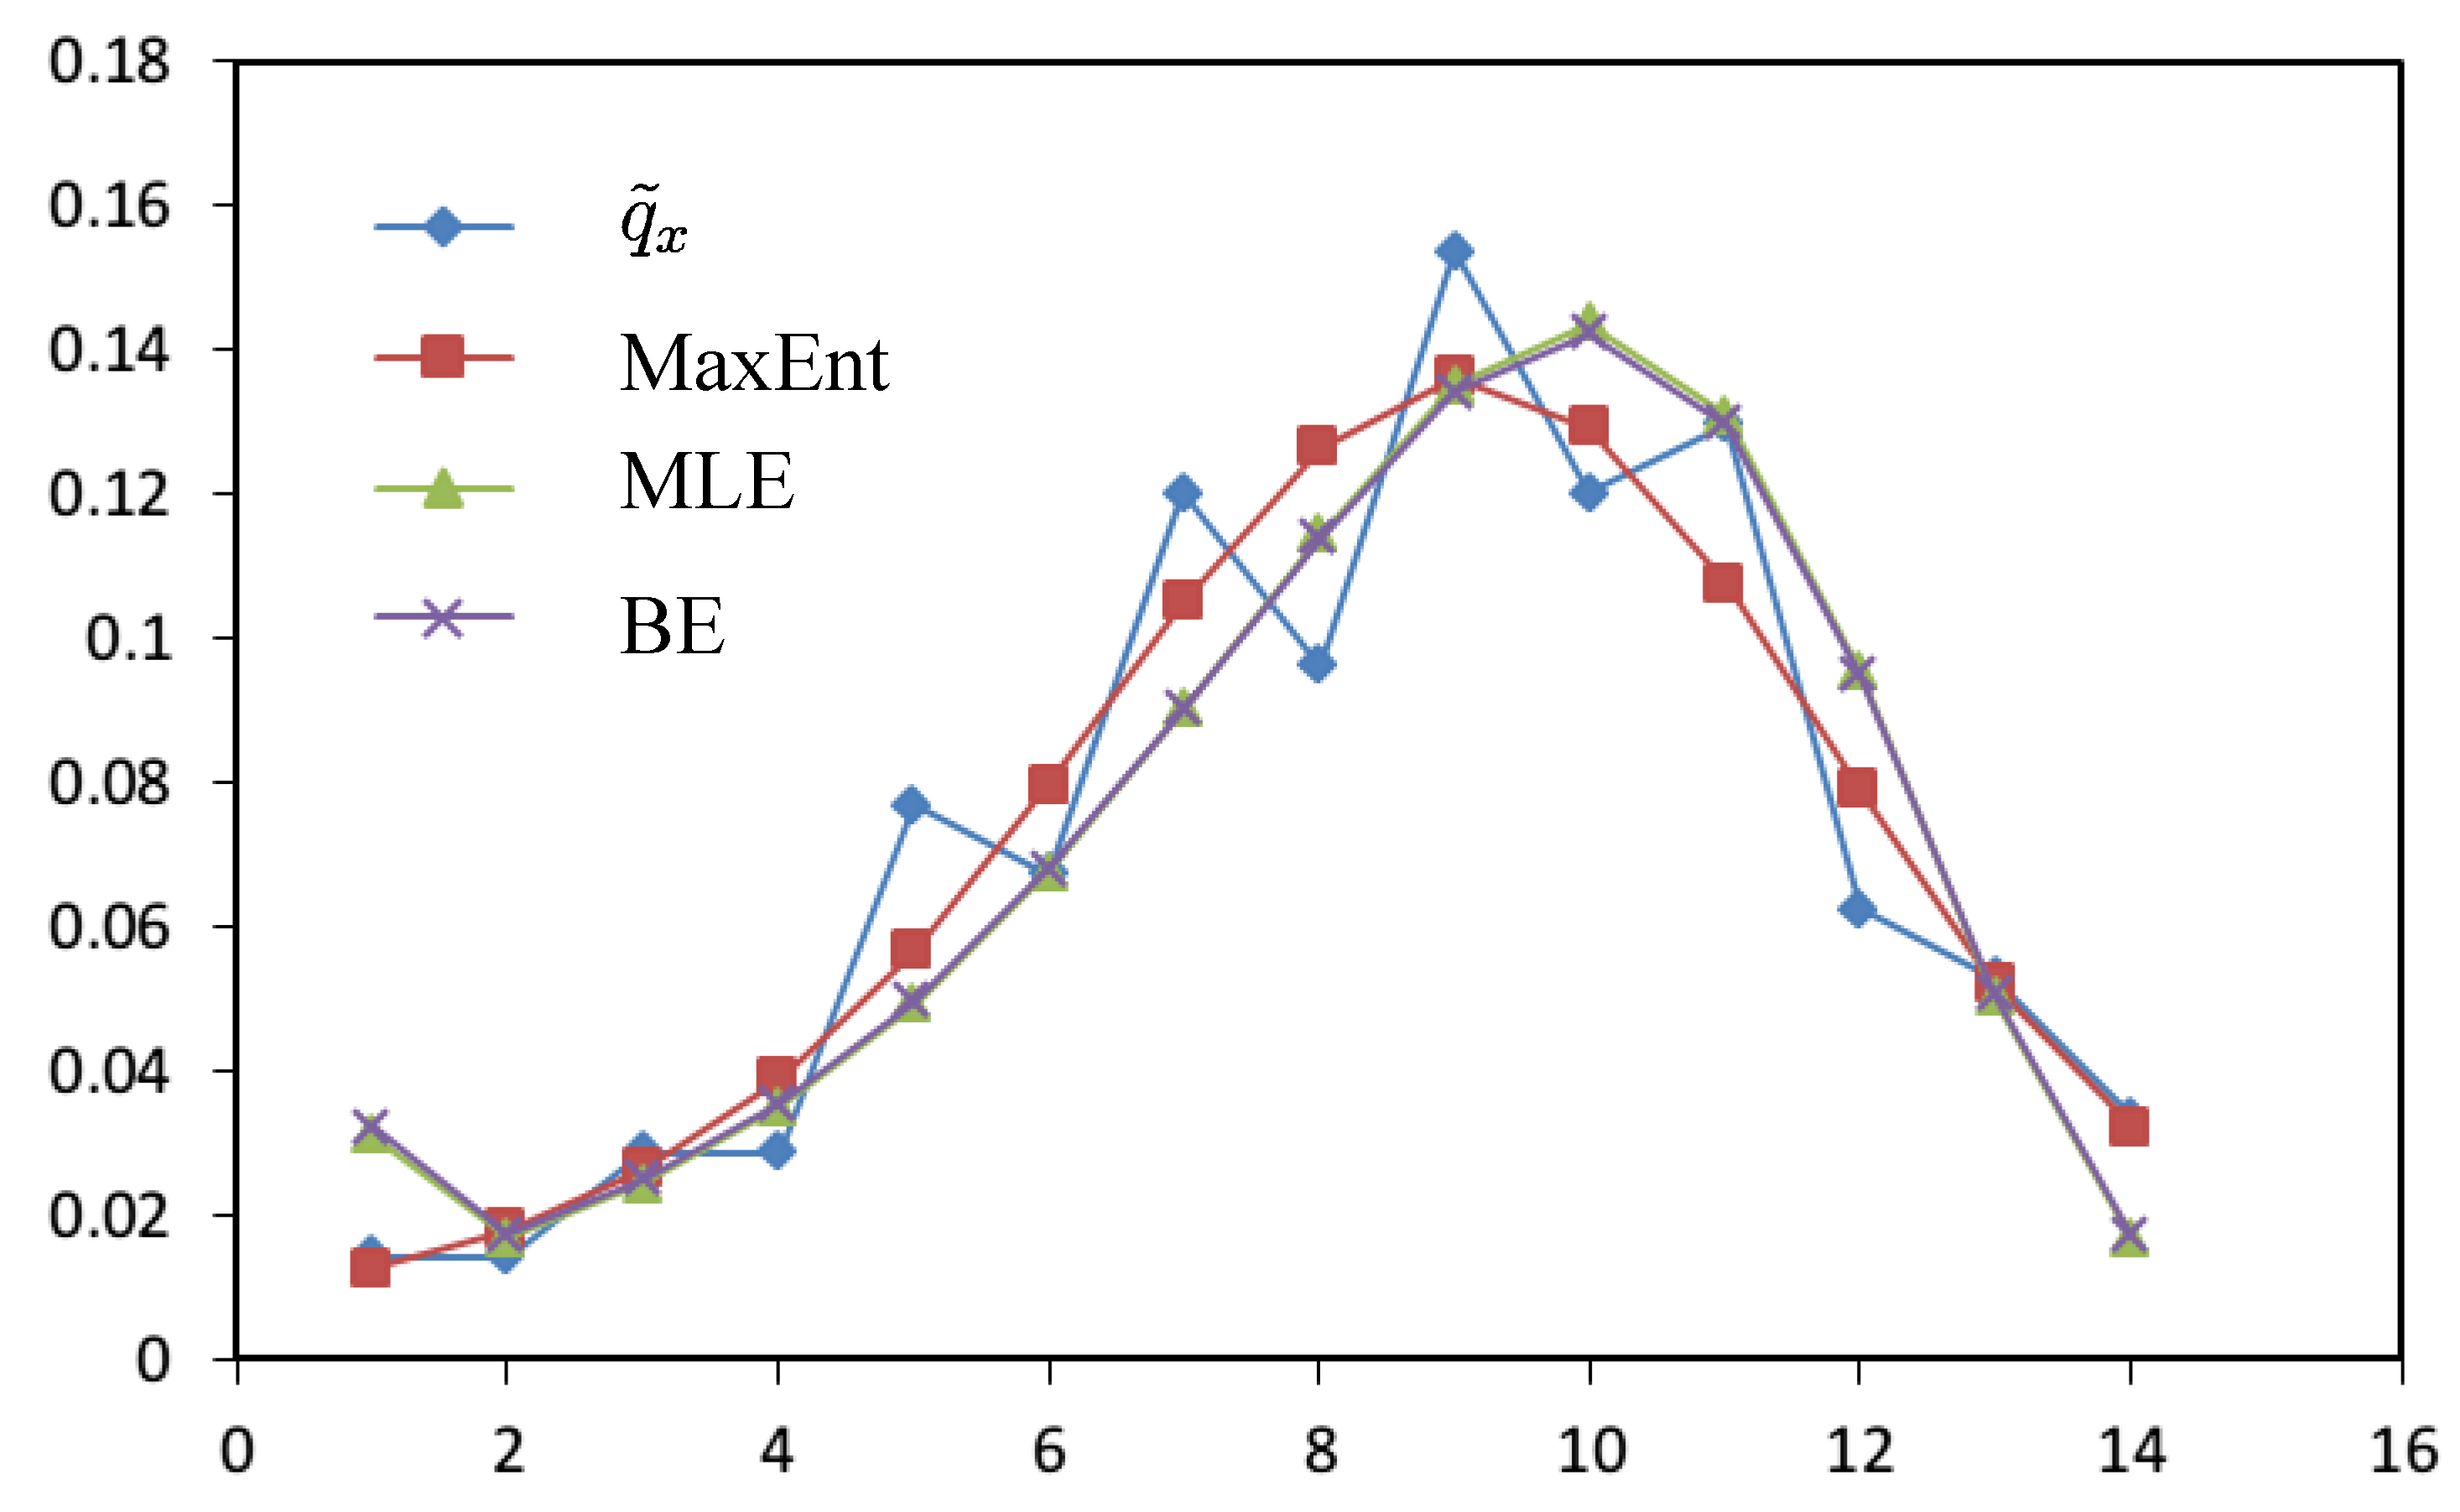
- From Table 3, results of MaxEnt have smaller value(a measure of goodness of fit to original data and calculated by Euclidean distance) and
![Entropy 14 01306 i017]() (a measure of smoothness by using 4th-moment of difference) than the results of MLE and BE approach. Hence, MaxEnt method of data graduating can be thought as a better method.
(a measure of smoothness by using 4th-moment of difference) than the results of MLE and BE approach. Hence, MaxEnt method of data graduating can be thought as a better method. - (2)
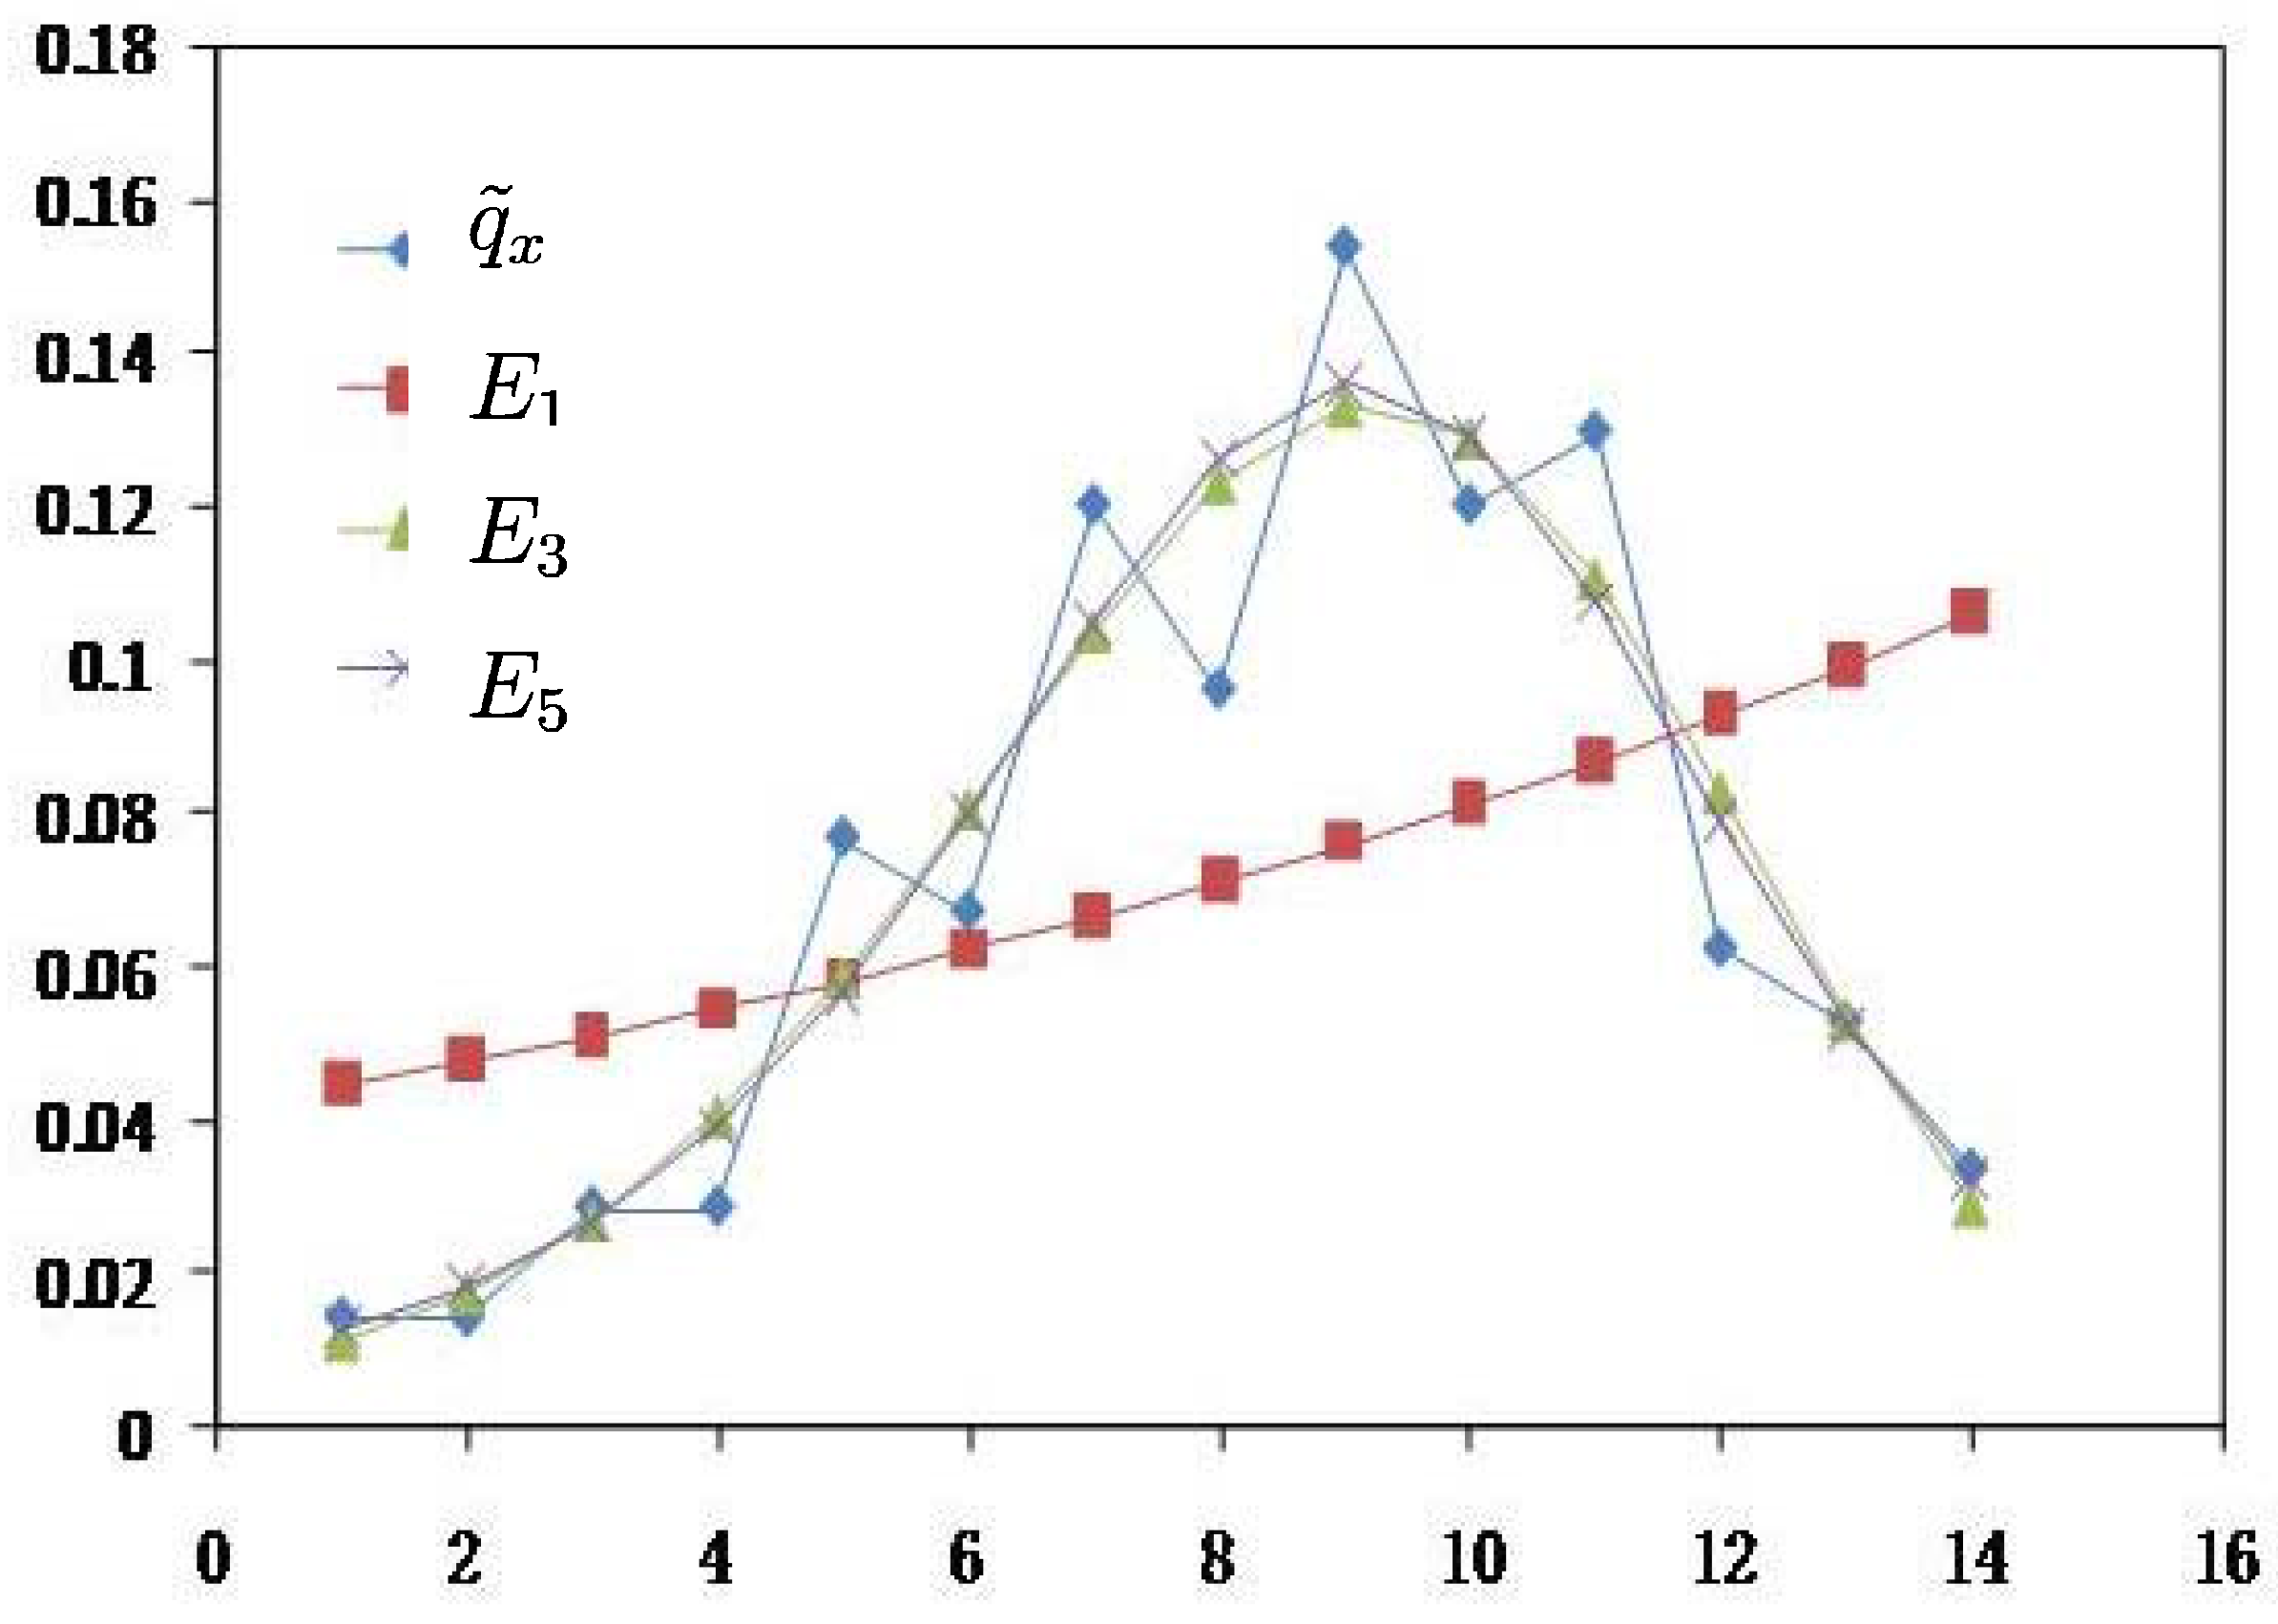
- From Table 2, results of the MinCEnt approach are the same as the prior distribution, and the reason is that
![Entropy 14 01306 i011]() and Ej are calculated from the experimental data. If
and Ej are calculated from the experimental data. If ![Entropy 14 01306 i011]() or Ej is given by other information, the results will be different from the prior distribution. However, from this extreme situation we can find that MinCEnt focuses on the goodness of fit in data graduation.
or Ej is given by other information, the results will be different from the prior distribution. However, from this extreme situation we can find that MinCEnt focuses on the goodness of fit in data graduation. - (3)
- Comparing with the MinCEnt approach, the MaxEnt approach is better from the viewpoint of the smoothness of data graduation and is worse from the point of view of goodness of fit.
4. Data Graduating by Combining MaxEnt and MinCEnt
 is the prior of mortality,
  is the estimated mortality, i.e., result of data graduation, and
  is the
  difference of (usually
  or higher).
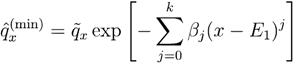
  is a weight coefficient and h is a positive adjustment factor between goodness of fit and smoothness. This method is widely used and has become a basic logic in graduation of data and many other approaches currently follow this lead. Generally speaking, the characteristics of different data graduation methods may lie on two sides, putting different emphasis on the goodness of fit and smoothness, and on how to measure smoothness and goodness of fit. Therefore, graduation of data can be looked as a bi-objective question. On one hand, the graduation results should be smooth and on the other hand they should be close to the original data. From the above section, it has shown that results of MaxEnt data graduation is smoother while those of MinCEnt is closer to the original data, so we propose a new approach of data graduation which can combine the both methods as in the following model:
| Experimental Data | Combination Method | |||||
|---|---|---|---|---|---|---|
| x | | |||||
| 1 | 0.0144 | 0.0142 | 0.0139 | 0.0135 | 0.0132 | 0.0128 |
| 2 | 0.0144 | 0.0147 | 0.0154 | 0.0162 | 0.0169 | 0.0176 |
| 3 | 0.0288 | 0.0286 | 0.0282 | 0.0277 | 0.0272 | 0.0266 |
| 4 | 0.0288 | 0.0298 | 0.0317 | 0.0337 | 0.0358 | 0.0378 |
| 5 | 0.0769 | 0.0749 | 0.0707 | 0.0666 | 0.0626 | 0.0586 |
| 6 | 0.0673 | 0.0687 | 0.0713 | 0.0738 | 0.0762 | 0.0786 |
| 7 | 0.1202 | 0.1189 | 0.116 | 0.113 | 0.1099 | 0.1067 |
| 8 | 0.0962 | 0.0991 | 0.1048 | 0.1108 | 0.1169 | 0.1233 |
| 9 | 0.1538 | 0.1521 | 0.1487 | 0.1452 | 0.1416 | 0.1381 |
| 10 | 0.1202 | 0.1211 | 0.1231 | 0.125 | 0.1268 | 0.1285 |
| 11 | 0.1298 | 0.1274 | 0.123 | 0.1185 | 0.1141 | 0.1097 |
| 12 | 0.0625 | 0.064 | 0.0672 | 0.0705 | 0.0738 | 0.0772 |
| 13 | 0.0529 | 0.0529 | 0.0528 | 0.0527 | 0.0525 | 0.0522 |
| 14 | 0.0337 | 0.0335 | 0.0332 | 0.0329 | 0.0326 | 0.0323 |
5. Conclusions
Acknowledgments
References
- Broffitt, J.D. Maximum likelihood alternatives to actuarial estimators of mortality rates. Trans. Soc. Actuar. 1984, 36, 77–142. [Google Scholar]
- Zhou, J.; Liu, J.; Li, Y. The Theory of Constructing Life Table; Nankai University Press: Tianjin, China, 2001. [Google Scholar]
- Dennis, T.H.; Fellingham, G.W. Likelihood methods for combining tables of data. Scand. Actuar. J. 2000, 2, 89–101. [Google Scholar]
- Singh, A.K.; Ananda, M.A.; Dalpatadu, R. Bayesian estimation of tabular survival models from complete samples. Actuar. Res. Clear. House 1993, 1, 335–342. [Google Scholar]
- Ananda, M.M.; Dalpatadu, R.J.; Singh, A.K. Estimating parameters of the force of mortality in actuarial studies. Actuar. Res. Clear. House 1993, 1, 129–141. [Google Scholar]
- Haastrup, S. Comparison of some Bayesian analysis of heterogeneity in group life insurance. Scand. Actuar. J. 2000, 1, 2–16. [Google Scholar] [CrossRef]
- Nielson, A.; Lewy, P. Comparison of the frequentist properties of Bayes and the maximum likelihood estimators in an age structured fish stock assessment model. Can. J. Fish. Aquat. Sci. 2002, 59, 136–143. [Google Scholar] [CrossRef]
- Shannon, C.E. A mathematical theory of communication. Bell Syst. Tech. J. 1948, 27, 379–423, 623–656. [Google Scholar] [CrossRef]
- Jaynes, E.T. Information theory and statistical mechanics. Phys. Rev. 1957, 106, 620–630. [Google Scholar] [CrossRef]
- Jaynes, E.T. Information theory and statistical mechanics II. Phys. Rev. 1957, 108, 171–190. [Google Scholar] [CrossRef]
- Kullback, S.; Leibler, R.A. On information and sufficiency. Ann. Math. Stat. 1951, 22, 79–86. [Google Scholar] [CrossRef]
- Kullback, S. Information Theory and Statistics; John Wiley and Sons: New York, NY, USA, 1959. [Google Scholar]
- Kapur, J.N.; Kesavan, H.K. Entropy optimization Principles with Applications; Academic Press Inc.: San Diego, CA, USA, 1992. [Google Scholar]
- Bohlmann, G. Ein Ausgleichungs Problem. In Nachrichten von der Königl Gesellschaft der Wissenschaften zu Göttingen, Mathematisch-physikalische Klasse; Horstmann, L., Ed.; Commissionsverlag der Dieterich’schen Universitätsbuchhandlung: Göttingen, Germany, 1899; pp. 260–271. [Google Scholar]
- Whittaker, E.T. On a new method of graduation. Proc. Edinb. Math. Soc. 1923, 41, 63–75. [Google Scholar]
- Henderson, R. A new method of graduation. Trans. Actuar. Soc. Am. 1924, 25, 29–53. [Google Scholar]
- Henderson, R. Further remarks on graduation. Trans. Actuar. Soc. Am. 1925, 26, 52–74. [Google Scholar]
- Alicja, S.N.; William, F.S. An extension of the Whittaker-Henderson method of graduation. Scand. Actuar. J. 2012, 1, 70–79. [Google Scholar]
© 2012 by the authors; licensee MDPI, Basel, Switzerland. This article is an open access article distributed under the terms and conditions of the Creative Commons Attribution license (http://creativecommons.org/licenses/by/3.0/).
Share and Cite
He, D.; Huang, Q.; Gao, J. A New Entropy Optimization Model for Graduation of Data in Survival Analysis. Entropy 2012, 14, 1306-1316. https://doi.org/10.3390/e14081306
He D, Huang Q, Gao J. A New Entropy Optimization Model for Graduation of Data in Survival Analysis. Entropy. 2012; 14(8):1306-1316. https://doi.org/10.3390/e14081306
Chicago/Turabian StyleHe, Dayi, Qi Huang, and Jianwei Gao. 2012. "A New Entropy Optimization Model for Graduation of Data in Survival Analysis" Entropy 14, no. 8: 1306-1316. https://doi.org/10.3390/e14081306
APA StyleHe, D., Huang, Q., & Gao, J. (2012). A New Entropy Optimization Model for Graduation of Data in Survival Analysis. Entropy, 14(8), 1306-1316. https://doi.org/10.3390/e14081306