Article

Scientific Élan Vital: Entropy Deficit or Inhomogeneity as a Unified Concept of Driving Forces of Life in Hierarchical Biosphere Driven by Photosynthesis

1
Department of Life Sciences, Graduate School of Arts and Sciences, University of Tokyo, Komaba, Meguro-ku, Tokyo 153-8902, Japan
2
JST, CREST, Sambancho, Chiyoda-ku, Tokyo 102-0075, Japan
Entropy 2012, 14(2), 233-251; https://doi.org/10.3390/e14020233
Submission received: 12 December 2011 / Revised: 22 January 2012 / Accepted: 7 February 2012 / Published: 10 February 2012
(This article belongs to the Special Issue Concepts of Entropy and Their Applications)

Abstract

:
Life is considered something different from non-living things, but no single driving force can account for all the different aspects of life, which consists of different levels of hierarchy, such as metabolism, cell physiology, multi-cellular development and organization, population dynamics, ecosystem, and evolution. Although free energy is evidently the driving force in biochemical reactions, there is no established relationship between metabolic energy and spatiotemporal organization of living organisms, or between metabolic energy and genetic information. Since Schrödinger pointed out the importance of exporting entropy in maintaining life, misunderstandings of entropy notion have been obstacles in constructing a unified view on the driving forces of life. Here I present a simplified conceptual framework for unifying driving forces of life at various different levels of hierarchy. The key concept is “entropy deficit”, or simply, ‘inhomogeneity’, which is defined as the difference of maximal possible entropy and actual entropy. This is equivalent to information content in genetic information and protein structure, and is also defined similarly for non-homogeneous structures in ecosystems and evolution. Entropy deficit or inhomogeneoity is a unified measure of all driving forces of life, which could be considered a scientific equivalent to ‘élan vital’ of Bergson.

1. Introduction

It may be generally accepted that all life on the Earth, except some chemolithotrophs in deep ocean, depends on photosynthesis, but it is not easy to envisage the importance and necessity of photosynthesis for the maintenance and development of all living beings. Schrödinger’s notion of negative entropy is famous [1], but in his time, the theory of entropy in photosynthesis was not fully understood, and this was the reason why various confusions were invoked later. Some people attacked him because entropy is always positive. The correct meaning of ‘negative entropy’ should be ‘decrease in entropy’ in a dynamic system [2]. Another confusion was that light had negative value of entropy, which was not correct at all. There are several books (at least in Japanese) written by physicists stating that photosynthesis is driven by entropy dissipation through transpiration (see [3] as an example). In 2005, a paper [4] appeared arguing for the negative change of entropy within the reaction center of photosystems, which was subsequently discussed by two papers [5,6]. We wonder why entropy is such a mysterious and magic word that provoked hot discussions in the biologists community.
Many textbooks on biochemistry explaining photosynthesis do not consider entropy in photochemical energy conversion, and calculate necessary number of photons per mole glucose fixed just by using the energy of photons [7]. The simple fact that about 1/4 (depending on assumptions and situations) of light energy absorbed by the reaction center cannot be used for performing work according to Carnot cycle efficiency [5,8] is not understood by most biologists. Note that we consider in this article only the situation in which the reaction center is directly excited by light, because light energy absorbed by the light-harvesting system can be considered in equilibrium with the incident light. Calculations of entropy in various processes of photosynthesis have been published [8] to give us some reliable hint on the entropy balance of the biosphere. A comparison of entropy balance in various types of photosystems was presented [9].
The entropy problem in photosynthesis is important because photosynthesis is the starting point of energy conservation in the whole biosphere. However, there is no consensus regarding what is really fixed or introduced by photosynthesis into the biological world. It is not ‘negative entropy’. It is often described, in textbooks on biochemistry, as the difference in redox state (electrochemical potential) in the Z-scheme [7,10,11], which must be a kind of free energy, but no explanation is given where the free energy come from. Has entropy nothing to do with the free energy gained in photosynthesis? If entropy is related to photosynthesis, what is the relationship of such entropy of photosynthesis with the entropy associated with various activities of life, such as DNA, cellular organization, or even evolution? Unfortunately, there is no single notion that can be used to describe driving forces in various biological processes at various different levels, such as metabolism, cellular processes, multicellular organization, individual dynamics of ecosystems, and evolution.
We therefore attempt in the present paper to clarify the meaning of entropy in the biosphere, which includes dynamically developing systems at various different levels of hierarchy. The key notion is ‘entropy deficit’, which is defined as the difference of entropy with respect to the possible maximal value of entropy. A new word ‘inhomogeneity’ (rather than heterogeneity) is proposed to denote entropy deficit in general, to include various forms of entropy, such as free energy, information, structural order, etc. A preliminary note of the present paper was published in Japanese [12].

2. Definitions

Let us start with the three major definitions of entropy.

2.1. Thermodynamic Entropy

In thermodynamics, when heat δq is transferred into a system at temperature T, a difference dS in entropy S is defined as follows [11,13,14,15]:
d S = δ q T
The third law of thermodynamics, which is derived from statistical mechanics (see Section 2.2), states that S = 0 at T = 0 (note that this ideal situation is only attained in perfect crystalline states). Using this rule, absolute value of S for any substance can be estimated by integrating specific heat from T = 0 to T = T1, where T1 is a given value of temperature.

2.2. Entropy in Statistical Mechanics

In a microcanonical system, entropy is defined by using the number of microscopic states W giving an identical macroscopic state [13,15,16]:
S = k B ln W
where kB is Boltzmann constant (1.380 × 10⁻²³ J K−1). In a more general way, if the probabilities pi of various microscopic states i are not identical, entropy is defined as follows:
S = k B i p i ln p i
where the sum of pi is unity.

2.3. Entropy in Information Theory

In information theory, average information content H(P) is defined as Shannon’s information entropy [2,17]:
H ( P ) = i p i log 2 p i
where pi is defined as the probability of event i, and the sum of pi equals to unity. P is a set of pi. The definition of information entropy is identical to the statistical entropy except the Boltzmann constant if natural logarithm is used in both cases, but information entropy is normally expressed using a logarithm of base 2, and its unit is called “bit”. One bit is a minimal unit of information, which is required for Maxwell’s daemon to recognize a single molecule, and corresponds to kB ln2 = 0.956 × 10⁻²³ J K−1 [2]. If we consider the entropy of information-carrying molecules such as DNA, H(P) (per molecule) can be converted to S (per mole) by the following relationship:
S = R ln 2 H ( P )
where R is the gas constant R = NA kB (NA is the Avogadro number).
The definition in Section 2.1 appears to be quite different from those in Section 2.2 and Section 2.3, but is shown to be identical to the second definition, if the number of various ways of distribution of energy at many levels is used as the number of microscopic states [15,16]. The relationship of information entropy and the statistical mechanical entropy was established by Jaynes [18,19], who introduced the notion of maximal entropy to interpret the thermodynamic entropy in terms of information entropy.

2.4. Order and Inhomogeneity

We will consider another notion ‘order’. Order O is defined by Landsberg [20] in the following way:
O = ( S max S ) / S max
where S is the entropy of a system, while Smax is the entropy of the system if all possible variables are made as random as possible. Now, entropy deficit or inhomogeneity I is defined as follows:
I = S max S
In other words, O = I/Smax. We can consider O as a ‘normalized inhomogeneity’. We prefer to use inhomogeneity rather than ‘order’, because, in many cases, non-homogeneous states do not appear to be in order. We also prefer to use inhomogeneity rather than heterogeneity, because it is a measure of non-homogeneous state, or the difference of a state from the homogeneous state. In the following description, we will use entropy deficit and inhomogeneity as synonyms, but we will use them as appropriate according to subjects. We must also note that entropy deficit was called bound entropy by Brillouin as opposed to free entropy [2], but we regret that the meaning of these words is not clear. The same measure has been used to evaluate inhomogeneity of data distribution in the bioinformatic software Gclust that the author developed [21].

3. Generalized Entropy Deficit or Inhomogeneity in Biochemical Reactions

In metabolism, any biochemical reaction that proceeds spontaneously accompanies decrease in free energy, but entropy does not necessarily increases. However, we can consider difference in free energy divided by temperature as a measure of inhomogeneity. Increment in Gibbs free energy ∆G is expressed by increment in enthalpy ∆H, increment in entropy ∆S and temperature T:
Δ G = Δ H T Δ S
According to Atkins and de Paula [14], Equation (8) can be rewritten in the following form:
Δ G / T = Δ H / T + Δ S
Here, −∆H/T represents ‘entropy change in the environment’ caused by the transfer of heat out of the system into the environment. In other words, this term represents dissipation of heat (if there is no pressure changes and no non-mechanical work), in which the heat localized within the system is now distributed in the whole universe. Namely, this corresponds to homogenization of inhomogeneity in spatial distribution of heat. The term ∆S in Equation (8), on the other hand, represents ‘entropy change within the system’, which corresponds to the homogenization of inhomogeneity in both intramolecular energy distribution at various energy levels and spatial distribution of molecules within the system. These being in mind, we can agree with Atkins and de Paula in that the term –∆G/T represents ‘entropy change in the whole universe’, which we will define as the increment in generalized entropy ∆S*. Likewise, we can define generalized entropy: S* = –G/T. Then:
Δ G / T Δ S * = S * 2 S * 1
where S*1 and S*2 represent generalized entropies before and after the reaction. In accordance with the definition of entropy deficit or inhomogeneity in the former section, we consider S*2 as the maximal entropy S*max, and we can define inhomogeneity I = S*maxS*, where S*S*1. The inhomogeneity thus defined represents possible entropy increase inherent in the system, and thus a possible driving force of biochemical change. The inhomogeneity is expressed as an equilibrium quantity associated with reaction, but this is to emphasize the real driving force of the reaction or process. The real value of entropy during the reaction or process should be considered in a separate calculation.
The meaning of metabolic inhomogeneity thus defined is that it is equivalent to and exchangeable with the inhomogeneity in information or spatiotemporal organization. We will consider various forms of inhomogeneity in the biosphere in the next section.

4. Forms of Inhomogeneity in Macromolecules, Cells, Organisms and the Whole Bioshere

In ‘What is Life?’ of Schrödinger [1], orderliness was used as a metaphor representing organization of cells and animals. The exact meaning and mathematical expression of biological orderliness was elaborated later, first in the genetic information, and then in protein structure.

4.1. Inhomogeneity in Genetic Information

Net average information content H(P) of a DNA sequence consisting of N base-pairs is formally given by the following formula [22,23]:
H ( P ) = i j p i j log 2 p i j
i p i j log 2 p i j = 1   ( for each   j )
where pij represents the fraction of nucleotide i at position j. In reality, H(P) should be corrected for low sequence complexity. On average, the information content of real DNA is about 1.7–1.9 bits/nucleotide depending on compression models and DNA sequences analyzed [24], whereas the theoretical maximum is H(P)max = N log2(4) or 2.0 bits/nucleotide for equal occurrence of nucleotides. For protein sequences, information content is determined by estimating the limiting conditional Shannon entropy ( I = lim k I k in [23]), or by Zipf and k-tuplet analysis [23]. The resultant information content is about 2.5 bits/amino acid on average, whereas the theoretical maximum is H(P)max = N log2(20) or 4.32 bits/amino acid for equal occurrence of amino acids. Such reduction in information content due to low complexity is composed of compositional low complexity ΔH(P)comp and sequence-dependent low complexity due to occurrence of repeats ΔH(P)repeat. In addition, at each position of DNA sequence, evolutionary or functional constraint is imposed on pij, but this is not apparent in dealing with a single sequence. Although the sequence constraint must be calculated for multiple alignments [22], the information content in the sites of low conservation ΔH(P)constraint should be considered even in dealing with a single sequence, because this represents the variability of the sequence. The information content of a sequence can be estimated by Equation (11) using the average nucleotide content:
H ( P ) = N i p i log 2 p i Δ H ( P ) repeat Δ H ( P ) constraint
where pi represents average frequency of nucleotide i:
p i = 1 N j p i j
which is assumed to be applicable for the entire sequence. The first term in Equation (13) includes compositional effect. Namely, we define compositionally maximum sequence entropy:
N i p i log 2 p i = H ( P ) * max = H ( P ) max Δ H ( P ) comp
If we define:
H ( P ) internal = Δ H ( P ) repeat + Δ H ( P ) constraint
We obtain:
H ( P ) = H ( P ) * max H ( P ) internal
This can be converted to statistical mechanical entropy if logarithm of base e is used and the value is multiplied by Boltzmann constant. The first term H(P)*max in Equation (17) corresponds to Smax, which is maximal (=N log24) if probabilities of base occurrence are equal. The second term H(P)internal represents variability of sequence that corresponds to entropy S, which should be zero if regularity of sequence and sequence conservation is not considered. S may be positive if the sequence conservation in evolution is not high, namely, various partial sequences are allowed biologically. The sequence redundancy (or abundance of repeats) also contributes in increasing S. In this way, the information content of a DNA sequence is written in a form of inhomogeneity: I = SmaxS. A similar formulation can be drawn for amino acid sequences of a protein [23].

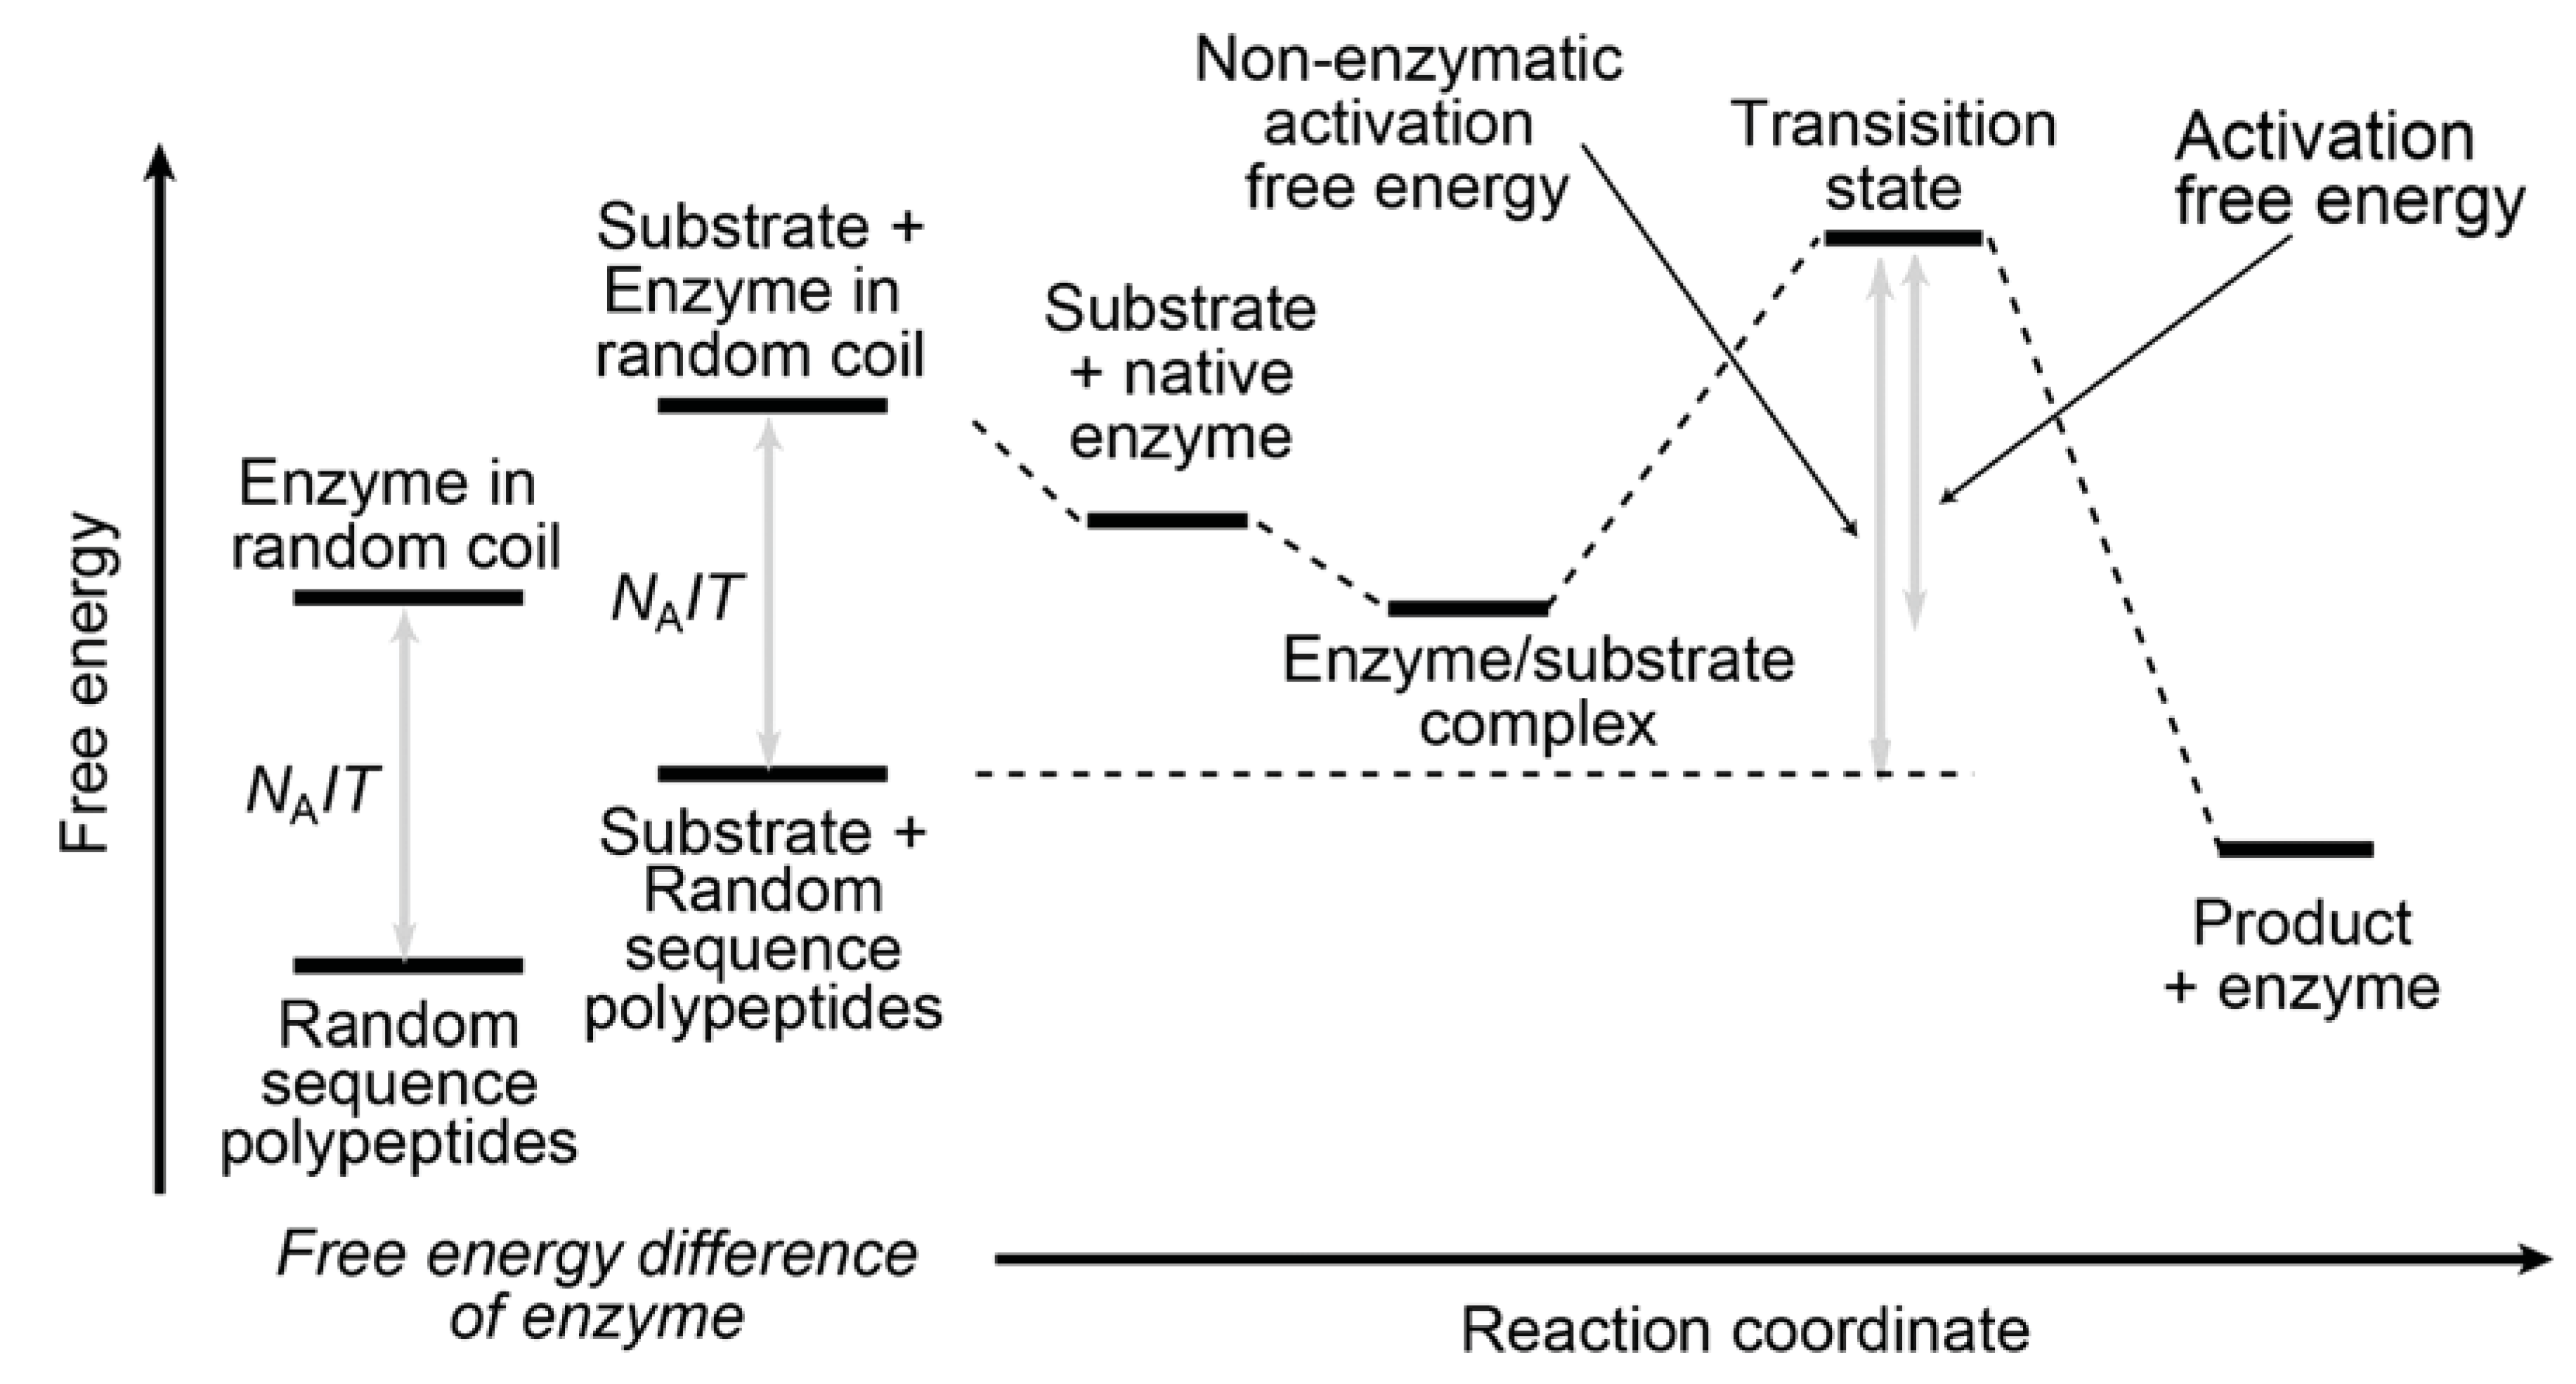
4.2. Inhomogeneity of an Enzyme

The entropy deficit/inhomogeneity of a protein (enzyme) sequence is a source for free energy change accompanying formation of three-dimensional structure [25,26]. The information content of a protein structure is estimated to be about 0.5 bits per amino acid residue [26]. Sequence complexity is known to increase with evolution. Let us consider a set of polypeptides of random amino acid sequences, all having an identical composition of amino acids that corresponds to that of an authentic enzyme. The chemically defined free energies of such polypeptides must be identical for all polypeptides in disordered conformation. Each polypeptide of different sequence assumes different conformation. The native structure of the authentic enzyme is regarded as one of the possible conformations that the set of polypeptides assume, and thus carries an inhomogeneity. The structural orderliness or structural inhomogeneity must be a part of the sequence inhomogeneity. A detailed estimation of the structural entropy was presented by Dewey [25].
We consider that structural inhomogeneity is a cause of decreased activation energy of an enzyme. It is this inhomogeneity that makes possible both specific binding of substrates to the enzyme and specific reaction on the substrates. This corresponds to the situation, in which the free energy of the enzyme is higher than the mixture of hypothetical polypeptides of the identical amino acid composition (Figure 1, left). Let us consider that only W polypeptides are enzymatically active among all Wmax possible polypeptides. Then, we can include a probability factor W/Wmax as part of the ‘activity’ (in the sense of thermodynamics, namely, a kind of effective concentration) of the enzyme. We consider that the virtual chemical potential of the enzyme must be higher than the chemical potential of the mixture of hypothetical random polypeptides of the identical amino acid composition by R T ln (Wmax/W) = NA I T, where I represents inhomogeneity kB ln (Wmax/W). This factor looks small, but, in fact, the increment of virtual chemical potential could be in the order of several hundreds kJ mol−1 for a polypeptide consisting of 200 amino acid residues containing equal number of each amino acid.
In other words, an enzyme is considered to have a higher free energy, which is a source of stabilization energy of native enzyme structure and of binding with substrates. This is the source of reduction in activation energy of an enzyme-catalyzed reaction (Figure 1). Such argument is a natural consequence from the consideration on entropy of an enzyme, but no such formal description is found in textbooks of enzymology. In addition, the inhomogeneity of an enzyme is a source of inhomogeneity of metabolic network, which will be treated in a future study.
Figure 1. A schematic model of lowered activation energy in enzyme reaction. Active enzyme is just a fraction of all possible polypeptides of identical amino acid composition, and therefore, has a lower entropy than the random mixture of polypeptides. This increases the activity (in the sense of thermodynamics meaning effective concentration) of the enzyme. This is the source of stabilization energy of native enzyme and enzyme/substrate complex, and consequently, the lowered activation energy. Redrawn with enhancement from Figure 1 in [12].
Entropy 14 00233 g001

4.3. Inhomogeneity of Spatial Distribution

Entropy deficit/inhomogenetity can be defined for distribution of cells within a multicellular system, spatiotemporal distribution of individuals and interaction of individuals within an ecological system [27], although we do not discuss them in detail here. Essentially, the same type of formulation as in Equation (3) can be used. Theoretical formulation using entropy has been attempted in metabolic network [28] and ecological circulation of materials [29]. Formation of spatiotemporal structure is considered as self-organization or emergence, essentially driven by positive feedback. In this case, a large amount of entropy dissipation (large loss of inhomogeneity) engenders organization (a small gain of inhomogeneity). The large increase in entropy to be dissipated corresponds to the initial inhomogeneity, and the small entropy to be reduced during an organization corresponds to a gain of inhomogeneity, which will be used for further organization at a different level.
In applying this theory to ecological systems, we will also have to consider information input due to environmental factors, such as landscape, climate, and seasonal changes among others, which we do not discuss further in the current context.

4.4. Inhomogeneity of Motion

Inhomogeneity of motion can be defined by deficit in generalized entropy. Entropy of movement of many particles can be calculated by directional constraint, while generalized entropy is defined using motion energy E, directional entropy S and temperature T. Here, we do not need to consider the term pV which constitute the enthalpy in thermodynamics. Motion energy can be given by:
E = 1 2 i m i v i 2
where mi and vi are the mass and velocity of particle i. Directional entropy [30] can be defined, according to image processing techniques, simply as:
S = k B n M n p n ln p n
where pn is the fraction of particles having a directional vector within the n-th directional sub-angle. Mn is the sum of magnitudes of all motion vectors whose direction falls within the n-th directional sub-angle. Generalized entropy S* is defined as S* = −E/T + S as in Equation (9). S*max is defined for standing particles in isotropic infinitesimal motion: E = 0, Smax = kB ln N, where N is the total number of sub-angles. As described above, inhomogeneity is defined as I = S*maxS* = E/T + (SmaxS).

4.5. Inhomogeneity of Evolution

In the neutral theory of evolution [31], let us assume the mutation rate x in a group of n individuals. Then, among the total mutation rate nx, a fraction 1/n will be fixed. Now, entropy deficit can be written in the form: I = SmaxS = kB lnn, where Smax represents total mutations produced, whereas S represents fixed mutations. There is a persisting misunderstanding that evolution is an exception to the second law of thermodynamics, but evolution produces inhomogeneity only with concomitant production of a large Smax, which is originally the inhomogeneity consumed in the whole life of the group of organisms, and thus obeys the second law. Please refer to a reference discussing evolution and entropy [32].
The above considerations suggest that the notion of inhomogeneity can be applied for any type of biological phenomena, such as biological macromolecules, metabolism, cellular processes, multi-cellular systems, ecological systems and evolution. Some recent publications discuss similar topics, but the central importance of entropy deficit/inhomogeneity has not been recognized [33,34].

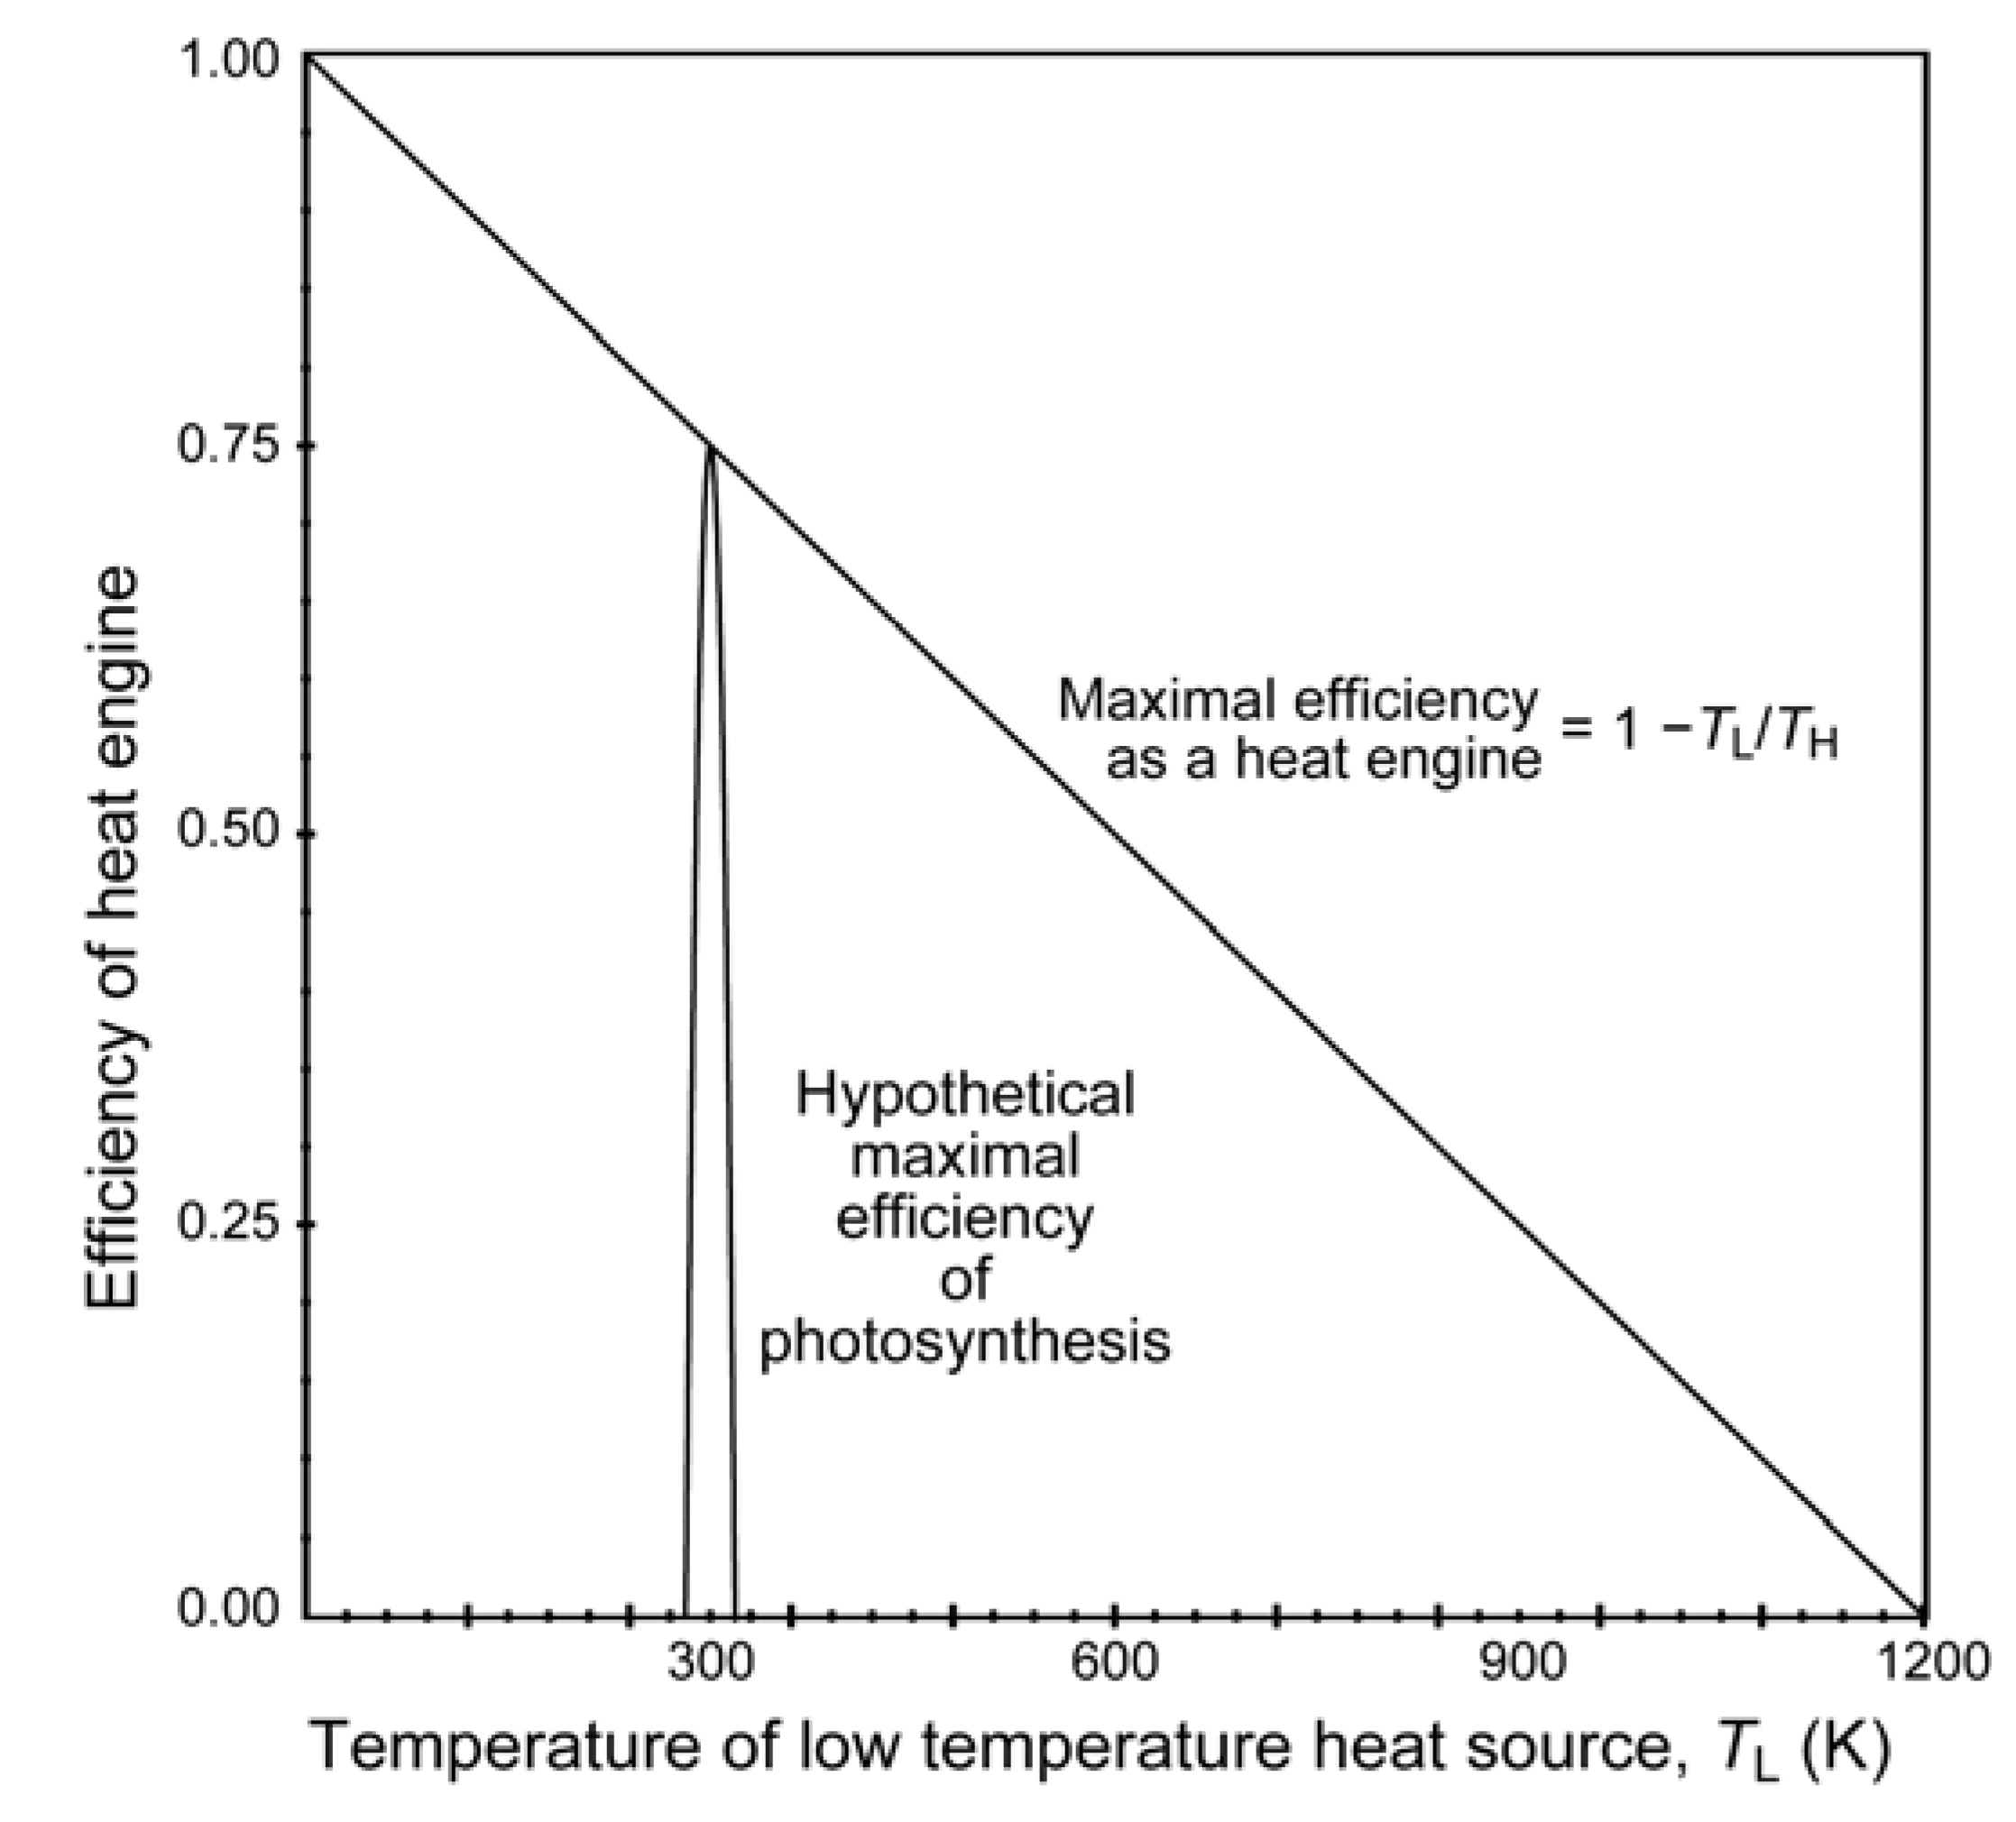
5. Photosynthesis: What Is Its Driving Force?

Now, we will see what happens in photosynthesis. But, let us consider biological oxidation of glucose at first [7,11]:
C6H12O6 + 6O2 = 6CO2 + 6H2O
In this case, the standard change in enthalpy is ∆H° = −2808 kJ mol−1, the standard change in entropy is ∆S° = 259 J mol−1 K−1, whereas the standard change in Gibbs free energy is ∆G° = −2879 kJ mol−1 (these values were calculated using the data in [14]). At 25 °C, this is equivalent to a change in generalized entropy ∆S*° = 2879/298 = 9.66 kJ mol−1 K−1. Reaction (20) can proceed spontaneously, because the change in free energy is negative.
Photosynthesis can be represented by a reversal of respiration in Reaction (20), but how can we make its free energy change negative? One might include photons in the reaction such as:
6CO2 + 6H2O + 48 photons = C6H12O6 + 6O2
or less explicitly as in many biochemistry textbooks (e.g., [7]):
Light
6CO2 + 6H2O → C6H12O6 + 6O2
Is this correct? To answer the question, we will consider photosynthesis in more detail.
Figure 2 presents our cycle model of photosynthesis and respiration. Light is absorbed by photosystems to produce redox potential, or simply electricity, which charges a battery composed of conceptual electrodes: NADPH/NADP+ and O2/H2O. ATP is produced by the electron transport chain via electrochemical potential across the membrane. ATP and NADPH are used to reduce carbon dioxide to synthesize sugar. Sugar and oxygen are considered as a pair of reductant/oxidant. This pair is used to generate ATP in mitochondria by oxidative phosphorylation.
Normally, 8–10 photons are required for the reduction of a single molecule of carbon dioxide, but we use the value 8 here. For simplicity, if we consider that the light of 680 nm (equivalent to photons of 176 kJ mol−1) is used for the reactions in both photosystems (i.e., direct excitation of reaction centers. Note that photosystems I and II use the light at 700 and 680 nm, respectively, but we can neglect such small difference here.), the total amount of energy of 48 photons equals to 8448 kJ, which is larger than the absolute value of ∆H° of Reaction (21). Such explanation, considering light as a reagent, is not valid, because the free energy of photons per se (namely, a radiation field enclosed in a space in equilibrium with the environment) is zero [13].
Figure 2. Cycle model of coupled photosynthesis and aerobic respiration. In this figure, light energy is absorbed by photosystems to drive photosynthesis, in which electron motive force is generated to charge a virtual battery consisting of a pair of conceptual electrodes: NADP+/NADPH and H2O/O2. The reductant NADPH is used to reduce CO2 to yield sugar. During the electron transfer reactions, proton gradient is formed, which is used to synthesize ATP from ADP and phosphate. The sugar is used either in the non-photosynthetic tissues of plants, animals or microorganisms as a substrate of glycolysis and respiration. In the aerobic respiration, the reducing equivalent of sugar is finally converted to NADH, which forms a conceptual electrode with another electrode of O2/H2O to generate electron movement within the electron transfer chain, which finally generates ATP. In this model, energy flows irreversibly into the universe as heat, whereas the substances are recycled. See [7] for detailed description of each process.
Entropy 14 00233 g002
Setting aside the photochemical reactions, the production of glucose from carbon oxide by the action of ATP and NADPH (Figure 2, see Section 9) is written as:
6CO2 + 12NADPH +12 H+ + 18ATP + 12H2O = C6H12O6 + 12NADP+ + 18ADP + 18Pi
Because six water molecules are produced by oxidation of NADPH, only twelve water molecules should be added to enable hydrolysis of eighteen ATP molecules. The free energy change associated with Reaction (22) is ∆G°' = −304 kJ mol−1, indicating that Reaction (22) can proceed spontaneously. The corresponding equation in the textbook ([10], page 109) should be corrected because oxygen is erroneously included in the equation. The negative free energy change means that the carbon fixation is a normal biochemical reaction that proceeds spontaneously if ATP and NADPH are provided. The production of ATP and NADPH in the photosynthetic electron transfer is also a normal biochemical reaction that proceeds with decrease in free energy [7].
The ultimate problem of photosynthesis is, therefore, why the photochemical reaction proceeds with a positive change of free energy. That is because photochemical reaction is a non-equilibrium reaction that is driven by externally provided photons, or by the temperature difference of the Sun and the Earth. This means that, after traveling through the space without doing anything, light generates free energy at the very instant it is absorbed by chlorophyll in the thylakoid membrane of chloroplasts. We should remember that energy is conserved, but free energy is not conserved.

6. The Sole and Ultimate Source of Entropy Deficit/Inhomogeneity in Photosynthesis

Sunlight is regarded as a radiation at T = 5800 K, but the effective temperature is much lower. The effective temperature of sunlight is a kind of metaphor, which is used to consider the reaction center is in the equilibrium with the incident light. The effective temperature is decreased because of two reasons. First, energy density of sunlight is attenuated at the surface of the Earth by an ‘attenuation factor’, which is obtained as the ratio of the Sun’s surface area and the surface area of a hypothetical sphere placed in the place of the Earth’s orbital (1/46,500) [5,8,35]. As a result, the light is equivalent to a radiation from a black body at about 1,300 K (depending on the wavelength of light) just in front of the Earth surface. Second, light comes from a single direction if observed on the surface of a plant leaf, but it is diffused within the leaf by the complex structures within the leaf [8,35]. This also results in reduction in energy density at the reaction center, because radiation should be averaged over all directions if considered as isotropic radiation. The resultant effective temperature of light is estimated as Tr = 1,180 K according to [5]. We should note that, if the sunlight is directly absorbed by chlorophyll, then the temperature of radiation may be identical to 5,800 K, but this is a special case. The temperature of reaction center is assumed to be at 25 °C (298 K). During the photosynthesis, a part of the light is absorbed by the system as reaction heat. The final output of heat in glucose production is calculated from the energy of 48 photons (8,448 kJ mol−1) and the negative enthalpy change of glucose production (2,808 kJ mol−1) in Reaction (20) as: 8,448 – 2,808 = 5,640 kJ mol−1. The entropy production in glucose synthesis is:
S° = 5640/298 – 8448/1180 = 11.767 kJ mol−1 K−1
The second term in Equation (23) represents the ‘unusable’ energy, which indicates that it is not possible to convert light energy into chemical energy at 100% efficiency. This situation is the same as the limitation in Carnot cycle. Therefore, about 1/4 of light energy cannot be used, in principle, in photosynthesis. By subtracting the entropy change in glucose oxidation (0.259 kJ mol−1 K−1), we obtain the total production of entropy accompanying photosynthesis:
S° =11.767 – 0.259 = 11.508 kJ mol−1 K−1
It is not an essential problem of photosynthesis whether transpiration is used for extruding the large entropy in Equation (24) (see Section 7). In fact, algae do not transpire.
Now we consider a photochemical reaction center. There are many thermodynamic studies (e.g., [36]) on the maximum efficiency of photosynthesis in the 1960s and 1970s. The calculation based on irreversible thermodynamics [37] showed that the overall efficiency of photosynthesis is only 7% under weak light. However, no explicit calculation of entropy balance was performed then. An estimation of entropy change in the reaction center was presented based on configurational entropy of the ground state and excited pigments [6]. According to [6], ∆G occurring within the pigment approaches to zero if the light is weak, and to 0 if the light is strong, depending on the entropy change within the pigment ∆Sp. This can be interpreted in the framework of entropy deficit or inhomogeneity I = ∆Smax − ∆Sp. In the steady state of photosynthesis, the entropy change is intermediate between the two extremes such that ∆Sp = 0/Tr = 176/1180=149 J mol−1 K−1 per mole photon according to the previous calculation by Abiko [35].
In the real photosynthesis, various qualities of light, such as blue or green (green light is known to be used in the real photosynthesis in leaves [38]) light are also used. In such cases, there is an energy loss due to the excess excitation energy [8,10]. Sunlight also includes light that is not used in photosynthesis. Non-photochemical quenching (NPQ) is an important process of excess energy dissipation [8,10]. All these contribute to the entropy production, which is not directly related to the driving of photosynthesis. The reference [8] presents detailed calculation of entropy production in various processes during the photosynthesis.

7. Transpiration Is Not a Driving Force of Photosynthesis

The heat produced during the photosynthesis is removed by transpiration into the environment, so that the temperature of a leaf is kept at a physiological temperature. There is an opinion stating that transpiration is essential in photosynthesis as a driving force (e.g., [3]). As described above, the driving force of photosynthesis is produced during the photochemical reaction, but all the rest of biochemical reactions are processes with decrease in free energy. Therefore, transpiration is not a driving force of photosynthesis, either at the photochemical reaction or in the biochemical carbon fixation. However, the myth seems widespread among physics-oriented scientists.
The myth seems related to the fact that heat must be removed from a heat engine in order to keep the temperature of the lower heat source sufficiently low. The efficiency of a heat engine is proportional to (1 − TL/TH), where TL and TH are the temperatures of low and high heat sources, respectively (the straight line in Figure 3). The actual photosynthesis, however, occurs within a live tissue, which embraces enzymes that are denatured at high temperature. In fact, the activity of photosynthesis is maintained within a narrow range of temperature (the convex line in Figure 3). In this case, the aim of heat removal is not to keep the efficiency of heat engine, but to prevent destruction of the system. This is the reason why transpiration is not essential in driving photosynthesis. This is similar to the situation of a computer, in which CPU should be cooled.
Schrödinger [1] also made a similar misunderstanding that heat should be removed to drive respiration by removing excess entropy. “Energy is needed to replace not only the mechanical energy of our bodily exertions, but also the heat we continually give off to the environment. And that we give off heat is not accidental, but essential. For this is precisely the manner in which we dispose of the surplus entropy we continually produce in our physical life process.” (Chapter 6 in [1]. Some words are italicized by NS). The true entropy extruded during the respiration is embodied as carbon dioxide and water, but not just heat. We can never say that heat removal drives respiration, although removal of heat is necessary to keep the system intact at physiological temperature.
Figure 3. Photosynthesis is not driven by cooling through transpiration. This figure shows a hypothetical efficiency curve of heat engine mimicking photosynthesis. The sharp convex curve indicates a hypothetical efficiency of photosynthesis. Redrawn from Figure 2 in [12].
Entropy 14 00233 g003

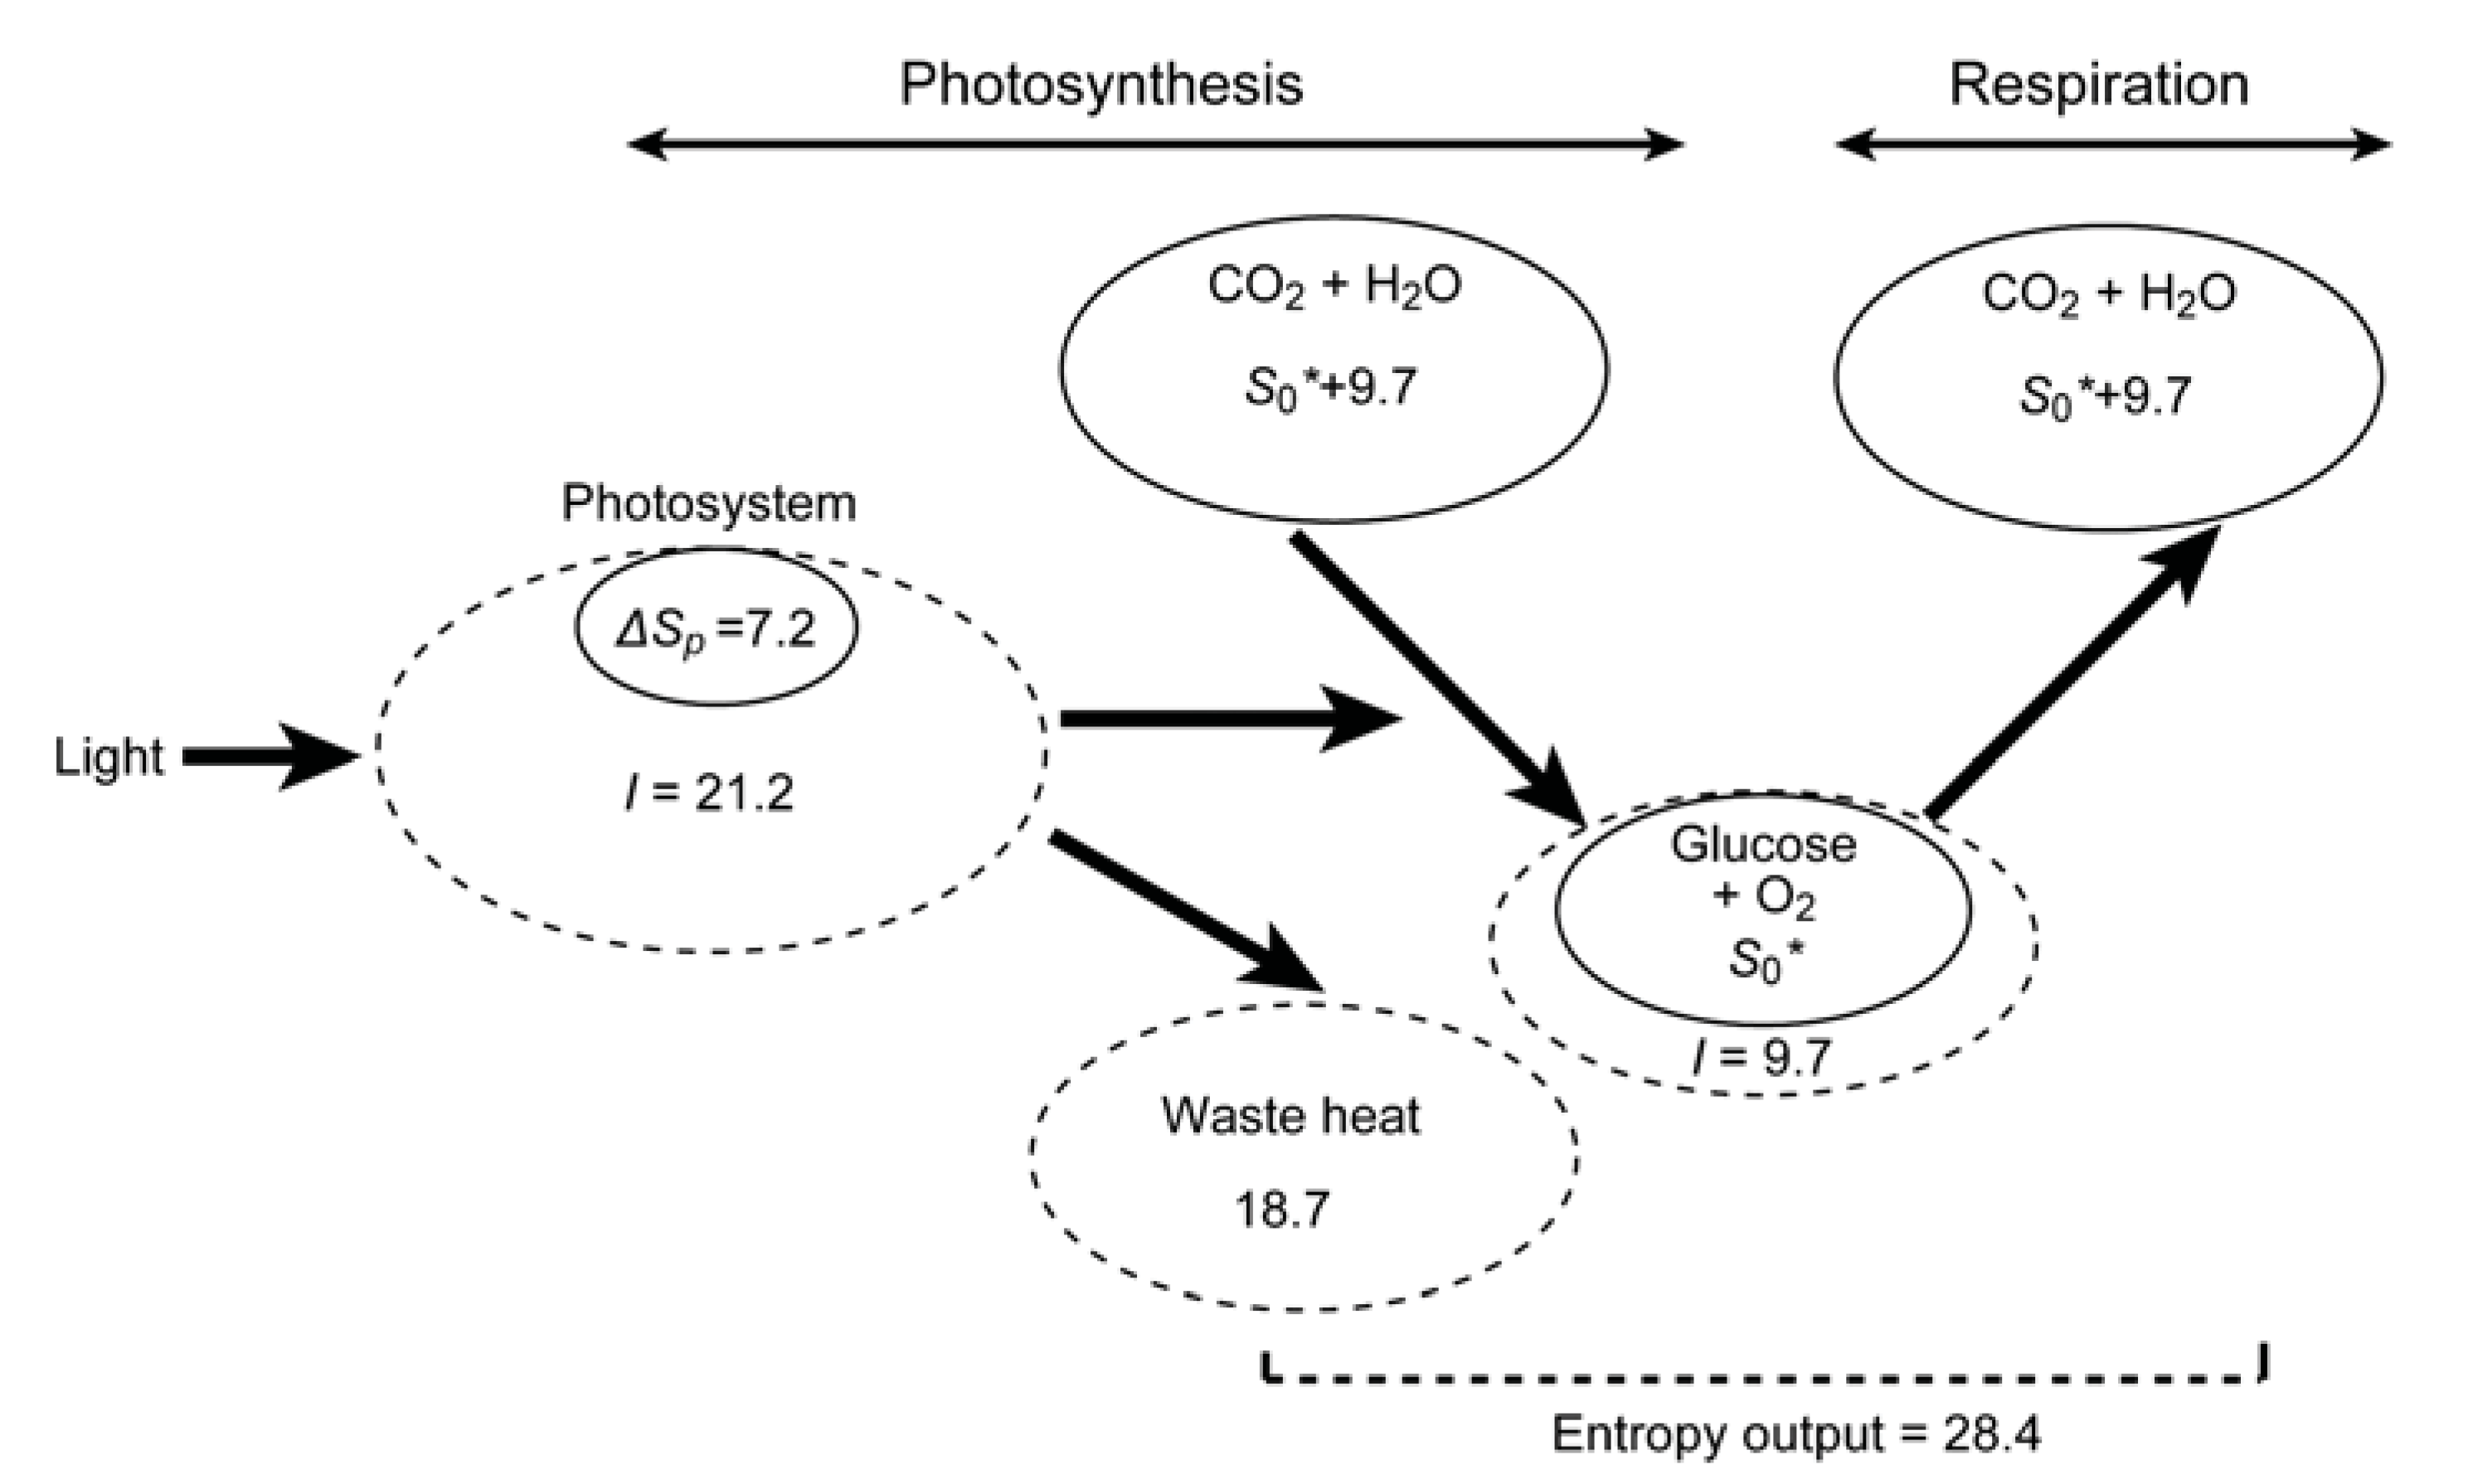
8. Initial Entropy Deficit in Photosynthesis

In the photosynthetic reaction center, the excited pigment acquires the positive free energy as described above. Here, the major component of free energy is not enthalpy but entropy (entropy deficit). The entropy deficit I = 0/Ts0/Tr = 590.6 − 149.2 = 441.4 J mol−1 K−1 per mole photon or 48 × 441.4/1,000 = 21.187 kJ mol−1 K−1 per glucose (in the steady-state) is the ultimate driving force of all other biochemical reaction leading to the synthesis of glucose. This is equivalent to the change in generalized entropy ∆S*° = – ∆G°/T as defined in Equation (9). Many people vaguely think that ‘energy’ is introduced in the process of photosynthesis, but this is a misleading concept. It is the inhomogeneity between the sunlight (high temperature) and the plant tissue (low temperature) that produces free energy, which is, in its essence, entropy deficit. This means that a form of inhomogeneity ‘high temperature/low temperature’ is transformed into another form of inhomogeneity that is entropy deficit in the reaction center. The inhomogeneity is smaller than the absorbed light energy, because the entropy acquired by the pigment (149 J mol−1 K−1 per photon) represents unusable energy. As already mentioned in Section 1, the entropy change in the photosynthetic reaction center is indeed positive, but this is not the quantity that we should discuss. It is the entropy deficit (entropy decrease with respect to the possible maximum entropy) or the increment in generalized entropy that drives photosynthesis. This understanding resolves all confusions regarding the entropy of photosynthesis.
The important point is that, in order for an organism to gain an amount of inhomogeneity necessary for its activity and structure formation, the whole system (or universe) requires a much higher amount of entropy increase or loss of inhomogeneity. In photosynthesis (Figure 4), the gain of inhomogeneity equivalent to the production of glucose (–∆S*° = 9.66 kJ, but not –∆ = 0.259 kJ mol−1 K−1) requires a much larger loss of inhomogeneity (∆S° = 11.5 kJ mol−1 K−1) as calculated by Equation (24), which is the difference of 21.2 and 9.66. The efficiency of inhomogeneity gain in photosynthesis, from the excitation of reaction center to glucose synthesis, is, 100 × 9.66/21.2 = 45.5% (if 48 photons are necessary per glucose).
Figure 4. Transformation of inhomogeneity into actual entropy during photosynthesis.
Entropy 14 00233 g004

9. Entropy Deficit Inherent in ATP and NAD(P)H

The significance of ATP and NAD(P)H as carriers of inhomogeneity should be examined. The entropy changes for the formation of these molecules are not described in common textbooks. The data [39] for ATP hydrolysis are: ∆G°' = −31.3 kJ mol−1 and ∆S°' = 11 J mol−1 K−1. Note that the variables with an apostrophe represent those at pH 7.0 according to biochemical convention. The reported values for ∆S°', however, vary from negative to positive values, and might not be very large. The large change in free energy of ATP hydrolysis might be mostly due to enthalpy change. The change in generalized entropy of production of ATP is ∆S*°' = 31,300/298 = 105 J mol−1 K−1. If one mole of glucose is completely oxidized to give 36 ATP (this may depend on organisms), then, the efficiency of conversion of inhomogeneity is 100 × 36 × 105/21,200 = 39%.
Curiously, ATP is related to various kinds of movements within the cell driven by myosin, kinesin and dynein (see [7]). ATP synthases in mitochondria and chloroplasts are molecular motors driven by the flux of protons across the membrane. DNA and RNA polymerases are also considered as motor proteins that move along template DNA. Most of the functions of ATP might be understood in the context related to molecular motor. Movement is also a form of inhomogeneity (see Section 4.4).
In contrast, we have reliable values for NAD(P)H formation. The data [40] for the reaction:
NAD+ + H2 (aq) = NADH + H+
are: ΔG°= 2.38 kJ mol−1, ΔH°= −24.98 kJ mol−1, ΔS°= −99 J mol−1 K−1. The corresponding value for NADPH is ΔS°= −87 J mol−1 K−1. Here we use values without apostrophe, namely the values at pH 0.0 instead of at pH 7.0. If we adopt values at pH 7.0, the proton in Reaction (25) must be diluted at 10−7 M, and the resultant entropy change includes this dilution term. The value at pH 0.0 does not include concentration terms, and represent the true amount of inherent decrease in entropy. The change in generalized entropy is not large: ∆S*° = 2380/298 = 8.0 J mol−1 K−1.
Since Reaction (25) describes equilibrium between hydrogen and NADH, the small value of generalized entropy change indicates that NADH is a reducing agent as effective as hydrogen. In many textbooks, ATP is introduced as an energy currency within the cell. But NAD(P)H are also important driving forces of metabolism, which are necessary for the formation of C-C and C-N bonds [7,11].

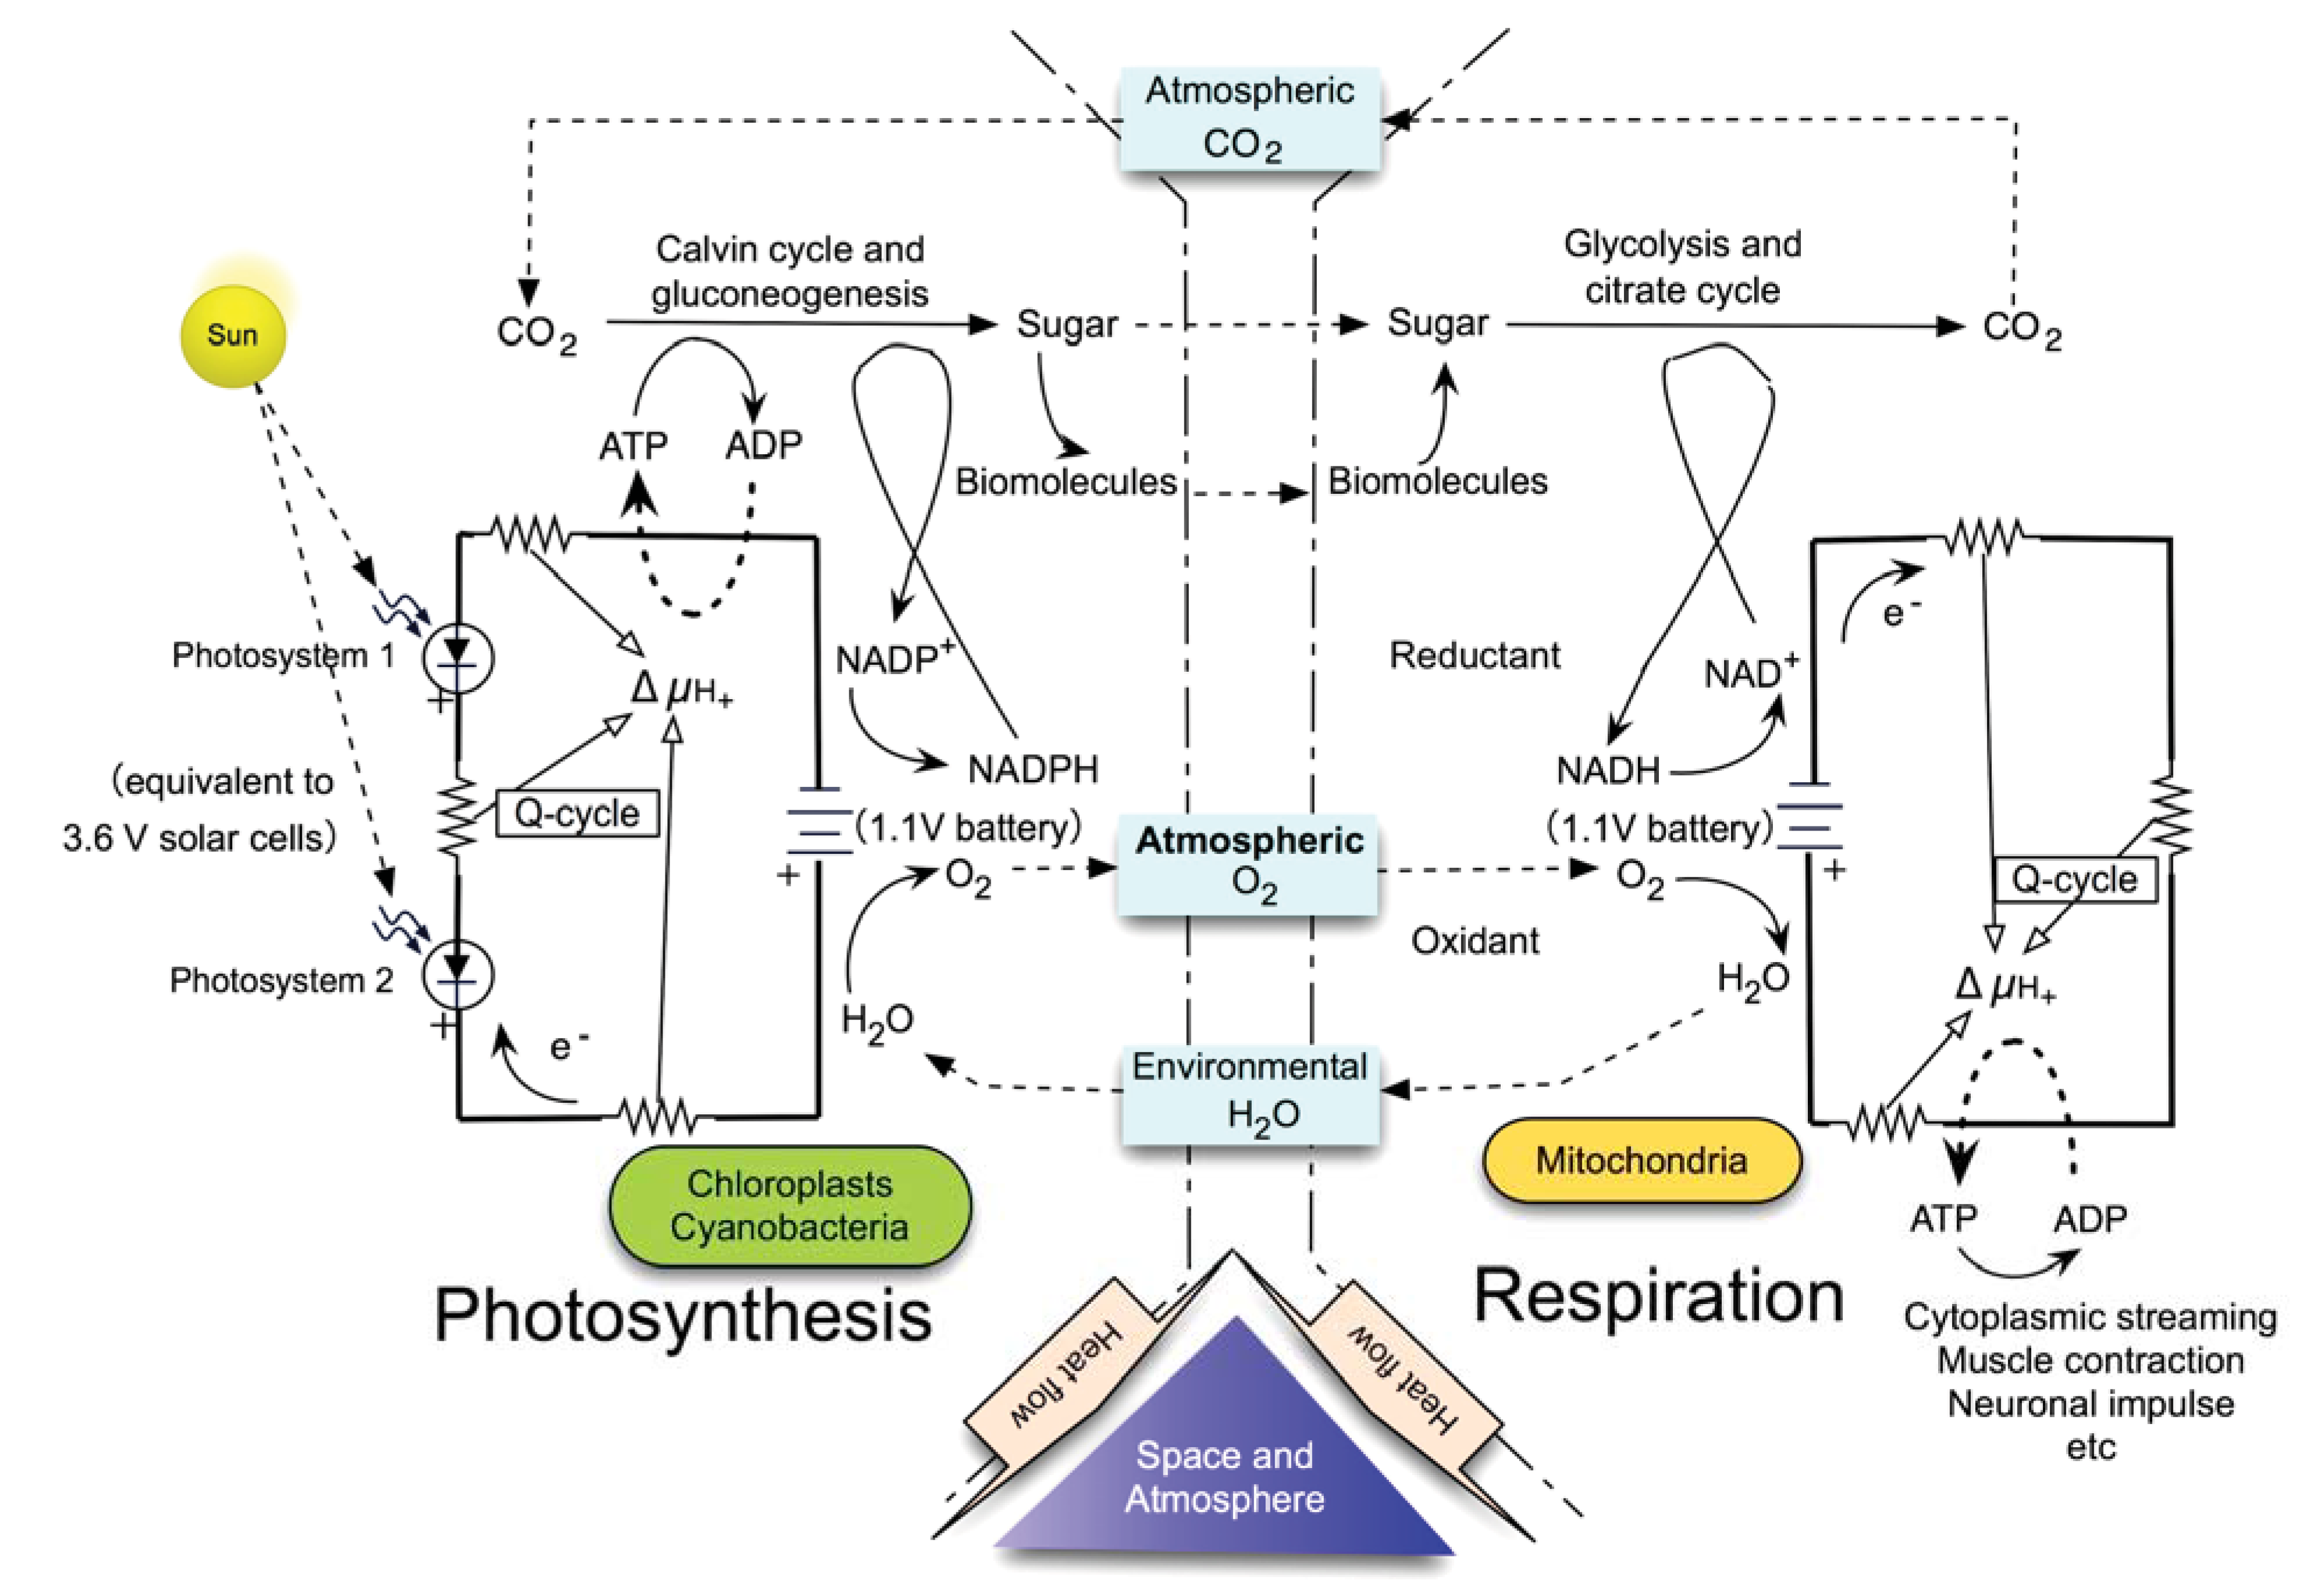
10. Recognition of Photosynthesis as the Primary Driving Force of Whole Biosphere

We found various confusions regarding entropy in biology. The main reason for such confusion was that entropy was discussed as such, neglecting importance of entropy deficit or inhomogeneity. Photosynthesis is nearly the sole source of all biological activities, but its importance is not recognized in life sciences and even in biophilosophy. One of the reason for this negligence is the presence of chemolithotrophs, which depend on reductants and oxidants derived from the depth of Earth. Such reductants and oxidants originate from the high temperature in the interior of the Earth, and thus carry inhomogeneity originating from the power that produced the planet. In this way, all living beings depend ultimately on the inhomogeneity of inflating universe, which engendered the Sun and the Earth.
Figure 5 shows the structure of hierarchical biosphere, which is driven by the transfer of inhomobeneity. For simplicity, each inhomogeneity value refers to the equilibrium state before and after the process. A commonly encountered misunderstanding of this figure is that the inhomogeneity is transferred from one level to another, just as the transfer of money. The nature of inhomogeneity is different at different levels of hierarchy, and the transfer of inhomogeneity occurs as a result of complex dynamics, such as a one often cited in this context, Bénard convection. In this instance, the flow of heat induces the convection flow within the liquid, and thus drives the formation of a certain ‘order’ or spatial inhomogeneity. The input inhomogeneity and the output inhomogeneity are physically different, and they are not simply convertible, but they are coupled by the convection system. This is just an illustration of the situation of transfer of inhomogeneity. In real biosphere, the inhomogeneity changes its form at different levels.
In addition, the most significant feature of the biosphere is that genetic information or genetic inhomogeneity exerts various feedbacks on metabolic network, cellular organization and intercellular communication, as a guide for orienting these biological processes. Multiple layers of hierarchy are, thus, reproducibly organized by a special, persistent form of inhomogeneity, namely, genetic information.
Life is such a multiply folded system of transfer of inhomogeneity, in which light triggers the initial impetus. At the other end of the chain comes human cultural information. We might be able to go further to say that the human culture is considered as a product of the Sun, because the brain concentrates light-derived inhomogeneity to produce cultural information. Such unified view of biosphere is a starting point of constructing a new type of science of life, without complicated by numerous genes, proteins, and other parts of organisms.
We must, however, keep in mind that there is still a lack of agreement on whether or not there is a strong association between configurational entropy, thermodynamic entropy and informational entropy. For example, there are opposing opinions as to the evaluation of entropy in the initial photochemistry of the photosynthetic reaction center [4,5,6]. Because this is a very important field of research, we hope that this article will activate discussions on the roles of entropy in life processes.
Figure 5. Model of hierarchical biosphere driven by transfer of inhomogeneity, which starts from photosynthesis until evolution and culture. Redrawn with enhancement from Figure 3 in [12].
Entropy 14 00233 g005

11. Inhomogeneity, a Scientific Equivalent of Élan Vital

Bergson has put forward a concept ‘élan vital’ to describe biological force inherent in all living beings that drives all living processes including evolution [41]. This key notion should, therefore, be understood to mean ‘driving force of life’ rather than ‘vital force’ or other words that reminds us of vitalism. Élan vital is sometimes misunderstood as an expression of vitalism, but it is based on numerous scientific results obtained until the beginning of the 20th century, although Bergson was a philosopher but not scientific researcher. Bergson was the first advocate who argued that evolution is a creative process, which was supported later by Monod [42]. Various putative equivalents of élan vital were put forward by various physicists. Schrödinger [1] presented negative entropy as a driving force of life, but there were various confusions regarding negative entropy. Brillouin [2] correctly paraphrased negative entropy as a notion that we call entropy deficit or inhomogeneity in the present article. He also showed the equivalence of negative entropy to information. Prigogine was an eloquent proponent arguing that life is a kind of self-organizing dissipative structure, continuously driven by non-equilibrium flow of energy. The book of Nicolis and Prigogine [43] described in detail their view of self-organization in metabolism, cellular differentiation, evolution and ecosystems with numerical simulations, but they did not consider the entropy of various biological processes. Kaufmann elaborated the concept of self-organization especially in evolution, and he considered that evolution, and therefore, life is not just a mechanism [44]. Despite all these efforts of physics-oriented scientists, biologists still do not like such view of life seeing only a kind of complex mixture of inanimate materials placed in disorder in place of the beautiful wealth of biodiversity still in the process of evolution [45] culminating in human intelligence.
Most biologists may agree that metabolism can be viewed as processes of non-equilibrium thermodynamics, even though it is extremely complex and organized within a cell. We can understand metabolism in the words of generalized entropy deficit or free energy as described in the present article. Self-organization or development can be the most prominent characteristics of both unicellular and multi-cellular organisms, but all the processes of intracellular and individual organization can be explained by networks of signals that, as a whole, appear as emergent systems, which can be understood as self-organizing dissipative structures, and therefore, driven by entropy deficit. As briefly pointed out in Section 4, spatiotemporal structure of ecosystem and evolution are also considered as emergent systems driven by entropy deficit/inhomogeneity. In addition, the prominent nature of biological system is embodied in its hierarchical organization assisted by a stored form of inhomogeneity, which is genetic information. Based on such consideration, we can convincingly conclude that entropy deficit/inhomogeneity is a scientific equivalent of ‘élan vital’ of Bergson [41], which governs all biological phenomena in the biosphere.

Acknowledgments

The author thanks Em. Seiya Abiko (Seirei Christopher University) for giving him valuable suggestions. He is also grateful for the members of his laboratory for fruitful discussions.

References

  1. Schrödinger, E. What is Life? The Physical Aspect of the Living Cell; Cambridge University Press: Cambridge, UK, 1944. [Google Scholar]
  2. Brillouin, L. Science and Information Theory, 2nd ed.; Academic Press: New York, NY, USA, 1962. [Google Scholar]
  3. Tsuchida, A. Entropy and Ecology (in Japanese); Diamond Inc.: Tokyo, Japan, 1986. [Google Scholar]
  4. Jennings, R.C.; Engelmann, E.; Garlaschi, F.; Casazza, A.P.; Zucchelli, G. Photosynthesis and negative entropy production. Biochim. Biophys. Acta 2005, 1709, 251–255. [Google Scholar] [CrossRef] [PubMed]
  5. Lavergne, J. Commentary on: ‘Photosynthesis and negative entropy production by Jennings and coworkers’. Biochim. Biophys. Acta 2006, 1757, 1453–1439. [Google Scholar] [CrossRef] [PubMed]
  6. Knox, R.S.; Parson, W.W. Entropy production and the second law in photosynthesis. Biochim. Biophys. Acta 2007, 1767, 1189–1193. [Google Scholar] [CrossRef] [PubMed]
  7. Voet, D.; Voet, J.G. Biochemistry, 3rd ed.; Wiley: Hoboken, NJ, USA, 2004. [Google Scholar]
  8. Ksenzhek, O.S.; Volkov, A.G. Plant Energetics; Academic Press: San Diego, CA, USA, 1998. [Google Scholar]
  9. Albarrán-Zavala, E.; Angulo-Brown, F. A simple thermodynamic analysis of photosynthesis. Entropy 2007, 9, 152–168. [Google Scholar] [CrossRef]
  10. Hall, D.O.; Rao, K.K. Photosynthesis, 6th ed.; Cambridge University Press: Cambridge, UK, 1999. [Google Scholar]
  11. Cheetham, N.W.H. Introducing Biological Energetics; Oxford University Press: New York, NY, USA, 2011. [Google Scholar]
  12. Sato, N. Re-thinking entropy of photosynthesis. News Letter of the Japanese Society of Photosynthesis Research 2011, 21, 70–80. [Google Scholar]
  13. Prigogine, I.; Condepudi, D. Thermodynamique; Editions Odile Jacob: Paris, France, 1999. [Google Scholar]
  14. Atkins, P.W.; de Paula, J. Elements of Physical Chemistry, 4th ed.; Oxford University Press: Oxford, UK, 2005. [Google Scholar]
  15. Haynie, D.T. Biological Thermodynamics; Cambridge University Press: Cambridge, UK, 2001. [Google Scholar]
  16. Garrod, C. Statistical Mechanics and Thermodynamics; Oxford University Press: New York, NY, USA, 1995. [Google Scholar]
  17. Shannon, C.E. A mathematical theory of communication. Bell Syst. Tech. J. 1948, 27, 379–423, 623–656. [Google Scholar] [CrossRef]
  18. Jaynes, E. T. Information theory and statistical mechanics. Phys. Rev. 1957, 106, 620–630. [Google Scholar] [CrossRef]
  19. Jaynes, E. T. Information theory and statistical mechanics. II. Phys. Rev. 1957, 108, 171–190. [Google Scholar] [CrossRef]
  20. Landsberg, P.T. Can entropy and “order” increase together? Phys. Lett. 1984, 102A, 171–173. [Google Scholar] [CrossRef]
  21. Sato, N. Gclust: Trans-kingdom classification of proteins using automatic individual threshold setting. Bioinformatics 2009, 25, 599–605. [Google Scholar] [CrossRef] [PubMed]
  22. Mount, D.W. Bioinformatics; Cold Spring Harbor Laboratory Press: Cold Spring Harbor, NY, USA, 2001. [Google Scholar]
  23. Strait, B.J.; Dewey, T.G. The Shannon information entropy of protein sequences. Biophys. J. 1996, 71, 148–155. [Google Scholar] [CrossRef]
  24. Allison, L.; Stern, L.; Edgoose, T.; Dix, T.I. Sequence complexity for biological sequence analysis. Comput. Chem. 2000, 24, 43–55. [Google Scholar] [CrossRef]
  25. Dewey, T.G.; Donne, M.D. Non-equilibrium thermodynamics of molecular evolution. J. Theor. Biol. 1998, 193, 593–599. [Google Scholar] [CrossRef] [PubMed]
  26. Dewey, T.G. Algorithmic complexity and thermodynamics of sequence-structure relationships in proteins. Phys. Rev. E 1997, 56, 4545–4552. [Google Scholar] [CrossRef]
  27. Wagensberg, J.; Valls, J. The [extended] maximum entropy formalism and the statistical structure of ecosystem. Bull. Math. Biol. 1987, 49, 531–538. [Google Scholar] [CrossRef]
  28. Srienc, F.; Unrean, P. A statistical thermodynamical interpretation of metabolism. Entropy 2010, 12, 1921–1935. [Google Scholar] [CrossRef]
  29. Vallino, J.J. Ecosystem biogeochemistry considered as a distributed metabolic network ordered by maximum entropy production. Phil. Trans. Roy. Soc. B 2010, 365, 1417–1427. [Google Scholar] [CrossRef] [PubMed]
  30. Chen, C.-Y.; Wang, J.-C.; Wang, J.-F.; Hu, Y.-H. Motion entropy feature and its applications to event-based segmentation of sports video. EURASIP J. Adv. Signal Process. 2008. ID 460913. [Google Scholar] [CrossRef]
  31. Kimura, M. The Neutral Theory of Molecular Evolution; Cambridge University Press: Cambridge, UK, 1983. [Google Scholar]
  32. Demetrius, L. Thermodynamics and evolution. J. Theor. Biol. 2000, 206, 1–16. [Google Scholar] [CrossRef] [PubMed]
  33. Annila, A.; Kuismanen, E. Natural hierarchy emerges from energy dispersal. BioSystems 2009, 95, 227–233. [Google Scholar] [CrossRef] [PubMed]
  34. Crofts, A.R. Life, information, entropy, and time. Complexity 2007, 13, 14–50. [Google Scholar] [CrossRef] [PubMed]
  35. Abiko, S. Photosynthesis as a mechanism of entropy decrease (in Japanese). Science Journal Kagaku 1984, 54, 285–293. [Google Scholar]
  36. Ross, R.T. Thermodynamic limitations on the conversion of radiant energy into work. J. Chem. Phys. 1966, 45, 1–7. [Google Scholar] [CrossRef]
  37. Gebhardt, W. Photosynthetic efficiency. Radiat. Environ. Biophys. 1986, 25, 275–288. [Google Scholar] [CrossRef] [PubMed]
  38. Terashima, I.; Fujita, T.; Inoue, T.; Chow, W.S.; Oguchi, R. Green light drives leaf photosynthesis more efficiently than red light in strong white light: Revisiting the enigmatic question of why leaves are green. Plant Cell Physiol. 2009, 50, 684–697. [Google Scholar] [CrossRef] [PubMed]
  39. Pänke, O.; Rumberg, B. Energy and entropy balance of ATP synthesis. Biochim. Biophys. Acta 1997, 1322, 183–194. [Google Scholar] [CrossRef]
  40. Miller, S.L.; Smith-Magowan, D. The thermodynamics of the Krebs cycle and related compounds. J. Phys. Chem. Ref. Data 1990, 19, 1049–1073. [Google Scholar] [CrossRef]
  41. Bergson, H. L’Évolution Créatrice; Presses Universitaires de France: Paris, France, 1907. [Google Scholar]
  42. Monod, J. Le Hasard et la Nécessité. Essai sur la philosophie naturelle de la biologie moderne; Seuil: Paris, France, 1970. [Google Scholar]
  43. Nicolis, G.; Prigogine, I. Self-Organization in Nonequilibrium Systems: From Dissipative Structures to Order through Fluctuations; Wiley International: New York, NY, USA, 1977. [Google Scholar]
  44. Stuart, Stuart. A. The Origins of Order. Self-Organization and Selection in Evolution; Oxford University Press: New York, NY, USA, 1993. [Google Scholar]
  45. Wagner, A. The Origins of Evolutionary Innovations; Oxford University Press: Oxford, UK, 2011. [Google Scholar]

