4. Viscosity of amorphous materials
Viscous flow occurs due to stress applied. The viscosity coefficient η(T) relates the acting stress
f to the strain rate
via equation:
The higher the temperature of an amorphous material the more broken bonds are created by temperature fluctuations e.g. the higher the concentration of configurons. Configurons weaken the bond system so that the higher the content of configurons the lower the viscosity of an amorphous material. This qualitatively explains the decrease of viscosities of amorphous materials with temperature.
Table 1 gives viscosity coefficients of several amorphous materials at 25
oC.
Table 1.
Viscosity of some materials.
Table 1.
Viscosity of some materials.
| Material | Viscosity, Pa•s |
|---|
| Water | 8.94 10-4 |
| Mercury | 1.526 10-3 |
| Olive oil | 8.1 10-2 |
| Glycerol | 9.34 10-1 |
| Pitch | 2.3 108 |
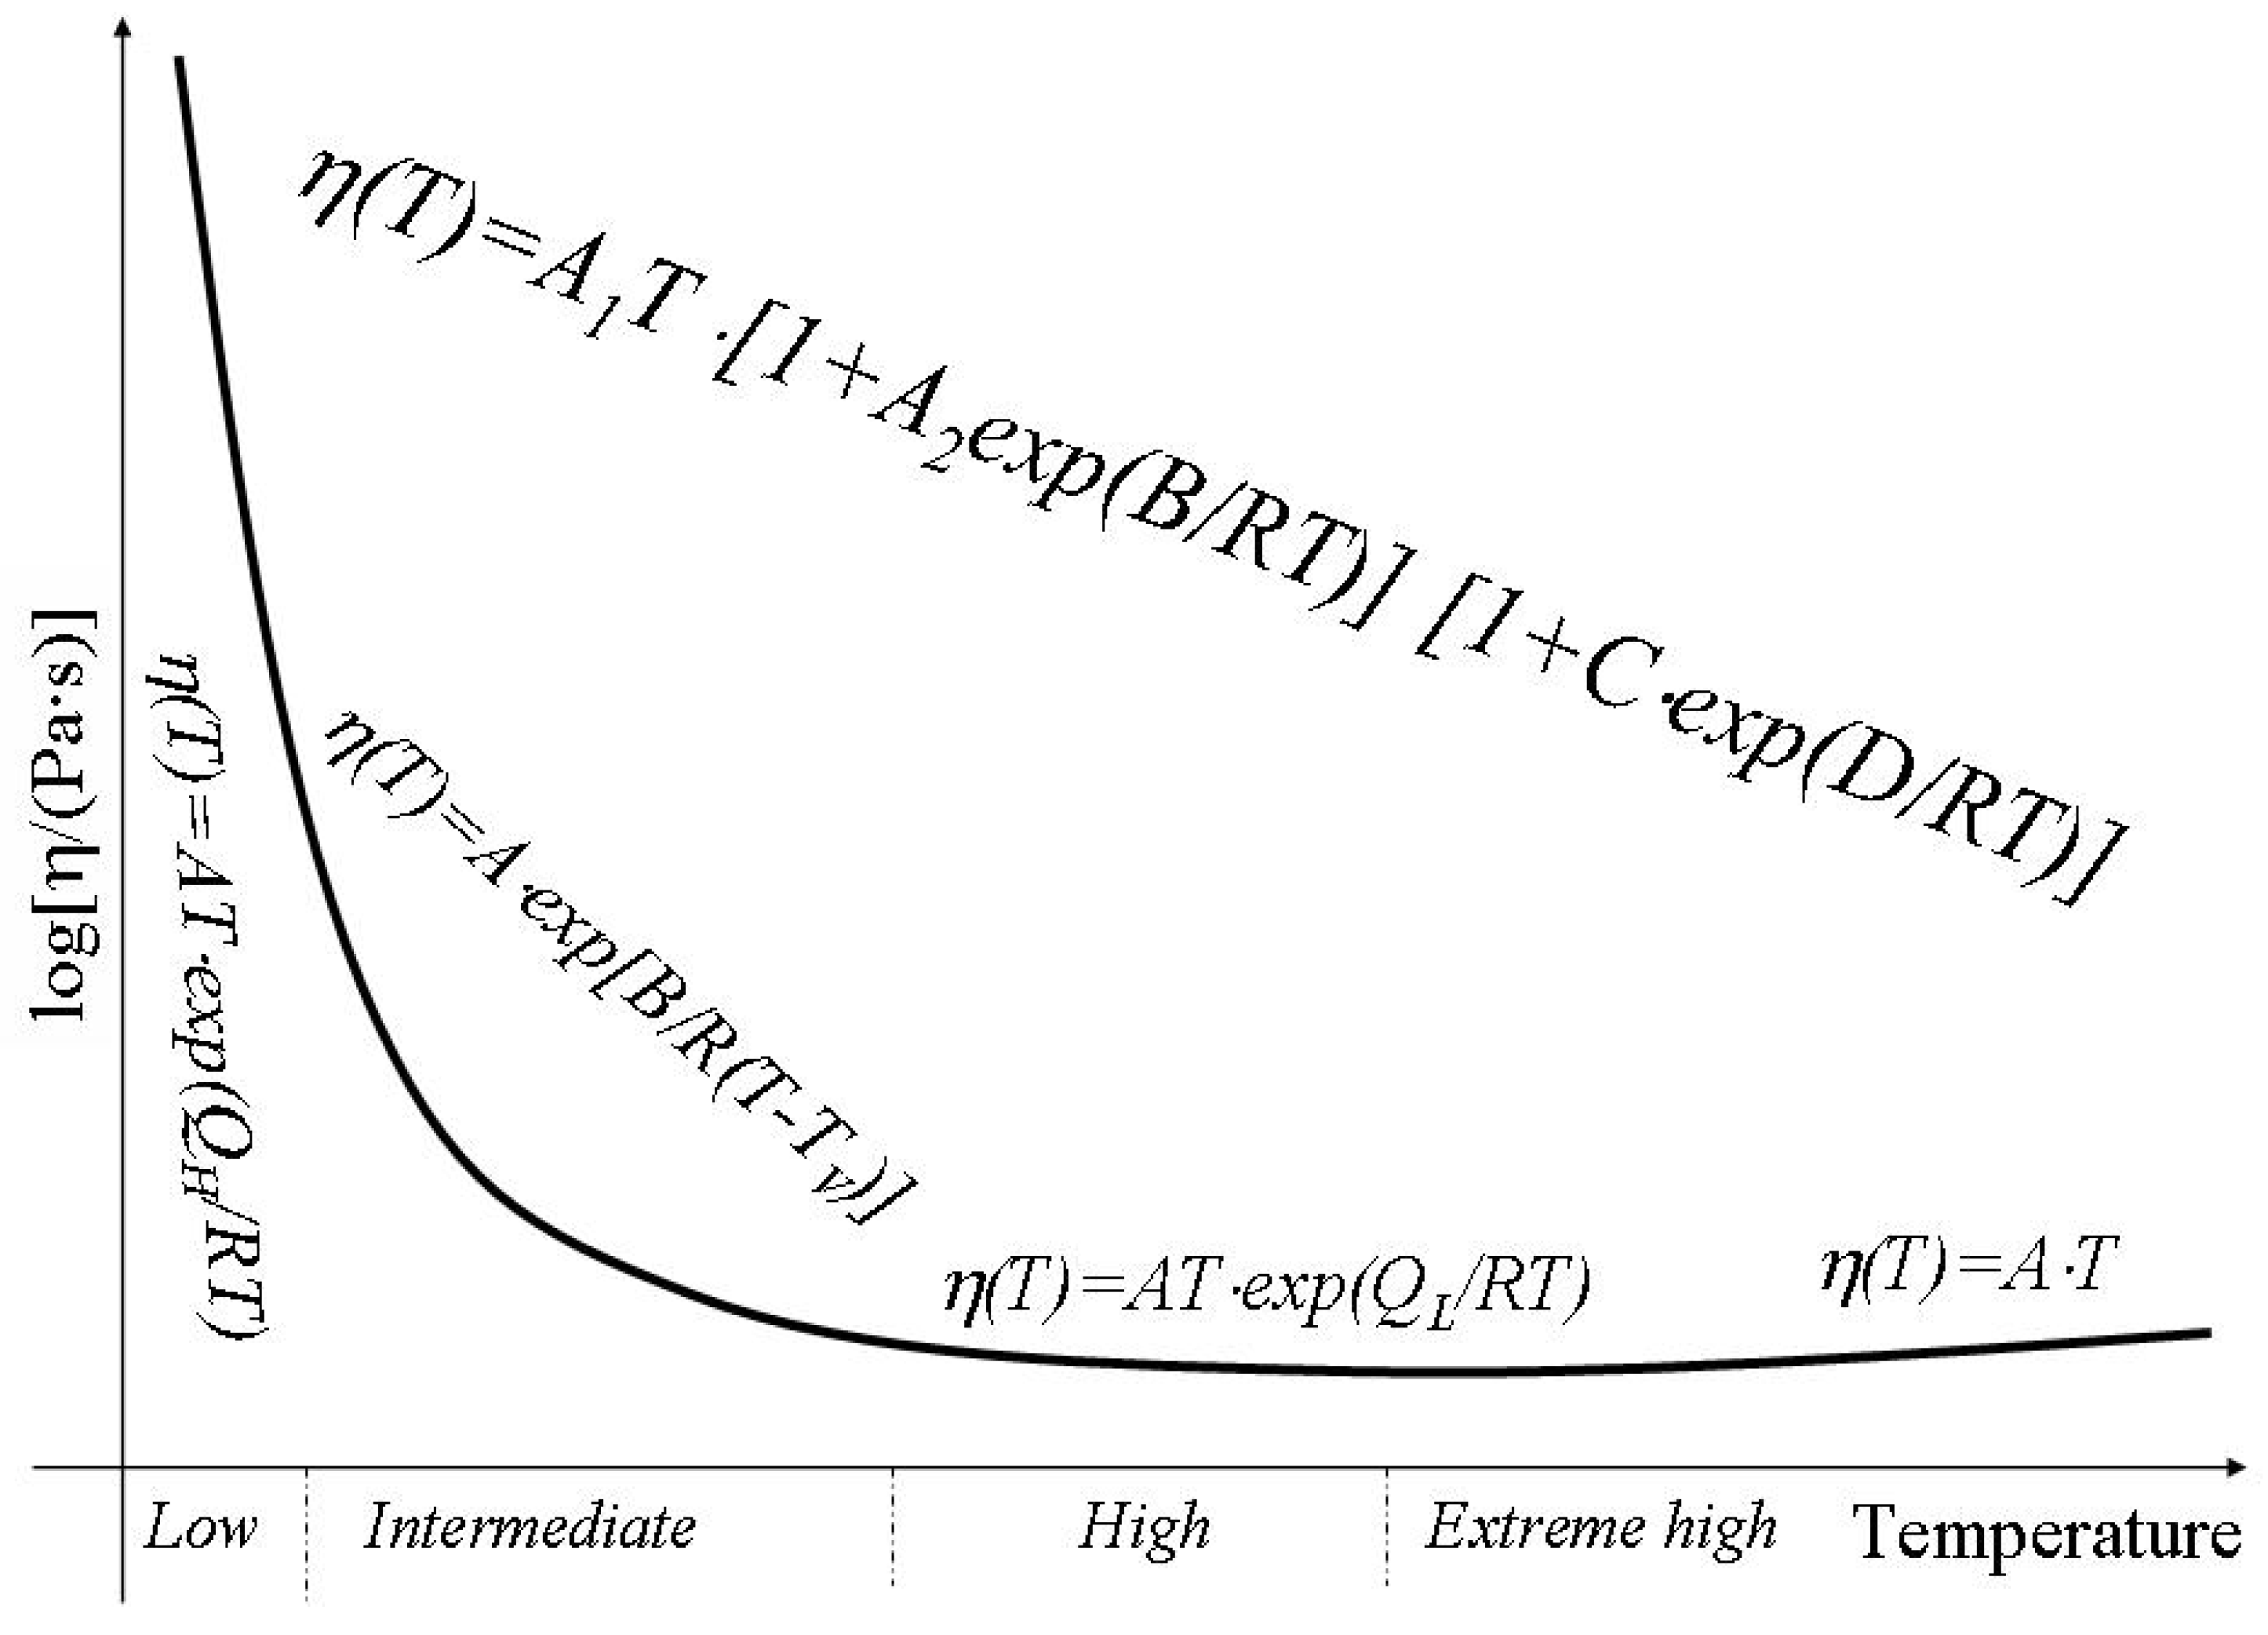
It is commonly assumed that shear viscosity is a thermally activated process. The viscosity coefficient can be expressed in terms of an activation energy
Q by
where T is temperature in K, R is the molar gas constant and A is approximately a constant [
20]. For amorphous materials two different regimes of flow have been identified with melts at high temperature having a lower activation energy for flow than materials at lower temperatures. Within the low temperature or high temperature regime an Arrhenius dependence of viscosity is observed and an appropriate activation energy,
QH or
QL respectively, can be defined. Asymptotically both at low and high temperatures the activation energy of viscosity is independent of temperature. This pattern has been observed with a range of melts including silicates, fused salts, oxides and organic liquids [
21,
22]. Between the high temperature and the low temperature regimes the activation energy for flow changes and the viscosity cannot be described using an Arrhenius approach e.g. the activation energy of viscosity varies with temperature. Temperature changes in activation energy of viscosity can be explained in terms of configuron formation and motion. Indeed the activation energy of viscosity consists of two parts: the first one is due to formation of configurons e.g. bond breaking. At low temperatures it will take its full value as the concentration of broken bonds is low. However at high temperatures when the concentration of broken bonds is very high it becomes zero. The second contribution to activation energy is due to the energy needed to transfer a molecule or, which is equivalent, a configuron from its original position to the adjacent vacant site. This part of activation energy remains almost unchanged with temperature.
The more-or-less randomness, the openness, and the varying degree of connectivity allow the glass structure to accommodate large variations in composition e.g. glass acts like a solution. Moreover it was found that melts and glasses produced from them can be often considered as solutions consisting of salt-like products of interactions between the oxide components [
23]. These associates are similar to the crystalline compounds which exist in the phase diagram of the initial oxide system. Calculations in this model are based on solving the set of equations for the law of mass action for the reactions possible in the system of oxides, and the equations of mass balance of the components. This approach describes well such properties as viscosity, thermal expansion, isothermal compressibility, optical parameters [
23]. For oxide glasses a small change in glass composition typically causes a smooth change in glass properties. The unit addition or substitution of a component can be deemed as a contribution characteristic of that component to the overall property. This notion gives rise to the additive relationships with many properties such as densities, refractive indexes obeying additive relationships [
7]. An additive property P obeys a linear relation of the type:
where p
i are additivity factors for a given component i=1, 2, 3, … n, and C
i are the mass% or the mol% of that component in the glass. In oxide glasses the density follows additivity primarily because the volume of an oxide glass is mostly determined by the volume occupied by the oxygen anions, the volume of cations being much smaller [
7]. Additivity relations work over a narrow range of compositions and additivity coefficients of a given oxide may change from system to system. Nonlinearities appear when various constituents interact with each other. Glass properties can be calculated through statistical analysis of glass databases such as SciGlass [
7,
24]. Linear regression can be applied using common polynomial functions up to the 2
nd or 3
rd degrees. For viscosities of amorphous oxide materials (melts and glasses) the statistical analysis of viscosity is based on finding temperatures (isokoms) of constant viscosity log[η(T
i)]=const
i, typically when viscosity is 1.5, 6.6 and 12 (point of practical purpose glass transition) [
24,
25,
26]. A detailed overview on statistical analysis of viscosities and individual oxide coefficients C
i in isokom temperatures of oxide materials is given in [
26].
The definition of practical purpose
Tg (1) was used by Angell to plot the logarithms of viscosity as a function of (
Tg/
T) [
27,
28]. In such a plot strong materials,
i.e. materials that exhibit only small changes in the activation energy for flow with temperature, such as silica, have a nearly linear dependence on the inverse of the reduced temperature whereas fragile materials deviate strongly from a linear dependence as the activation energies of fragile materials significantly change with temperature. However this change is characteristic only for intermediate temperatures and the viscosity has an Arrhenius-type behaviour asymptotically both at high and low temperatures. Within the low temperature the activation energy of viscosity is high
QH whereas at high temperatures the activation energy is low
QL. Doremus suggested to use the ratio
as a fragility criterion [
21,
22]. The higher the value of
RD the more fragile the material. Doremus’ fragility ratio ranges from 1.45 for silica to 4.52 for anorthite (
Table 2).
The fragility of amorphous materials numerically characterized by the Doremus’ fragility ratio classifies amorphous materials as strong if they have R
D<2, and fragile materials if they have R
D≥2. The implication of strong-fragile classification was that strong materials are strongly and fragile are weakly bonded [
28]. As pointed out by Doremus [
21,
22] these widely and convenient terms are misleading e.g. binary silicate glasses are strong although have many non-bridging oxygens. Some network melts such as anorthite and diopside have very high activation energies being quite strongly bounded but are very fragile. Nevertheless the fragility concept enables classification of materials based on their viscosity behaviour: those materials which significantly change the activation energy of viscosity are fragile and those which have small changes of activation energy of viscosity are strong.
Table 2.
Asymptotic Arrhenian activation energies for viscosity and Doremus’ fragility ratios.
Table 2.
Asymptotic Arrhenian activation energies for viscosity and Doremus’ fragility ratios.
| Amorphous material | QL, kJ/mol | QH, kJ/mol | RD |
|---|
| Silica (SiO2) | 522 | 759 | 1.45 |
| Germania (GeO2) | 272 | 401 | 1.47 |
| 66.7SiO2 33.3PbO | 274 | 471 | 1.72 |
| 80SiO2 20Na2O | 207 | 362 | 1.75 |
| 65SiO2 35PbO | 257 | 488 | 1.9 |
| 59.9SiO2 40.1PbO | 258 | 494 | 1.91 |
| 75SiO2 25Na2O | 203 | 436 | 2.15 |
| 75.9SiO2 24.1PbO | 234 | 506 | 2.16 |
| SLS: 70SiO2 21CaO 9Na2O | 293 | 634 | 2.16 |
| Salol (HOC6H4COOC6H5) | 118 | 263 | 2.23 |
| 70SiO2 30Na2O | 205 | 463 | 2.26 |
| 65SiO2 35Na2O | 186 | 486 | 2.61 |
| α-Phenyl-o-cresol (2-Hydroxydiphenylmethane) | 103 | 275 | 2.67 |
| 52SiO2 30Li2O 18B2O3 | 194 | 614 | 3.16 |
| B2O3 | 113 | 371 | 3.28 |
| Diopside (CaMgSi2O6) | 240 | 1084 | 4.51 |
| Anorthite (CaAl2Si2O8) | 251 | 1135 | 4.52 |
6. Doremus’ (defect) model of viscous flow
Doremus analysed data on diffusion and viscosity of silicates and suggested that diffusion of silicon and oxygen in these materials takes place by transport of SiO molecules formed on dissociation of SiO
2, moreover these molecules are stable at high temperatures and typically results from the vaporization of SiO
2 [
21,
22]. He concluded that the extra oxygen atom resulting from dissociation of SiO
2 leads to five-coordination of oxygen atoms around silicon. The three-dimensional (3D) disordered network of silicates is formed by [SiO
4] tetrahedra interconnected via bridging oxygens ≡Si•O•Si≡, where • designates a bond between Si and O, and – designates a bridging oxygen atom with two bonds •O•. The breaking out a SiO molecule from the SiO
2 network leaves behind three oxygen ions and one silicon ion with unpaired electrons. One of these oxygen ions can bond to the silicon ion. The two other dangling bonds result in two silicon ions that are five-coordinated to oxygen ions. Moreover one of the five oxygen ions around the central silicon ion has an unpaired electron, and it is not bonded strongly to the silicon ion [
21,
22]. Doremus suggested that this electron hole (unpaired electron) should move between the other oxygen ions similar to the resonance behavior in aliphatic organic molecules. There is experimental evidence for five-coordination of silicon and oxygen at higher pressures in alkali oxide SiO
2 melts from NMR, Raman and infrared spectroscopy, and evidence for five-coordinated silicon in a K
2Si
4O
9 glass at atmosphere pressure [
34]. Doremus concluded that in silicates, the defects involved in flow are SiO molecules resulting from broken silicon–oxygen bonds and therefore the SiO molecules and five-coordinated silicon atoms involved in viscous flow derive from broken bonds. The most important in the Doremus’ ideas on the mediating role of broken bonds was the assumption that the defects can agglomerate to form line defects with the fraction of defects molecules in the agglomerates changing with temperature and the relaxation of this fraction to an equilibrium value depending on the time which is consistent with experimental measurements [
22]. Although he failed to reproduce the two-exponential equation of viscosity [
22] it was later shown [
35,
36] that the two exponential equation can be derived using Doremus’ ideas.
Assuming that viscous flow in amorphous materials is mediated by broken bonds, which can be considered as quasi-particles termed configurons [
37], one can find the equilibrium concentrations of configurons:
where
,
is the formation Gibbs free energy,
Hd is the enthalpy,
Sd is the entropy and
C0 is the total concentration of elementary bond network blocks or the concentration of unbroken bonds at absolute zero. The viscosity of an amorphous material can be related to the diffusion coefficient,
D, of the configurons which mediate the viscous flow, via the Stokes-Einstein equation
, where
k is the Boltzmann constant and
r is the radius of configuron. The probability of a configuron having the energy required for a jump is given by the Gibbs distribution
, where
is the Gibbs free energy of motion of a jumping configuron,
Hm and
Sm are the enthalpy and entropy of configuron motion. Thus the viscosity of amorphous materials is directly related to the thermodynamic parameters of configurons by:
with
where
,
f is the correlation factor,
g is a geometrical factor (~1/6),
λ is the average jump length,
z is the number of nearest neighbours and
p0 is a configuration factor.
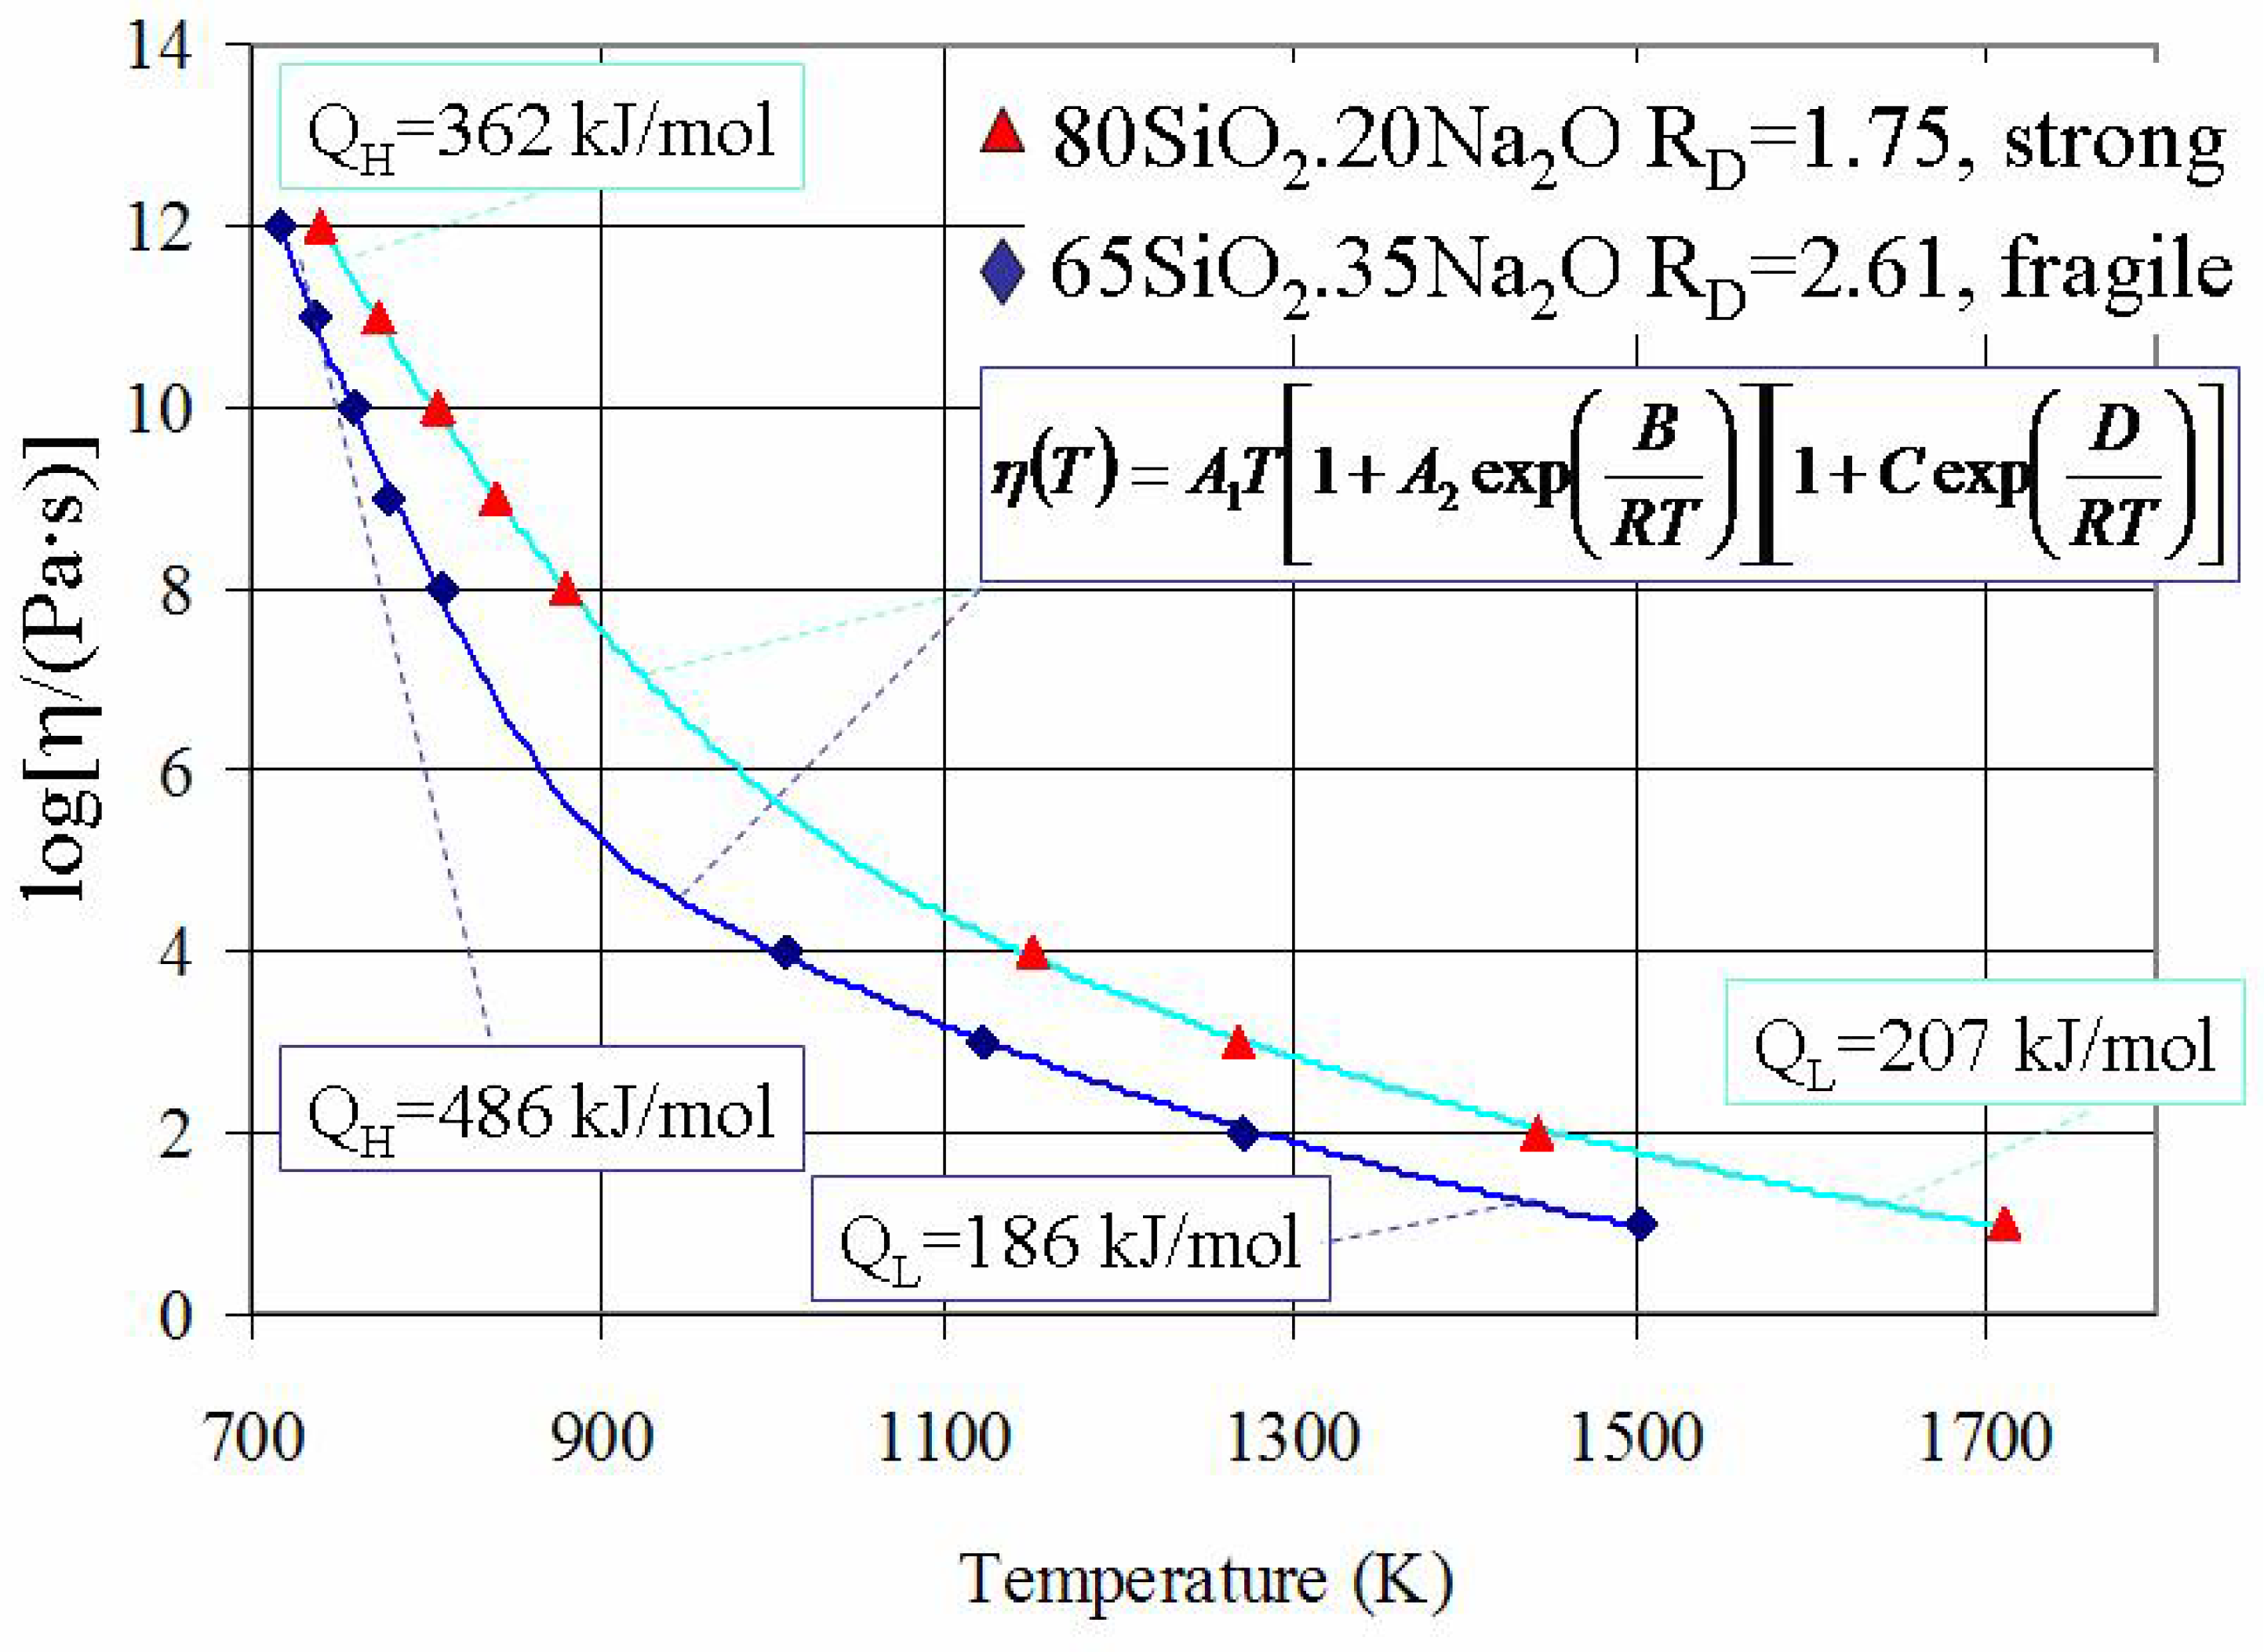
Equation (6) can be fitted to practically all available experimental data on viscosities of amorphous materials. Moreover equation (6) can be readily approximated within a narrow temperature interval by known empirical and theoretical models such as VTF, AG, or a Kohlrausch-type stretched-exponential law. In contrast to such approximations equation (6) can be used in wider temperature ranges and gives correct Arrhenius-type asymptotes of viscosity at high and low temperatures. Equation (6) also shows that at extremely high temperatures when
T → ∞ the viscosity of melts changes to a non-activated,
e.g. non-Arrhenius behaviour, which is characteristic of systems of almost free particles. The five coefficients
A1,
A2,
B,
C and
D in equation (6) can be treated as fitting parameters derived from the experimentally known viscosity data. Having obtained these fitting parameters one can evaluate the thermodynamic data of configurons (
e.g. network breaking defects) [
38]. Note that although this model involves 5 parameters in the fitting procedure the number of combinations available is very restricted by asymptotical behaviour of viscosity at low and high temperature. Hence from known viscosity-temperature relationships of amorphous materials one can characterise the thermodynamic parameters of configurons. As the number of parameters to be found via fitting procedure is high dedicated Genetic Algorithm were used to achieve the best fit between equation (6) and experimental viscosity data [
38]. An example of such evaluation is demonstrated in
Figure 3, which shows the best fits for viscosity-temperature data of amorphous SiO
2-Na
2O systems.
Figure 3.
Viscosity of SiO
2-Na
2O systems where calculated curves were obtained using the equation (6). Note that the VTF equation is also providing a good description of viscosity at such “intermediate” temperatures (see
Figure 2).
Figure 3.
Viscosity of SiO
2-Na
2O systems where calculated curves were obtained using the equation (6). Note that the VTF equation is also providing a good description of viscosity at such “intermediate” temperatures (see
Figure 2).
Using relationships (7) from the numerical data of evaluated parameters
A1,
A2,
B,
C and
D which provide the best fit of theoretical viscosity-temperature relationship (7) to experimental data we can find enthalpies of formation and motion and entropies of formation and motion of configurons (bond system) of amorphous materials [
38]. Evaluated thermodynamic parameters (enthalpies and entropies of formation and motion) of configurons in a number of amorphous materials are given in
Table 3.
Equation (6) shows that at low temperatures (T<Tg) the activation energy of viscosity is constant and high QH=Hd+Hm whereas at high temperatures (T>Tg) the activation energy of viscosity is constant and low QL= Hm. Temperature changes in activation energy of viscosity are thus explained in terms of configuron formation and motion. At low temperatures the activation energy of viscosity takes the full value QH=Hd+Hm because the concentration of broken bonds is low. In contrast at high temperatures the activation energy is completely due to the energy needed to transfer a molecule or a configuron from its original position to the adjacent vacant site e.g. QL= Hm. Note that although restricted to Newtonian flow the Doremus’ model of viscosity can in principle describe the behaviour of non-Newtonian materials which change their structure depending on strain characteristics e.g. assuming that both Hd and Hm are strain rate dependent.
7. Glass-liquid transition
Amorphous materials can be either solid e.g. glassy (vitreous solids) at low temperatures or liquid at high temperatures. The transition from the glassy to the liquid state occurs at glass transition temperature. Liquid-glass transition phenomena are observed universally in various types of liquids, including molecular liquids, ionic liquids, metallic liquids, oxides, and chalcogenides [
7]. There is no long range order in amorphous materials, however at the liquid-glass transition a kind of freezing or transition occurs which is similar to that of second-order phase transformations and which it may be possible to characterise using an order parameter. Amorphous materials can be most efficiently studied by reconstructing structural computer models and analyzing coordination polyhedrons formed by constituent atoms [
39].
Table 3.
Thermodynamic parameters of configurons.
Table 3.
Thermodynamic parameters of configurons.
| Amorphous material | Hd, kJ mol–1 | Hm, kJ mol–1 | Sd/R | Sm/R | Sd/Sm |
|---|
| Silica (SiO2) | 237 | 522 | 17.54 | 11.37 | 1.54 |
| SLS (mass %): 70SiO2 21CaO 9Na2O | 331 | 293 | 44.03 | 24.40 | 1.8 |
| 80SiO2 20Na2O | 155 | 207 | 17.98 | 7.79 | 2.31 |
| 66.7SiO2 33.3PbO | 197 | 274 | 25.40 | 7.3 | 3.48 |
| 65SiO2 35PbO | 231 | 257 | 30.32 | 8.53 | 3.55 |
| 59.9SiO2 40.1PbO | 236 | 258 | 31.12 | 6.55 | 4.6 |
| B2O3 | 258 | 113 | 44.2 | 9.21 | 4.8 |
| 65SiO2 35Na2O | 300 | 186 | 40.71 | 7.59 | 5.36 |
| 70SiO2 30Na2O | 258 | 205 | 34.84 | 5.22 | 5.87 |
| 75.9SiO2 24.1PbO | 262 | 234 | 36.25 | 5.44 | 6.66 |
| Germania (GeO2) | 129 | 272 | 17.77 | 2.49 | 7.14 |
| 75SiO2 25Na2O | 233 | 203 | 30.62 | 4.22 | 7.26 |
| Anorthite (CaAl2Si2O8) | 884 | 251 | 79.55 | 0.374 | 213 |
| 52SiO2 30Li2O 18B2O3 | 420 | 194 | 52.06 | 0.227 | 229 |
| Salol (HOC6H4COOC6H5) | 145 | 118 | 68.13 | 0.114 | 598 |
| α-Phenyl-o-cresol | 172 | 103 | 83.84 | 0.134 | 626 |
| Diopside (CaMgSi2O6) | 834 | 240 | 88.71 | 0.044 | 2016 |
The general theoretical description of the topologically disordered glassy state focuses on tessellations [
40] and is based on partitioning space into a set of Voronoi polyhedrons filling the space of a disordered material. A Voronoi polyhedron is a unit cell around each structural unit (atom, defect, group of atoms) which contains all the points closer to this unit than to any other and is an analogue of the Wigner-Seitz cell in crystals [
1,
2,
3,
40]. For an amorphous material the topological and metric characteristics of the Voronoi polyhedron of a given unit are defined by its nearest neighbours so that its structure may be characterised by a distribution of Voronoi polyhedrons. Considerable progress has been achieved in investigating the structure and distribution of Voronoi polyhedrons of amorphous materials using molecular dynamics (MD) models [
39,
41,
42,
43]. MD simulations reveal that the difference between a liquid and glassy state of an amorphous material is caused by the formation of percolation clusters in the Voronoi network: namely in the liquid state low density atomic configurations form a percolation cluster whereas such a percolation cluster does not occur in the glassy state [
41]. The percolation cluster made of low density atomic configurations was called a liquid-like cluster as it occurs only in a liquid and does not occur in the glassy state. Nonetheless, a percolation cluster can be envisaged in the glassy state but formed by high density configurations [
39,
41]. Solid-like percolation clusters made of high density configurations seems to exist in all glass phase models of spherical atoms and dense spheres [
39,
41]. Thus MD simulations demonstrate that near T
g the interconnectivity of atoms (e.g. the geometry of bonds) changes due to the formation of percolation clusters composed of coordination Voronoi polyhedrons. While these percolation clusters made of Voronoi polyhedrons are more mathematical descriptors than physical objects their formation results in changes in the derivative properties of materials near the T
g [
39]. The liquid-glass transition is thus characterised by a fundamental change in the bond geometries so that this change can be used to distinguish liquids from glasses although both have amorphous structures [
5,
6,
19,
39]. Many models were proposed to examine the transition of a liquid to glass at cooling [see overviews 7, 44-49].
Table 4 outlines several most popular glass transition models.
Table 4.
Glass transition models.
Table 4.
Glass transition models.
| Model | Ordering process | Key concept |
|---|
| Free-volume | No | Change in free (excess) volume |
| Adam-Gibbs | No | Cooperativity of motion |
| Mode-coupling theory | No | Self-trapping (caging) |
| Kinetically constrained | No | Mobility defects |
| Frustration | Icosahedral ordering in glassy phase | Frustration |
| Tanaka’s TOP | Crystallization | Competing ordering (frustration) |
| Configuron percolation | Percolation cluster of broken bonds in liquid phase | Broken bond (configuron) clustering |
7.1. Free-volume model
The free-volume model assumes that when a molecule moves by diffusion it has a certain free volume in its surroundings. The additional (free) volume becomes available above T
g in an amount given by:
where V
g is the molar volume at T
g,
is the change in the volume expansion coefficient which occur at T
g [
50,
51]. The decrease in free volume while approaching the glass transition temperature gives an explanation for the increase of viscosity while approaching it. However pressure dependence of the viscosity and negative dT
g/dP observed for some liquids are rather difficult to explain by this model and the validity of this assumption is questioned [
22,
45,
52]. Known zero and negative values of
are untenable for free-volume model as the free volume contraction could not explain production of relative mobile liquids above T
g. One should also notion that this model cannot properly describe the mechanical response of amorphous materials, especially the results obtained during a compression test.
7.2. Adam and Gibbs model
The Adam and Gibbs model assumes that the lower the temperature the larger number of particles involved in cooperative rearrangements during molecular motion e.g. the dynamic coherence length ξ of molecular motion increases with the decrease of temperature [
32]. The structural relaxation time depends on the configurational entropy S
conf as:
where τ
0 and C are constants. It is then assumed that
, where Δ
Cp is the relaxational part of the specific heat, T
V is the Vogel temperature, which results in VTF type equations. Although limited by its application the concept of cooperativity is well describing many aspects of glass transition [
45].
7.3. Mode-coupling model
The lower the temperature the higher the packing density of an amorphous material. This leads to the stronger memory effect via mode couplings, which induces the self-trapping mechanism in the mode-coupling theory (MCT). The MCT describes this self-trapping based on a non-linear dynamical equation of the density correlator [
48,
53,
54]. The glass transition in MCT is a purely dynamic transition from an ergodic state which occurs at high tempratures to a non-ergodic state at low temperatures. This transition corresponds to a bifurcation point of non-linear equations of motion for density fluctuations when an infinite cluster of completely caged particles is formed. The transition from an ergodic to a nonergodic state occurs at the so-called mode-coupling temperature T
c, which for typical glass formers is T
c~ 1.2T
g. For T < T
c the density correlation function develops a non-zero value in the long-time limit (a finite value of the Edwards–Anderson order parameter). The MCT describes fast β relaxation as resulting from rapid local motion of molecules trapped inside cages, while the slow process of the breakup of a cage itself leads to the α relaxation. However analysis shows that there are no critical singularities above the glass-transition temperature in contrast to the MCT prediction [
45] e.g. there is no singular behavior of viscosity at T
c. Moreover there are no heterogeneities in MCT whereas these are observed experimentally [
45]. Trap models which similarly to MCT regard the glass transition as a dynamic transition consider the distribution of the waiting time of a particle in a random potential so that particles are either trapped in cages formed by their neighbors or jump by thermal activated rearrangements [
45].
7.4. Tanaka’s two-order-parameter (TOP) model
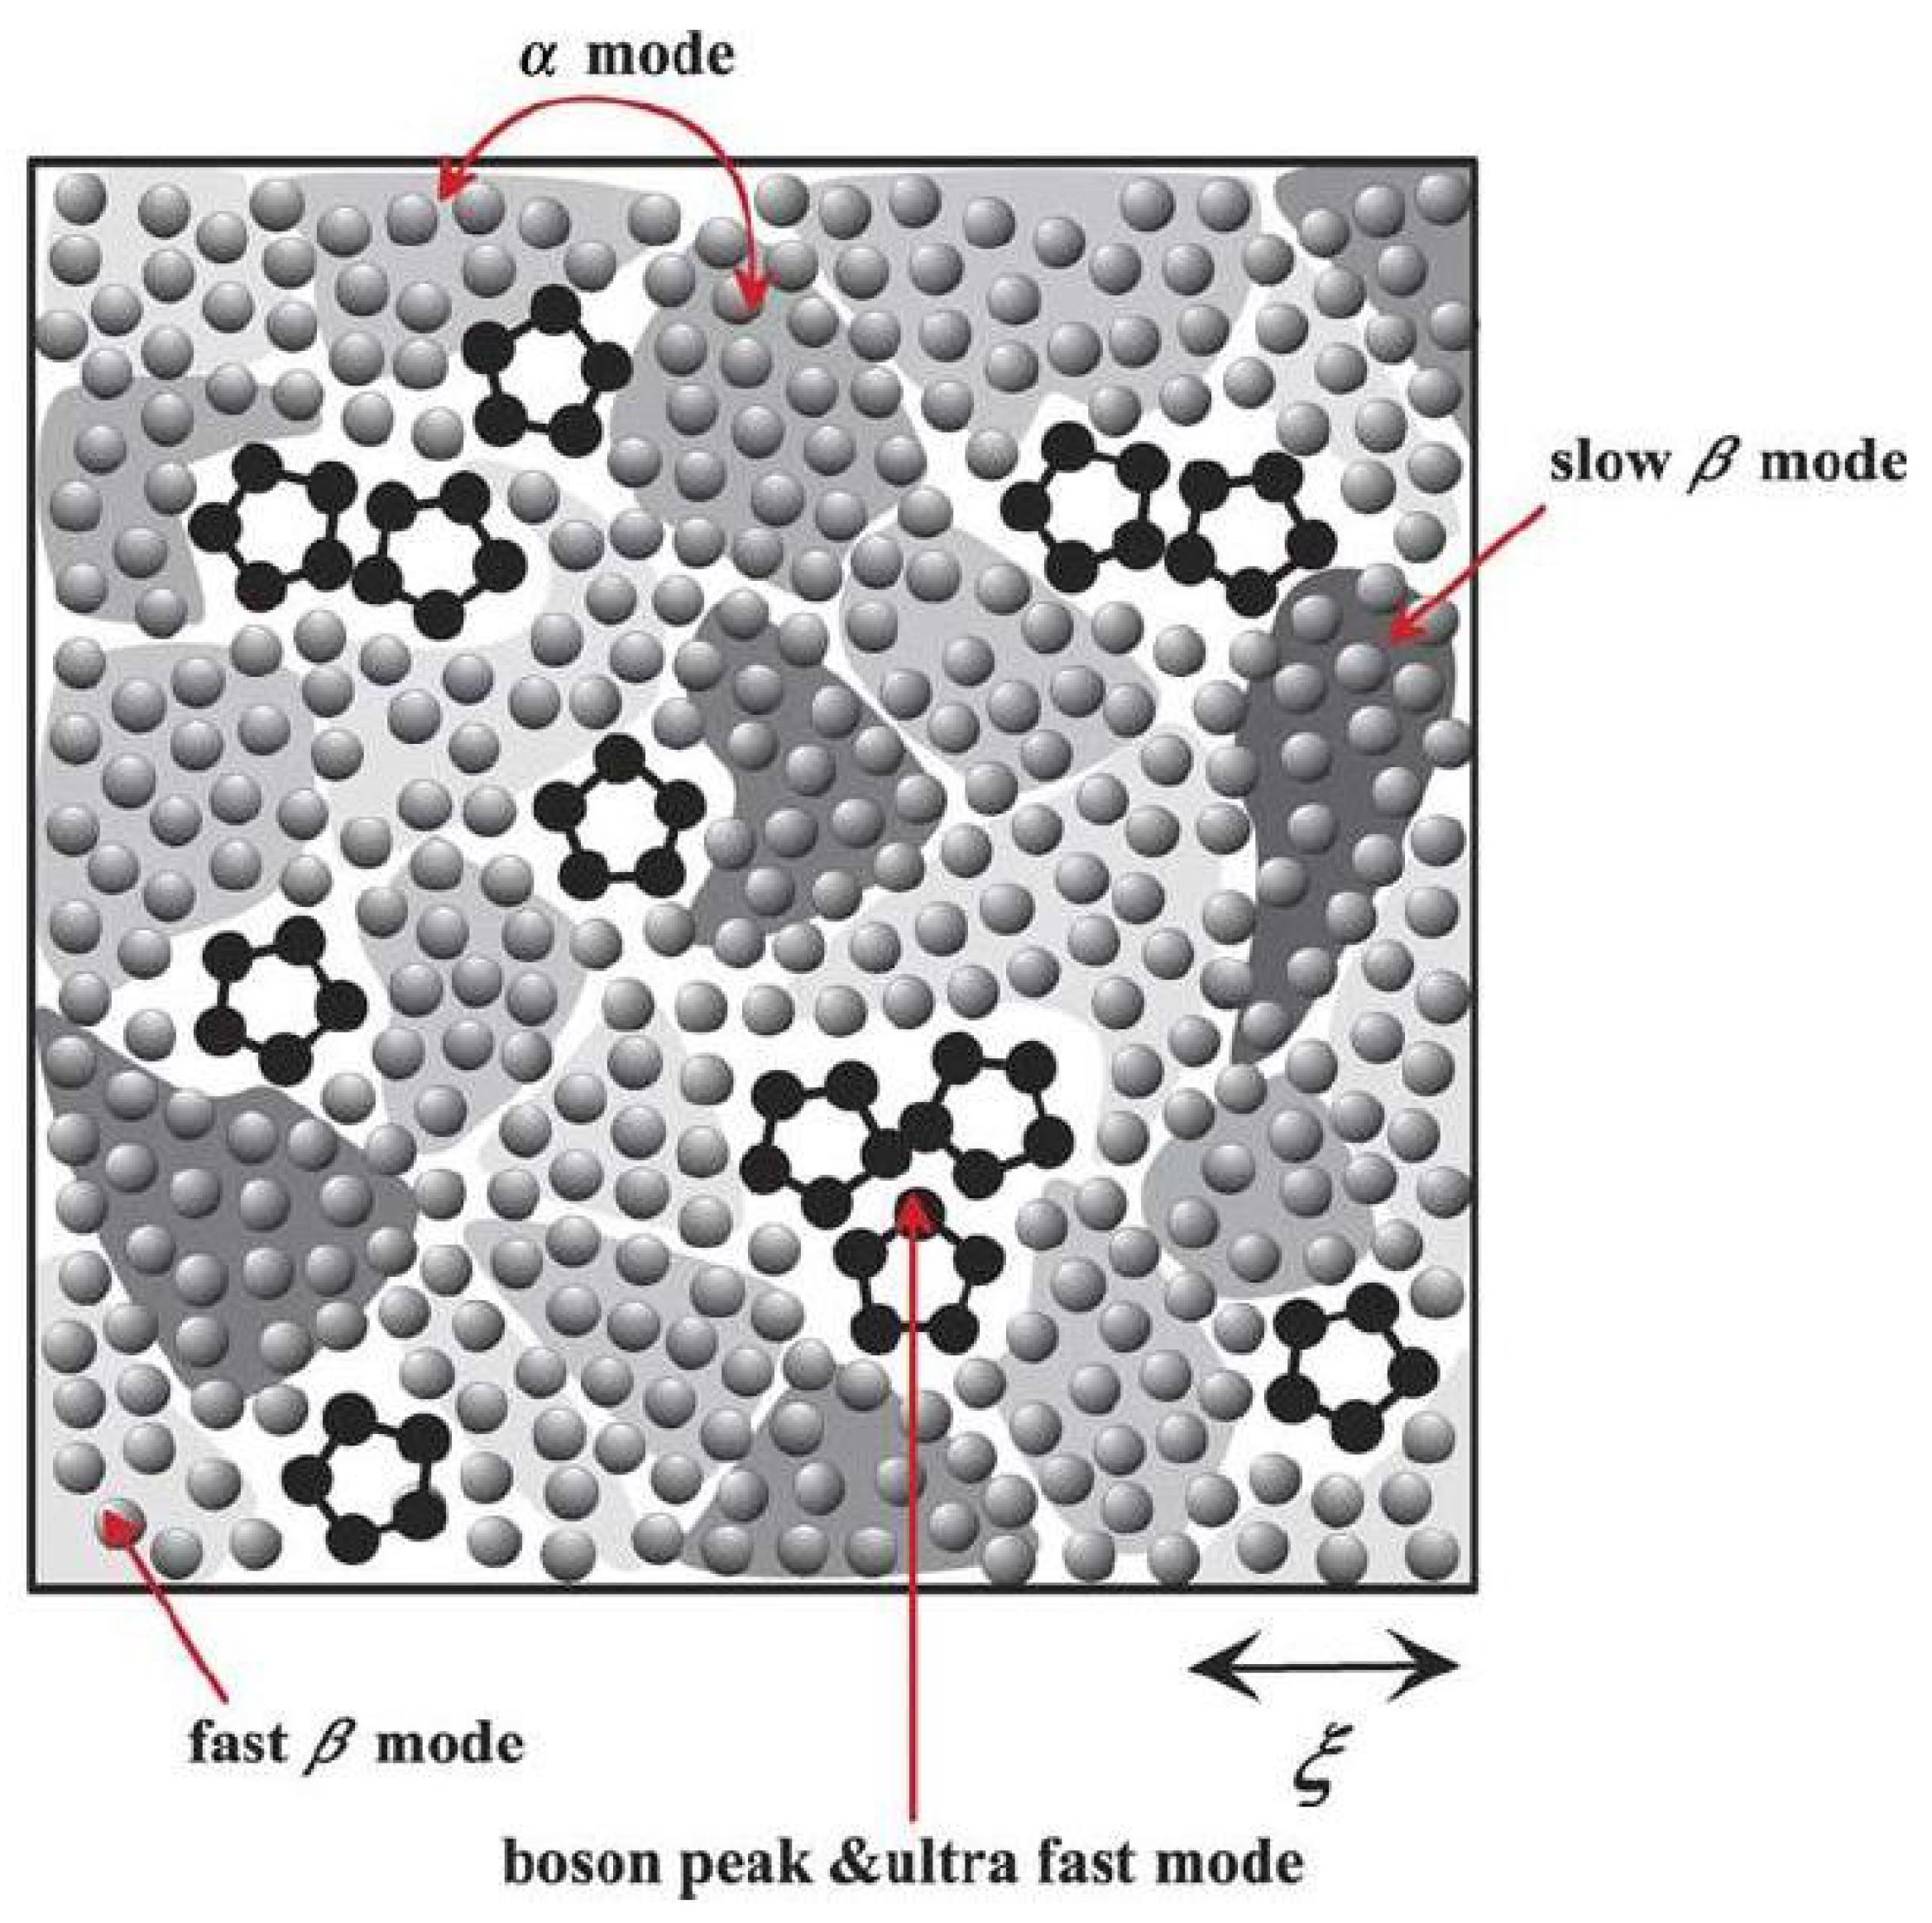
The two-order-parameter (TOP) model is based on an idea that there are generally two types of local structures in liquid: normal-liquid structures (NLS) and locally favored structures (LFS). The liquid is an inhomogeneous disordered state which has LFS created and annihilated randomly (in some cases, cooperatively) in a sea of random NLS. A supercooled liquid which is a frustrated metastable-liquid (the Griffiths-phase-like) state is in a dynamically heterogeneous state composed of metastable solid-like islands, which exchange with each other dynamically at the rate of the structural (α) relaxation time [
45,
55,
56] (
Figure 4).
Figure 4.
Schematic figure of a supercooled liquid state below melting temperature. LFS - black pentagons, NLS - gray spheres. Shaded region represent metastable islands with various degrees of crystal-like order, whose characteristic coherence length is ξ. The darker the colour the higher the crystal-like order and the higher the local density [
55]. Courtesy Hajime Tanaka.
Actual liquids universally have a tendency of spontaneous formation of LFS. The liquid–glass transition in TOP model is controlled by the competition between long-range density ordering toward crystallization and short-range bond ordering toward the formation of LFS due to the incompatibility in their symmetry. Because of this TOP model regards vitrification as phenomena that are intrinsically related to crystallization in contrast to previous models, which regarded vitrification as a result of a homogeneous increase in the density and the resulting cooperativity in molecular motion or the frustration intrinsic to a liquid state itself. TOP model defines the calorimetric glass-transition temperature T
g as the temperature where the average lifetime of metastable islands exceeds the characteristic observation time. The mechanical and volumetric glass-transition temperature is the temperature where metastable islands, which have a long enough lifetime comparable to the characteristic observation time, do percolate [
55]. The degree of cooperativity in TOP model is equal to the fraction of metastable solid-like islands e.g. TOP model operates with two-states: NLS and metastable solid-like islands [
55]. The metastable solid-like islands in TOP model have characteristic nm size ~ξ and are considered as resulting from random first-order transition. The lifetime of metastable islands has a wide distribution with the average lifetime equal to the structural relaxation time. The boson peak corresponds to the localized vibrational modes characteristic of the LFS and their clusters. The fast β mode results from the motion of molecules inside a cage, while the slow β mode from the rotational vibrational motion inside a cage within metastable islands. LFS impede crystallization because their symmetry is not consistent with that of the equilibrium crystal. Due to random disorder effects of LFS a liquid enters into the Griffiths-phase-like metastable frustrated state below the melting point, T
m, where its free energy has a complex multi-valley structure, which leads to the non-Arrhenius behavior of the structural relaxation. The crossover from a non-cooperative to a cooperative regime TOP model describes by the fraction of the metastable solid-like islands given by the crossover function
, where κ controls the sharpness of transition. The NLS are favoured by density order parameter, ρ, which increases the local density and leads to crystallization, while the LFS are favoured by bond order parameter,
, which results from the symmetry-selective parts of the interactions and increases the quality of bonds. The average fraction of LFS (
) is given by
where β=1/k
BT, k
B is the Boltzmann’s constant, P is the pressure, ΔE and
are the energy gain and the volume change upon the formation of a LFS, g
S and g
ρ are the degrees of degeneracy of the states of LFS and NLS, respectively. It is assumed that g
S >> g
ρ and ΔE > 0.
can be either positive or negative depending upon material e.g.
for liquids with tetrahedral units. NLS have many possible configurations as well as various bonding states compared with the unique LFS and there is a large loss of entropy upon the formation of a LFS, which is given by
NLS is a short-lived random structure whereas LFS a long-lived rigid structural element. The lifetime of a LFS can be estimated as
where
is the structural relaxation time of NLS and
is the energy barrier to overcome upon the transformation from a LFS to a NLS. TOP model defines fragility by fraction of LFS: the larger
the stronger (less fragile) the liquid. An example of conclusion drawn from TOP model is the increases the fragility of SiO
2 upon the addition of Na
2O, e.g. the higher the Na
2O content the higher the fragility which conform the experimental data (see
Figure 3). Na
2O acts as a network modifier breaking the Si-Si links via bridging oxygens. Tanaka proposed that Na
2O destabilizes the LFS, e.g. that Na
2O is the breaker of LFS, probably, the 6-member ring structures of SiO
2. Since Na
2O reduces the number density of LFS (
), it increases the fragility of SiO
2 and weaken the boson peak [
56]. LFS impede crystallization because their symmetry is not consistent with that of the equilibrium crystal. A similar idea was exploited by Evteev
et. al. to explain vitrification of amorphous metals [
39,
57]. In addition strong liquids should be more difficult to crystallize than fragile below T
g [
58].
7.5. Frustration models
Local energetically preferred structures over simple crystalline packing impede crystallization because their symmetry is not consistent with that of the equilibrium crystal, e.g. frustrated over large distance. Frustration models assume that the glass transition is a consequence of the geometric frustration [
59,
60,
61,
62]. Typically icosahedron is the most compact and stable from the energy point of view among all coordination polyhedrons encountered in both ordered and disordered densely packed structures such as amorphous metals. E.g. Kivelson et al. [
61,
62] considered frustration of an icosahedral structure which is the low-symmetry reference state, into which a liquid tends to be ordered, and ascribed the glass transition to an avoided critical point of a transition between a liquid and an ideal icosahedral structure. The Hamiltonian used e.g. in [
61,
62] was similar to that of Steinhardt et al. [
60]
where J
S and K
S are both positive. The first term which is a short-range ferromagnetic interaction favours long-range order of the locally preferred structure, while the second term which is a long-range antiferromagnetic interaction is responsible for the frustration effects. The ordering is thus prevented by internal frustration of the order parameter itself as in other frustration models.
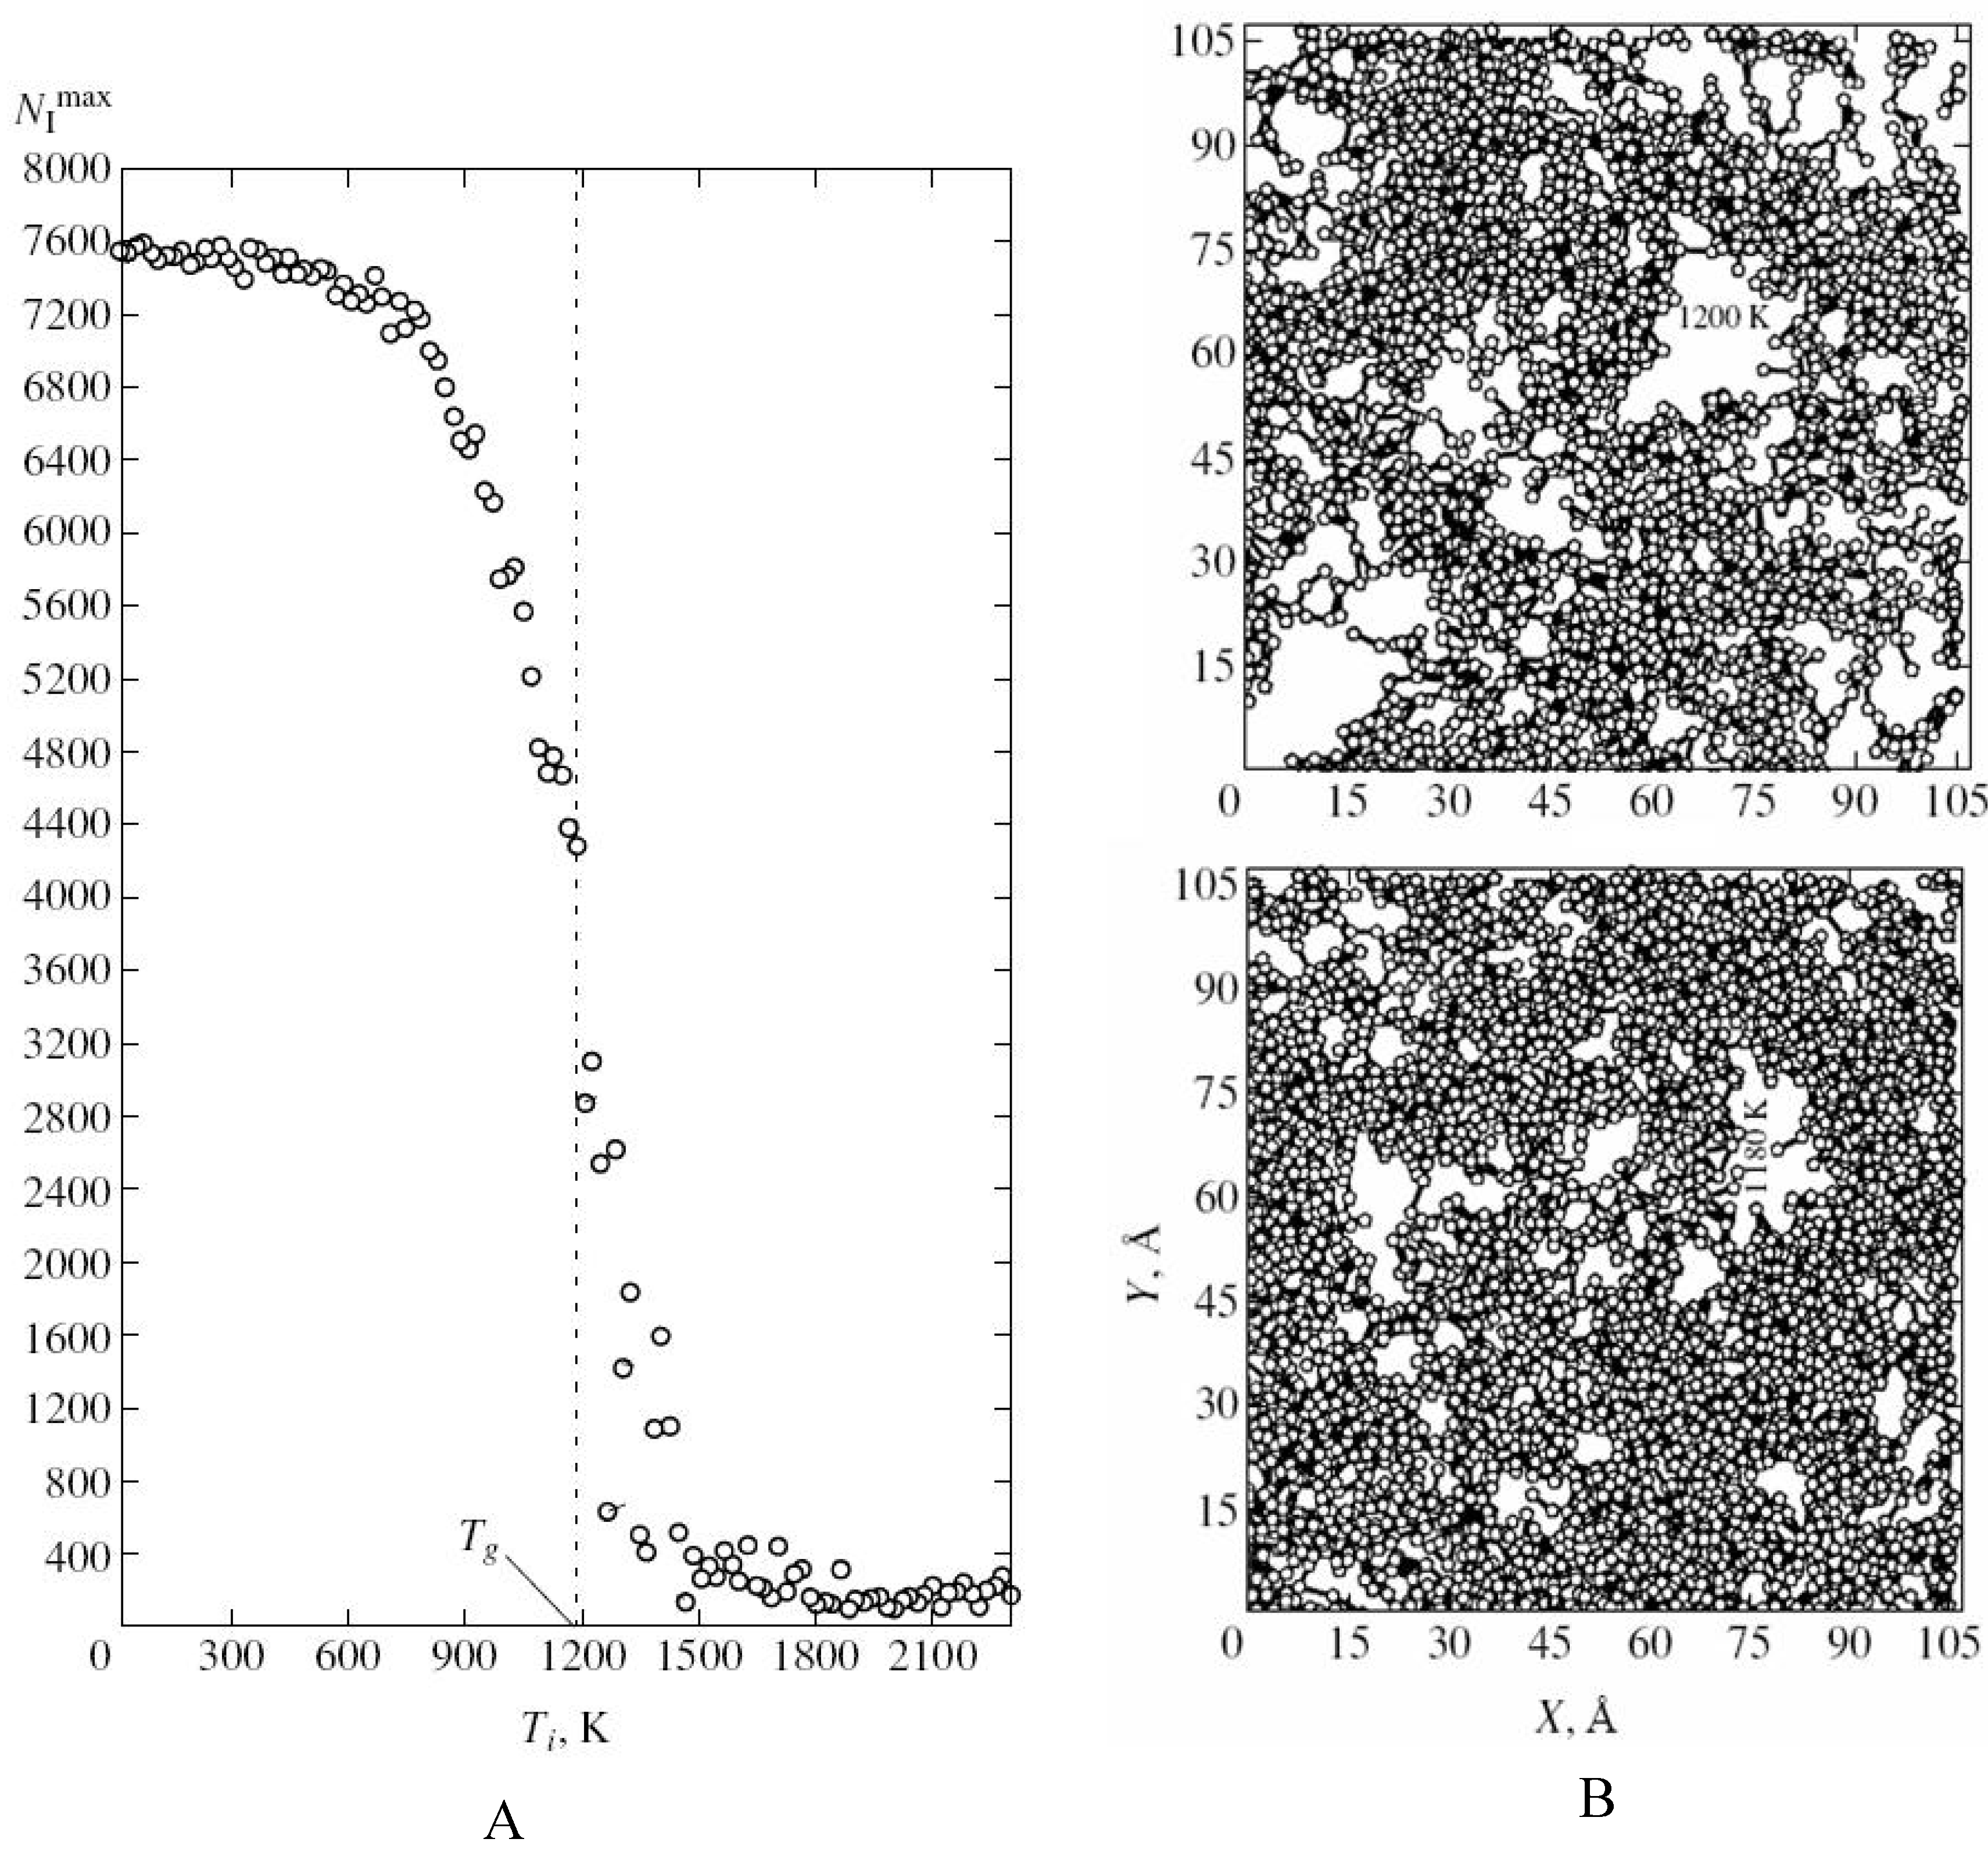
Using MD simulations Evteev
et. al. [
39] showed that in the process of fast cooling of melt iron the fraction of atoms for which the coordination polyhedron is an icosahedron (the Voronoy polyhedron is a dodecahedron) increases most intensely. Moreover formation of a percolation cluster from mutually penetrating and contacting icosahedrons with atoms at vertices and centres provides stabilization of the amorphous phase and impedes crystallization during fast cooling of Fe from melt [
39,
57]. Evteev
et. al. showed that glassy phase forms at the glass transition temperature based on a percolation cluster of mutually penetrating icosahedrons contacting one another, which contain atoms at the vertices and at the centres (
Figure 5). A fractal cluster of icosahedrons incompatible with translational symmetry plays the role of binding carcass hampering crystallization and serves as the fundamental basis of structural organization of the glassy (solid amorphous state) of iron, which basically distinguishes it from the melt. Note that the results obtained in [
39,
57] have generic implications and are not restricted to Fe.
7.6. Kinetically constrained models
Kinetically constrained models consider slow dynamics as of a purely kinetic origin [
45,
63] where dynamical constraints appear below a crossover temperature T
o, or above a corresponding packing fraction so that above T
o the dynamics is liquid-like whereas below T
o the dynamics becomes heterogeneous. Hunt for example defined the glass as a supercooled liquid, whose time scale required for equilibration is a percolation relaxation time and derived the glass transition temperature from equalizing the relaxation time τ
c to the experimental time taken arbitrary as t
exp=100 s [
64]. Hunt’s equation
relates the glass transition temperature T
g with the peak energy in the distribution of hoping barrier heights E
ij of individual relaxation processes
where
is a typical vibrational frequency roughly 10
12 Hz. Using the Coulomb attraction between opposite charges and Lennard-Jones repulsive interaction Hunt obtained an estimation for E
m:
where q and q’ are ionic charges, r
0 is the equilibrium interionic distance minimizing the interaction potential, and ε is the macroscopic dielectric constant. Accounting that on pressure application the internal pressure changes to
where P is pressure, Hunt obtained an excellent description of pressure dependence of the glass transition temperature T
g(P) in ionic liquids [
52,
65]. Moreover this approach gave an explanation of reduced glass transition temperature by confinement in small pores [
66]:
where a is a constant, l is a typical hopping length and L is the pore size. In addition Hunts explained application of Ehrenfest theorems to the glass transition [
67].
Figure 5.
The structure of amorphous iron resulting from molecular dynamics simulations [
39]. A) The size of the largest cluster formed by clustered icosahedrons with the temperature Ti. B) Projections of the largest cluster formed by clustered icosahedrons onto one of the faces of the computational cell at temperatures 1200 K (2) and 1180 K (5). Courtesy Alexander Evteev.
8. Configuron percolation model
The transition of a liquid to a glass has many features of second-order phase transition. Second order phase transformations are characterised by symmetry change. The translation-rotation symmetry in the distribution of atoms and molecules remains unchanged at the liquid-glass transition, which retains the topological disorder of fluids. What kind of symmetry is changed at glass-liquid transition? To answer to this question is expedient to consider the distribution of bonds instead of atoms and to focus the attention on topology of broken bonds at glass-liquid transition [
5,
6,
19,
38].
Consider an ideal disordered network representing an oxide system such as amorphous SiO
2 or GeO
2. Using Angell’s bond lattice model [
37] we can represent condensed phases by their bond network structures. Thus we can focus the attention on temperature changes that occur in the system of interconnecting bonds of a disordered material rather than of atoms. In this approach the initial set of N strongly interacting cations such as Si
+4 or Ge
+4 is replaced by a congruent set of weakly interacting bonds of the system. The number of bonds will be N
b=NZ where Z is the coordination number of cations e.g. Z=4 for SiO
2 and GeO
2. For amorphous materials which have no bridging atoms such as amorphous Fe, Si or Ge, N
b = NZ/2.
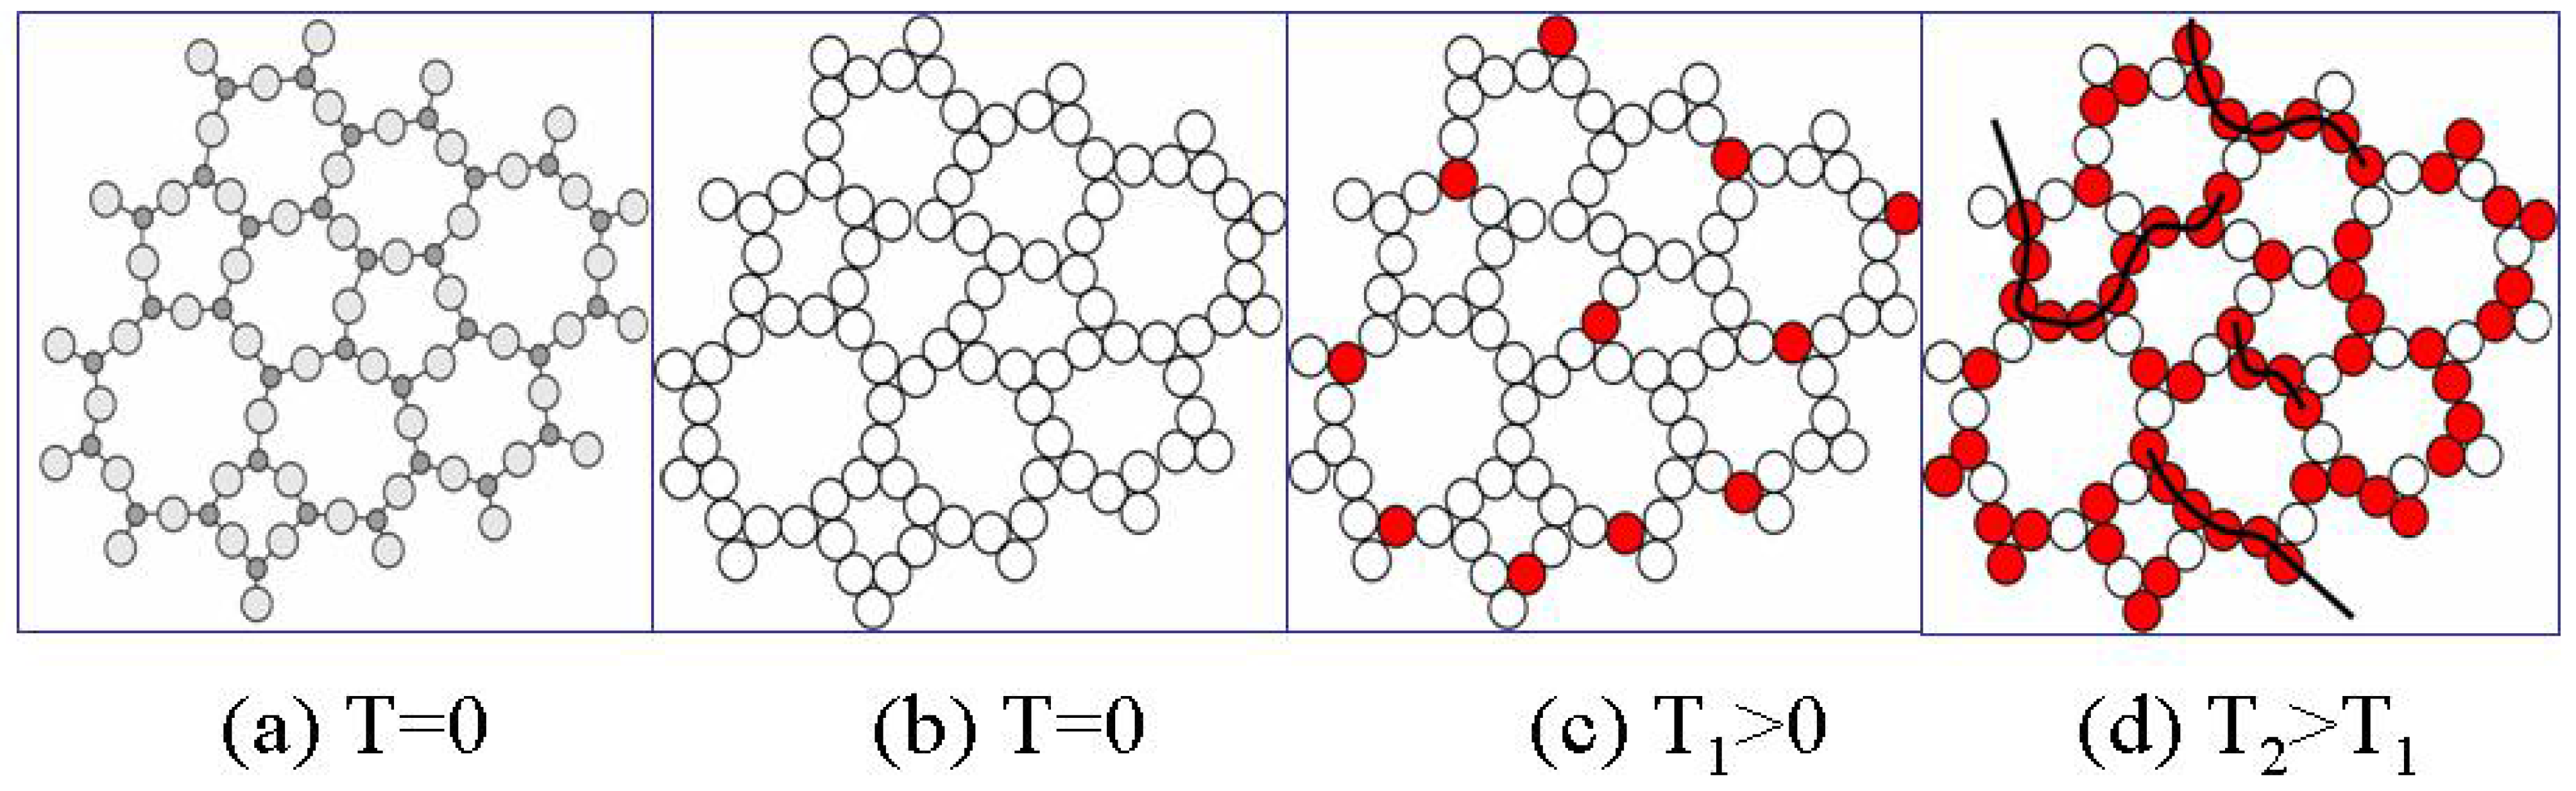
Figure 6a and 6b illustrate schematically the replacement of a disordered atomic structure by the congruent bond structure.
At absolute zero temperature T=0 there are no broken bonds (
Figure 6b), however at any finite temperature T there are thermally-activated broken bonds e.g. configurons (
Figure 6c). Compared with a crystal lattice of the same material the disordered network typically contains significantly more point defects such as broken bonds or vacancies. For example, the relative concentration of vacancies in crystalline metals just below the melting point is only 10
-3 – 10
-4 [
2,
68]. The energetics of the disordered net are weaker and point defects can be formed more easily than in crystals of the same chemical composition. The difference appears from the thermodynamic parameters of disordered networks. The formation of configurons is governed by the formation Gibbs free energy G
d. Temperature-induced formation of configurons in a disordered network can be represented by a reaction involving the breaking of a joining bond, e.g. in amorphous silica
The higher the temperature the higher the concentration of thermally-created configurons. Because the system of bonds has two states, namely the ground state corresponding to unbroken bonds and the excited state corresponding to broken bonds, it can be described by the statistics of two-level systems and the two states of the equivalent system are separated by the energy interval G
d [
36]. The statistics of two level systems leads to the well-known relationship for equilibrium concentrations of configurons C
d and unbroken bonds C
u [
36,
69].
At absolute zero temperature C
u(0)=C
0. At temperatures close to absolute zero the concentration of configurons is very small
. These are homogeneously distributed in the form of single configurons in the disordered bond network. Configurons motion in the bond network occurs in the form of thermally-activated jumps from site to site and in this case all jump sites are equivalent in the network. The network thus can be characterised as an ideal 3-D disordered structure which is described by a Euclidean 3-D geometry. As the temperature increases the concentration of configurons increases. The higher the temperature the higher the concentration of configurons and hence some of them inevitably will be in the vicinity of others. Two and more nearby configurons form clusters of configurons and the higher the concentration of configurons the higher the probability of their clustering (
Figure 6d). The higher the temperature the larger are clusters made of configurons in the disordered bond network. As known from the percolation theory when the concentration of configurons exceeds the threshold level they form a macroscopic so-called percolation cluster, which penetrates the whole volume of the disordered network [
70,
71]. The percolation cluster made of broken bonds forms at glass transition temperature (
Figure 7) and grows in size with the increase of temperature.
Figure 6.
Schematic of disordered bond lattice model of an amorphous material: (a) distribution of atoms in amorphous phase at T=0; (b) distribution of bonds in amorphous phase at T=0; (c) distribution of bonds in amorphous phase at T1>0; (d) distribution of bonds in amorphous phase at higher temperatures T2>T1 when configuron clustering occurs.
As configurons are moving in the disordered network the percolation cluster made of broken bonds is a dynamic structure which changes its configuration remaining however an infinite percolation cluster. The percolation cluster is made entirely of broken bonds and hence is readily available for a more percolative than a site-to-site diffusive motion of configurons. Hence above the percolation level the motion of configurons in the bond network occurs via preferred pathways through the percolation cluster. As the percolation cluster is fractal in dimension the bond system of an amorphous material changes its Hausdorff - Besikovitch dimensionality from Euclidian 3 below T
g (where the amorphous material is solid), to fractal 2.55±0.05 above T
g, where the amorphous material is liquid [
5,
6,
19]. As the bond network of an amorphous material is disordered the concentration of configurons at which the percolation threshold is achieved can be found using the universal critical percolation density
, which remains the same for both ordered and disordered lattices [
70,
71]. The relative concentration of broken bonds is given by
which shows that the higher the temperature the higher is
. Assuming that at
the space is completely filled by configurons one can designate
as the volume fraction of space occupied by configurons. Thus the critical (glass-transition) temperature T
g at which the percolation level is achieved can be found assuming that the configurons achieve the universal critical density given by the percolation theory
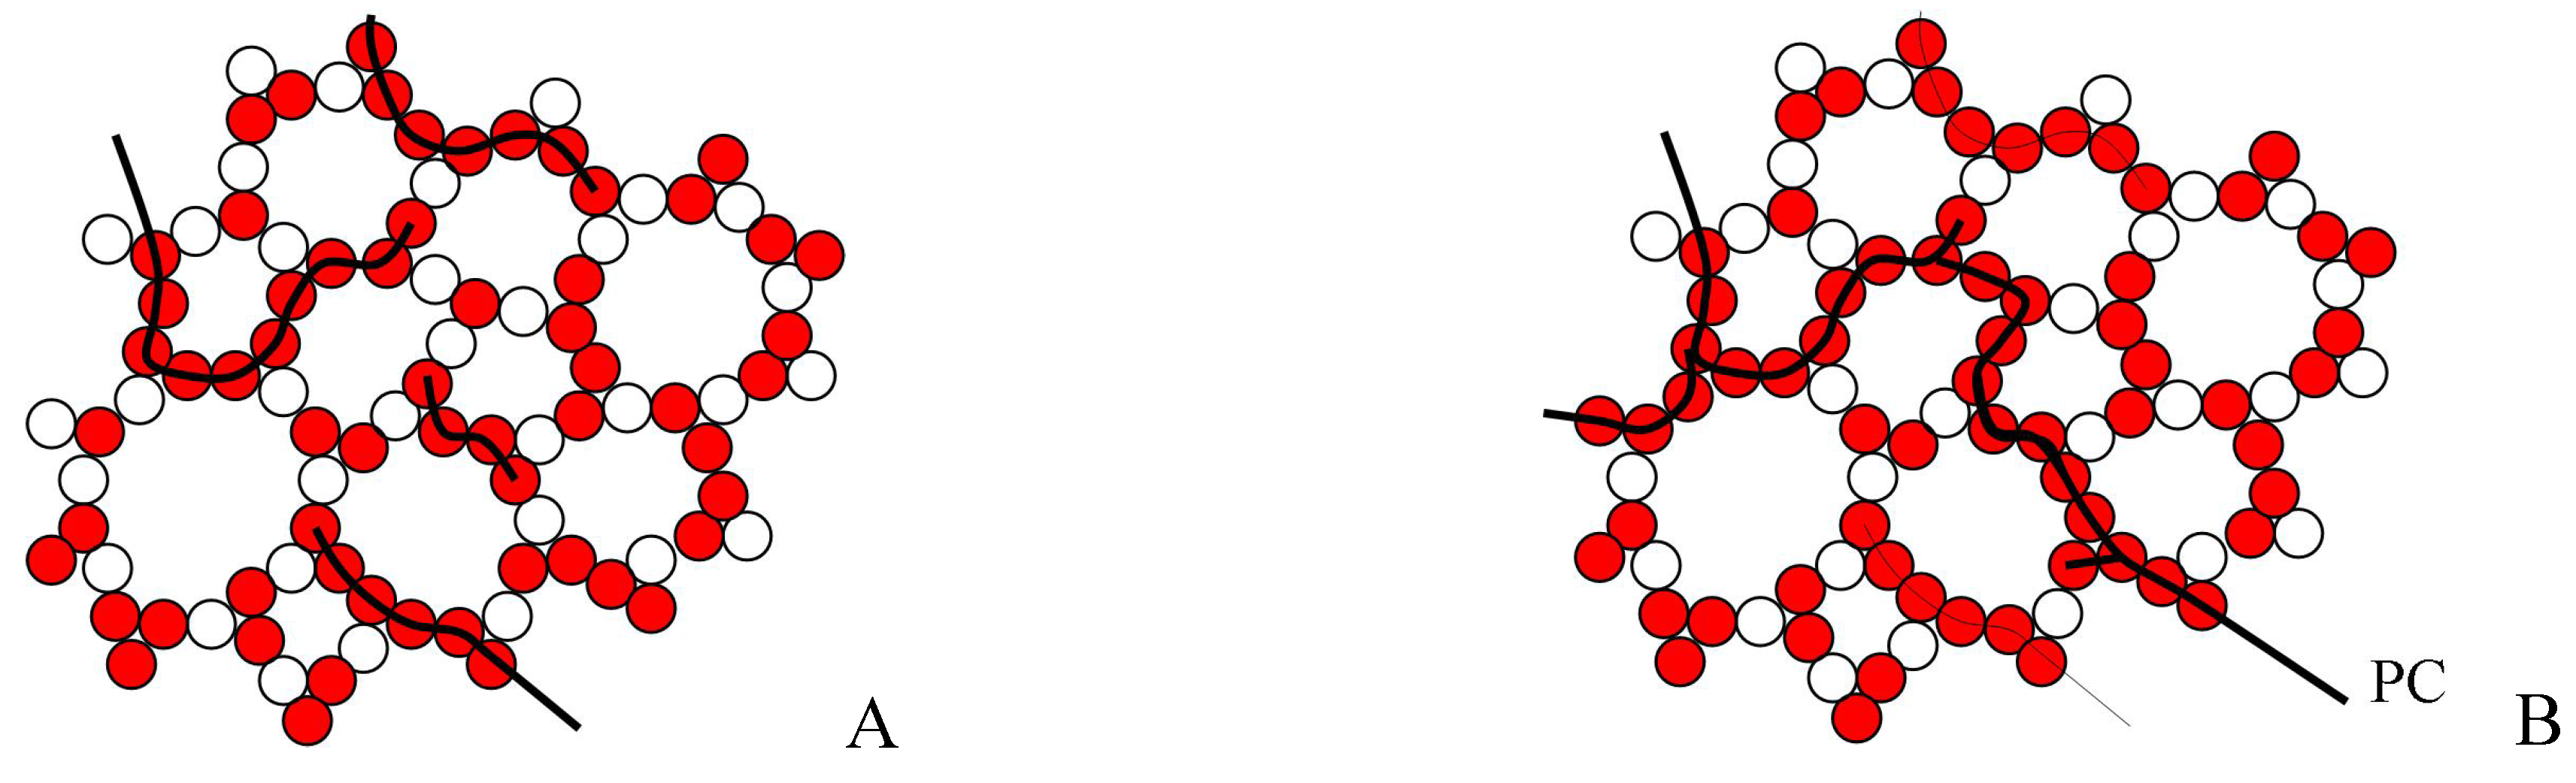
Figure 7.
Schematic of disordered bond lattice model of an amorphous material below (A) and above (B) the glass transition temperature. PC – percolation cluster made of broken bonds.
Figure 7.
Schematic of disordered bond lattice model of an amorphous material below (A) and above (B) the glass transition temperature. PC – percolation cluster made of broken bonds.
For SiO
2 and GeO
2 it was supposed that
where
is the Scher-Zallen critical density in the 3-D space
[
70,
71,
72]. For many percolating systems the value of
can be significantly lower [
71]. At temperatures above T
g the space is filled by configurons at concentrations which exceed the critical density
therefore they form the percolation cluster with fractal geometry changing the state of material from solid-like (glass) to liquid-like. This leads to the following equation of glass transition temperature [
5,
6,
19]:
Note that because S
d>>R this equation can be simplified to T
g ≈ T
gD =H
d/S
d, which is an analogue of Diennes ratio used to assess the melting temperatures of crystalline solids. Below T
g the configurons are uniformly distributed in space and formation of clusters is improbable. The geometry of network defects in this area can be characterised as Euclidean. With increase of temperature at T=T
g, the concentration of defects achieves the critical concentration for formation of a percolation cluster. Above T
g a percolation cluster made of configurons is formed and the geometry of the network becomes fractal. Equation (21) gives excellent data for glass transition temperatures [
5,
6,
19,
38]. Note that the glass transition temperature (21) adiabatically depends on thermal history for several reasons: (i) during cooling a part of material is inevitable crystallised, (ii) configurons need a certain time to relax to their equilibrium sizes and (iii) the enthalpy of configuron formation depends on overall structural state of amorphous material including its quenched density which can be assessed from equation [
36]:
, where
qz is the valence of the cation-anion pair,
e is the standard unit of charge,
da is the average bond distance,
N is the coordination number, and
ε is the dielectric constant of the glass which depends on the thermal history. This estimation is similar to Hunt’s assessment (14) [
65].
The characteristic linear scale which describes the branch sizes of clusters formed by configurons is the correlation length ξ(T). Below the T
g the correlation length gives characteristic sizes of clusters made of confugurons whereas above the T
g it shows characteristic sizes of clusters made of unbroken bonds e.g. atoms. ξ(T) gives the linear dimension above which the material is homogeneous e.g. a material which has on average uniformly distributed configurons or atoms. At sizes smaller compared ξ(T) the amorphous material is inhomogeneous e.g. has a fractal geometry [
70,
71]. Because of formation of percolation cluster the material has a fractal geometry at lengths smaller than ξ(T).
The fractal dimension of percolation clusters is d
f=2.55±0.05. At temperatures far from T
g the correlation length is small whereas at temperatures approaching T
g it diverges:
where the critical exponent ν=0.88 [
70,
71]. Finite size effects in the glass transition are described as a drift to lower values of T
g when sample sizes L decrease [
6]:
One can see that this expression conforms well with eq. (18) e.g. Hunt’s results [
66]. The heat capacity per mole of configurons involved in the percolation cluster near T
g: was found as [
6,
19]
where
, P
0 is a numerical coefficient close to unity e.g. for strong liquids P
0=1.0695, and ΔH<<H
d is the enthalpy of bonding of configurons in the percolation cluster. The configuron model of glass transition shows that the linear expansion coefficient near the T
g behaves as [
6]:
where ΔV
o/V is the relative change of volume per one broken bond. One can observe hence that both thermal expansion coefficient and heat capacity show divergences near T
g proportional to
[
6,
19].
Complex oxide systems are typically fragile. These are described by a modified random network model comprising network modifying cations distributed in channels and the value of
in these systems is significantly lower compared strong materials as can be seen from
Table 5 [
38].
Table 5.
Glass transition temperatures of amorphous materials.
Table 5.
Glass transition temperatures of amorphous materials.
| Amorphous material | RD | Tg/K | fc |
|---|
| Silica (SiO2) | 1.45 | 1475 | 0.15 |
| Germania (GeO2) | 1.47 | 786 | 0.15 |
| SLS (mass%): 70SiO2 21CaO 9Na2O | 2.16 | 870 | 1.58 × 10⁻³ |
| B2O3 | 3.28 | 580 | 9.14 × 10⁻⁵ |
| Diopside (CaMgSi2O6) | 4.51 | 978 | 6.35 × 10⁻⁷ |
| Anorthite (CaAl2Si2O8) | 4.52 | 1126 | 3.38 × 10⁻⁷ |
Data from
Table 5 show that the higher fragility ratio, the lower the threshold for the formation of percolation clusters of configurons in the material. There is a direct anti-correlation between the fragility ratio and configuron percolation threshold which determines the glass transition temperature. Networks that exhibit only small changes in the activation energy for flow with temperature form percolation clusters of configurons at the classical Scher-Zallen critical density. In contrast fragile liquids, which are characterised by a higher density of configurational states, have a very low percolation threshold which decreases with increasing fragility.
Angell interpreted strong and fragile behaviour of liquids in term of differences in topology of the configuration space potential energy hypersurfaces [
27]: e.g. fragile materials have a higher density of configurational states and hence a higher degeneracy leading to rapid thermal excitations. In the bond lattice model of amorphous materials the system of strongly interacting ions is replaced by a congruent set of weakly interacting bonds. The glass transition is related in this model with formation of percolation clusters made of configurons and change of bond Hausdorff-Besikovitch dimension [
5,
6]. The diminishing values of configuron percolation thresholds can be interpreted in term of configuron size or delocalisation. It is deemed that in fragile materials the configurons are larger e.g. delocalised, moreover the higher the fragility ratio the larger the effective configuron radius and its delocalisation. Due to configuron delocalisation the liquid-glass transition, which is associated with the increase of bond Hausdorff-Besikovitch dimension from
to 3, occurs in fragile materials at lower percolation threshold compared strong liquids. The effective configuron radius,
, can be assessed from equation:
where
is the bond radius (half of bond length). E.g. the effective volume of a configuron is
, where V
d is the volume of an instantaneous or non-relaxed configuron,
is the universal critical density in the 3-D space (Scher-Zallen invariant) and
is found by comparing the actual glass transition temperature with that given by Eq. (21). For strong materials
and thus the configuron radii are equal to bond radii. Strong materials such as silica have small radii configurons localised on broken bonds and because of that they should show a smaller dependence on thermal history which conforms to experimental findings [
73]. In fragile materials the effective configuron radii considerable exceed bond radii,
. For example B
2O
3 with fragility ratio R
D=3.28 has
which is due to its specific structure. Both crystalline and vitreous boron oxide consists of planar oxygen triangles centred by boron most of which accordingly to X-ray diffraction data are arranged in boroxol rings (see [
7]). The two dimensional nature of the B
2O
3 network means that the third direction is added by crumbling of the planar structures in a three-dimensional amorphous boric oxide which result in effective large size configuron compared bond length. Another example is for polymers where the mobile entities are much mole complex compared oxides. This results in percolation thresholds
dependent on the geometry of involved entities and relative large radii configurons, which are considered spherically symmetric. Note that in this paper consideration is restricted to simple and fairly isotropic entities.
9. Order parameter and symmetry changes at glass transition
The percolation cluster is also called an infinite cluster as it penetrates the whole volume of material which as a result drastically changes its physical properties from solid-like below to fluid-like above the percolation threshold. The geometry of a percolation cluster at least near the percolation threshold is fractal with the Hausdorff-Besikovitch dimension
, where β and ν are critical exponents (indexes) and d=3 is the dimension of the space occupied by the initial disordered network, so that
. The formation of percolation cluster changes the topology of bonds network from the 3-D Euclidean below to the fractal
-dimensional above the percolation threshold. An amorphous material is represented by a disordered bond network at all temperatures, however it has a uniform 3-D distribution of network breaking defects at low concentrations in a glassy state and a fractal
-dimensional distribution at high enough temperatures when their concentration exceeds the percolation threshold in the liquid state.
Changes that occur in the geometries of amorphous material at T
g affect their mechanical properties. Above T
g as the geometry is fractal as in liquids [
43] the mechanical properties are similar to those of liquids. The structure of material remains disordered at all temperatures although the space distribution of configurons as seen above is different below and above the percolation threshold changing the geometry from the Euclidean to fractal. Although to a certain extent being disordered at all temperatures the bond structure above the percolation threshold becomes more ordered as a significant fraction of broken bonds e.g. configurons belong to the percolation cluster. Such a behaviour conform the notion of joint consideration of the whole system to characterise properly the ordering [
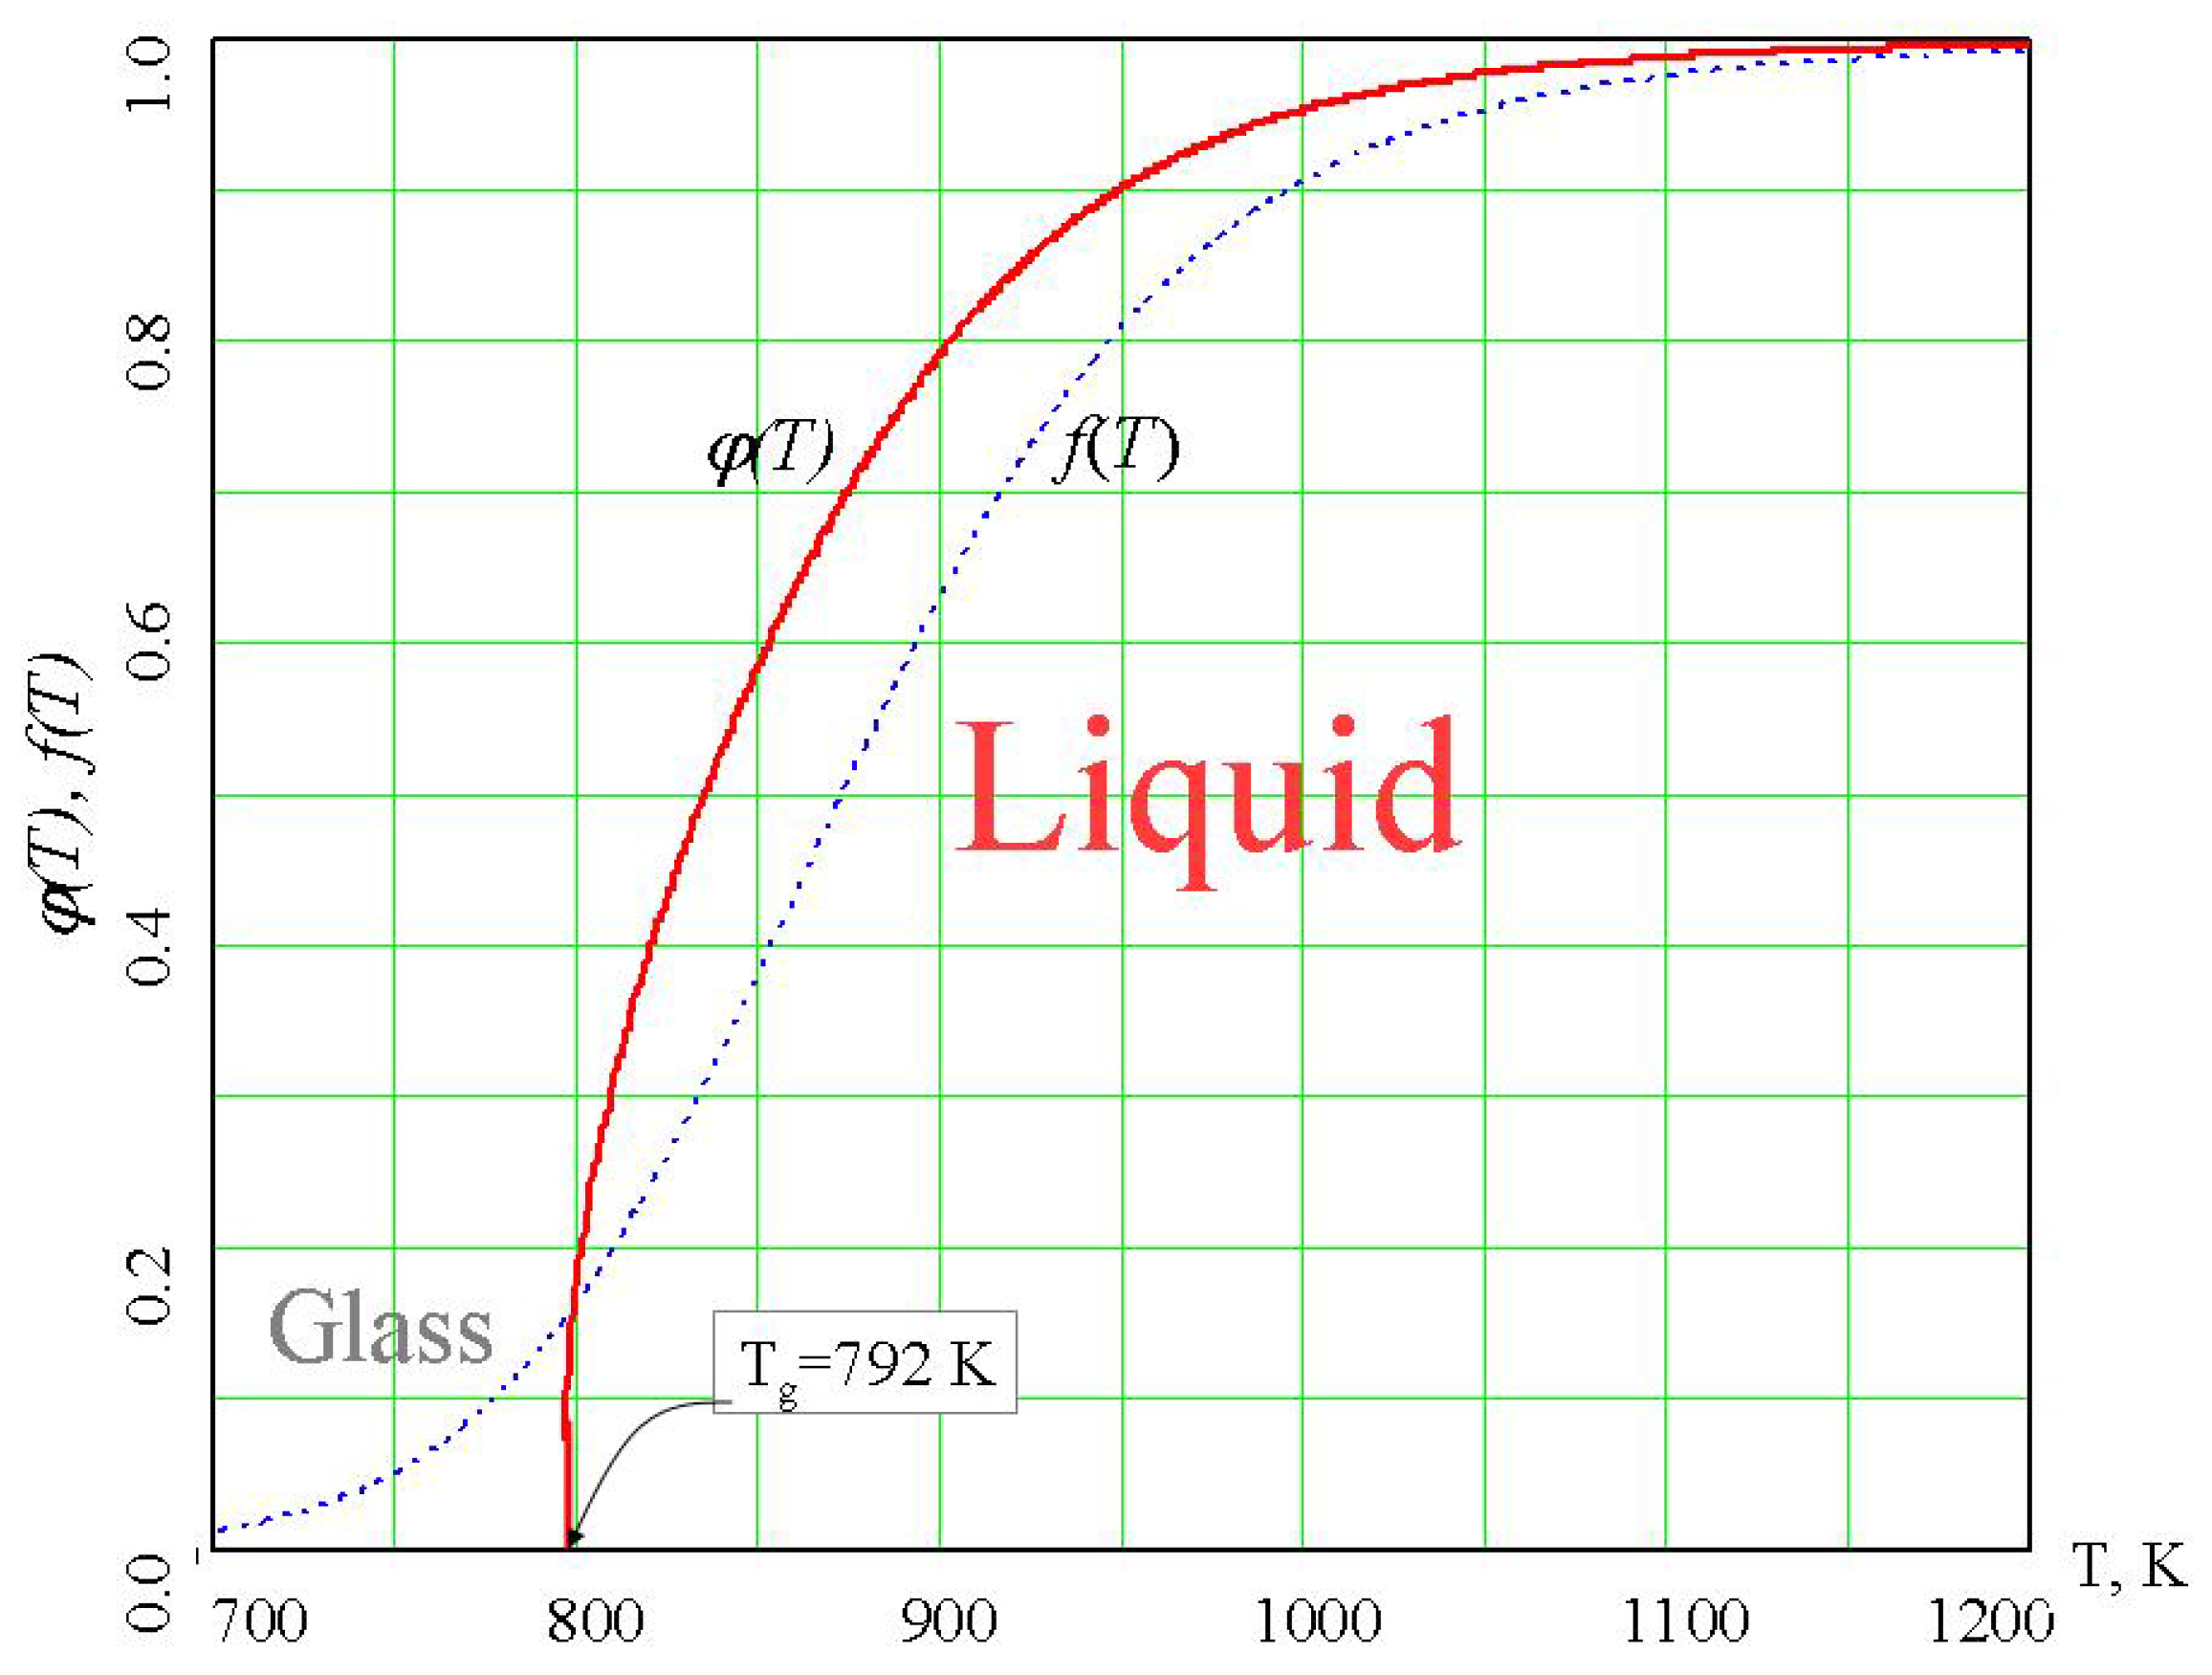
74]. The density of the percolation cluster of configurons, φ, can serve as the order parameter [
6,
75] and for the liquid phase it has non-zero values whereas for the glassy phase φ=0 (
Figure 8).
Second-order phase transitions in ordered substances are typically associated with a change in the crystal lattice symmetry, and the symmetry is lower in the ordered phase than in the less ordered phase [
76]. In the spirit of Landau’s ideas, the transition from a liquid to a glass spontaneously breaks the symmetry of bonds. The description of a second-order phase transition as a consequence of a change in symmetry is given by the Landau–Ginzburg theory [
76]. The order parameter φ, which equals zero in the disordered phase and has a finite value in the ordered phase, plays an important role in the theory of second-order phase transitions. For a glass–liquid transition, which is similar to second order phase transformations, the density of the percolation cluster of configurons is an order parameter [
6].
Figure 8.
Temperature dependence of the order parameter of configurons φ(T) in amorphous GeO
2 [
6].
Figure 8.
Temperature dependence of the order parameter of configurons φ(T) in amorphous GeO
2 [
6].
Crystalline materials are characterised by 3-D Euclidean geometries below their melting point T
m. Thus both glasses below T
g and crystals below T
m are characterised by the same 3-D geometry. Glasses behave like isotropic solids and are brittle. Because of the 3-D bond geometry glasses break abruptly and the fracture surfaces of glasses typically appear flat in the ‘‘mirror’’ zone. Glasses change their bond geometry at T
g. When melting occurs the geometry of crystalline materials also changes, as revealed by MD experiments to fractal structure with d
f≈2.6 [
43]. It is also known that emulsion particles have homogeneous fractal distribution in liquids and the fractal dimension of emulsions is d
f=2.5±0.1 [
77]. With the increase of temperature the clusters of configurons grow in size whereas clusters of atoms decrease their sizes. Finally when no unbroken bonds remain in the system the material is transformed to a gaseous state. Therefore for the system of bonds the phase changes can be represented by the consequence of changes of Hausdorff dimension D=3 (solid) → d
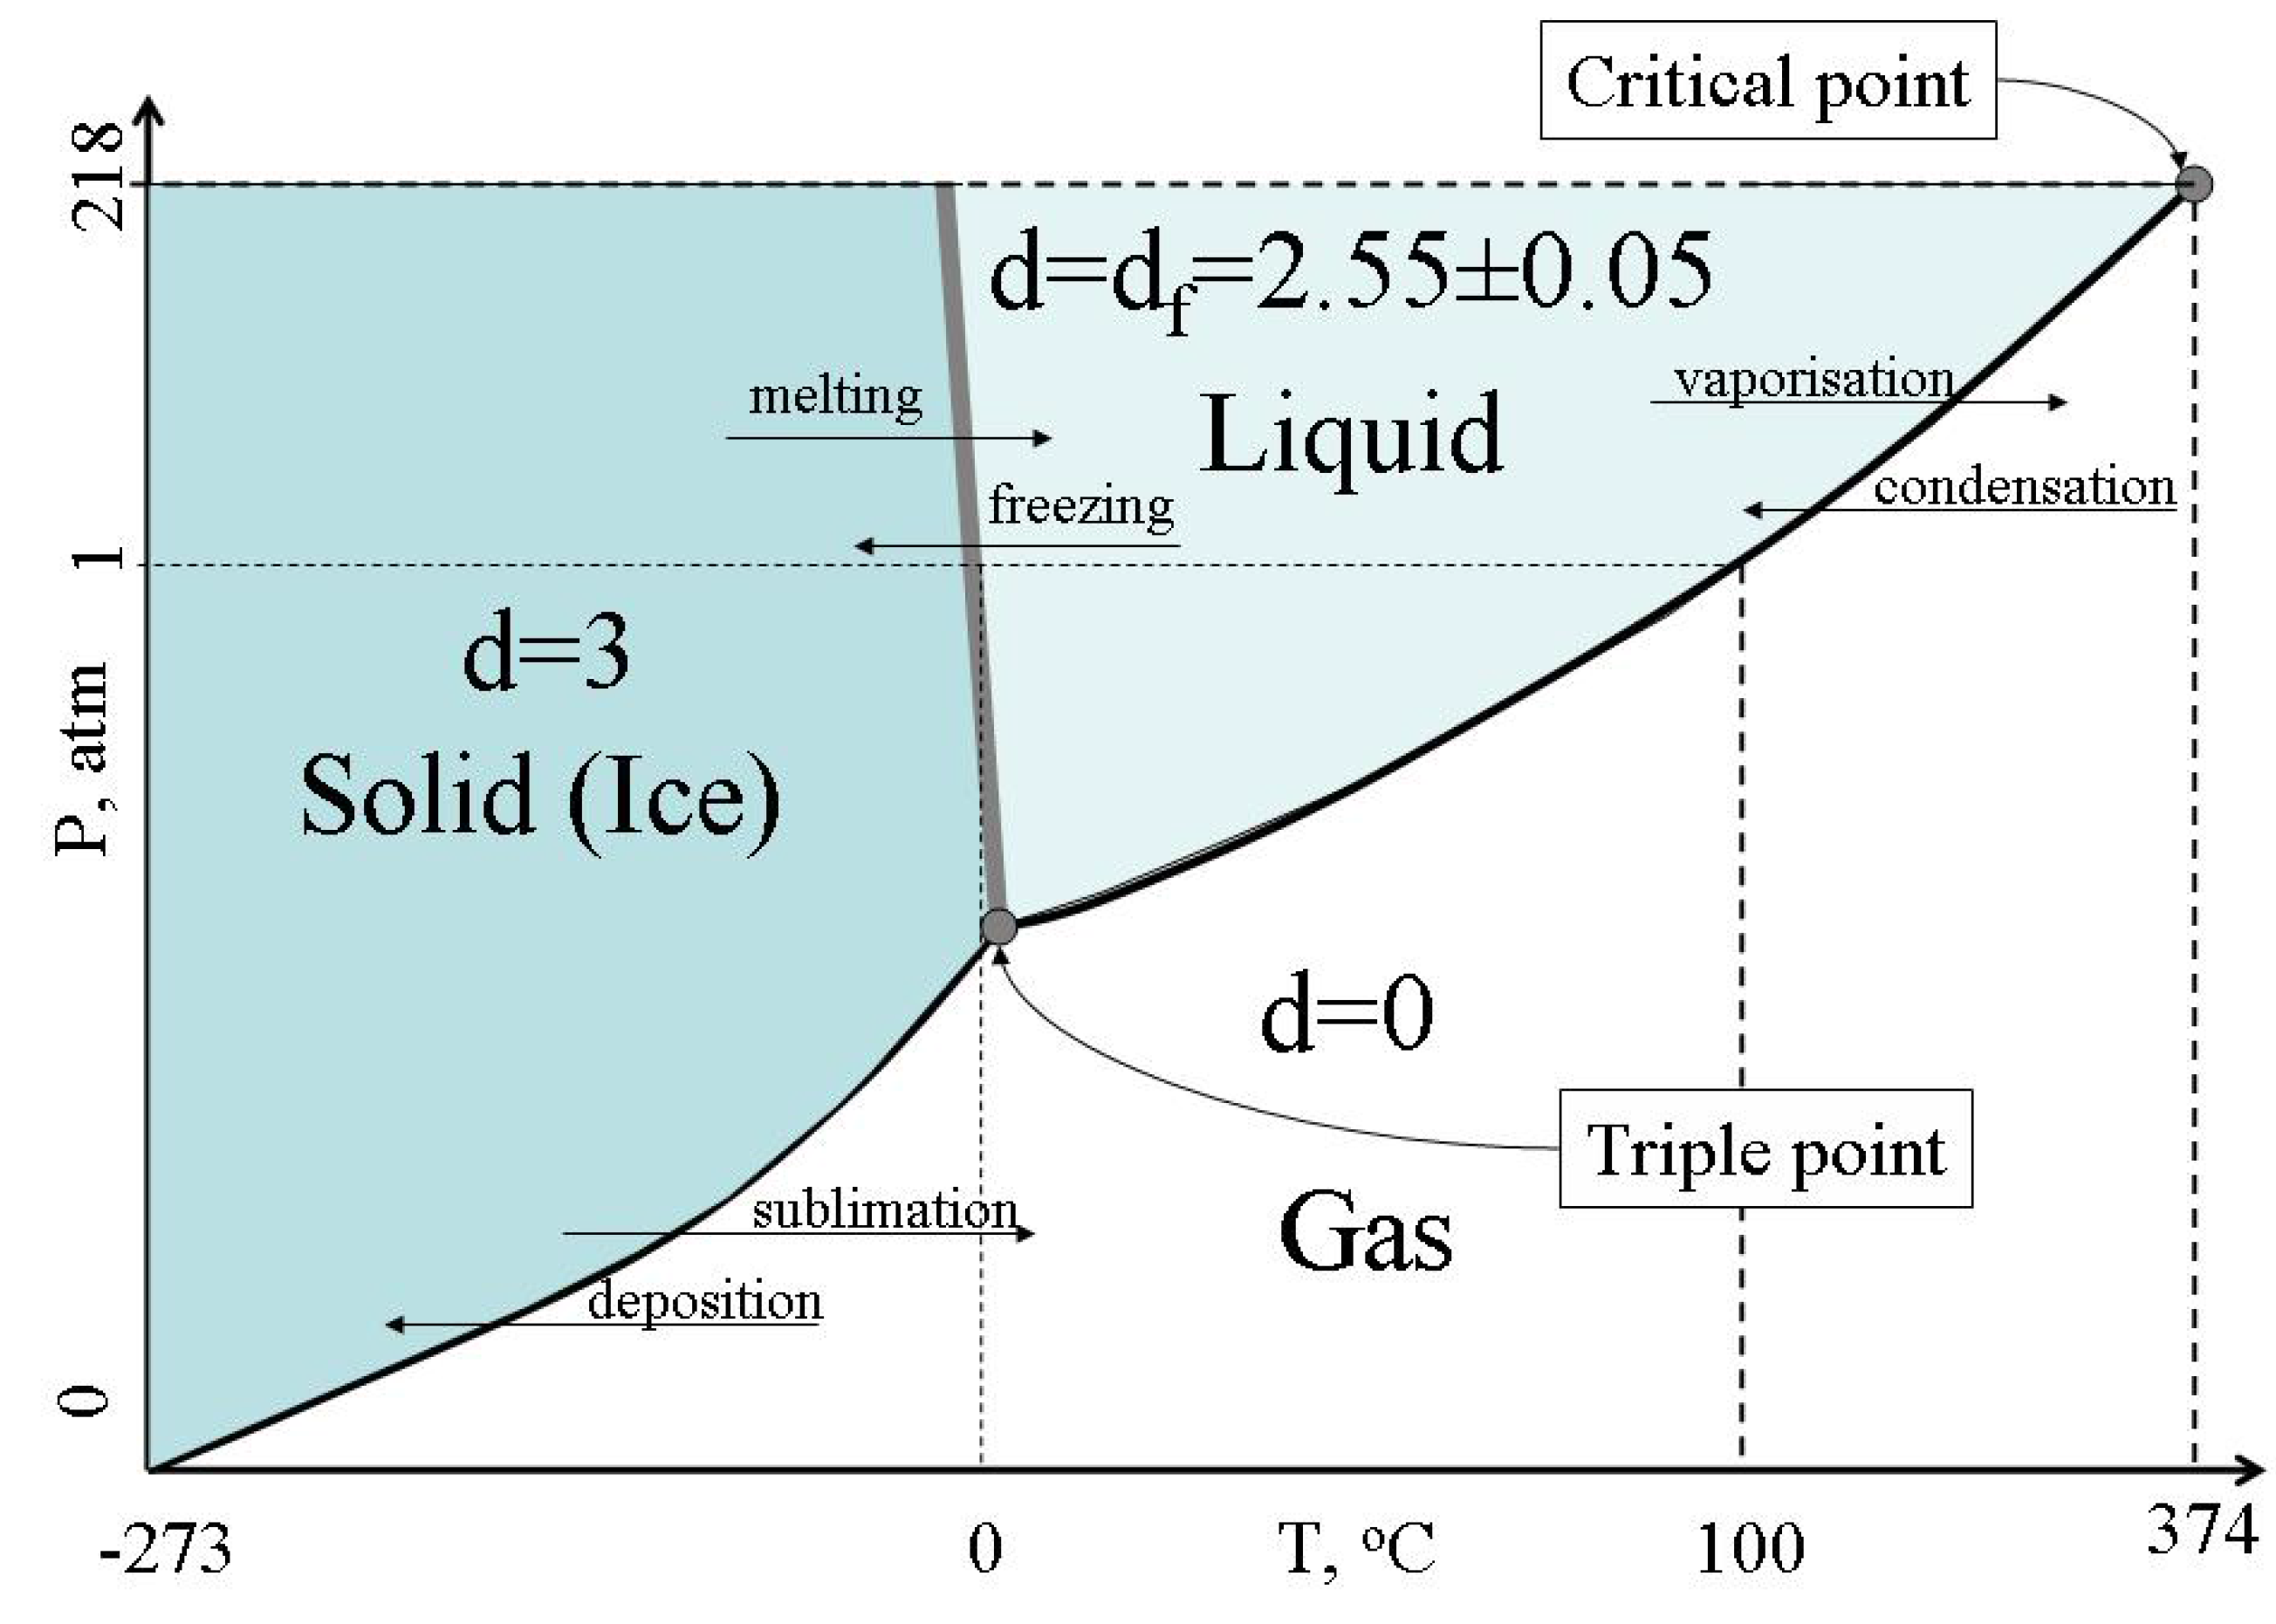
f=2.55±0.05 (liquid) → d = 0 (gas).
Figure 9 illustrates symmetry changes at phase transitions of water.
Figure 9.
Changes of Hausdorff dimension of the system of bonds at the water phase changes.
Figure 9.
Changes of Hausdorff dimension of the system of bonds at the water phase changes.
10. Relaxation effects and thermal history dependence of glass-liquid transition
Formation of a configuron involves breaking of a bond followed by strain relaxation effects in the lattice near the broken bond. The instantaneous breakage of a bond introduces a non-equilibrated configuron of initial volume V
d which will evolve with time typically becoming more extended in space than the initial bond in the random bond lattice. The nature of this relaxation is governed by structural changes and its characteristic timescale is governed by Maxwell relaxation time
, where η is the viscosity and G
∞ is the shear modulus. At the glass-liquid transition Maxwell relaxation time has the order of 10
2 – 10
3 s [
18,
44]. Depending on cooling conditions the configuron can achieve its equilibrium radius r
c or retain the radius r
c(t) which corresponds to the actual structure frozen. E.g. in systems cooled rapidly compared to τ
M we can be at conditions where a fictive temperature should be used in order to characterise correctly the processes occurring [
44,
78].
Consider how structure relaxation near broken bonds can affect the configuron effective volumes (radii) and then the glass transition temperature. Bond breaking or formation processes induce in the bond lattice instantaneous stresses and strains which relax with time. Relaxation of the structure near a broken bond involves adjusting the motions of atoms in its vicinity. These effects can be described using either a multi-body approach or in a continuous medium approximation. In the latter case they are similar to processes such as formation and collapse of a bubble or a pore [
79,
80,
81]. The dynamic (formation and collapse) of a bubble in a liquid is described by the Rayleigh-Plesset equation for the bubble radius [
79,
80]. The Rayleigh-Plesset equation however has no analytical solutions in viscous media but is analytically integrable in the case of void bubbles when the ambient hydrostatic pressure is absent [
82]. In low viscosity liquids bubble volume (radius) follows the Rayleigh solution V ~ t
6/5 (r ~ t
2/5) [
79] whereas for very viscous liquids viscous damping follows a smooth (viscous damping) decrease of bubble radius [
82], which can be expressed as V ~ t
m , where as the viscosity increases the exponent m becomes smaller m<1. Numerical study of bubble growth in liquids has also shown that the bubble growth proceeds much slower if the viscosity is higher [
81]. Based on solutions of Navier-Stokes equations we can assume that for times t ≤ τ
M, e.g. at cooling rates q > q
0 = ΔT/τ
M, where ΔT is the temperature drop, the configuron volume changes with time from its instantaneous volume V
d to the relaxed one V
c, approximately as:
with m <1 near the glass transition. Here Δ
V = (
Vc −
Vd).
Configuron formation and particularly their relaxation resemble in some aspects the Adam-Gibbs picture of cooperative rearrangements during molecular motion [
32]. However both non-relaxed and relaxed configurons are quasiparticles associated with bond breakages and occur both below and above the glass transition temperature whereas Adam-Gibbs cooperative regions are statistically distributed entities whose volumes strongly depend on temperature. Moreover the liquid-glass transition in the configuron percolation model is associated with the threshold concentration of configurons rather than relaxation effects connected with equilibration of strains induced by bond breakages.
The temperature of glass-liquid transition in the configuron percolation model of glass transition (Eq (21)) is affected by melt thermal history for several reasons: (i) configuron volumes depend on cooling rate when there is not enough time for configurons to relax to equilibrium; (ii) configuron formation parameters depend on structural relaxation; (iii) crystallisation processes at low cooling rates intervene to induce size-dependent effects [
19].
Consider the effect of configuron relaxation on thermal history dependence of glass-liquid transition which is caused by dependence of actual percolation threshold on configuron volume. The higher the viscosity of an amorphous material the slower the stresses relax and consequently longer times are required for equilibrium configurons to be formed. At high viscosities, which are characteristic for temperatures near and below T
g, configurons could require very long times to equilibrate. Hence for a melt cooled with an infinitely high cooling rate q →∞ there is not enough time for equilibrium configurons to be formed, and the system of non-relaxed configurons with smaller than equlibrium radii is frozen much before relaxation can occur to form equilibrium configurons. Because non-equilibrium configuron radii are smaller than equilibrium ones, higher configuron concentrations are required to form a macroscopic percolation cluster at higher cooling rates. Therefore at higher cooling rates the glass transition temperature observed will be higher. At slower cooling rates more time is available for equilibration of configurons and configuron radii are larger. Smaller concentrations of configurons are consequently required to form a configuron percolation cluster and hence the glass transition temperature will be lower at lower cooling rates. Moreover hysteresis effects on heating inevitably derive from the fact that upon reheating the configuron radii increase further toward their equilibrium value r
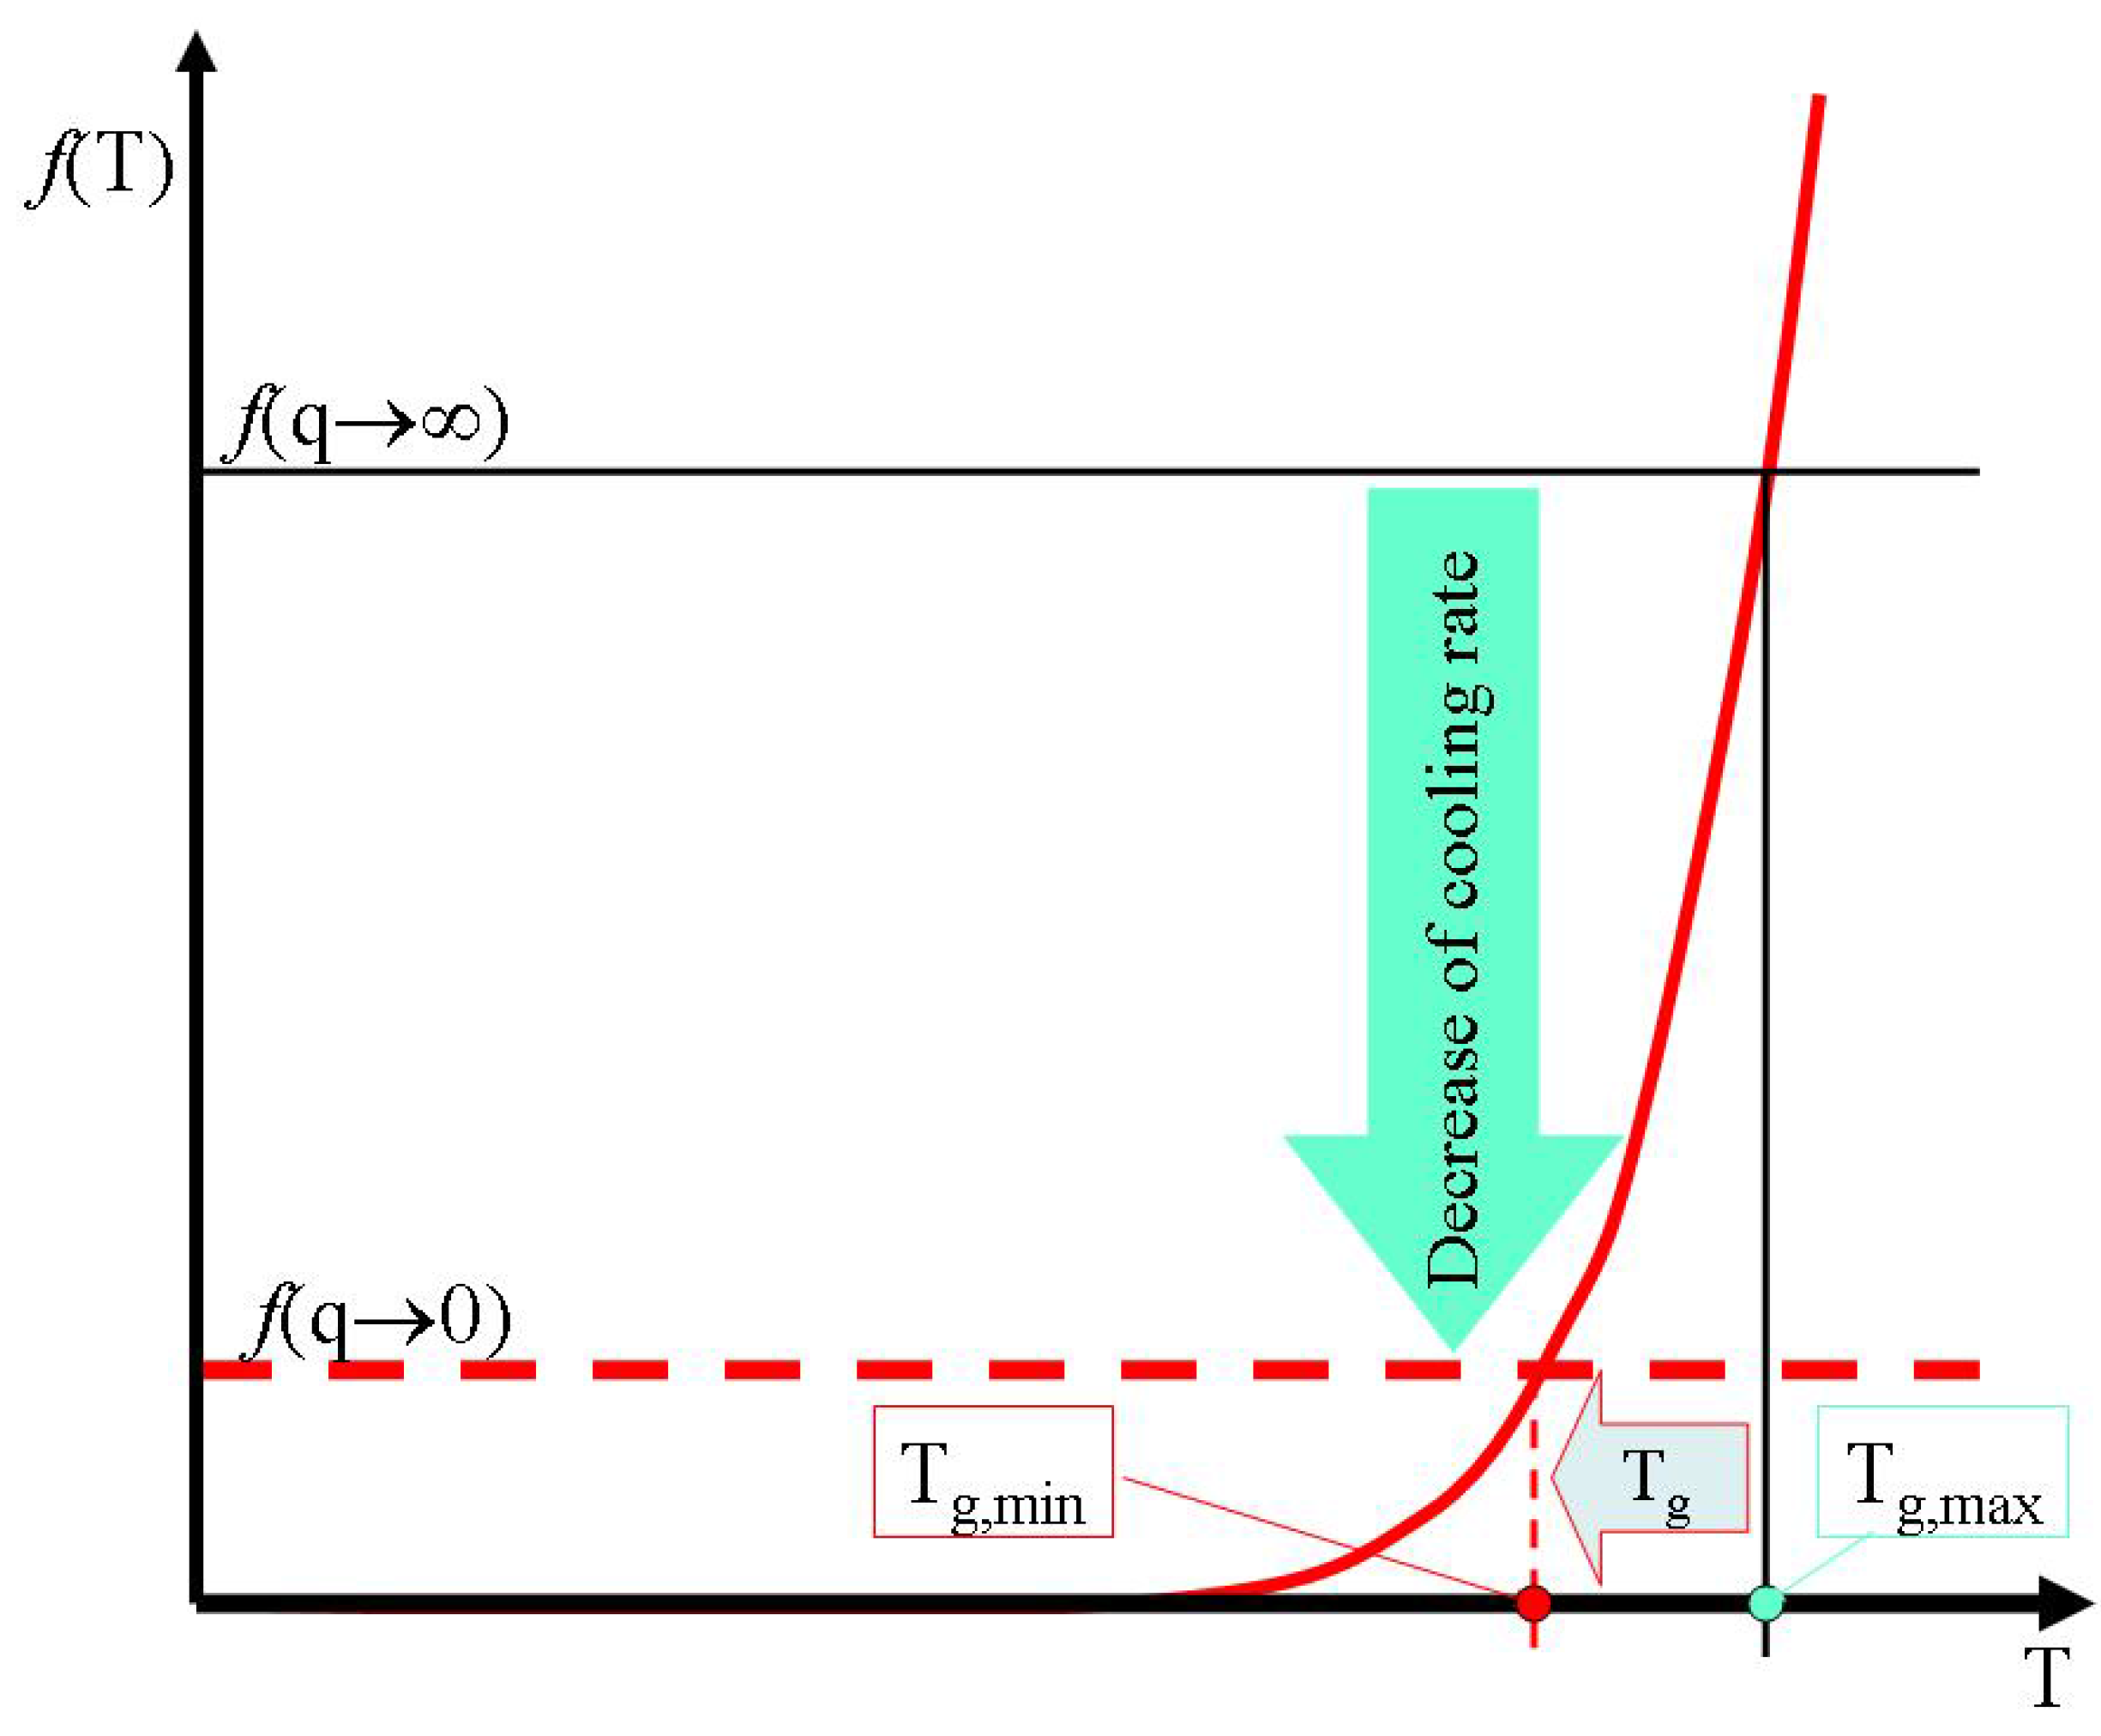
c. Finally at very slow cooling rates equilibrium configurons are formed as a result of stress relaxation processes near the broken bonds. Hence the glass transition temperature asymptotically achieves its lowest possible magnitude on decreasing of melt cooling rate (
Figure 10).
Note that we neglect here crystallisation processes which could affect the effective glass transition temperature [
19].
The second logarithmic term in the equation of glass transition temperature (21) depends on the actual percolation threshold
which is a function of configuron radius or volume (see Eq. (26)). As
the glass transition temperature depends on configuron volume approximately as:
Figure 10.
The effective decrease of configuron percolation threshold with decrease of cooling rate causes a decrease of glass transition temperature.
Figure 10.
The effective decrease of configuron percolation threshold with decrease of cooling rate causes a decrease of glass transition temperature.
where T
gD =H
d/S
d and t is the cooling time t=ΔT/q. The resulting expression (28) can be used to numerically assess the glass transition temperature at arbitrary cooling rates. At q →∞ there is insufficient time for equilibrium configurons to be formed and V
c → V
d, so the maximum T
g is achieved
. In the opposite case at q → 0 equilibrium configurons are formed and V
c(t) → V
c, thus the glass transition temperature asymptotically achieves its minimum
. At finite cooling rates such that
, where q
0 = ΔT/τ
M with typical q
0 of the order of 0.1 -1 K/s for oxide glasses, we have a generic expression for the cooling rate dependence:
Here
, and we assumed that V
c >> V
d. Expression (29) is in excellent agreement with experimental data on glass transition dependence on cooling rate demonstrating the logarithmic dependence of glass transition temperature with cooling rate [
49,
78,
83]. Though approximate our results do agree with Moynihan et. al.’s expression of the reciprocal of the fictive temperature linearity in respect to the logarithm of the cooling rate [
78]
where the activation energy is found from (29)
Accounting that m < 1 we can see for example that amorphous B
2O
3 has an excellent description of glass transition cooling rate dependence at m=2/3 [
78].
Although the glass transition temperature (21) is a thermodynamic parameter it depends on the cooling rate of a supercooled liquid as the formation of glass is a kinetically-controlled process. The glass transition temperatures of amorphous materials achieve their maximum values at infinitely high cooling rates.


