
A Topic-Based Bibliometric Review of Computers in Human Behavior: Contributors, Collaborations, and Research Topics


1
Department of Mathematics and Information Technology, The Education University of Hong Kong, Hong Kong 999077, China
2
Department of English Language Education, The Education University of Hong Kong, Hong Kong 999077, China
3
Department of Computing and Decision Sciences, Lingnan University, Hong Kong 999077, China
*
Author to whom correspondence should be addressed.
Sustainability 2021, 13(9), 4859; https://doi.org/10.3390/su13094859
Submission received: 1 April 2021
/
Revised: 18 April 2021
/
Accepted: 24 April 2021
/
Published: 26 April 2021
(This article belongs to the Special Issue Sustainable Education Technologies in Big Data and Artificial Intelligence Era)
Abstract
:Computers in Human Behavior (CHB) is a well-established source with a wide range of audiences in the field of human interactions with computers and has been one of the most widely acknowledged and leading venues with significant scientific impact for more than 35 years. This review provides an overview of the status, trends, and particularly the thematic structure of the CHB by adopting bibliometrics and structural topic modeling on 5957 studies. Specifically, we analyzed the trend of publications, identified major institutions and countries/regions, detected scientific collaboration patterns, and uncovered important topics. Significant findings were presented. For example, the contribution of the USA and Open University of Netherlands was highlighted. Important research topics such as e-commerce, social interactions and behaviors, public opinion and social media, cyberbullying, online sexual issues, and game and gamification were identified. This review contributes to the CHB community by justifying the interest in human behavior issues concerning computer use and identifying future research lines on this topic.
1. Introduction
In the era of advanced technologies filtering into diverse aspects of social life, understanding how human’s interactions with technologies affect psychological outcomes has been an active area of research [1]. Research into human behaviors has been of increasing interest in the field of human–computer interactions [2,3]. Human behavior recognition assisted by varied applications and methodologies proposed based on computer vision and machine learning [4] has also received growing attention with numerous research achievements and scientific outputs [5].
In literature analysis, Lee et al. [6] suggest that “understanding trends and issues in terms of topics and methods are pivotal in the advancements of research (p. 225).” West [7] also highlights the practical value of understanding the past and present to gain insights into a research field or an academic journal’s future development. In this sense, examining changes in perspectives and voices in such a journal as Computers in Human Behavior (CHB) can be helpful to see “what conversations are being held, research being conducted, tools being developed, and theories being accepted (p. 60) [8].”
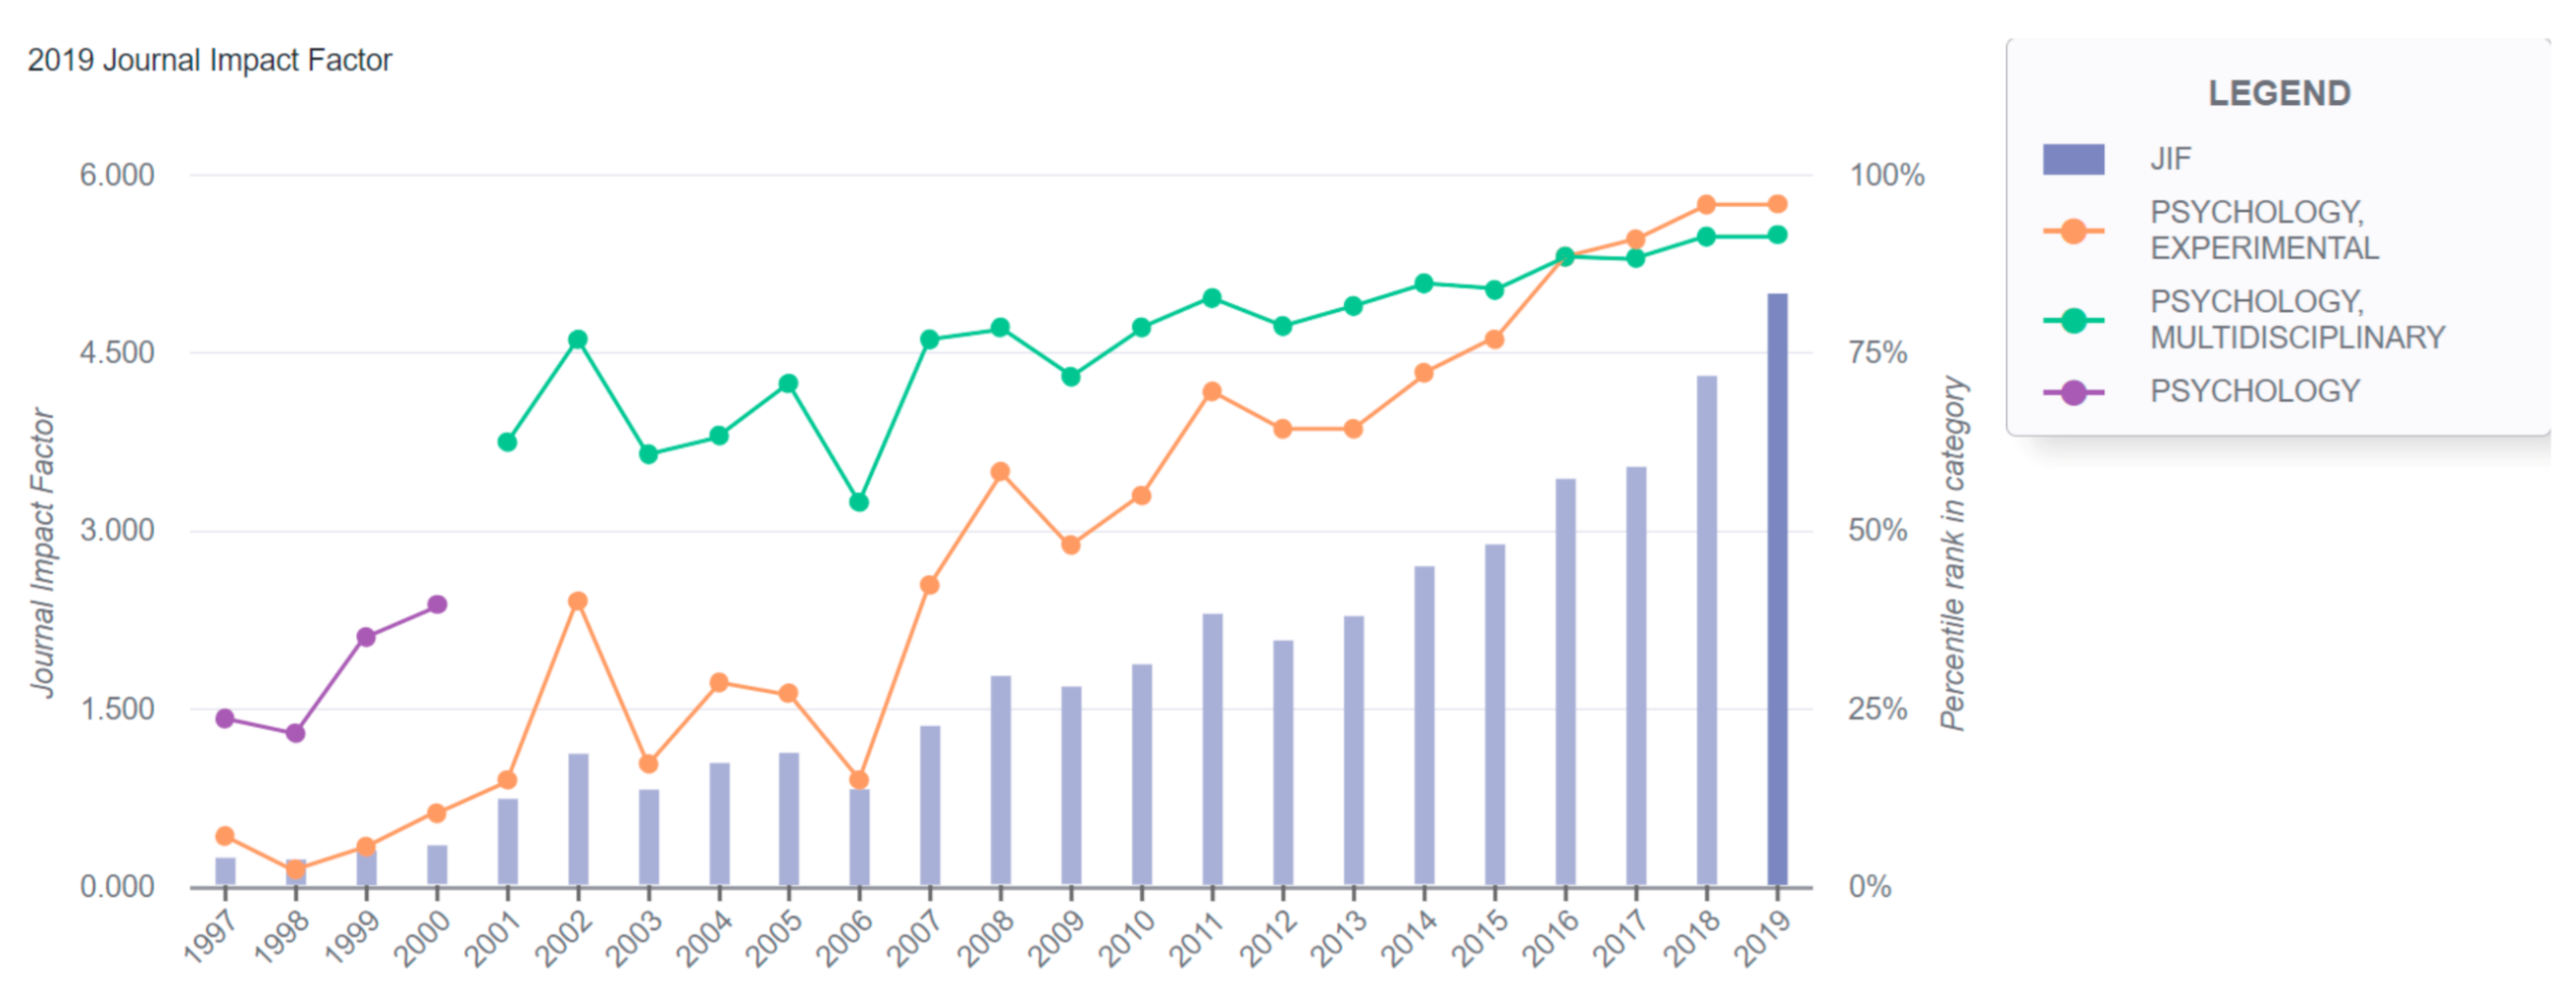
To facilitate the understanding of topics and trends in research on human interactions with computers and how such interactions impact human behaviors, we focus on CHB publications because: first, CHB is the only one specializing in computer use from a psychological perspective among the top four journals in PSYCHOLOGY, EXPERIMENTAL discipline; second, CHB has demonstrated a continuous increase in academic impact and influence (Figure 1). In addition, CHB, with broad research topics ranging from computer use in diverse disciplines like psychology and psychiatry to computer use’s psychological impact on humans, has attracted interest from professionals in varied areas of research. As a well-known and well-recognized international journal, CHB has witnessed the history and development of research on humans’ interactions with computers. A thorough investigation by studying research findings and application practices of CHB can provide insights into what has been concerned and what is being concerned in the research field. This allows a better understanding of the frequently investigated research issues and hotspot-forefront topics concerning the effects of computer use for professional practice and training on how human develop, learn, think, and interact.
Bibliometric analysis is increasingly considered invaluable and effective to evaluate scientific outputs (e.g., [9,10,11,12]) concerning a particular field or journal. Based on 3756 publications published in CHB from 1991 to 2015, Vošner et al. [13] employed bibliometrics and keyword analysis using VOSviewer to analyze publication types, dynamics, and trends, and to recognize impactful publications, top contributors, collaborations, and highly studied topics and their evolutions. Results indicate (1) an overall growth of publications, (2) significant contributions from well-developed countries, (3) six chronological periods of research, including human–computer interaction, attitudes and opinions towards computer use, internet and knowledge sharing, internet-based collaborative learning, computer user’s psychological impacts, and social media platforms. Their study provides useful implications about the dynamics and trends of CHB. However, there are aspects that need to be enhanced. First, in identifying major institutions and countries, they only applied an indicator of article count. Although article count is commonly adopted in bibliometric studies, other useful indicators such as citation count, average citations per article (ACP), and particularly the Hirsch index (H-index), which are widely adopted in examining academic impact, should also be applied to identify influential contributors. Second, in the analysis of research themes, they included publications of all types. However, only research articles should be used as they provided more original findings, while the inclusion of publications of other types such as reviews might negatively impact the results. Third, the analysis of research topics was conducted using co-occurrence analysis of author keywords or terms extracted from titles or abstracts. However, topic models are more flexible and effective in topic identification compared to other alternative methods like document clustering and co-occurrence analysis [14]. As a technique that originated from natural language processing [15], topic models, coupled with bibliometrics, are suitable for uncovering meaningful latent topics within large-scale textual literature data in varied scientific fields (e.g., [16,17,18,19]). Nevertheless, topic models are seldom used to explore topics within the literature in psychological fields. In addition, Vošner et al.’s [13] study focuses on publications published during 1985–2015. However, research on the psychological issues concerning humans and computers’ interactions has become active with the advancement and development of innovative computer technologies. Hence, publications published since the year 2016 should also be included to provide an up-to-date understanding of the thematic structure. Methodologically speaking, the analytical approaches used in this study are similar to some topic-based bibliometric studies (e.g., smart learning [20], personalized language learning [21], and educational technologies [22,23]); however, we focus on literature on human–computer interactions that have not yet been investigated using topic modeling, particularly based on literature production of CHB, which is a strength of this study.
To that end, this review combines topic models with bibliometrics to analyze publications of CHB to explore its status, trends, and thematic structures. The analyses are conducted in the following aspects: first, identify annual publication trends and major contributors using article count, citation count, and the H-index; second, uncover major research topics using structural topic modeling (STM) [24]; third, explore topic evolution using a Mann–Kendall (M-K) statistical test [25]; fourth, explore the correlation between topics using affinity propagation (AP) clustering; fifth, visualize the scientific collaborations using social network analysis (SNA); finally, visualize the topic distributions of major contributors. Specifically, this review answers five research questions:
RQ1: What was the trend of publications of CHB?
RQ2: What were the major topics and how did they evolve and correlate?
RQ3: What were the major countries/regions and institutions?
RQ4: What were the scientific collaborations among major countries/regions and institutions?
RQ5: How did the topics distribute across countries/regions and institutions?
2. Data and Methodologies
A flowchart of data collection, pre-processing, and analyses is depicted in Figure 2, details of which are elaborated in the following subsections.
2.1. Data Collection and Pre-Processing
CHB papers published during 1990–2019 were collected from the Web of Science using the query “Publication Name = Computers in Human Behavior.” As for publications published during 1985–1989, the data were manually collected from the journal website. A total of 6303 publications were obtained, among which 5957 were research articles. Citations of these publications were collected from Google Scholar.
Data pre-processing included seven aspects. First, key elements (e.g., title, abstract, publication year, and author address) of each publication were collected. Second, manual supplementary of elements, particularly author address information, was conducted. Third, institutions and countries/regions were extracted from addresses and were further normalized and pre-processed. Fourth, inconsistent expressions of a single institution were unified. Fifth, terms were extracted from titles, abstracts, and keywords, and were further converted to lower case, with stop words, punctuations, and numbers being removed. Furthermore, we assigned weights 0.4, 0.4, and 0.2 to the extracted terms from keywords, titles, and abstracts, respectively. In addition, unimportant terms were filtered and excluded using term frequency-inverse document frequency.
2.2. Performance Analyses
The performance analyses included trend analysis of annual publication, top country/region and institution identification, and scientific collaboration visualization. Methods included regression analysis, bibliometric indicators, and SNA. First, polynomial regression analysis modeled the trend of the annual publications. Second, bibliometric indicators, including the H-index, article and citation counts, and ACP, were adopted to assess participating countries/regions and institutions’ performance. The H-index [26] is an effective measure of scientific impact [27], and article count, citation count, and ACP are commonly used in bibliometric studies [28]. Additionally, SNA was used to visualize the collaborative patterns of influential countries/regions and institutions. SNA investigates social structures using network and graph theory [29,30]. In the network, institutions and countries/regions are donated by nodes with lines representing scientific collaborations. Node sizes and colors indicate article counts and regional information, with line width being proportional to the number of collaborative articles of the two linked nodes.
2.3. Topic Modeling and Evolution Analysis
To identify major topics covered within the 5957 research articles, we adopted a novel topic modeling approach that was proposed based on Latent Dirichlet Allocation, namely STM.
STM’s basic structure is described as follows [31]: given documents, a document is considered as beginning with empty positions, with each being filled by a term. The position filling process adopts a -dimensional vector of distribution parameters to generate one topic for a single position. With a chosen topic , a term will then be chosen from a corpus-level vocabulary .
More specifically, given a metadata matrix with each row depicting all metadata covariates’ values for document . The topic-prevalence vector for each document is generated using:
in which represents a coefficient matrix connecting covariate values with mean topic-prevalence and is a general variance–covariance matrix.
Given a topic-prevalence vector, topic is connected with the position using
in which ’s element is unity while others are zero given topic .
A specific vocabulary term is chosen using Equation (3), where is the term’s baseline importance across the whole corpus and is the term’s importance given topic . represents the probability of the choice of the vocabulary term to fill each position with term in document given topic using Equation (4).
The metadata matrix and all terms in the corpus (, ) are used for parameter estimation. , , , , and were estimated via posterior likelihood maximization. From a computational point of view, the maximization problem can be solved using iterative approximation-driven variational expectation maximization algorithms [24].
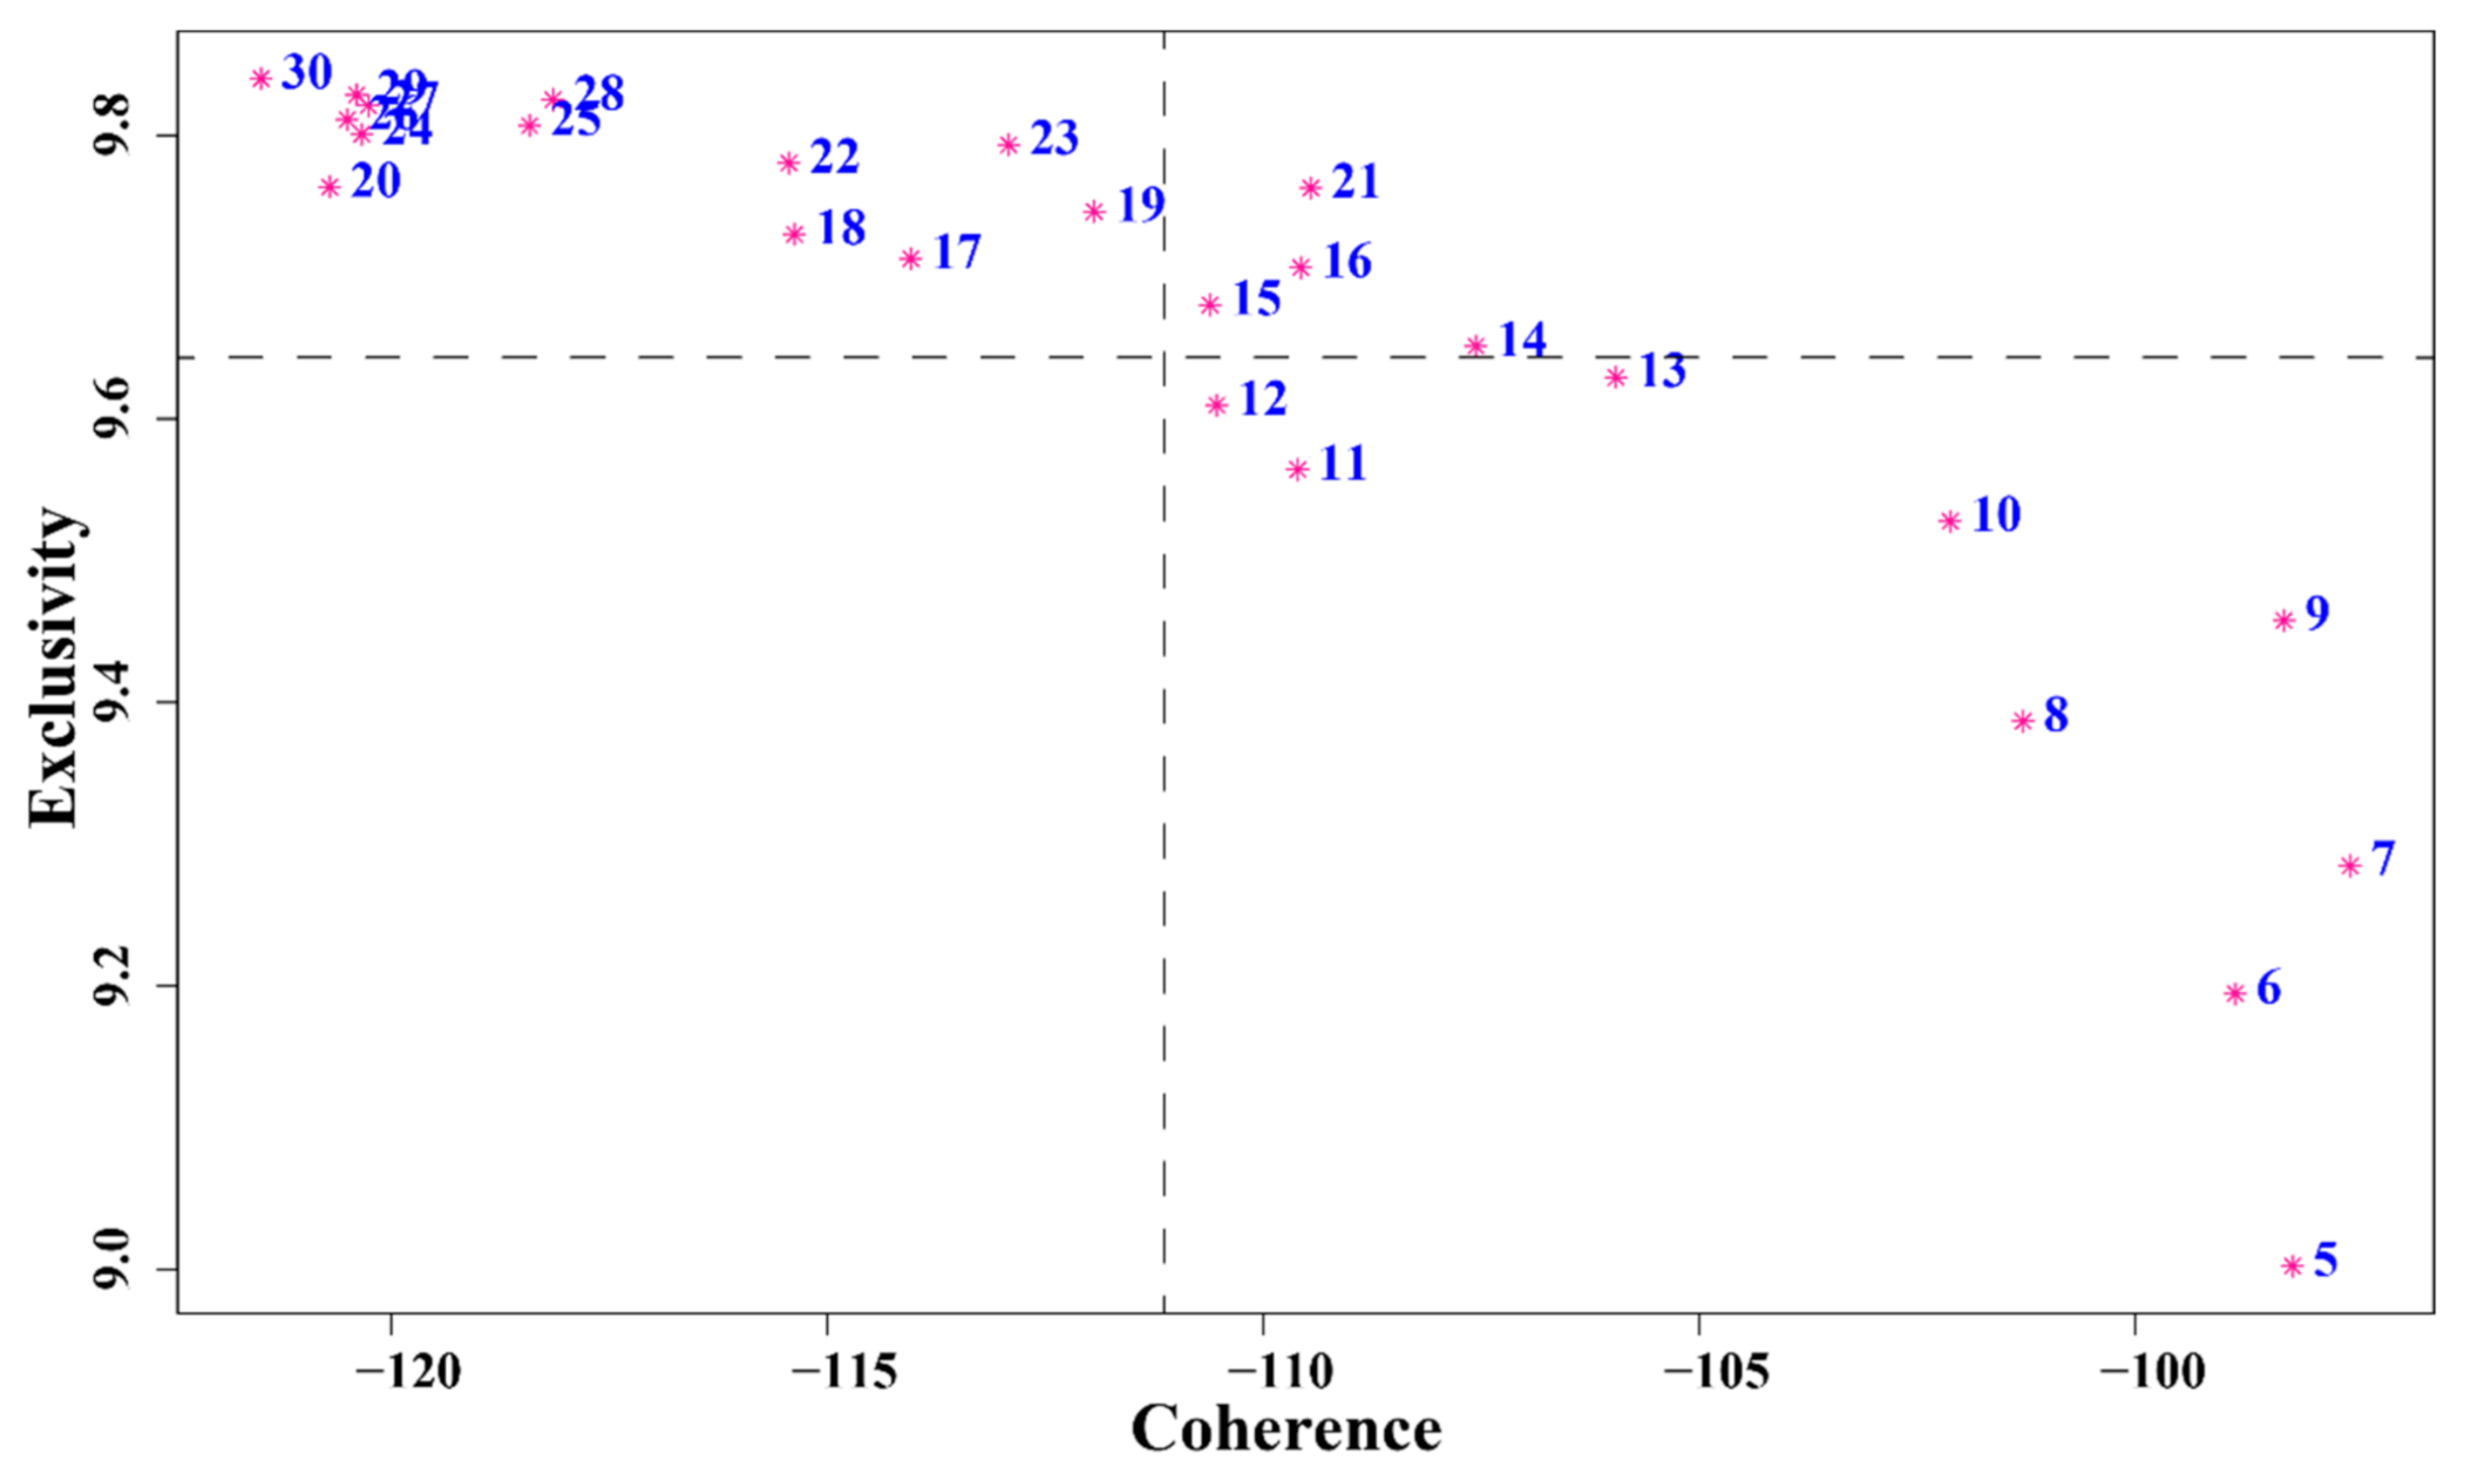
Following previous studies (e.g., [32]), we ran candidate models with varied topic numbers (i.e., 5 to 30). Subsequently, semantic coherence and exclusivity of each model were computed to select an optimal model. According to Figure 3, models with 14, 16, and 21 topics outperformed others, as they had relatively higher values of semantic coherence and exclusivity.
Two domain experts independently conducted comparisons of the three models to select out the best one based on three criteria. First, representative terms and articles of each topic composed a meaningful topic. Second, no overlapped topics were found. Additionally, there were no important topics being excluded. Accordingly, both experts selected the 14-topic model with the greatest semantic consistency within and exclusivity between topics.
Based on the results of STM, we conducted the analyses as follows. Firstly, we assigned labels to each topic following three steps: first, interpret representative terms of each topic based on their semantic meanings; second, examine representative articles of each topic; third, compare and unify labeling results to reach an agreement via discussions. We then investigated whether each topic experienced an increasing or decreasing trend using a non-parametric M-K statistical test. Furthermore, the AP clustering technique was used to investigate the correlation between topics. In addition, we compared topics’ distributions across influential countries/regions and institutions via visualization.
3. Results
Results are displayed in this section, including article trend, topic detection and evolution, major countries/regions and institutions, and scientific collaborations.
3.1. Analysis of the Trend of the Publications (RQ1)
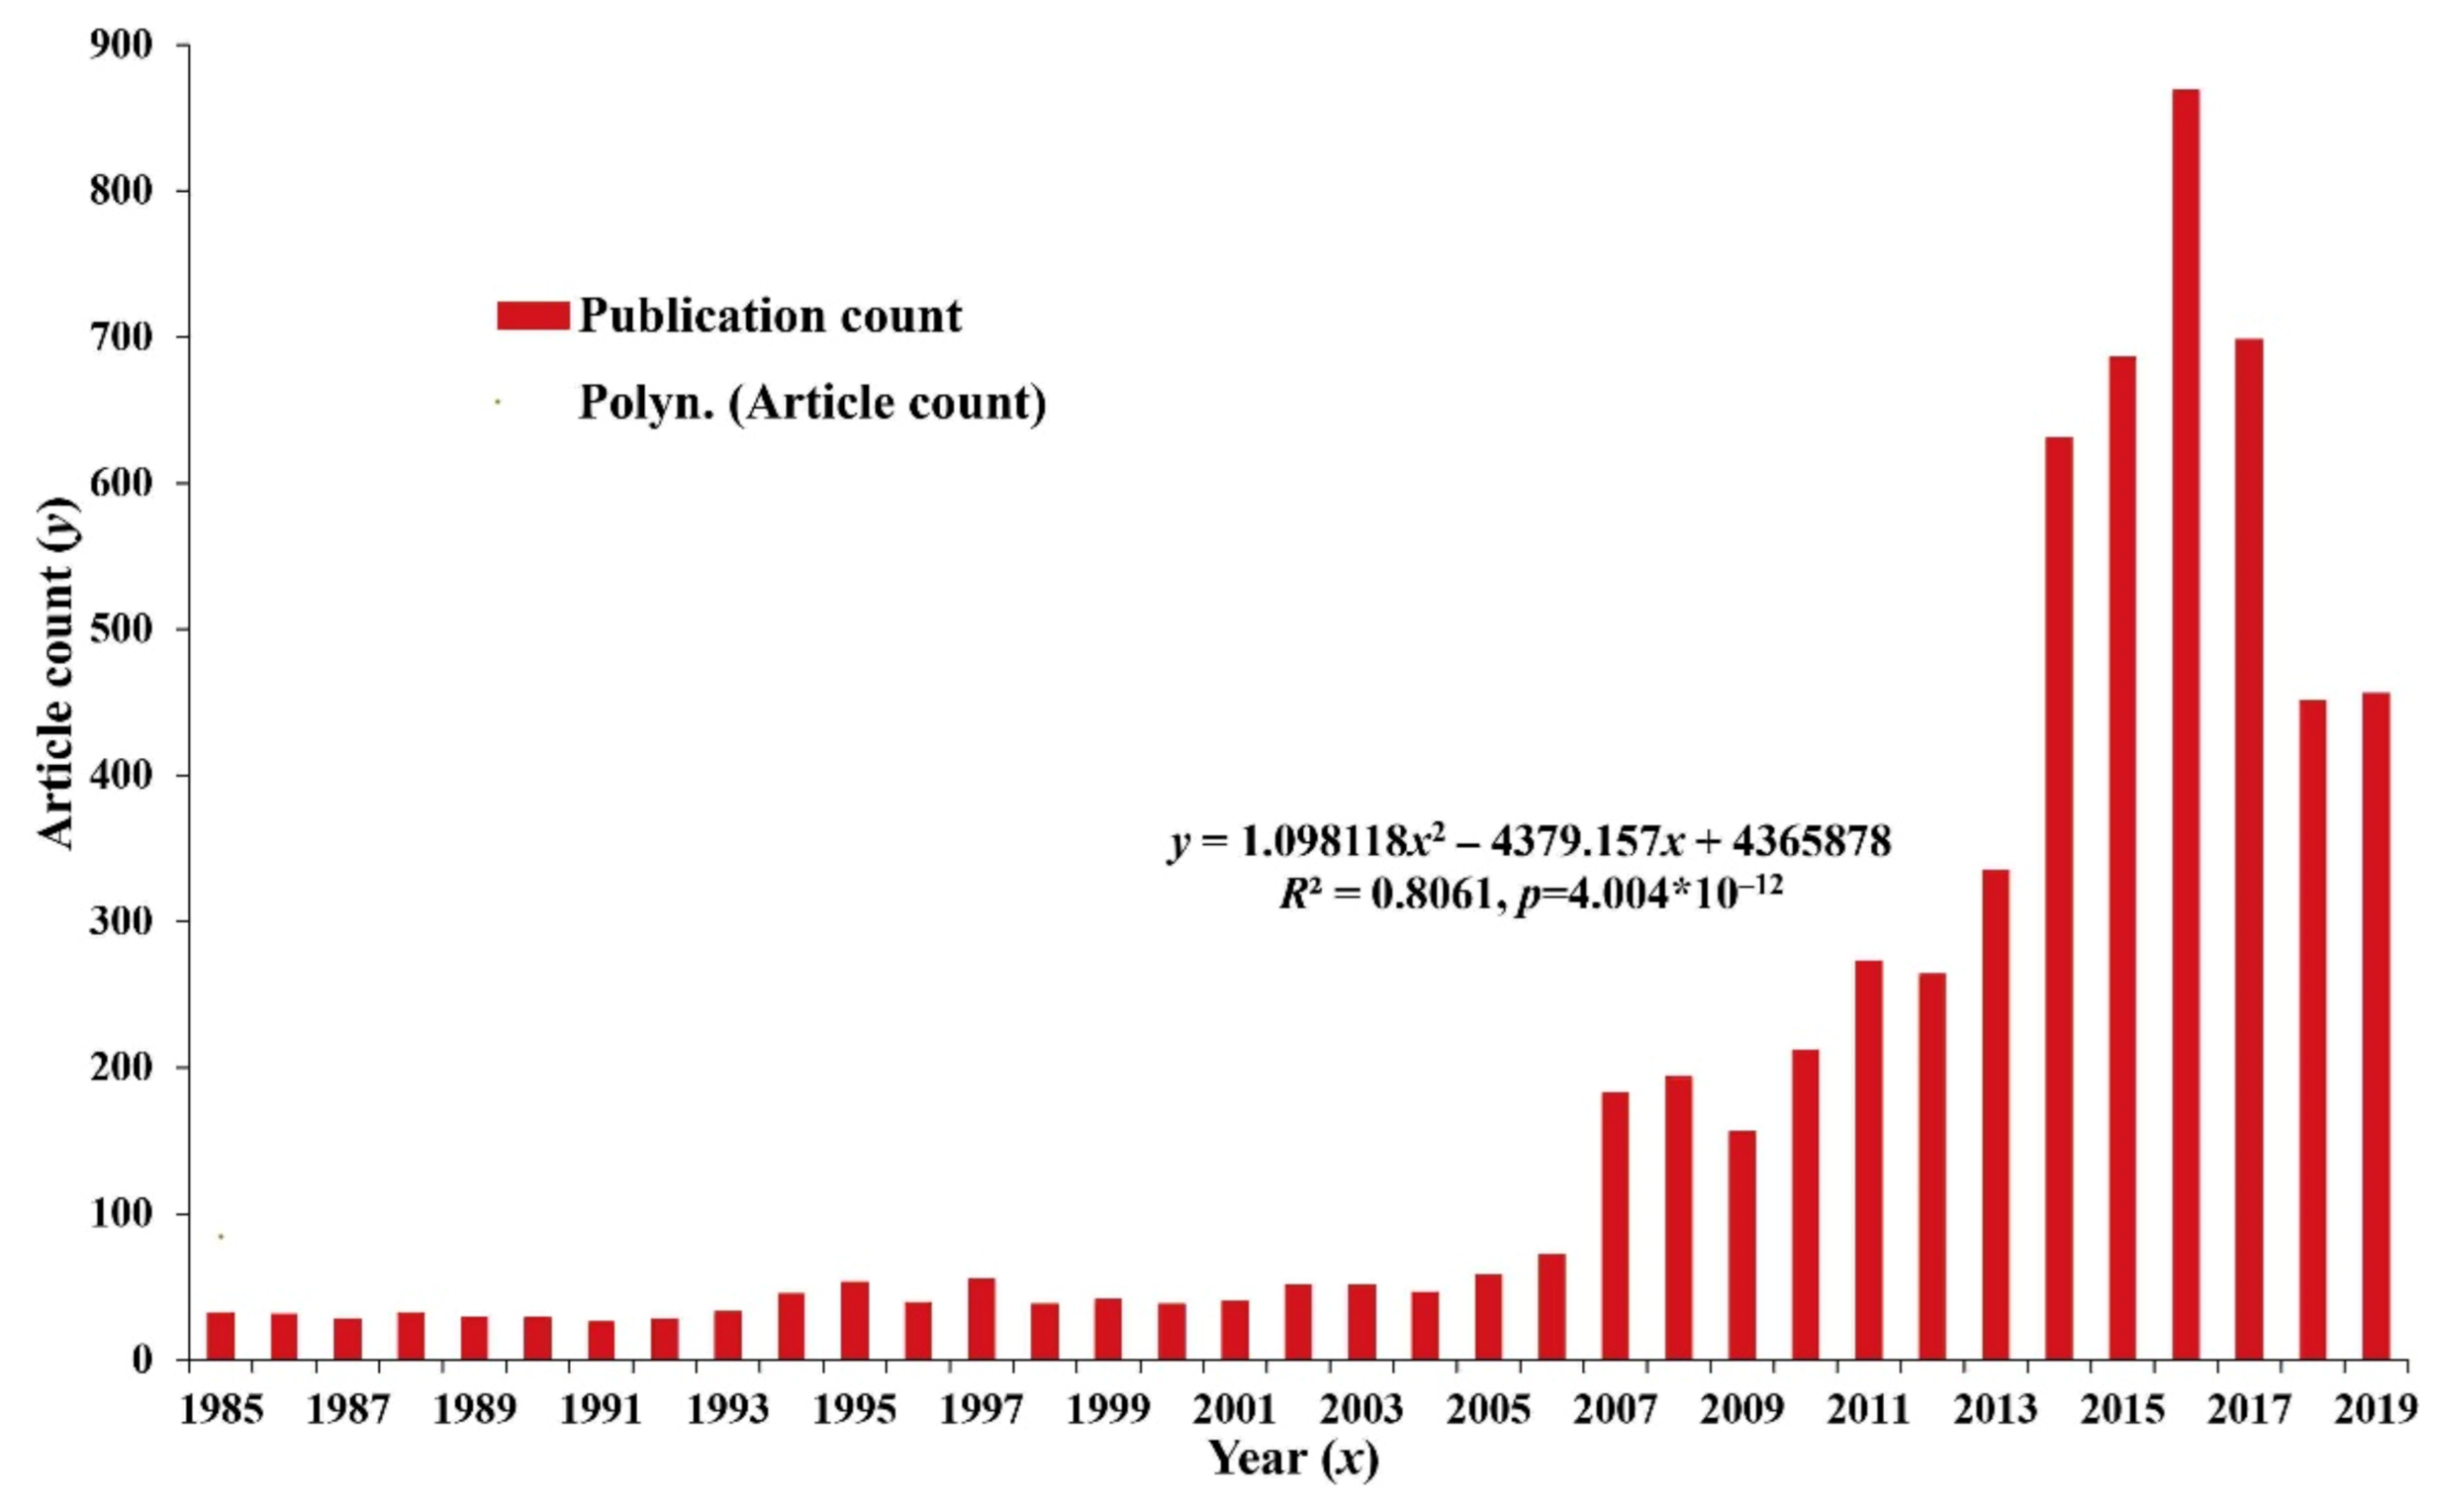
The trend of annual publications is shown in Figure 4. The annual number of publications had generally shown a continuously increasing trend during 1985–2016, rising from 32 to 869. Before 2007, the number was low, i.e., around 60. The number increased threefold from 2007 to 2009 and subsequently increased in fluctuation until 2015, where the number increased fourfold. Since then, the number continued to increase and peaked in 2017. Subsequently, the number had a slight decline. Overall, the number of annual publications had shown an increasing trend and stayed stable in the last two years.
3.2. Topic Identification, Trends, and Correlations (RQ2)
Table 1 displays the frequently used terms in CHB studies, indicating the prevalence of “internet (in 1575 articles),” followed by “learning (1374),” “medium (1283),” “computer (1246),” “system (1098),” “group (1071),” “knowledge (920),” “cognitive (872),”, and “attitude (849).” The STM results (Table 2), with representative terms, topic proportions and labels, and M-K test results. Overall, issues concerning e-commerce (9.14%), social interactions and behaviors (8.85%), public opinion and social media (8.11%), knowledge management for organizations (7.79%), and cyberbullying (7.62%) are widely studied.
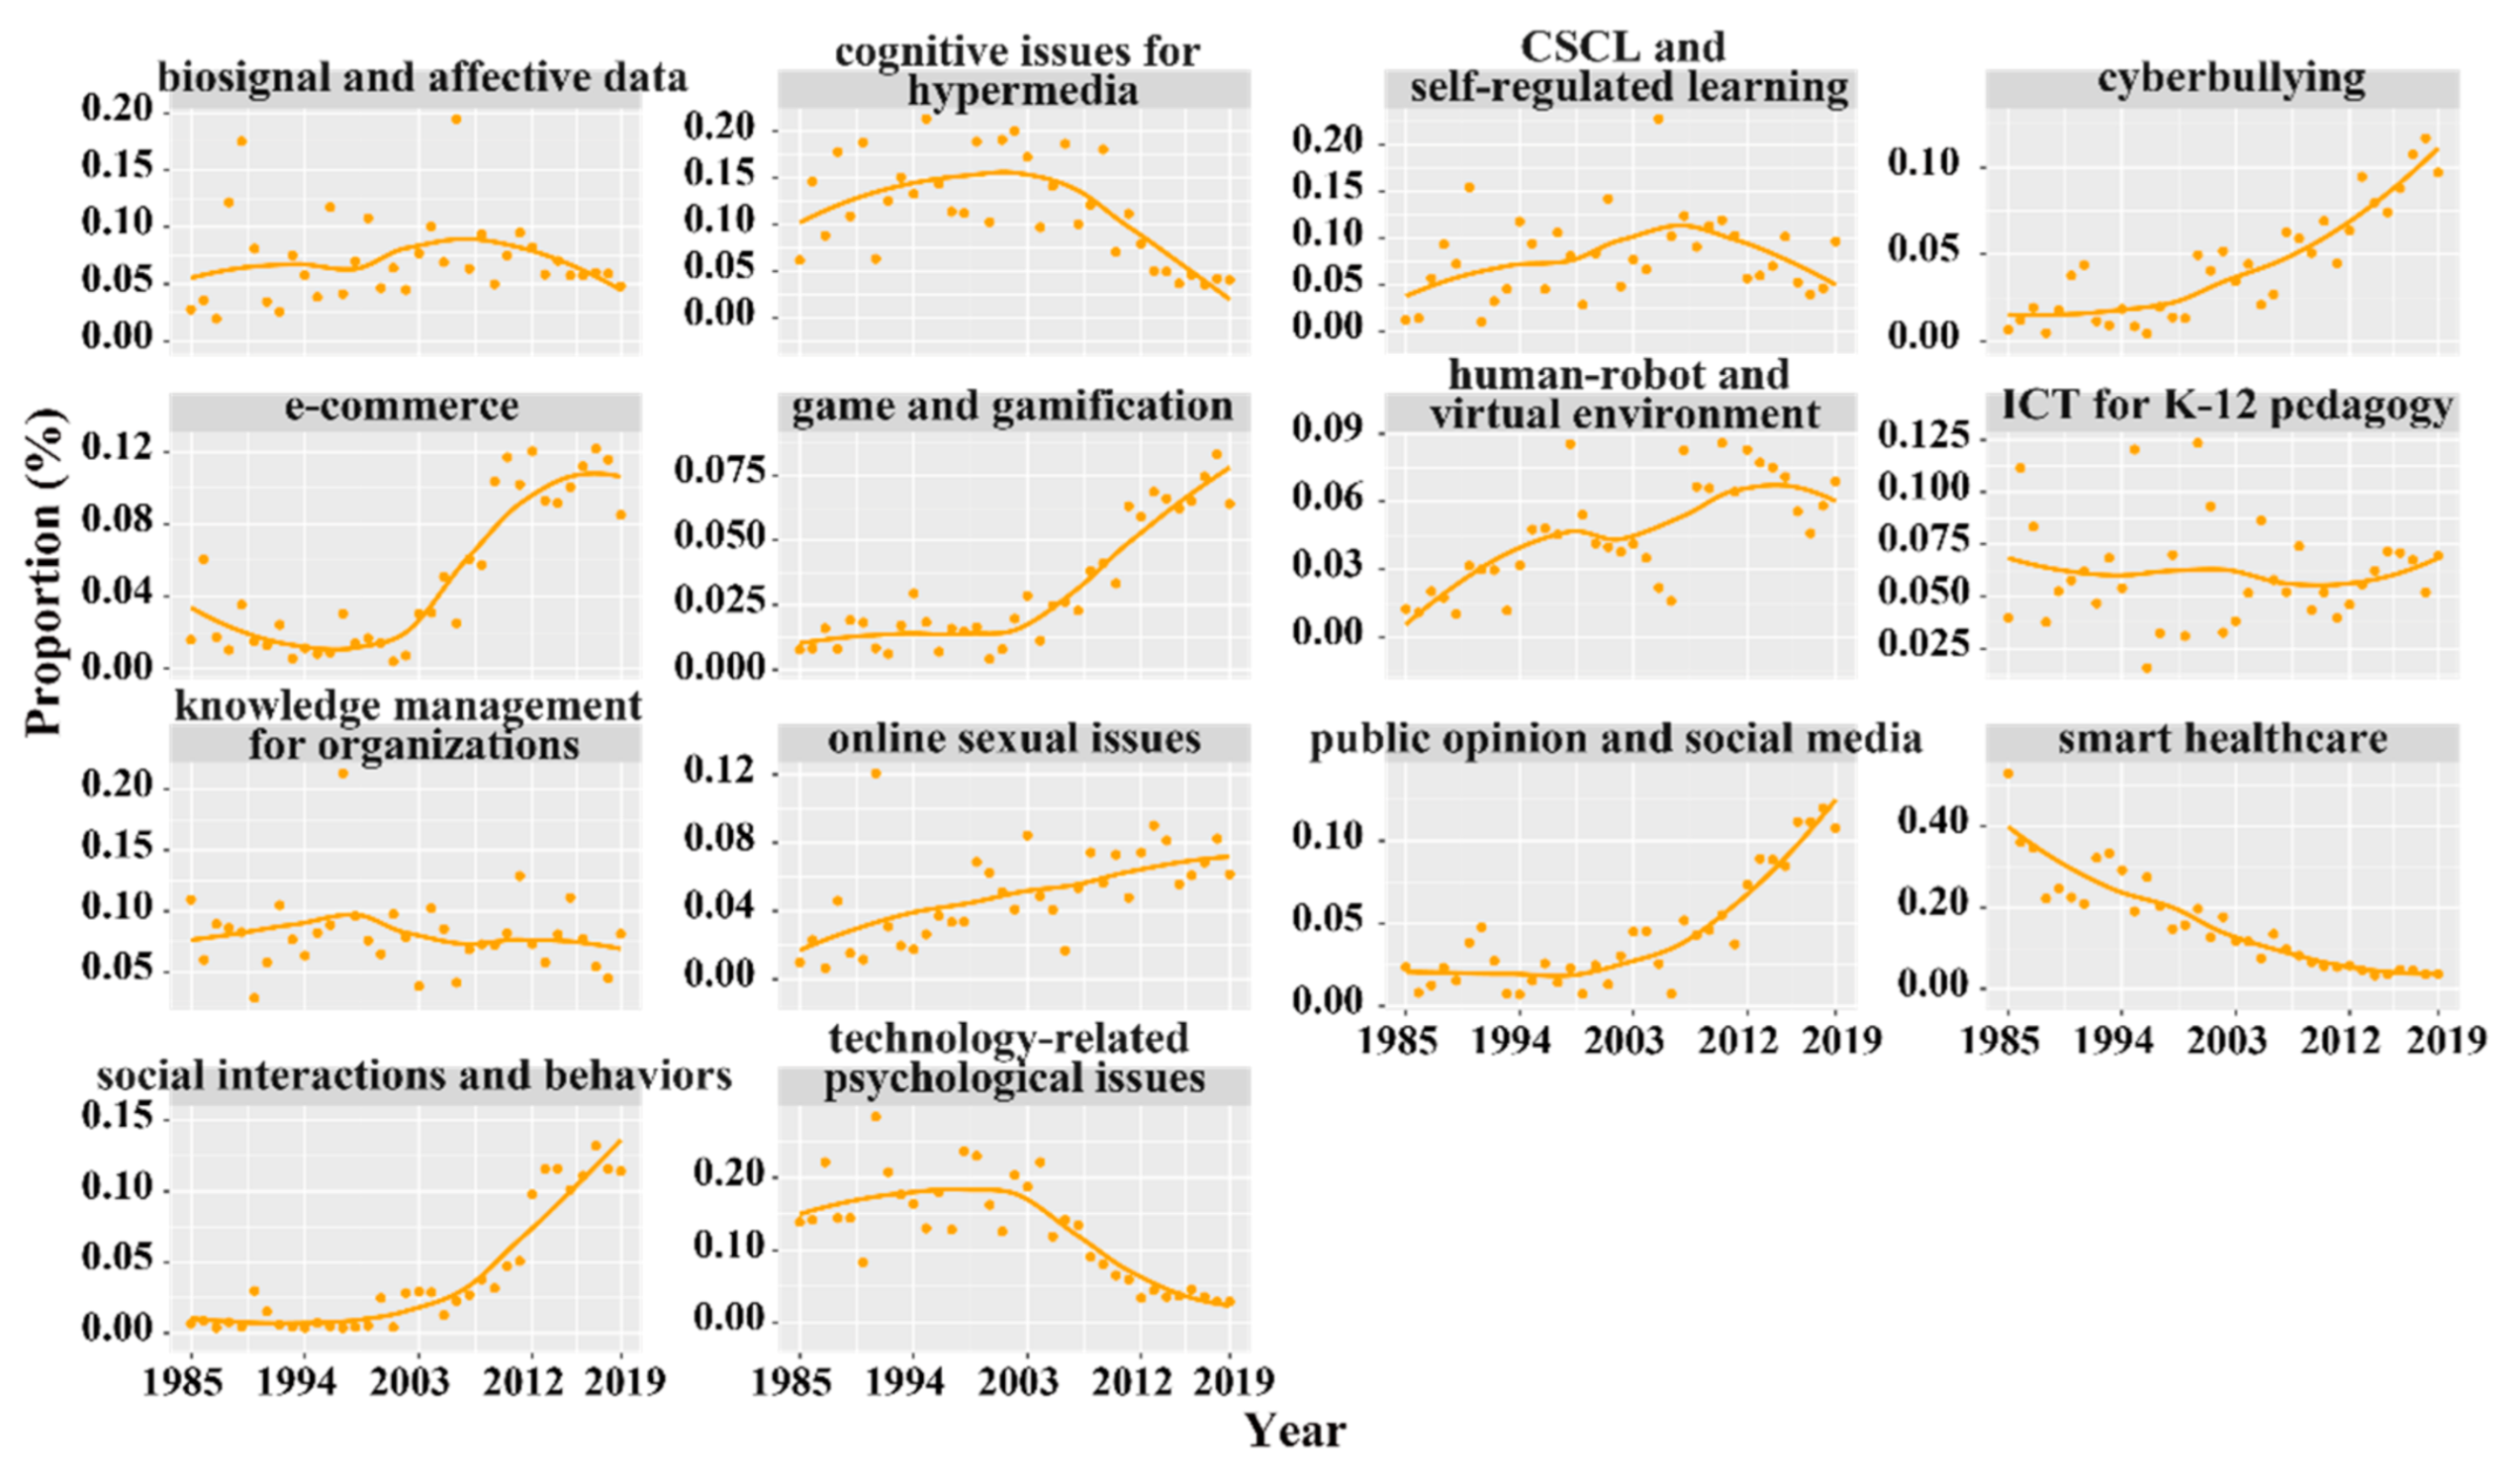
The M-K test results showed that seven topics, including e-commerce, social interactions and behaviors, public opinion and social media, cyberbullying, online sexual issues, human-robot and virtual environment, and game and gamification, demonstrated a significantly increasing trend. On the contrary, three topics, namely, cognitive issues for hypermedia, smart healthcare, and technology-related psychological issues, showed a significantly decreasing trend. The remaining four topics showed no significantly increasing or decreasing trend. Such results are consistent with the annual trend of the proportions of the 14 topics (Figure 5). Figure 6 shows the topic distributions by year, which clearly depicts the dominated issues in each year. For instance, in previous years, smart healthcare, technology-related psychological issues, and cognitive issues for hypermedia were concerned more by authors, while in recent years, authors showed a relatively balanced interest in various issues, particularly social interactions and behaviors, public opinion and social media, e-commerce, and cyberbullying. Such analyses offer a concrete understanding of the evolutions of research interests among authors in the CHB community.
The AP clustering results (Figure 7) show that the 14 topics are categorized into four clusters. The first cluster is formed by game and gamification, technology-related psychological issues, ICT for K-12 pedagogy, and smart healthcare. The second cluster includes computer-supported collaborative learning (CSCL) and self-regulated learning, cognitive issues for hypermedia, and biosignal and affective data. The third cluster is formed by social interactions and behaviors, online sexual issues, public opinion and social media, and cyberbullying. The final cluster includes knowledge management for organizations, e-commerce, and human-robot and virtual environment.
3.3. Prolific Countries/Regions and Institutions (RQ3)
There are 90 countries/regions participating in the research. The top 20 countries/regions ranked by the H-index are listed in Table 3. The USA, the UK, and Taiwan were among the top three in terms of H-index, citation count, and article count, indicating their great contributions to and impact on the community. In particular, the USA outperformed others with an H-index value of 195, 186,721 citations, and 2392 articles. From the perspective of ACP, among the listed countries/regions, Canada was ranked first (98.80), followed by Hong Kong (94.12) and Taiwan (88.89), reflecting the high quality of their research. In Vošner et al. [13], they highlight the contributions of the USA, Taiwan, and the Netherlands during 1985–2015. For the period 2016–2019, in addition to the USA and the UK, we also highlight the contribution of China.
A total of 2691 institutions contributed to the 5957 articles, among which the top 20 institutions ranked by the H-index are listed in Table 4. Open University of Netherlands and Michigan State University were among the top three in terms of H-index, citation count, and article count, indicating their great contributions to and impact on the community. Sungkyunkwan University’s performance in terms of H-index, University of Texas at Austin in citation count, and Pennsylvania State University in article count were worth noting. From the perspective of ACP, among the listed institutions, the top three were National Taiwan University of Science and Technology, Open University of Netherlands, and University of Texas at Austin, reflecting the high impact of their research. In Vošner et al. [13], they highlight the contributions of State University System of Florida, Open University Netherlands, and University of North Carolina during 1985–2015. Between 2016 and 2019, we highlight the contributions of Michigan State University, Pennsylvania State University, and National Taiwan Normal University.
3.4. Scientific Collaborations (RQ4)
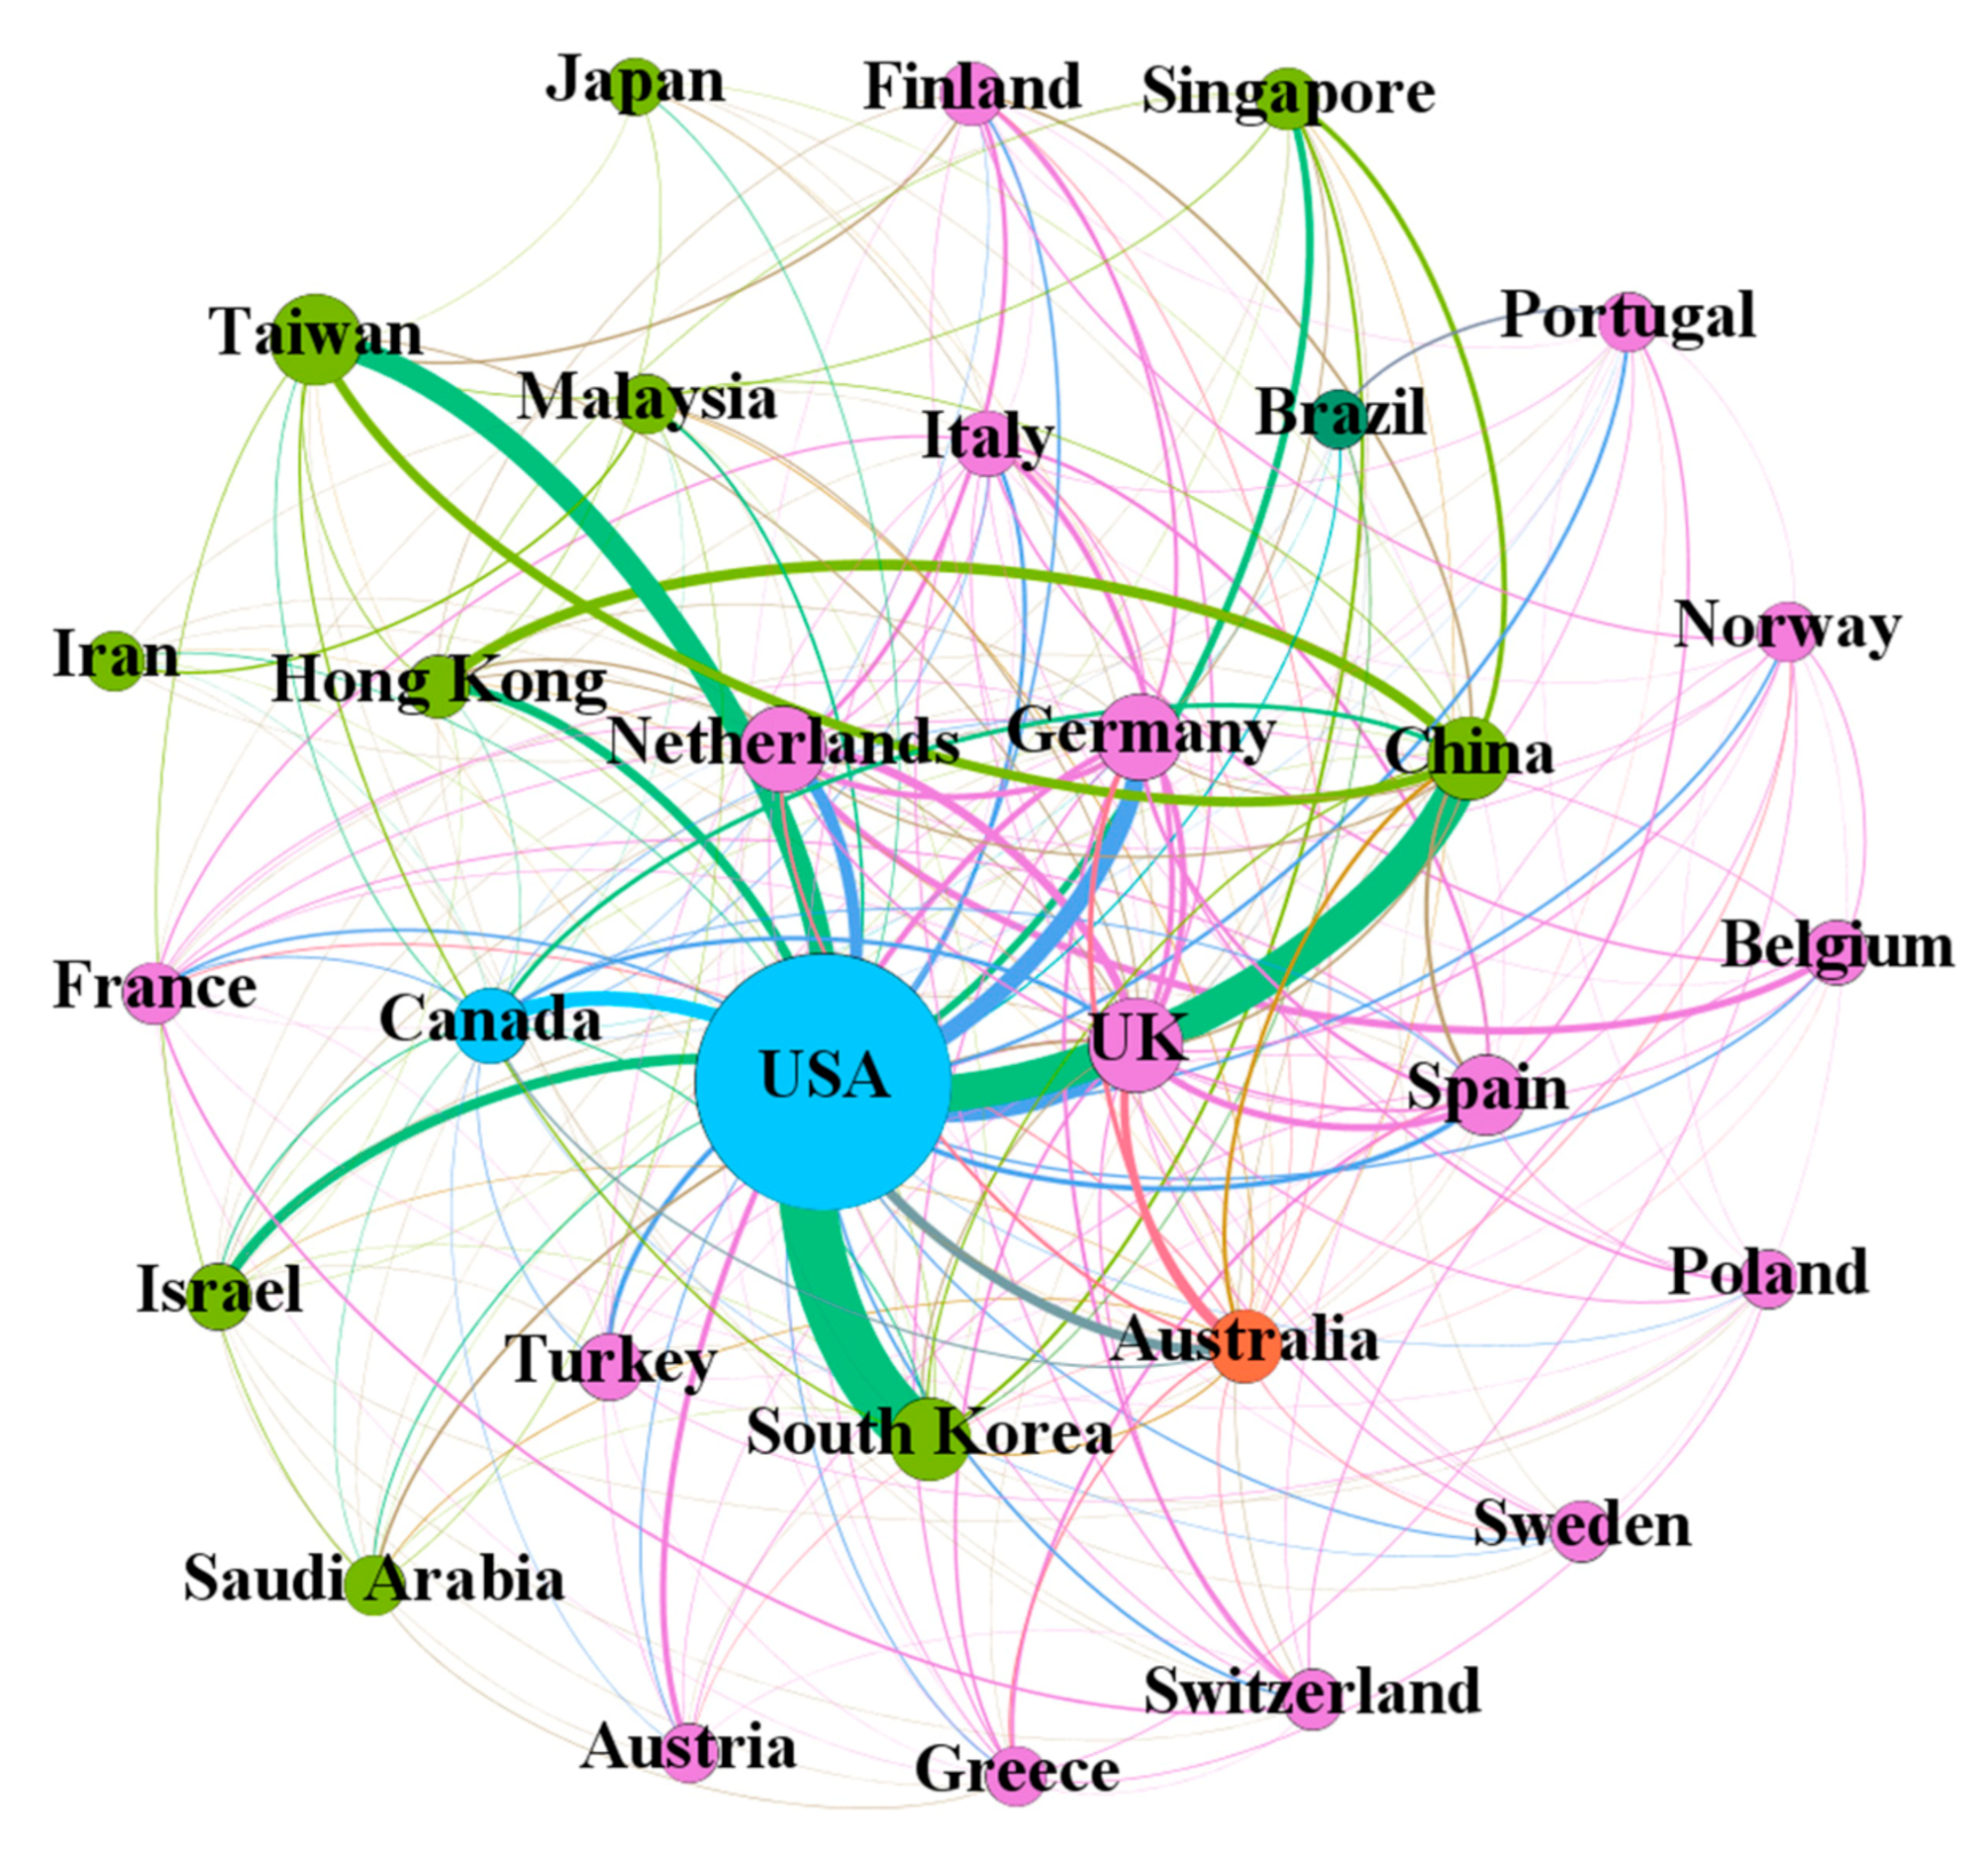
The collaborations among countries/regions are presented (Figure 8). Among the 30 countries/regions, 16, 10, 2, 1, and 1 were from Europe, Asia, North America, Oceania, and South America, respectively. The USA, the UK, Australia, Germany, and the Netherlands each have 29, 29, 26, 24, and 23 collaborators. The USA has collaborated with South Korea, China, and Taiwan in 135, 87, and 58 articles.
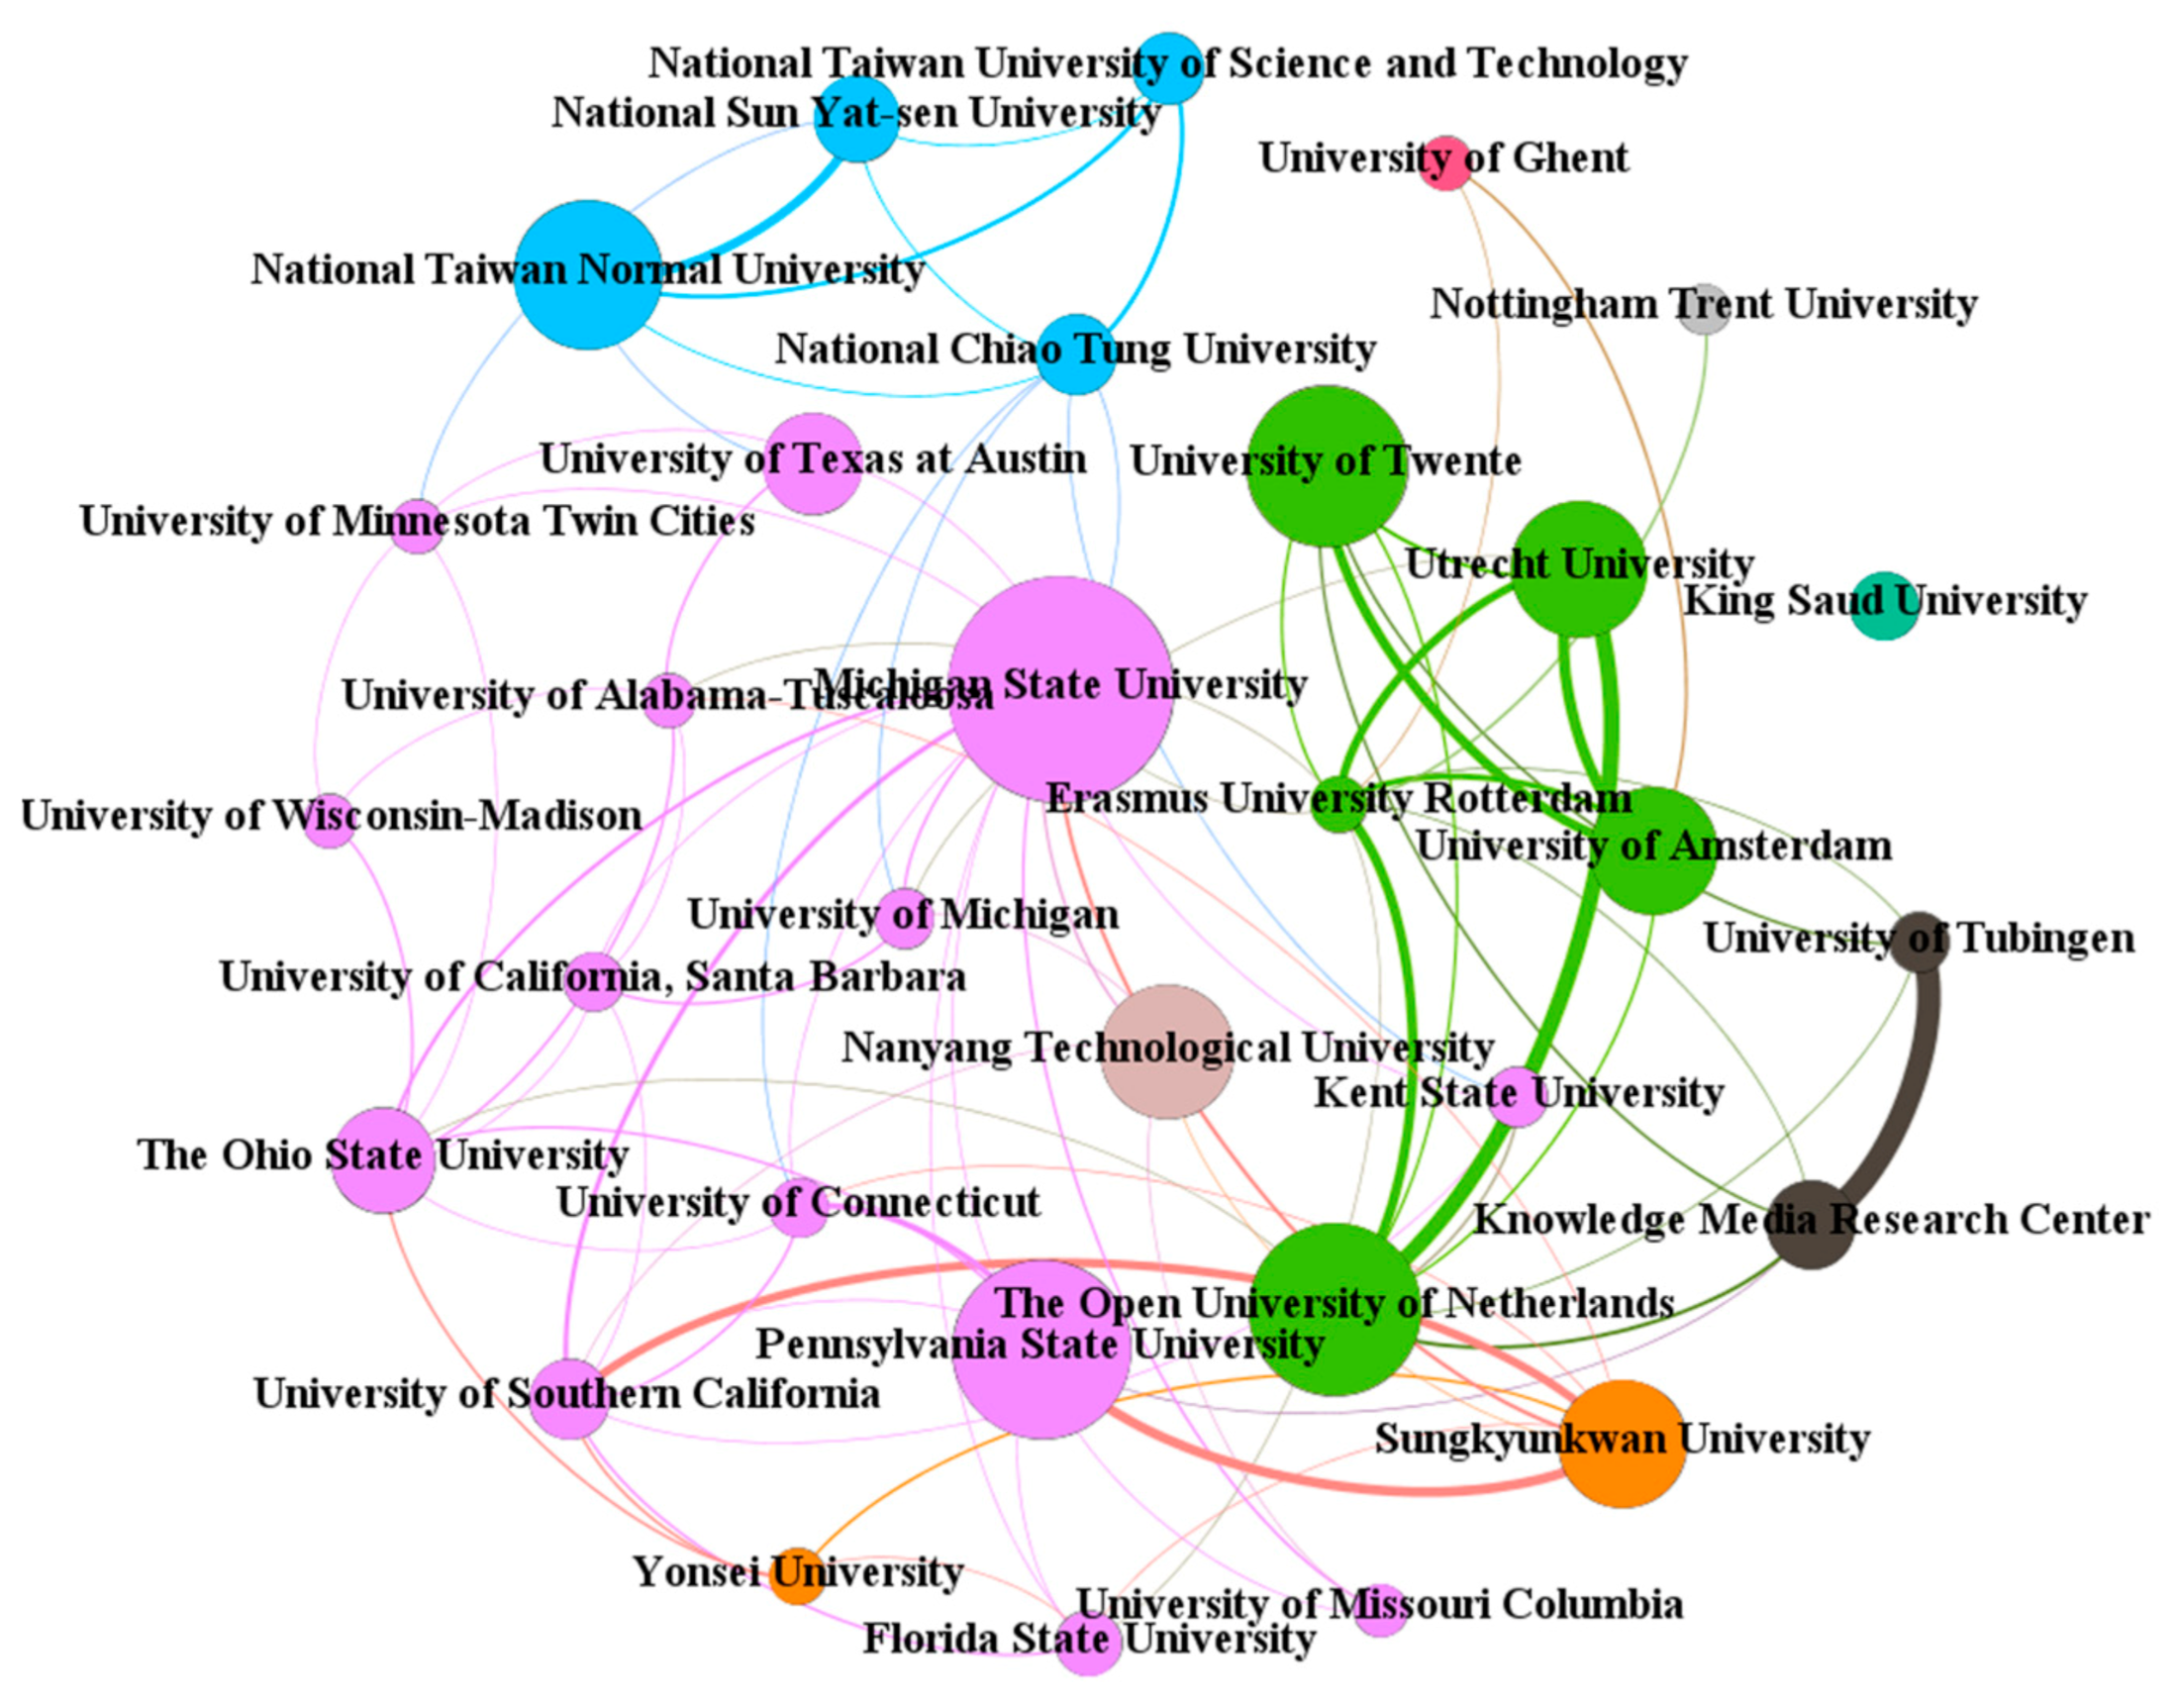
The collaborations among institutions are visualized (Figure 9), among which 14 were from the USA, 5 from the Netherlands, and 4 from Taiwan. Michigan State University, Erasmus University, Ohio State University, and University of Southern California each have 15, 11, 9, and 9 collaborators. University of Tubingen and Knowledge Media Research Center collaborated in 19 articles, followed by Utrecht University and The Open University of Netherlands (13).
3.5. Topic Distributions across Countries/Regions and Institutions (RQ5)
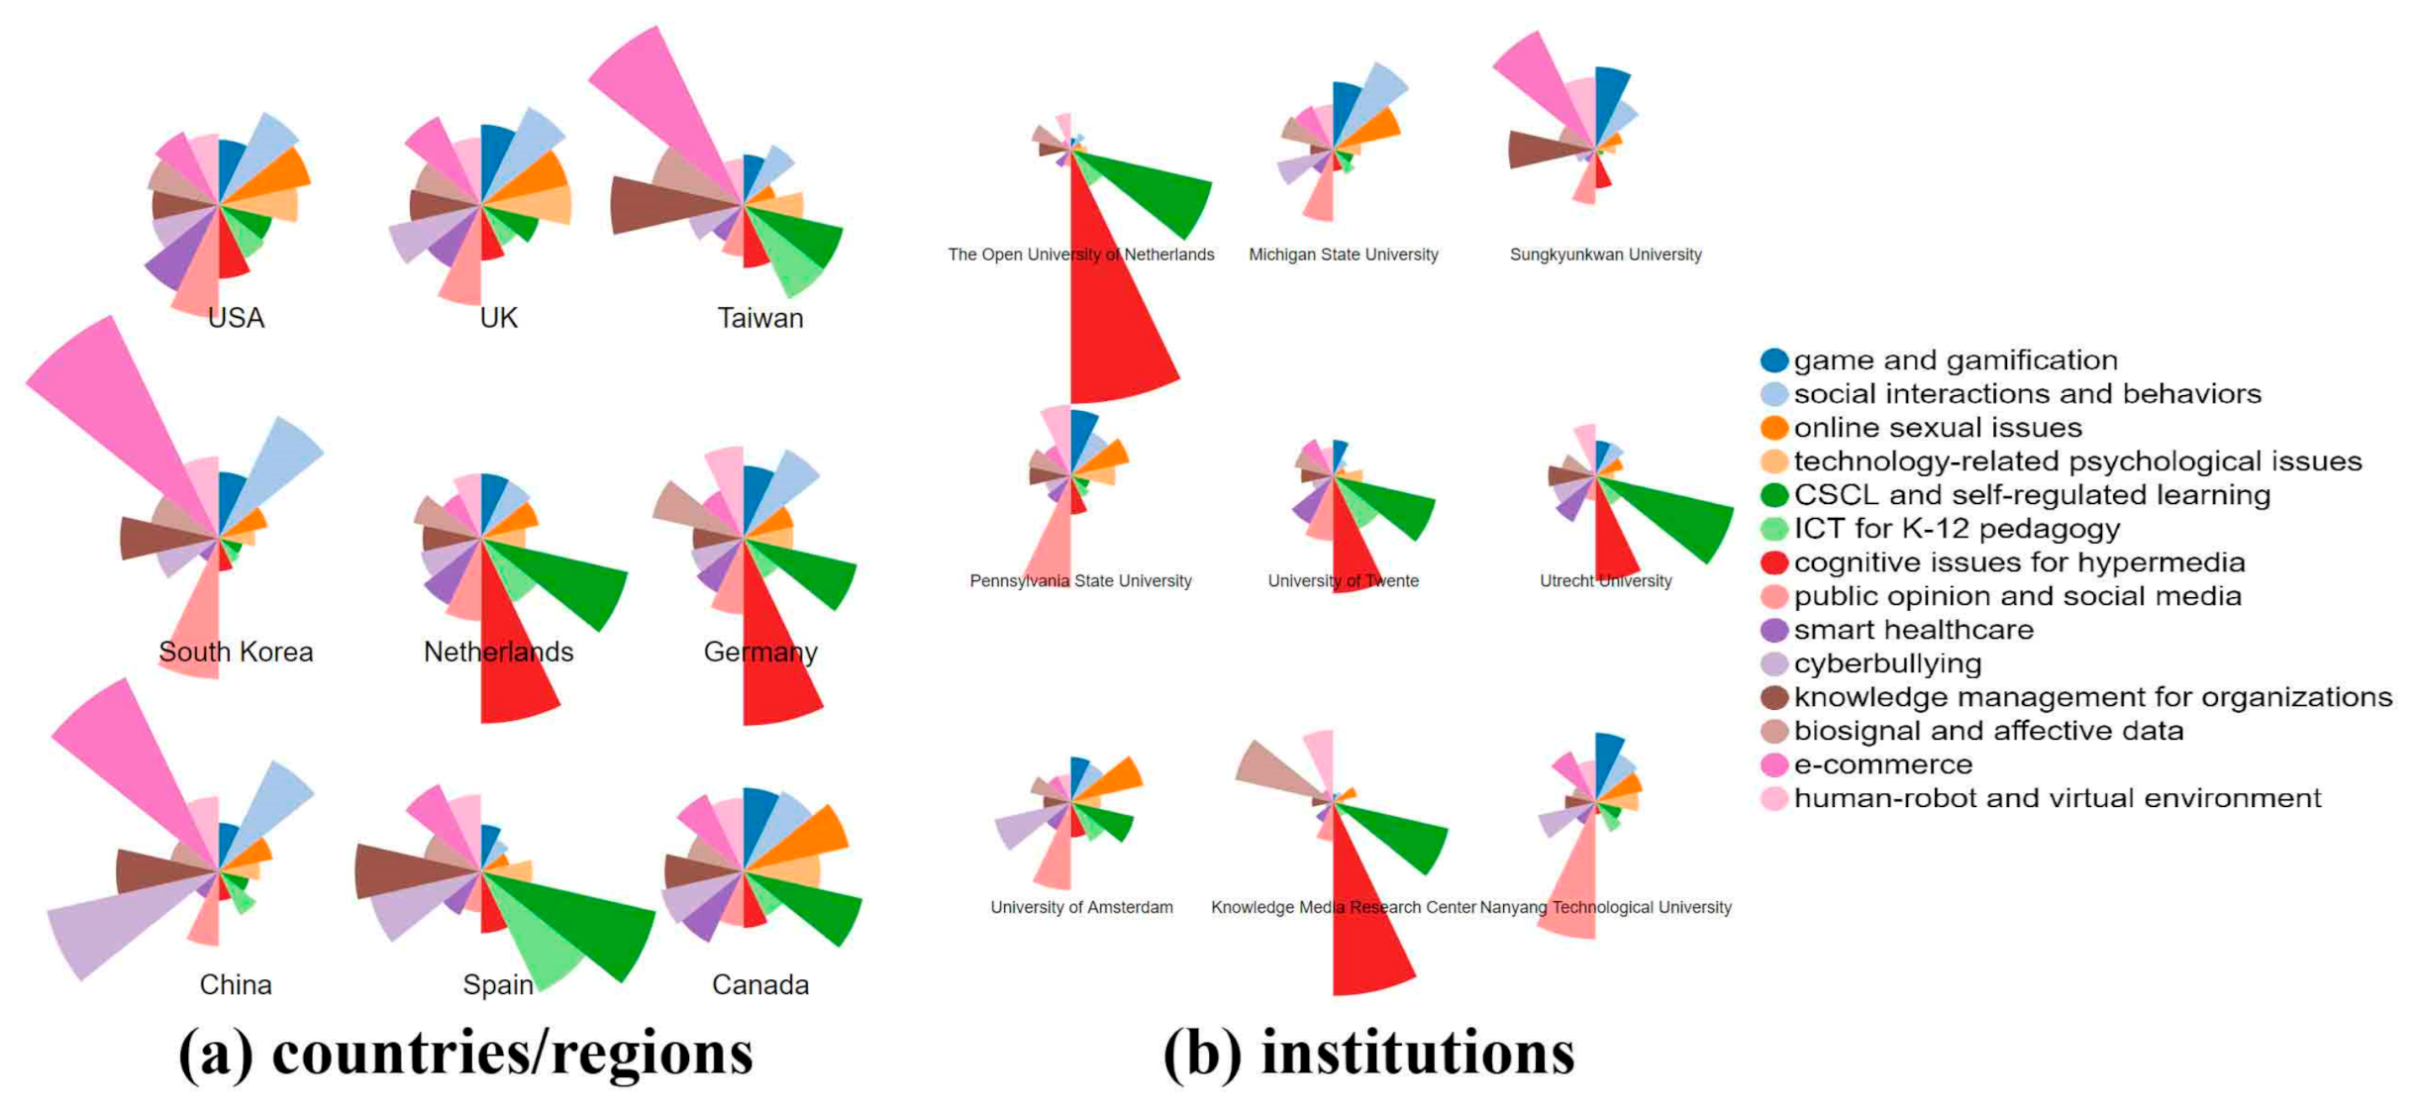
Figure 10 shows how the topics distribute across top countries/regions and institutions measured by the H-index. Countries/regions like the USA, the UK, and Canada showed relatively balanced interest in every topic. However, most countries/regions were interested in one or several research topics. There were three countries/regions particularly interested in e-commerce, including Taiwan, South Korea, and China. Furthermore, the Netherlands and Germany were especially enthusiastic about cognitive issues for hypermedia. In addition, the research enthusiasm for CSCL and self-regulated learning on the part of Spain and Canada and cyberbullying on the part of China was worth noting.
From an institutional perspective, compared to countries/regions, institutions depicted in Figure 10b showed unique research interests. Several institutions are especially interested in cognitive issues for hypermedia, particularly Open University of Netherlands and Knowledge Media Research Center. Pennsylvania State University and Nanyang Technological University were interested in public opinion and social media. Sungkyunkwan University’s interest in e-commerce and Utrecht University’s enthusiasm for CSCL and self-regulated learning were noteworthy.
4. Discussion
Bibliometric analysis is widely recognized as an effective tool to map scientific literature in a specific research field and journal [33,34]. This review comprehensively reviews 5957 articles published in CHB during 1985–2019 using STM and bibliometric analysis. In addition to the analyses of article trends, major countries/regions and institutions, and scientific collaborations, this study particularly focuses on the exploration of the intellectual structure and research topic evolutions. Important implications concerning the development of research and its future directions are obtained, among which the important ones are elaborated below.
4.1. In Comparison with Vošner et al.
In comparison to Vošner et al. [13] that presents a bibliometric analysis of publications of CHB during 1985–2015, our study analyzes research issues covered within the CHB articles published during 1985–2019 in more detail. Comparisons of the results are presented (Table A1 in the Appendix A).
First of all, in terms of topic analysis, Vošner et al. detected research topics using VOSviewer primarily based on word co-occurrences, while we implemented an advanced topic modeling that is particularly effective in research topic detection within the large-scale textual dataset. The use of topic modeling allows us to obtain more in-depth insights and implications, particularly about state-of-the-art research and potential future efforts. Secondly, Vošner et al. chronologically explored term evolutions based on the averaged date of publications, whereas we first detected the major topics as a whole, then investigated their evolutions via a statistical test. Compared to Vošner et al. identifying six major topics from 1985 to 2015, we identified a total of 14 topics during 1985–2019. In addition to similar topics (i.e., social media platforms, attitudes and opinions about computer use, knowledge management for organizations, Internet-based collaborative learning, the psychological impact of computer use, and human-computer interaction), we additionally detected e-commerce, cyberbullying, cognitive issues for hypermedia, smart healthcare, biosignal and affective data, online sexual issues, ICT for K-12 pedagogy, and game and gamification. Our trend test further highlighted seven topics receiving increasing attention, including e-commerce, social interactions and behaviors, public opinion and social media, cyberbullying, online sexual issues, human-robot and virtual environments, and games and gamification. We also identified potential inter-topical research directions by investigating topic correlations via topic clustering, highlighting research clusters, including (1) game and gamification, technology-related psychological issues, ICT for K-12 pedagogy, and smart healthcare; CSCL and self-regulated learning, cognitive issues for hypermedia, and biosignal and affective data; (2) social interactions and behaviors, online sexual issues, public opinion and social media, and cyberbullying; and (3) knowledge management for organizations, e-commerce, and human-robot and virtual environment. This is another improvement over Vošner et al.’s review. Nevertheless, both Vošner et al. and our study provide important insights into research foci of CHB literature. However, comparatively, our study is able to provide more detailed and granular information based on rigorous statistical methodologies.
Furthermore, Vošner et al. identified top countries/regions and institutions in terms of article count, whereas we focused on identifying impactful countries/regions and institutions according to the H-index; though using different indexes, there are similar results. Specifically, both studies highlight the performance of the USA, Taiwan, the Netherlands, and the UK, as well as the Open University of Netherlands and University of Twente. These countries/regions and institutions had thus contributed a lot to the CHB community.
In addition, in the exploration and visualization of scientific collaborations, our analyses provide richer information since we incorporate more features into the network. For example, by combining the information about countries/regions of institutions and continents of countries/regions, we concluded that countries/regions and institutions locating in the same regions tended to collaborate more. However, such a conclusion could not be drawn in Vošner et al.’s review.
4.2. E-Commerce
Researchers are advised to continue to pay attention to issues concerning e-commerce. The advent of web 2.0 and social media has revolutionized consumers’ purchase behaviors and businesses’ marketing strategies. E-commerce, as an established business model for marketing and selling with integrated online services to detect, obtain, and maintain customers, has attracted increasing numbers of shoppers and is widely adopted by businesses of all sizes. Its potential to optimize and enhance relations and communications between organizations, producers, distributors, and consumers [35] has gained increasing attention from businesses, industries, and academia. To allow a combined experience of merchandising in physical retail stores and product purchasing and paying online, online-to-offline (O2O) emerges to bridge physical businesses and e-commerce sprouts [36,37]. The advances of mobile devices and applications make O2O more widely spreading and expanding, arising e-commerce scholars’ growing attention to and interest in mobile commerce, with positive effects on user satisfaction being reported [38]. Regardless of mobiles’ increased prevalence in commerce, users usually find it annoying to receive constant push notifications, leading to their abandonment of the mobile commerce applications. Furthermore, considering the common limitation of e-commerce in the lack of presence of human and social elements, social commerce emerges to revolutionize e-commerce by combining commercial and social activities via integrating social technologies into e-commerce sites [39].
4.3. Social Interactions and Behaviors
Authors are encouraged to devote more effort to issues concerning social interactions and behaviors. Advances in communication technologies dramatically change people’s connections and interactions with each other [40]. Social networking sites (SNSs) provide enormous opportunities for social interaction and information sharing [41,42]. SNSs, being popularly used for social interaction and information exchange with affordances of enabling users to freely self-portray and learn about others by viewing their online profiles and posts [43], have attracted scholars’ attention. Social media’s positive impacts on social capital and engagement are well-documented in the literature. However, there is also evidence showing the risk of maladaptive social media use caused mainly by low self-esteem [44]. There is thus an ongoing trend to look into social media’s “dark side” concerning negative impacts due to compulsive usage, negative comparisons, and “always-on” stresses [45]. Particularly, “online social interactions’ nature and how they relate to face-to-face peer relationships and psychopathology symptoms (p. 88) [46]” are ongoing topics.
4.4. Public Opinion and Social Media
Researchers are recommended to further research public opinion and social media. Social media sites like Twitter and Facebook are increasingly used by users to receive news and political information. Studies have shown that heavy social media users are exposed to more political disagreement media compared to light users [47]. Further effort to examine how social media exposes individuals to political disagreement is essential to understand how people experience civil society. In addition, social media platforms are increasingly exploited by public and response agencies managing crises and disasters [48] to not only examine public responses as cataclysmic events occur, but to reach those impacted by disasters more feasibly compared to traditional empirical inquiries [49].
4.5. Cyberbullying
There is a recent call for more research effort on cyberbullying. Cyberbullying is defined as “an aggressive, intentional act carried out by a group or individual, using electronic forms of contact, repeatedly and over time against a victim who cannot easily defend him or herself (p. 376) [50].” Typical cyberbullying includes sending harassing or threatening messages and posting derogatory comments on social media [51,52]. The widespread technology use puts young people at severe risk by exposing them to varied forms of online harassment and cyberbullying [53]. Significant relationships between cyberbullying and mental and cognitive problems, for example, “depression, low self-esteem, suicide ideation, social anxiety, low life satisfaction, externalized hostility, delinquency, and poor learning performance (p. 1) [54],” are widely reported.
4.6. Online Sexual Issues
Researchers are advised to continue to pay attention to online sexual issues. Nowadays, meeting someone on dating websites and beginning a romantic relationship has become common, which is different from meeting in person since a dating profile is created first to allow partner selection [55]. However, because personal online profiles can be easily manipulated, deceptive behaviors are also common. Furthermore, the internet provides opportunities for varied sexual experiences by enabling people to search information about sexual health, orientations, techniques, and behaviors [56]. In addition, people also engage in cybersex to experience real-time communications regarding sexual activities, fantasies, and desires with a partner [57]. Cybersex likely is becoming more common given the constantly advancing and widespread real-time communication technologies. Recently, scholars have been interested in investigating whether unwanted but consensual sexual activities exist, possible positive effects of behaviors like sexting, and whether sexting results vary across genders and relationship types (committed or casual).
4.7. Human-Robot and Virtual Environments
Issues concerning human–robot and virtual environments are worth investigating continuously. Immersive virtual environments have become new “spaces of life”, where humans inhabit using their avatars to engage in virtual communities [58]. This is in line with the claim that in virtual communities, identities are developing without geography and physical constraints [59]. Recently, there is an increasing interest in exploring behavioral factors behind immersion’s cognitive processes in virtual worlds. Virtual worlds are becoming an essential practice within the 21st century’s organizations [60], with avatar applications being increasingly adopted in virtual teams. Accordingly, efficient human–robot team configurations and exchanges should be explored to guarantee excellent task performance. In public settings, the success of applications and devices like tour-guide robots, robotic actors, and commercial entertainment robots is mainly due to novelty [61]. Nevertheless, detailed evaluations are needed to understand users’ stances towards robots’ long-term presence to help with daily tasks in private settings.
4.8. Games and Gamification
Authors are encouraged to devote more effort to issues related to games and gamification. Since the introduction of video games, although numerous studies examine the impact of violence on aggression during gameplay, results are not conclusive [62]. There is also no consensus on the mediating roles of notably enjoyment, frustration, and personality differences in relationships between violent gameplay and aggression. In terms of the positive effects of video games, accumulative evidence shows gamification’s effectiveness in cultivating health behaviors (e.g., exercising and walking) [63] and prosocial video game exposure in promoting players’ empathy and relevant prosocial behaviors. Nevertheless, more investigations into the neural correlations of these effects are needed. In addition, although it is common that players enjoy certain experiences (e.g., shooting or killing) in virtual worlds but would reject them in real-world scenarios, there is a lack of research on the nature of the relations between perceived realism and game enjoyment.
4.9. Potential Inter-Topic Research Directions
In addition to the above directions, there are several implications concerning joint investigations into two or more research topics. First, researchers are suggested to pay attention to psychological issues concerning the use of games and gamification, particularly among K-12 students. For one thing, with video games’ dissemination along with the common problem of pathologic use of games, psychological and psychiatric disorders (e.g., social isolation and low self-esteem) [64] due to gameplay are in urgent need to be investigated. For another thing, although it is commonly accepted that major motivational perspectives (i.e., trait, behaviorist learning, cognitive, self-determination, interest, and emotion) [65] can affect functions and possible effects of gamification, more empirical investigations are needed to focus on each one of the specific perspectives.
Second, cognitive issue investigation using biosignal and affective data in the context of CSCL and self-regulated learning is worth exploring. As an important, influential factor to learning, learners’ emotion, cognition, and affect are increasingly concerned during educational processes, particularly in the prevalent CSCL contexts where learners’ self-regulation is important for understanding individual performance during collaborations. However, the task of learner affect detection is not easy due to the complex nature of emotions. To facilitate the understanding of the complex interactions of invisible mental and metacognitive learning processes, researchers are suggested to seek ways to jointly analyze multimodal data collected using diverse data capture equipment like eye trackers, wearable sensors, and facial micro-gesture recorders [66]. Compared to the use of simple observation or self-reported data, such a combined analysis strategy allows one to simultaneously trace varied cognitive and non-cognitive processes to gain a deeper understanding of learners’ effects and emotions during learning.
Third, researchers are suggested to pay attention to online sexual and cyberbullying issues through public opinion mining and big social data analysis. For one thing, in cyberbullying detection, content-level features such as lexical, syntactic, and sentiment have been increasingly adopted to enhance predictive accuracies [67]. Although it is commonly accepted that people’s views, attitudes, and opinions can impact cyberbullying [68], more investigations into how internet public opinion affects cyberbullying are needed. For another thing, analysis of online sexual issues such as sexting facilitated by big social media data use is a promising direction. Although big data and data mining cannot make inferences themselves, they help identify various trends and patterns for further examination to derive implications behind to support relevant decision making. Social big data analysis is beneficial by integrating larger scale data involving varied thoughts and opinions possessed by diverse participants, thus leading to more precise predictions [69].
Finally, considering the popularity of industrial and service robots, scholars are encouraged to evaluate the potential of diverse technologies (e.g., robots, wearable computing devices, and assistance systems) with artificial intelligence features ([70,71]) into organizations to facilitate decision-making processes such as task schedules, allocations, and personnel selection and training [72]. This can relieve supervisors with standardized decision procedures and reduce potential conflicts with more unbiased decisions.
4.10. Challenges and Suggestions
Although bibliometric analysis has unique advantages in analyzing large-scale data compared to traditional systematic review methodologies, there are still challenges mainly centering on data processing, including data supplementary and data normalization. Specifically, it is common to find incompleteness in the collected data, particularly about authors’ address information. Thus, data supplementary is needed. Automatic extraction of such information from full-texts is challenging due to inconsistencies in manuscript formats. Therefore, in the current study, we supplemented incomplete data manually based on full texts. However, it would be time-consuming and laborious when dealing with a much larger dataset. Thus, future research is suggested to develop more effective automatic approaches to extract information of interest from full texts.
Data normalization mainly includes keyword/term normalization and authors’ institution normalization. In terms of keyword/term normalization, it is common to find terms or keywords with similar semantic meanings, and they should be normalized to represent the same issues. However, traditional ways of normalization based on natural language processing techniques are not ideal due to the fact that terms may have different meanings in different domains. In the current study, we normalized the keywords or terms manually to avoid any inconsistencies and enhance data quality. However, when the dataset is much larger, such manual processing could be laborious. Thus, future research is suggested to propose effective domain-specific normalization methodologies to facilitate keyword/term normalization in bibliometric studies. Another challenge concerning data normalization is the inconsistent expressions about names of authors’ affiliated institutions. In the current study, we dealt with such issues mainly using a normalization list collected based on our previous bibliometric studies. However, there are still cases that are not covered in our list; thus, manual processing is still needed. In future work, it is suggested to propose more effective methodologies to deal with inconsistencies in institution names in a fully automatic way.
5. Conclusions
This review adopts STM and bibliometrics to justify the status, trends, and particularly the thematic structure in the field of human behaviors concerning computer use and to identify the future lines of research. We particularly focus on answers to “in what research topics were the CHB community interested,” “how did such research topics evolve over time,”, and “what were the main research concerns of the major contributors.” We additionally identified the major countries/regions and institutions and visualized their collaborations. As a well-known and well-established source with a wide impact and wide range of audiences in human interactions with technologies, implications drawn are potential in helping research governors and funding agencies make policy decisions regarding the interaction of humans and computers. Additionally, with this study, we hope to raise researchers’ awareness of the current research status of the topics and develop research agendas for future investigation.
Author Contributions
Conceptualization, X.C. and D.Z.; methodology, X.C.; software, H.X.; validation, G.C., D.Z. and H.X.; formal analysis, X.C.; writing—original draft preparation, X.C.; writing—review and editing, G.C. and H.X.; supervision, D.Z.; project administration, G.C. and H.X.; funding acquisition, G.C. and H.X.; All authors have read and agreed to the published version of the manuscript.
Funding
This research was funded by the Teaching Development Grant (102489) and HKIBS Research Program Grant Application (HCRG-201-002, 702024) of Lingnan University, Hong Kong, the One-off Special Fund from Central and Faculty Fund in Support of Research from 2019/20 to 2021/22 (MIT02/19-20), the Research Cluster Fund (RG 78/2019-2020R), the Interdisciplinary Research Scheme of the Dean’s Research Fund 2019-20 (FLASS/DRF/IDS-2) of The Education University of Hong Kong and “The APC was funded by the One-off Special Fund from Central and Faculty Fund in Support of Research from 2019/20 to 2021/22 (MIT02/19-20) of The Education University of Hong Kong”.
Institutional Review Board Statement
Not applicable.
Informed Consent Statement
Not applicable.
Data Availability Statement
The data presented in this study are available on request from the corresponding author.
Conflicts of Interest
The authors declare no conflict of interest.
Appendix A

Table A1.
In comparisons with Vošner et al. (2016).
| Studies | Aspects | Vošner et al. (2016) | |
|---|---|---|---|
| Vošner et al. (2016) | Period | 1985–2015 | |
| Country analysis | Methods | Most prolific countries | |
| Results | USA, Taiwan, the Netherlands, UK, Germany | ||
| Institution | Methods | Most prolific institutions | |
| Analysis | Results | State University System of Florida, Open University Netherlands, University of North Carolina, University of Twente, University of California System | |
| Collaboration analysis | Methods | Social network analysis | |
| Results | Close collaborators: Sungkyunkwan University and University of Southern California; University of Twente and Utrecht University; Open University of The Netherlands and Utrecht University | ||
| Topic analysis | Methods | Bibliometrics, keywords co-occurrence analysis | |
| Results | Human–computer interaction, attitudes and opinions about the computer use, internet and knowledge sharing, internet-based collaborative learning, psychological impact of computer use, and social media platforms | ||
| Our study | Period | 1985–2019 | |
| Country analysis | Methods | Most influential countries/regions ranked by H-index | |
| Results | USA, UK, Taiwan, South Korea, the Netherlands | ||
| Institution | Methods | Most influential institutions ranked by H-index | |
| Analysis | Results | Open University of Netherlands, Michigan State University, Sungkyunkwan University, Pennsylvania State University, University of Twente | |
| Collaboration analysis | Methods | Social network analysis | |
| Results | Countries/regions from the same continents, as well as institutions from the same countries/regions tended to collaborate more in conducting CHB research | ||
| Topic analysis | Methods | Structural topic model, Mann–Kendall test, affinity propagation clustering | |
| Results | 1. Top five topics: e-commerce, social interactions and behaviors, public opinion and social media, knowledge management for organizations, and cyberbullying | ||
| 2. Seven increasing topics: e-commerce, social interactions and behaviors, public opinion and social media, cyberbullying, online sexual issues, human-robot and virtual environment, and game and gamification | |||
| 3. Inter-topical research directions: (1) game and gamification, technology-related psychological issues, ICT for K-12 pedagogy, and smart healthcare; (2) CSCL and self-regulated learning, cognitive issues for hypermedia, and biosignal and affective data; (3) social interactions and behaviors, online sexual issues, public opinion and social media, and cyberbullying; (4) knowledge management for organizations, e-commerce, and human–robot and virtual environment | |||
References
- Shaw, H.; Ellis, D.A.; Ziegler, F.V. The Technology Integration Model (TIM). Predicting the continued use of technology. Comput. Hum. Behav. 2018, 83, 204–214. [Google Scholar] [CrossRef] [Green Version]
- Katerina, T.; Nicolaos, P. Mouse behavioral patterns and keystroke dynamics in End-User Development: What can they tell us about users’ behavioral attributes? Comput. Hum. Behav. 2018, 83, 288–305. [Google Scholar] [CrossRef]
- Yan, H.; Zhang, Y.; Wang, Y.; Xu, K. WiAct: A passive WiFi-based human activity recognition system. IEEE Sens. J. 2019, 20, 296–305. [Google Scholar] [CrossRef]
- Aurangzeb, K.; Haider, I.; Khan, M.A.; Saba, T.; Javed, K.; Iqbal, T.; Rehman, A.; Ali, H.; Sarfraz, M.S. Human Behavior Analysis Based on Multi-Types Features Fusion and Von Nauman Entropy Based Features Reduction. J. Med. Imaging Health Inform. 2019, 9, 662–669. [Google Scholar] [CrossRef]
- Wang, Z.; Hou, Y.; Jiang, K.; Zhang, C.; Dou, W.; Huang, Z.; Guo, Y. A Survey on Human Behavior Recognition Using Smartphone-Based Ultrasonic Signal. IEEE Access 2019, 7, 100581–100604. [Google Scholar] [CrossRef]
- Lee, Y.; Driscoll, M.P.; Nelson, D.W. The Past, Present, and Future of Research in Distance Education: Results of a Content Analysis. Am. J. Distance Educ. 2004, 18, 225–241. [Google Scholar] [CrossRef]
- West, R.E. About this article and new series. Educ. Technol. 2011, 51, 60. [Google Scholar]
- Zawacki-Richter, O.; Latchem, C. Exploring four decades of research in Computers & Education. Comput. Educ. 2018, 122, 136–152. [Google Scholar] [CrossRef]
- Chen, X.; Xie, H.; Wang, F.L.; Liu, Z.; Xu, J.; Hao, T. A bibliometric analysis of natural language processing in medical research. BMC Med. Inform. Decis. Mak. 2018, 18. [Google Scholar] [CrossRef] [Green Version]
- Chen, X.; Hao, J.; Chen, J.; Hua, S.; Hao, T. A Bibliometric Analysis of the Research Status of the Technology Enhanced Language Learning; Springer International Publishing: Cham, Switzerland, 2018; pp. 169–179. [Google Scholar]
- Lemay, D.J.; Baek, C.; Doleck, T. Comparison of Learning Analytics and Educational Data Mining: A Topic Modeling Approach. Comput. Educ. Artif. Intell. 2021, 2, 100016. [Google Scholar] [CrossRef]
- Kabudi, T.; Pappas, I.; Olsen, D.H. AI-enabled Adaptive Learning Systems: A Systematic Mapping of the Literature. Comput. Educ. Artif. Intell. 2021, 2, 100017. [Google Scholar] [CrossRef]
- Vošner, H.B.; Kokol, P.; Bobek, S.; Železnik, D.; Završnik, J. A bibliometric retrospective of the Journal Computers in Human Behavior (1991–2015). Comput. Hum. Behav. 2016, 65, 46–58. [Google Scholar] [CrossRef]
- Kuhn, K.D. Using structural topic modeling to identify latent topics and trends in aviation incident reports. Transp. Res. Part C Emerg. Technol. 2018, 87, 105–122. [Google Scholar] [CrossRef]
- Nielsen, M.W.; Börjeson, L. Gender diversity in the management field: Does it matter for research outcomes? Res. Policy 2019, 48, 1617–1632. [Google Scholar] [CrossRef]
- Chen, X.; Chen, J.; Cheng, G.; Gong, T. Topics and trends in artificial intelligence assisted human brain research. PLoS ONE 2020, 15, e0231192. [Google Scholar] [CrossRef]
- Chen, X.; Tao, X.; Wang, F.L.; Xie, H. Global research on artificial intelligence-enhanced human electroencephalogram analysis. Neural Comput. Appl. 2021, 1–39. [Google Scholar] [CrossRef]
- Chen, X.; Xie, H. A Structural Topic Modeling-Based Bibliometric Study of Sentiment Analysis Literature. Cogn. Comput. 2020, 12, 1097–1129. [Google Scholar] [CrossRef]
- Hannigan, T.R.; Haans, R.F.J.; Vakili, K.; Tchalian, H.; Glaser, V.L.; Wang, M.S.; Kaplan, S.; Jennings, P.D. Topic Modeling in Management Research: Rendering New Theory from Textual Data. Acad. Manag. Ann. 2019, 13, 586–632. [Google Scholar] [CrossRef] [Green Version]
- Chen, X.; Zou, D.; Xie, H.; Wang, F.L. Past, present, and future of smart learning: A topic-based bibliometric analysis. Int. J. Educ. Technol. High. Educ. 2021, 18, 1–29. [Google Scholar] [CrossRef]
- Chen, X.; Zou, D.; Xie, H.; Cheng, K.S. Twenty years of personalized language learning: Topic modeling and knowledge mapping. Educ. Technol. Soc. 2021, 24, 205–222. [Google Scholar]
- Chen, X.; Zou, D.; Cheng, G.; Xie, H. Detecting latent topics and trends in educational technologies over four decades using structural topic modeling: A retrospective of all volumes of Computers & Education. Comput. Educ. 2020, 151, 103855. [Google Scholar] [CrossRef]
- Chen, X.; Zou, D.; Xie, H. Fifty years of British Journal of Educational Technology: A topic modeling based bibliometric perspective. Br. J. Educ. Technol. 2020, 51, 692–708. [Google Scholar] [CrossRef]
- Roberts, M.E.; Stewart, B.M.; Tingley, D.; Lucas, C.; Leder-Luis, J.; Gadarian, S.K.; Albertson, B.; Rand, D.G. Structural Topic Models for Open-Ended Survey Responses. Am. J. Politics Sci. 2014, 58, 1064–1082. [Google Scholar] [CrossRef] [Green Version]
- Mann, H.B. Non-parametric tests against trend. Econometrica 1945, 13, 245–259. Available online: https://www.jstor.org/stable/pdf/1907187.pdf (accessed on 25 April 2020). [CrossRef]
- Hirsch, J.E. An index to quantify an individual’s scientific research output. Proc. Natl. Acad. Sci. USA 2005, 102, 16569–16572. [Google Scholar] [CrossRef] [Green Version]
- Bastian, S.; Ippolito, J.A.; Lopez, S.A.; Eloy, J.A.; Beebe, K.S. The Use of the h-Index in Academic Orthopaedic Surgery. J. Bone Jt. Surg. Am. Vol. 2017, 99, e14. [Google Scholar] [CrossRef]
- Liu, J.S.; Lu, L.Y.; Lu, W.-M.; Lin, B.J. Data envelopment analysis 1978–2010: A citation-based literature survey. Omega 2013, 41, 3–15. [Google Scholar] [CrossRef]
- Otte, E.; Rousseau, R. Social network analysis: A powerful strategy, also for the information sciences. J. Inf. Sci. 2002, 28, 441–453. [Google Scholar] [CrossRef]
- Bastian, M.; Heymann, S.; Jacomy, M. Gephi: An open source software for exploring and manipulating networks. In Proceedings of the Third International AAAI Conference on Weblogs and Social Media, San Jose, CA, USA, 17–20 May 2009; Available online: https://ojs.aaai.org/index.php/ICWSM/article/view/13937 (accessed on 25 April 2020).
- Roberts, M.E.; Stewart, B.M.; Airoldi, E.M. A Model of Text for Experimentation in the Social Sciences. J. Am. Stat. Assoc. 2016, 111, 988–1003. [Google Scholar] [CrossRef]
- Farrell, J. Corporate funding and ideological polarization about climate change. Proc. Natl. Acad. Sci. USA 2016, 113, 92–97. [Google Scholar] [CrossRef] [Green Version]
- Prieto-Jiménez, E.; López-Catalán, L.; López-Catalán, B.; Domínguez-Fernández, G. Sustainable Development Goals and Education: A Bibliometric Mapping Analysis. Sustainability 2021, 13, 2126. [Google Scholar] [CrossRef]
- León-Gómez, A.; Ruiz-Palomo, D.; Fernández-Gámez, M.A.; García-Revilla, M.R. Sustainable Tourism Development and Economic Growth: Bibliometric Review and Analysis. Sustainability 2021, 13, 2270. [Google Scholar] [CrossRef]
- Choshin, M.; Ghaffari, A. An investigation of the impact of effective factors on the success of e-commerce in small- and medium-sized companies. Comput. Hum. Behav. 2017, 66, 67–74. [Google Scholar] [CrossRef]
- Chen, J.V.; Tran, A.; Nguyen, T. Understanding the discontinuance behavior of mobile shoppers as a consequence of technostress: An application of the stress-coping theory. Comput. Hum. Behav. 2019, 95, 83–93. [Google Scholar] [CrossRef]
- Li, Y.; Yang, R. New Business Model for Company toWin the Competition. Am. J. Ind. Bus. Manag. 2014, 4, 190–198. [Google Scholar] [CrossRef] [Green Version]
- Tam, C.; Oliveira, T. Understanding the impact of m-banking on individual performance: DeLone & McLean and TTF perspective. Comput. Hum. Behav. 2016, 61, 233–244. [Google Scholar] [CrossRef]
- Lu, B.; Fan, W.; Zhou, M. Social presence, trust, and social commerce purchase intention: An empirical research. Comput. Hum. Behav. 2016, 56, 225–237. [Google Scholar] [CrossRef] [Green Version]
- Ishii, K. Online communication with strong ties and subjective well-being in Japan. Comput. Hum. Behav. 2017, 66, 129–137. [Google Scholar] [CrossRef]
- Wenninger, H.; Cheung, C.M.; Krasnova, H. College-aged users behavioral strategies to reduce envy on social networking sites: A cross-cultural investigation. Comput. Hum. Behav. 2019, 97, 10–23. [Google Scholar] [CrossRef]
- Przybylski, A.K.; Murayama, K.; DeHaan, C.R.; Gladwell, V. Motivational, emotional, and behavioral correlates of fear of missing out. Comput. Hum. Behav. 2013, 29, 1841–1848. [Google Scholar] [CrossRef]
- Shen, J.; Brdiczka, O.; Liu, J. A study of Facebook behavior: What does it tell about your Neuroticism and Extraversion? Comput. Hum. Behav. 2015, 45, 32–38. [Google Scholar] [CrossRef]
- Kanat-Maymon, Y.; Almog, L.; Cohen, R.; Amichai-Hamburger, Y. Contingent self-worth and Facebook addiction. Comput. Hum. Behav. 2018, 88, 227–235. [Google Scholar] [CrossRef]
- Hughes, N.; Burke, J. Sleeping with the frenemy: How restricting ‘bedroom use’ of smartphones impacts happiness and wellbeing. Comput. Hum. Behav. 2018, 85, 236–244. [Google Scholar] [CrossRef]
- Khalis, A.; Mikami, A.Y. Talking face-to-Facebook: Associations between online social interactions and offline relationships. Comput. Hum. Behav. 2018, 89, 88–97. [Google Scholar] [CrossRef]
- Barnidge, M. The role of news in promoting political disagreement on social media. Comput. Hum. Behav. 2015, 52, 211–218. [Google Scholar] [CrossRef]
- Lin, X.; Lachlan, K.A.; Spence, P.R. Exploring extreme events on social media: A comparison of user reposting/retweeting behaviors on Twitter and Weibo. Comput. Hum. Behav. 2016, 65, 576–581. [Google Scholar] [CrossRef] [Green Version]
- Spence, P.R.; Lachlan, K.A.; Rainear, A.M. Social media and crisis research: Data collection and directions. Comput. Hum. Behav. 2016, 54, 667–672. [Google Scholar] [CrossRef] [Green Version]
- Smith, P.K.; Mahdavi, J.; Carvalho, M.; Fisher, S.; Russell, S.; Tippett, N. Cyberbullying: Its nature and impact in secondary school pupils. J. Child. Psychol. Psychiatry 2008, 49, 376–385. [Google Scholar] [CrossRef]
- Melander, L.A. College Students’ Perceptions of Intimate Partner Cyber Harassment. Cyberpsychol. Behav. Soc. Netw. 2010, 13, 263–268. [Google Scholar] [CrossRef] [Green Version]
- Wolak, J.; Mitchell, K.J.; Finkelhor, D. Does Online Harassment Constitute Bullying? An Exploration of Online Harassment by Known Peers and Online-Only Contacts. J. Adolesc. Health 2007, 41, S51–S58. [Google Scholar] [CrossRef]
- Hong, J.S.; Kim, D.H.; Thornberg, R.; Kang, J.H.; Morgan, J.T. Correlates of direct and indirect forms of cyberbullying victimization involving South Korean adolescents: An ecological perspective. Comput. Hum. Behav. 2018, 87, 327–336. [Google Scholar] [CrossRef]
- Larrañaga, E.; Santiago, Y.; Anastasio, O.; Raúl, N. Loneliness, parent-child communication and cyberbullying victimization among Spanish youths. Comput. Hum. Behav. 2016, 65, 1–8. [Google Scholar] [CrossRef]
- Chappetta, K.C.; Barth, J.M. How gender role stereotypes affect attraction in an online dating scenario. Comput. Hum. Behav. 2016, 63, 738–746. [Google Scholar] [CrossRef] [Green Version]
- Shaughnessy, K.; Byers, E.S. Contextualizing cybersex experience: Heterosexually identified men and women’s desire for and experiences with cybersex with three types of partners. Comput. Hum. Behav. 2014, 32, 178–185. [Google Scholar] [CrossRef]
- Chatzinikolaou, A.; Lievens, E. Towards a Legal Qualifcaton of Online Sexual Acts in which Children are Involved: Constructng a Typology. Eur. J. Law Technol. 2019, 10, 1–24. [Google Scholar]
- Guitton, M.J. Living in the Hutt Space: Immersive process in the Star Wars Role-Play community of Second Life. Comput. Hum. Behav. 2012, 28, 1681–1691. [Google Scholar] [CrossRef]
- Cristofari, C.; Guitton, M.J. Mapping virtual communities by their visual productions: The example of the Second Life Steampunk community. Comput. Hum. Behav. 2014, 41, 374–383. [Google Scholar] [CrossRef]
- Monzani, L.; Ripoll, P.; Peiró, J.M.; Van Dick, R. Loafing in the digital age: The role of computer mediated communication in the relation between perceived loafing and group affective outcomes. Comput. Hum. Behav. 2014, 33, 279–285. [Google Scholar] [CrossRef]
- Gaudiello, I.; Zibetti, E.; Lefort, S.; Chetouani, M.; Ivaldi, S. Trust as indicator of robot functional and social acceptance. An experimental study on user conformation to iCub answers. Comput. Hum. Behav. 2016, 61, 633–655. [Google Scholar] [CrossRef]
- Jerabeck, J.M.; Ferguson, C.J. The influence of solitary and cooperative violent video game play on aggressive and prosocial behavior. Comput. Hum. Behav. 2013, 29, 2573–2578. [Google Scholar] [CrossRef]
- Kaczmarek, L.D.; Misiak, M.; Behnke, M.; Dziekan, M.; Guzik, P. The Pikachu effect: Social and health gaming motivations lead to greater benefits of Pokémon GO use. Comput. Hum. Behav. 2017, 75, 356–363. [Google Scholar] [CrossRef]
- Von der Emde, S.; Schneider, J.; Kötter, M. Technically speaking: Transforming language learning through virtual learning environments (MOOs). Mod. Lang J. 2001, 85, 210–225. [Google Scholar] [CrossRef]
- Chung, J.W.Y.; So, H.C.F.; Choi, M.M.T.; Yan, V.C.M.; Wong, T.K.S. Artificial Intelligence in education: Using heart rate variability (HRV) as a biomarker to assess emotions objectively. Comput. Educ. Artif. Intell. 2021, 2, 100011. [Google Scholar] [CrossRef]
- Noroozi, O.; Alikhani, I.; Järvelä, S.; Kirschner, P.A.; Juuso, I.; Seppänen, T. Multimodal data to design visual learning analytics for understanding regulation of learning. Comput. Hum. Behav. 2019, 100, 298–304. [Google Scholar] [CrossRef]
- Van Hee, C.; Jacobs, G.; Emmery, C.; De Smet, B.; Lefever, E.; Verhoeven, B.; de Pauw, G.; Daelemans, W.; Hoste, V. Automatic detection of cyberbullying in social media text. PLoS ONE 2018, 13, e0203794. [Google Scholar] [CrossRef]
- Abaido, G.M. Cyberbullying on social media platforms among university students in the United Arab Emirates. Int. J. Adolesc. Youth 2020, 25, 407–420. [Google Scholar] [CrossRef] [Green Version]
- Rodriguez, R.; Blazquez, M.; López, B.; Castro, M.; Cristobal, E.S.; Martin, S. Educational games for improving the teaching-learning process of a CLIL subject: Physics and chemistry in secondary education. In Proceedings of the 2014 IEEE Frontiers in Education Conference (FIE) Proceedings, Madrid, Spain, 22–25 October 2014; pp. 1–8. [Google Scholar]
- Chen, X.; Xie, H.; Hwang, G.-J. A multi-perspective study on Artificial Intelligence in Education: Grants, conferences, journals, software tools, institutions, and researchers. Comput. Educ. Artif. Intell. 2020, 1. [Google Scholar] [CrossRef]
- Chen, X.; Xie, H.; Zou, D.; Hwang, G.-J. Application and theory gaps during the rise of Artificial Intelligence in Education. Comput. Educ. Artif. Intell. 2020, 1, 100002. [Google Scholar] [CrossRef]
- Ötting, S.K.; Maier, G.W. The importance of procedural justice in Human–Machine Interactions: Intelligent systems as new decision agents in organizations. Comput. Hum. Behav. 2018, 89, 27–39. [Google Scholar] [CrossRef]
Figure 1.
Impact factor of CHB (note: data were obtained from JCR via https://jcr.clarivate.com/ accessed on 1 April 2020).
Figure 1.
Impact factor of CHB (note: data were obtained from JCR via https://jcr.clarivate.com/ accessed on 1 April 2020).

Figure 2.
Flowchart of the data collection, pre-processing, and analyses.
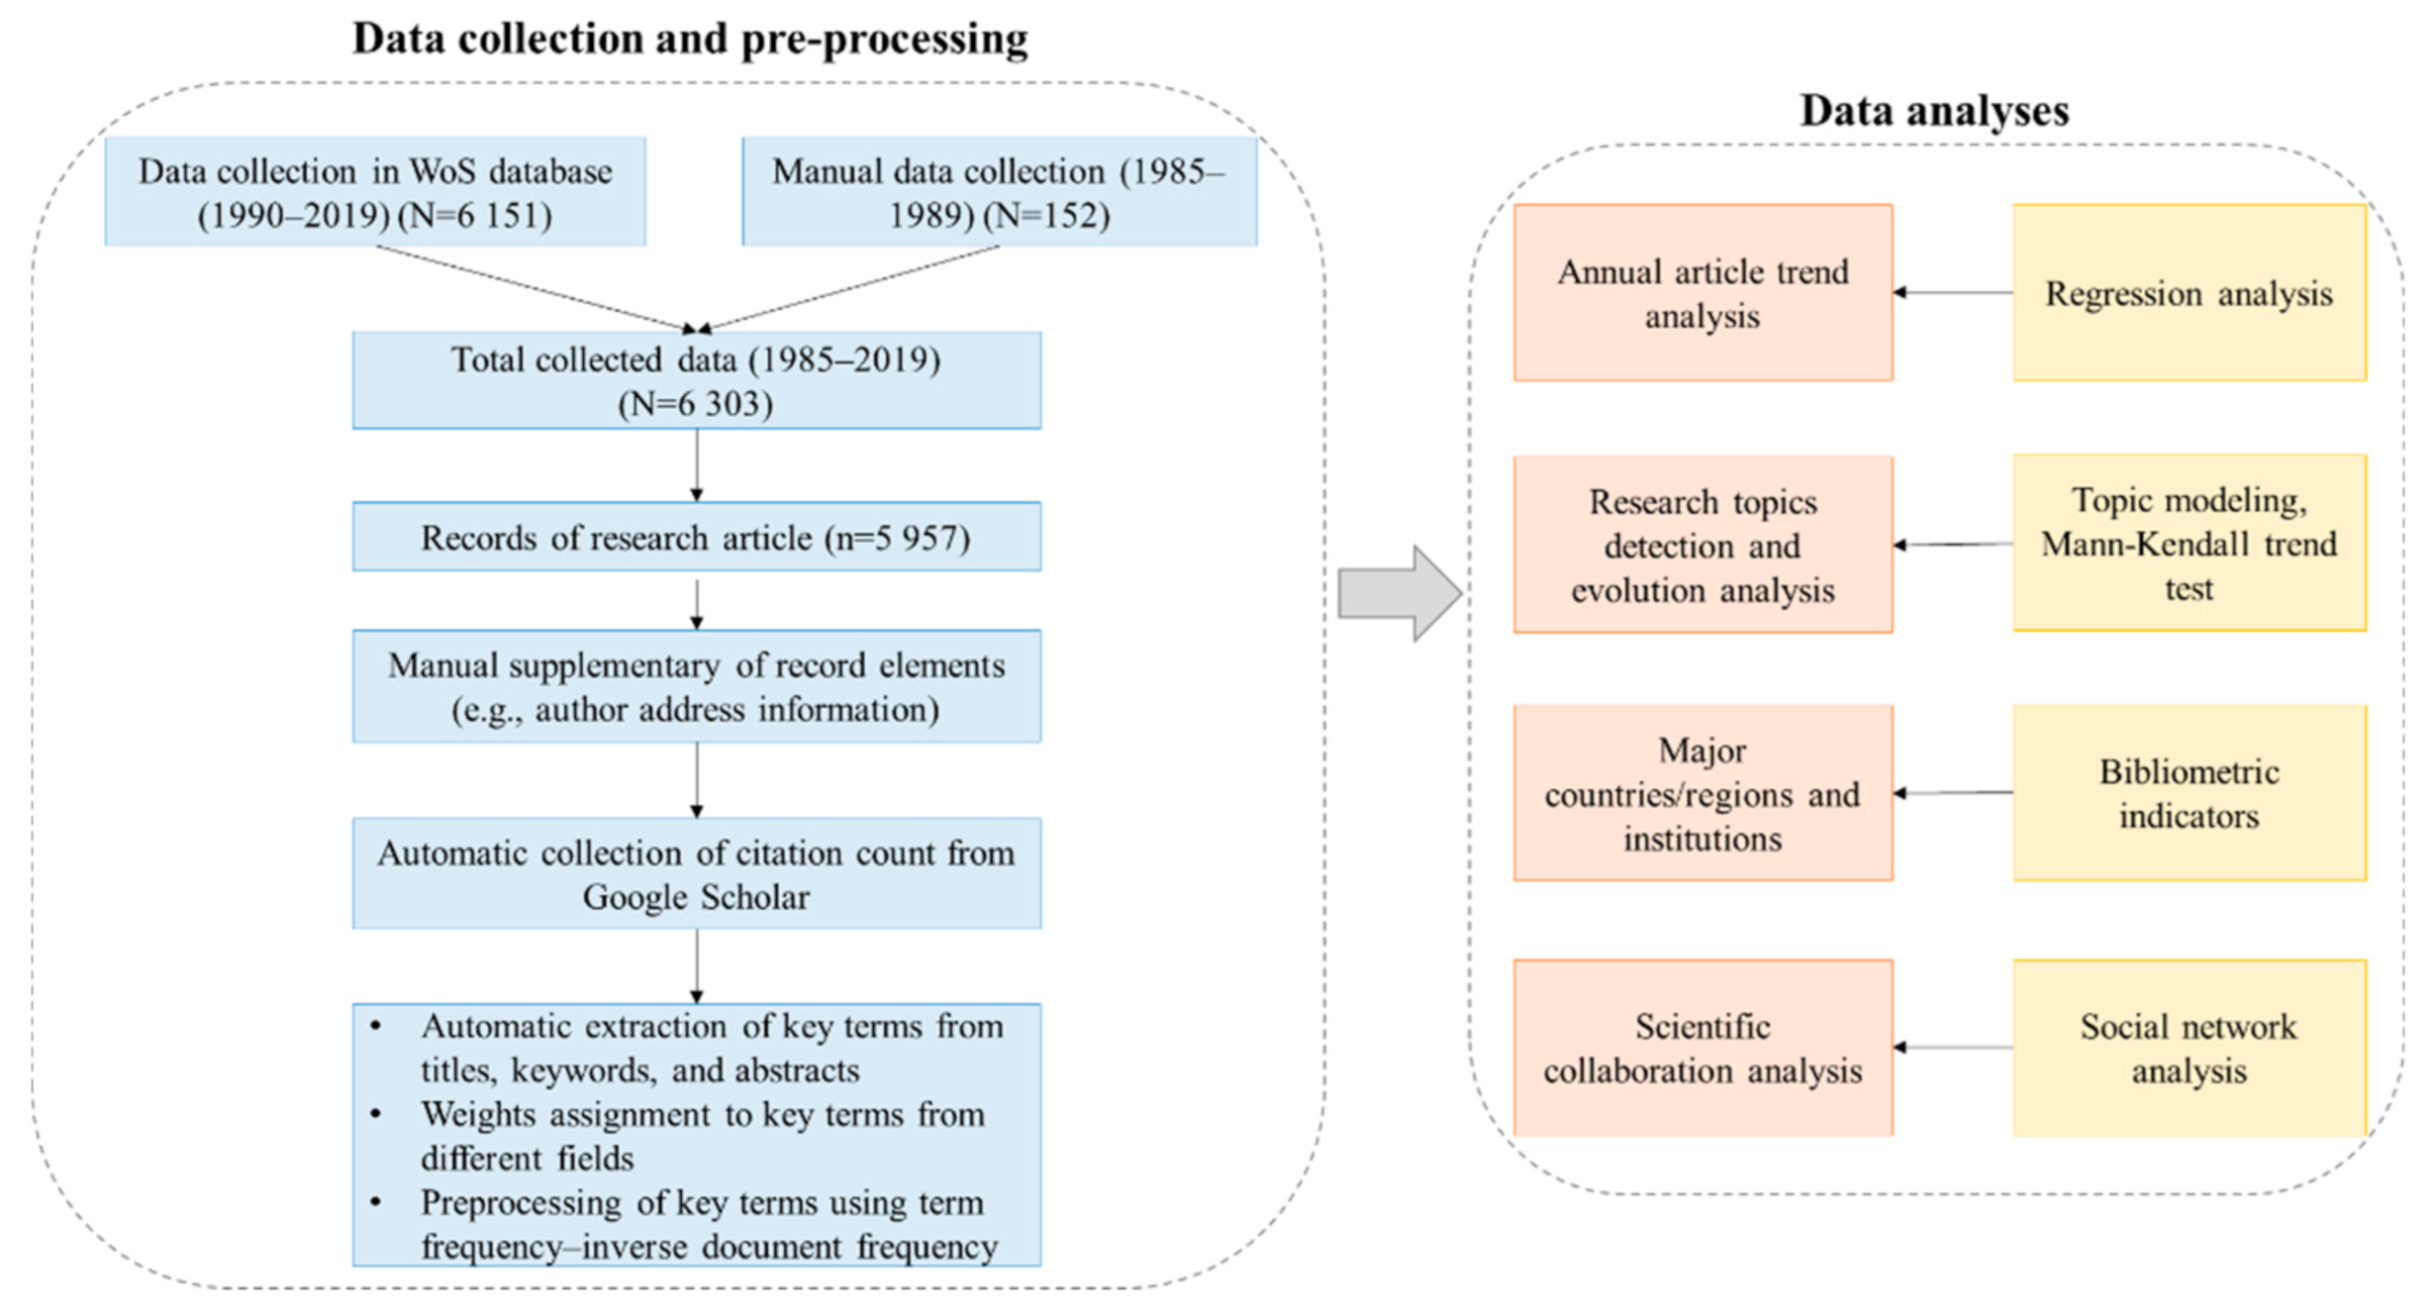
Figure 3.
Model diagnostics.

Figure 4.
Year-by-year analysis of publications.

Figure 5.
Annual topic proportions.

Figure 6.
Topic distributions by year.
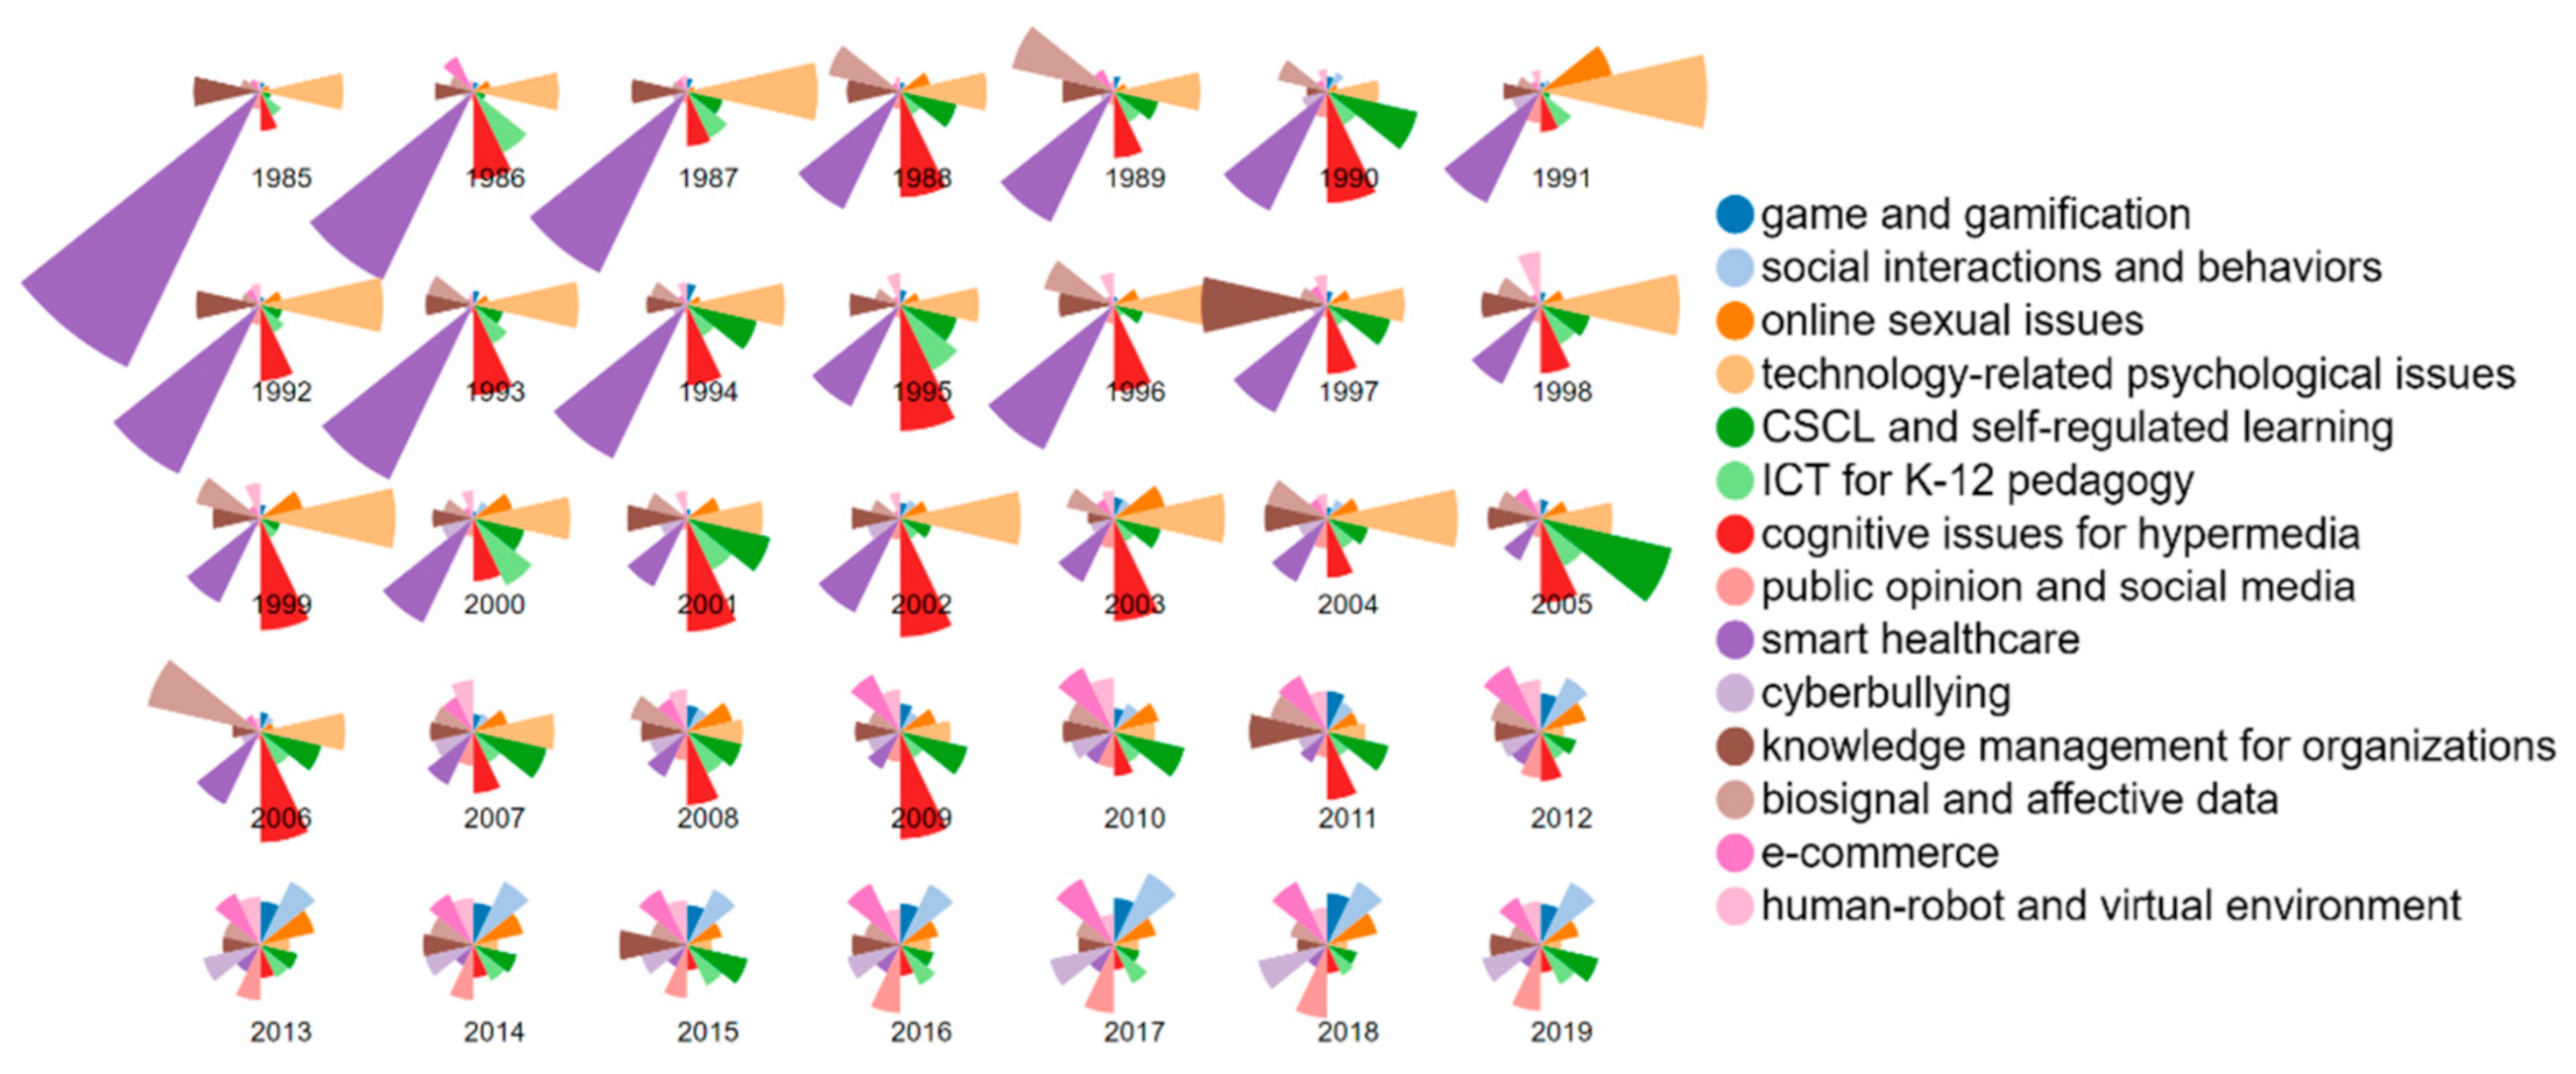
Figure 7.
The AP clustering results.
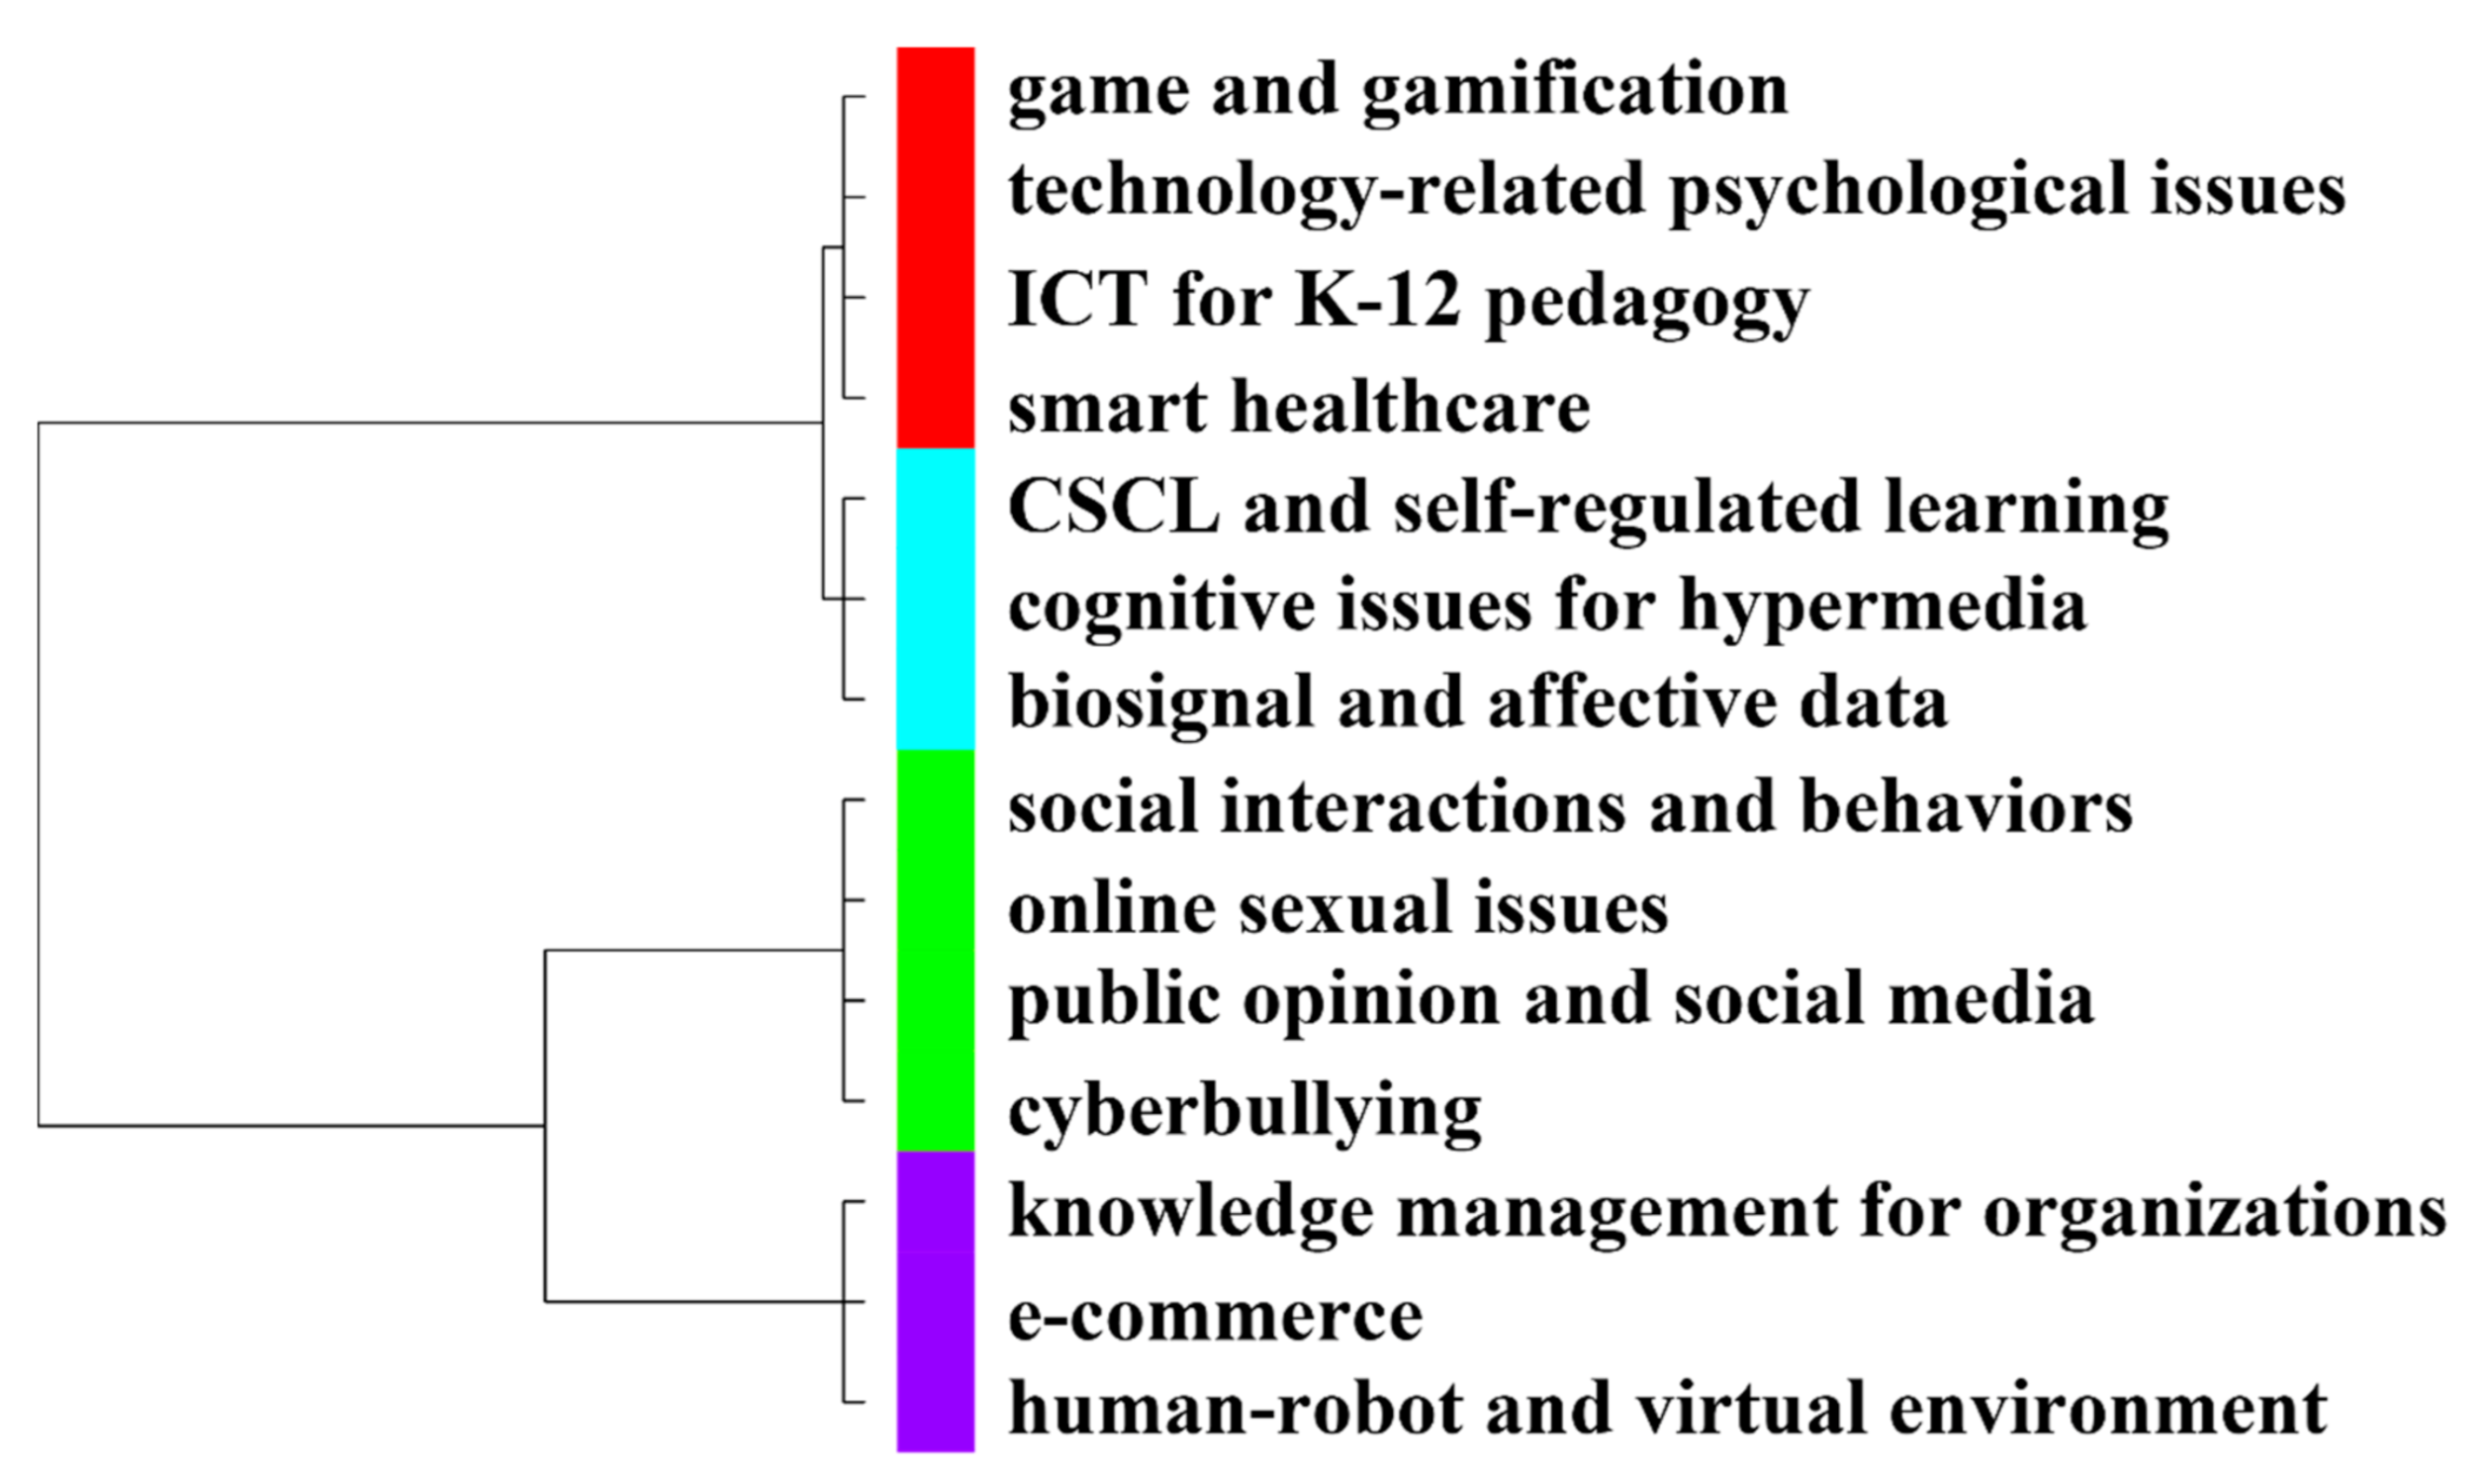
Figure 8.
Collaborations among countries/regions (article count ≥ 30).

Figure 9.
Collaborations among institutions (article count ≥ 35).

Figure 10.
Topic distributions across top (a) countries/regions and (b) institutions.

Table 1.
Top frequently used terms.
| Terms | A1 (R) | A2 (R) | A3 (R) | A4 (R) |
|---|---|---|---|---|
| internet | 1575 (1) | 242 (7) | 1333 (1) | 624 (2) |
| learning | 1374 (2) | 355 (2) | 1019 (3) | 467 (3) |
| medium | 1283 (3) | 90 (39) | 1193 (2) | 709 (1) |
| computer | 1246 (4) | 614 (1) | 632 (12) | 256 (22) |
| system | 1098 (5) | 331 (3) | 767 (5) | 343 (8) |
| group | 1071 (6) | 253 (4) | 818 (4) | 375 (6) |
| knowledge | 920 (7) | 201 (9) | 719 (7) | 307 (14) |
| cognitive | 872 (8) | 221 (8) | 651 (11) | 317 (12) |
| attitude | 849 (9) | 248 (6) | 601 (14) | 297 (16) |
| task | 780 (10) | 251 (5) | 529 (19) | 249 (25) |
| motivation | 768 (11) | 84 (45) | 684 (9) | 347 (7) |
| 749 (12) | 3 (2240) | 746 (6) | 432 (4) | |
| site | 744 (13) | 48 (140) | 696 (8) | 376 (5) |
| network | 706 (14) | 48 (140) | 658 (10) | 324 (11) |
| intention | 674 (15) | 51 (123) | 623 (13) | 338 (9) |
| gender | 664 (16) | 151 (13) | 513 (23) | 253 (23) |
| game | 658 (17) | 62 (86) | 596 (15) | 315 (13) |
| content | 641 (18) | 123 (22) | 518 (22) | 263 (19) |
| education | 633 (19) | 120 (25) | 513 (23) | 268 (18) |
| personality | 614 (20) | 89 (41) | 525 (20) | 259 (21) |
| acceptance | 613 (21) | 81 (49) | 532 (18) | 261 (20) |
| strategy | 612 (22) | 121 (24) | 491 (25) | 252 (24) |
| satisfaction | 606 (23) | 81 (49) | 525 (20) | 297 (16) |
| tool | 605 (24) | 140 (16) | 465 (28) | 192 (48) |
| problem | 589 (25) | 198 (10) | 391 (41) | 191 (49) |
| usage | 581 (26) | 91 (37) | 490 (26) | 228 (32) |
| control | 575 (27) | 132 (20) | 443 (29) | 230 (31) |
| adolescent | 569 (28) | 34 (218) | 535 (17) | 325 (10) |
| scale | 566 (29) | 149 (14) | 417 (32) | 234 (29) |
| networking | 548 (30) | 8 (1046) | 540 (16) | 298 (15) |
| quality | 538 (31) | 103 (35) | 435 (30) | 224 (34) |
| virtual | 535 (32) | 60 (90) | 475 (27) | 204 (44) |
| psychological | 502 (33) | 115 (30) | 387 (42) | 225 (33) |
| human | 501 (34) | 125 (21) | 376 (46) | 185 (51) |
| school | 496 (35) | 102 (36) | 394 (40) | 207 (41) |
| management | 486 (36) | 76 (57) | 410 (35) | 201 (47) |
| anxiety | 482 (37) | 187 (11) | 295 (61) | 167 (57) |
| life | 478 (38) | 52 (119) | 426 (31) | 237 (27) |
| age | 474 (39) | 67 (71) | 407 (36) | 224 (34) |
| service | 469 (40) | 65 (75) | 404 (37) | 203 (45) |
Abbreviations: R: ranking position; A1, A2, A3, and A4: article counts of the periods 1985–2019, 1985–2009, 2010–2019, and 2016–2019.
Table 2.
The 14-topic results.
| Labels | Representative Terms | % | p | Trend |
|---|---|---|---|---|
| e-commerce | continuance, purchase, word-of-mouth, innovativeness, utilitarian, tam, ewom, price, externality, repurchase | 9.14 | 0.00002 | ↑↑↑↑ |
| social interactions and behaviors | smartphone, neuroticism, extraversion, extroversion, fb, networking, envy, fomo, narcissistic, sns | 8.85 | 0 | ↑↑↑↑ |
| public opinion and social media | political, crisis, tweet, cancer, incivility, election, lurking, breach, retweeting, presidential | 8.11 | 0 | ↑↑↑↑ |
| knowledge management for organizations | enterprise, technology-organization-environment, agile, turnover, governance, maturity, organizational, employee, fuzzy, coopetition | 7.79 | 0.3634 | ↓ |
| cyberbullying | cyberbullying, victimization, bullying, cyber, parental, adolescence, bystander, parenting, cybervictimization, pathological | 7.62 | 0 | ↑↑↑↑ |
| CSCL and self-regulated learning | self-regulated, cscl, srl, gstudy, collaborative, associative, collaborator, analytics, tutoring, apprenticeship | 7.50 | 0.3065 | ↑ |
| cognitive issues for hypermedia | hypermedia, cognitive-load, split-attention, landmark, solving, load, self-explanation, novice, hypertext, cognitive | 6.97 | 0.00216 | ↓↓↓ |
| smart healthcare | applicant, autism, aging, self-help, asd, writer, mmpi, psychotherapy, dementia, panic | 6.74 | 0 | ↓↓↓↓ |
| biosignal and affective data | banner, mouse, layout, seductive, eye, polychronicity, visual, engine, movement, eye-tracking | 6.60 | 0.4954 | ↑ |
| online sexual issues | sexting, dating, intimacy, sexual, ostracism, self-awareness, sext, im, chatbot, machiavellianism | 6.40 | 0.00001 | ↑↑↑↑ |
| technology-related psychological issues | cyberloafing, computer-related, technophobia, computerphobia, attitude, self-efficacy, instrument, validity, anxiety, psychometric | 6.22 | 0 | ↓↓↓↓ |
| ICT for K-12 pedagogy | ict, pre-service, flipped, k-12, pedagogy, lecture, efl, teacher, literacy, classroom | 6.20 | 0.6292 | ↑ |
| human-robot and virtual environment | robot, human-robot, robotic, team, humanoid, multicultural, virtual, agent, community, newcomer | 6.16 | 0.00003 | ↑↑↑↑ |
| game and gamification | game, player, playing, violent, garner, multiplayer, in-game, role-playing, warcraft, gameplay | 5.68 | 0 | ↑↑↑↑ |
Note: full names of abbreviations (tam: technology acceptance model, ewom: electronic word-of-mouth, fb: facebook, fomo: fear of missing out, sns: social networking sites, cscl: computer-supported collaborative learning, srl: self-regulated learning, asd: autism spectrum disorder, mmpi: minnesota multiphasic personality inventory, im: instant messengers, ict: information and communication technology, efl: english as a foreign language). ↑(↓): increasing (decreasing) trend but not significant (p > 0.05);↑↑↑(↓↓↓), ↑↑↑↑(↓↓↓↓): significantly increasing (decreasing) trend (p < 0.05, p < 0.01, and p < 0.001, respectively).
Table 3.
Top countries/regions.
| C/R | H | C (R) | ACP | A1 (R) | A2 (R) | A3 (R) | A4 (R) |
|---|---|---|---|---|---|---|---|
| USA | 195 | 186,721 (1) | 78.06 | 2392 (1) | 658 (1) | 1734 (1) | 785 (1) |
| UK | 95 | 33,588 (3) | 72.23 | 465 (2) | 98 (3) | 367 (2) | 233 (2) |
| Taiwan | 94 | 38,665 (2) | 88.89 | 435 (3) | 90 (4) | 345 (3) | 178 (4) |
| South Korea | 86 | 24,236 (5) | 73.89 | 328 (7) | 20 (12) | 308 (5) | 148 (6) |
| The Netherlands | 85 | 28,385 (4) | 77.13 | 368 (4) | 105 (2) | 263 (7) | 132 (7) |
| Germany | 79 | 20,658 (8) | 56.29 | 367 (5) | 66 (5) | 301 (6) | 165 (5) |
| China | 74 | 20,247 (9) | 60.80 | 333 (6) | 15 (15) | 318 (4) | 204 (3) |
| Spain | 74 | 21,409 (7) | 74.34 | 288 (8) | 25 (10) | 263 (7) | 109 (8) |
| Canada | 70 | 24,007 (6) | 98.79 | 243 (9) | 59 (6) | 184 (9) | 77 (10) |
| Australia | 64 | 14,784 (10) | 68.76 | 215 (10) | 42 (7) | 173 (10) | 107 (9) |
| Israel | 56 | 12,148 (11) | 97.18 | 125 (13) | 37 (8) | 88 (14) | 46 (16) |
| Turkey | 55 | 9623 (12) | 67.77 | 142 (11) | 16 (14) | 126 (11) | 73 (11) |
| Finland | 49 | 7403 (14) | 70.50 | 105 (14) | 11 (18) | 94 (13) | 61 (13) |
| Italy | 45 | 5613 (17) | 43.18 | 130 (12) | 12 (17) | 118 (12) | 69 (12) |
| Belgium | 42 | 6039 (16) | 57.51 | 105 (14) | 17 (13) | 88 (14) | 55 (14) |
| Hong Kong | 40 | 8094 (13) | 94.12 | 86 (17) | 7 (22) | 79 (17) | 50 (15) |
| Singapore | 37 | 6416 (15) | 71.29 | 90 (16) | 6 (23) | 84 (16) | 45 (17) |
| France | 36 | 3936 (21) | 46.86 | 84 (18) | 13 (16) | 71 (18) | 33 (20) |
| Switzerland | 35 | 4687 (19) | 74.40 | 63 (23) | 9 (19) | 54 (22) | 29 (22) |
| Malaysia | 34 | 3580 (22) | 62.81 | 57 (25) | 3 (29) | 54 (22) | 29 (22) |
Abbreviations: C/R: country/region; H: Hirsch index; C: citation count; ACP: average citations per article; A1, A2, A3, and A4: article counts of the periods 1985–2019, 1985–2009, 2010–2019, and 2016–2019.
Table 4.
Top institutions.
| Institutions | C/R | H | C (R) | ACP | A1 (R) | A2 (R) | A3 (R) | A4 (R) |
|---|---|---|---|---|---|---|---|---|
| Open University of Netherlands | The Netherlands | 46 | 10,379 (1) | 136.57 | 76 (3) | 33 (1) | 43 (10) | 15 (26) |
| Michigan State University | USA | 40 | 8122 (2) | 86.40 | 94 (1) | 14 (9) | 80 (1) | 36 (2) |
| Sungkyunkwan University | South Korea | 40 | 5129 (10) | 84.08 | 61 (8) | 5 (65) | 56 (5) | 10 (68) |
| Pennsylvania State University | USA | 37 | 5019 (11) | 64.35 | 78 (2) | 12 (12) | 66 (2) | 35 (3) |
| University of Twente | The Netherlands | 36 | 5334 (6) | 74.08 | 72 (4) | 28 (2) | 44 (9) | 13 (38) |
| Utrecht University | The Netherlands | 35 | 5208 (8) | 81.38 | 64 (6) | 19 (5) | 45 (7) | 21 (8) |
| University of Amsterdam | The Netherlands | 34 | 4575 (13) | 75.00 | 61 (8) | 10 (19) | 51 (6) | 27 (5) |
| Knowledge Media Research Center | Germany | 33 | 3165 (27) | 65.94 | 48 (12) | 12 (12) | 36 (13) | 4 (257) |
| Nanyang Technological University | Singapore | 32 | 5142 (9) | 81.62 | 63 (7) | 5 (65) | 58 (4) | 31 (4) |
| National Taiwan Normal University | Taiwan | 31 | 2775 (35) | 40.81 | 68 (5) | 6 (50) | 62 (3) | 40 (1) |
| The Ohio State University | USA | 31 | 6150 (5) | 116.04 | 53 (10) | 8 (27) | 45 (7) | 14 (32) |
| National Sun Yat-sen University | Taiwan | 30 | 4936 (12) | 105.02 | 47 (13) | 18 (7) | 29 (31) | 11 (55) |
| University of Texas at Austin | USA | 30 | 6935 (3) | 133.37 | 52 (11) | 9 (23) | 43 (10) | 17 (15) |
| Erasmus University Rotterdam | The Netherlands | 29 | 3800 (16) | 102.70 | 37 (24) | 7 (37) | 30 (26) | 11 (55) |
| Kent State University | USA | 28 | 3794 (17) | 99.84 | 38 (19) | 8 (27) | 30 (26) | 13 (38) |
| National Taiwan University of Science and Technology | Taiwan | 28 | 6542 (4) | 155.76 | 42 (16) | 8 (27) | 34 (16) | 15 (26) |
| University of Southern California | USA | 28 | 3458 (20) | 76.84 | 45 (14) | 9 (23) | 36 (13) | 17 (15) |
| Florida State University | USA | 27 | 3134 (28) | 78.35 | 40 (18) | 21 (4) | 19 (64) | 11 (55) |
| University of California, Santa Barbara | USA | 27 | 3322 (23) | 87.42 | 38 (19) | 8 (27) | 30 (26) | 12 (46) |
| University of Alabama-Tuscaloosa | USA | 26 | 3686 (18) | 102.39 | 36 (26) | 3 (118) | 33 (20) | 11 (55) |
Abbreviations: C/R: country/region; H: Hirsch index; C: citation count; ACP: average citations per article; A1, A2, A3, and A4: article counts of the periods 1985–2019, 1985–2009, 2010–2019, and 2016–2019.
Publisher’s Note: MDPI stays neutral with regard to jurisdictional claims in published maps and institutional affiliations. |
© 2021 by the authors. Licensee MDPI, Basel, Switzerland. This article is an open access article distributed under the terms and conditions of the Creative Commons Attribution (CC BY) license (https://creativecommons.org/licenses/by/4.0/).
Share and Cite
MDPI and ACS Style
Chen, X.; Zou, D.; Xie, H.; Cheng, G. A Topic-Based Bibliometric Review of Computers in Human Behavior: Contributors, Collaborations, and Research Topics. Sustainability 2021, 13, 4859. https://doi.org/10.3390/su13094859
AMA Style
Chen X, Zou D, Xie H, Cheng G. A Topic-Based Bibliometric Review of Computers in Human Behavior: Contributors, Collaborations, and Research Topics. Sustainability. 2021; 13(9):4859. https://doi.org/10.3390/su13094859
Chicago/Turabian StyleChen, Xieling, Di Zou, Haoran Xie, and Gary Cheng. 2021. "A Topic-Based Bibliometric Review of Computers in Human Behavior: Contributors, Collaborations, and Research Topics" Sustainability 13, no. 9: 4859. https://doi.org/10.3390/su13094859
Note that from the first issue of 2016, this journal uses article numbers instead of page numbers. See further details here.