Abstract
Oxidative stress and antioxidants play an important role in obesity etiopathology. Genetic variants, including single nucleotide polymorphisms (SNPs) of the antioxidant-related genes, may impact disease risk in several populations. This preliminary study aimed to explore the association of 12 SNPs related to superoxide dismutase (SOD), catalase (CAT), glutathione peroxidase (GPX), glutathione-S-transferase (GST), and nitric oxide synthase (NOS) genes with obesity susceptibility in a Saudi population. A total of 384 unrelated participants, including 154 (40.1%) obese individuals, were enrolled. TaqMan OpenArray Genotyping assays were used. Six SNPs were significantly more prevalent in obese cohorts: (1) GSTM1 rs1056806*C/T; (2) SOD1 rs2234694*A; (3) SOD2 rs4880*G; (4) SOD3 rs2536512*A; (5) GPX1 rs1800668*A; (6) NOS3 rs1799983*G. Four SNPs were associated with higher obesity risk under heterozygote and dominant models for GSTM1 rs1056806 (C/T), homozygote model for SOD2 rs4880 (A/G), and homozygote and recessive models for GPX1 rs1800668 (A/G). In contrast, SOD3 rs2536512 (A/G) were less likely to be obese under heterozygote and dominant models. The CGAG, CAAA, TGGG, and CGAG combined genotypes showed a higher risk of obesity. In conclusion, the present results suggest that oxidative-stress-related genetic determinants could significantly associate with obesity risk in the study population.
Keywords:
antioxidants-related genes; CAT; GPX; GST; NOS; SOD; obesity; single nucleotide polymorphism 1. Introduction
Obesity and overweight have grown to epidemic proportions resulting in more than 4 million individuals dying/year in 2017, according to the Global Burden of Disease Study [1]. The prevalence of these disorders continues to rise in developing and developed countries representing a growing public health problem of concern [2]. Accumulating evidence demonstrated that high body mass index (BMI) is a major risk factor for the disability-adjusted life years in the Saudi population due to the recent demographic changes with longer life expectancy and lifestyle changes resulting from rapid urbanization and industrialization [3,4,5,6].
A constellation of risk factors, including environmental and genetic ones, has been implicated in obesity etiopathology [7]. One of these factors is the oxidative stress that can induce obesity and the related comorbidities by promoting white adipose tissue deposition and food intake alteration [8]. A significant direct correlation has been observed between oxidative stress biomarkers and BMI [9]. Several in vitro studies reported that increased oxidative stress and the reactive oxygen species could augment adipocyte proliferation, differentiation, and growth [10,11,12] and control hunger and satiety behaviors [13]. Interestingly, there is a mutual relation between oxidative stress and obesity, as abnormal fat accumulation can elicit a pro-inflammatory and pro-oxidant state through various biochemical and cellular mechanisms [14,15].
The glutathione S-transferases (GSTs), which detoxify the endogenously formed electrophilic compounds, including the lipid peroxidation products, showed a white adipose tissue-specific downregulation [16]. Additionally, the antioxidant enzyme activities of glutathione peroxidase (GPx) and superoxide dismutase (SOD) were reported to be dysregulated in red blood cells and serum of obese individuals compared to controls [17,18,19,20,21,22]. Moreover, the activities of Cu-Zn and Mn-dependent SOD, GPx, and catalase (CAT) were significantly downregulated in the abdominal adipose tissue of ovariectomized metabolic syndrome female rat model (to mimic the postmenopausal status) when compared to metabolic syndrome group without receiving treatment or the group received external estrogens [23]. Dysregulated nitric oxide synthase (NOS) enzyme family expression was evident at the mRNA and protein levels in isolated fat cells and adipose tissue sections derived from obese male subjects versus non-obese individuals [24,25,26].
Several single nucleotide polymorphisms (SNPs) related to the antioxidant enzymes can impair enzyme activities with subsequent accumulation of reactive oxygen species associated with various diseases/disorders, including obesity [27,28,29].
The GSTs comprise three enzyme families, the most investigated being the cytosolic ones, which include seven classes, Alpha, Mu, Pi, Sigma, Theta, Omega, and Zeta, each encoded by a separate gene [16]. The GST Mu 1 (GSTM1) rs1056806 [C/T], GST theta 1 (GSTT1) rs17856199 [A/C], GST Pi 1 (GSTP1) rs1695 [A/G], and microsomal GST3 (mGST3) rs2065942 [C/T] variants of this family can impair the GSTs catalytic activities and are studied in multiple diseases, including obesity and related comorbidities [16,27].
The SOD gene family members are located on different chromosomes, “SOD1 on 21q22.11, SOD2 on 6q25.3, and SOD3 on 4p15.3–p15.1” are coding for the “intracellular CuZn-SOD (SOD1), mitochondrial Mn-SOD (SOD2), and extracellular EC-SOD (SOD3)” enzymes, respectively [30,31]. The SOD1 rs2234694 [A/C] is located at the third exon/intron splicing site, the SOD2 rs4880 [A/G] has been found to impact the “mitochondrial targeting peptide; MTP” domain of the enzyme [32], and the SOD3 rs2536512 [A/G] results in alanine substituted by threonine; collectively, they have been associated previously with obesity risk [29,33]. The promotor CAT rs7943316 [A/T] SNP (−21A/T) was associated with increased body fat (%), including the visceral one in the obese central Mexico population [34]. While the GPX gene cluster includes eight types (GPX1-8), the GPX1 and GPX4 variants were associated previously with obesity or related comorbidities [16,35]. The GPX1 mapped to chromosome 3p21.3 contains the polymorphism rs1800668 [G/A], which is likely to affect the encoded cytoplasmic enzyme’s activity [36]. Although the GPX4 rs713041 [C/T] variant, located in the 3’UTR, the mRNA region important for selenocysteine insertion, was not investigated with obesity, this polymorphism showed risk modulation for diabetic retinopathy and cardiovascular autonomic neuropathy in patients with type 1 diabetes [37,38].
Lastly, the NOS family consists of three members; endothelial NOS (eNOS/NOS3) reported to have an anti-obesogenic effect, the inducible NOS (iNOS/NOS2) that promotes insulin resistance, and the neuronal NOS (nNOS/NOS1) that appears to act as appetite regulator [39]. These three isozymes can impact obesity etiology through NO production that plays essential roles in regulating adiposity, energy expenditure, and insulin sensitivity [39,40]. The NOS2 rs2297518 [A/G] and NOS3 rs1799983 [G/T] genetic variations were associated with insulin resistance, obesity, and/or a higher BMI in several populations [41,42,43].
As the results of most genetic studies related to the polymorphisms mentioned above were inconsistent and mainly carried out in patients of European descent, the authors were interested in exploring the potential genetic association of the selected 12 SNPs with obesity in a sample of the Middle Eastern population and relating the different genotypes with the available clinic-laboratory data.
2. Materials and Methods
2.1. Subjects
This case-control study enrolled a total of 384 adult unrelated Saudi individuals; 143 women and 241 men accounting for 37.2 and 62.8%, respectively. These subjects were recruited from Endocrinology and Diabetes center outpatient clinic, King Fahd Armed Forces Hospital (KFAFH), Jeddah, KSA during their routine check-up program. Subjects with complicated or severe diseases (e.g., stroke, diabetic complications, cardiac diseases, renal/hepatic disorders, psychiatric disorders, cancers) were excluded. Informed consent was obtained from all subjects before participating in the study. All the participants underwent a complete medical history and physical examinations. Anthropometric parameters, including weight and height, and arterial blood pressure (BP), were measured. Body mass index (BMI) was calculated “as weight (kg) divided by the square of height (m)”, and accordingly, obesity was defined from a BMI of ≥30 kg/m2 [4]. Hypertension was defined as stated previously [44]. Ethical approval was obtained from the institutional review board at the King Fahd Armed Forces Hospital (approval No. 201_19/04/2017), Jeddah, KSA.
2.2. Sample Collection and Laboratory Analysis
A total of ten milliliter peripheral blood samples were collected after an overnight fast (10–12 h) on two ethylenediaminetetraacetic acid tubes and one serum separator tube. The former tubes were sent for either the molecular analysis (4 mL) or glycated hemoglobin A1c (HbA1c; 3 mL) determination (VARIANT II TURBO Hb Testing System, Bio-Rad, Hercules, CA, USA). The last tube (3 mL) was centrifuged immediately at 3000 rpm × 12 min to separate the serum for other biochemical assays measurements, including serum glucose and lipid profile [total cholesterol (TC), high-density lipoprotein-cholesterol (HDL-C), and triacylglycerol (TG)] (Cobas c701, Roche Diagnostics, Indianapolis, IN, USA). As serum TG levels in all included samples were less than 4.5 mmol/L, the low-density lipoprotein-cholesterol (LDL-C) levels were calculated according to the Friedewald equation [45]. All abnormal lipid and lipoprotein profiles were justified by the National Cholesterol Education Program and Adult Treatment Panel III (NCEP-ATP III) guidelines [46]. A value less than the 50th percentile of HDL-C (i.e., <1.0 mmol/L) is considered a low level. Hypertriglyceridemia was specified at a fasting serum TG level of ≥1.7 mmol/L. Participants with dyslipidemia were defined as having an abnormal level of one or more lipid profiles, currently on lipid-lowering drugs, or having a history of a lipid disorder. Serum insulin levels were measured by Electrochemi-luminescence Immunoassay (Cobas e 602 immunoassay analyzer, Roche Diagnostics, Indianapolis, IN, USA).
2.3. SNP Selection and Genotyping
Based on (1) a dbSNP (www.ncbi.nlm.nih.gov; accessed on 28 October 2019) search for the SNP minor allele frequency (MAF) > 0.05 and (2) the previous literature that showed evidence of functional significance and association of the specified SNPs with obesity risk in various populations, the authors selected 12 variants related to GSTM1, GSTT1, GSTP1, MGST3, SOD1, SOD2, SOD3, CAT, GPX1, GPX4, NOS3, and NOS2 genes (Table S1). Genomic DNA was extracted from peripheral blood leukocytes using Roche MagNA Pure Compact Nucleic Acid-based Isolation Kit I (Catalog no. 03730964001; Roche Diagnostics GmbH, Mannheim, Germany) according to the manufacturer’s instructions. Nanodrop 2000/2000c Spectrophotometer V1.0 (Thermo Fisher Scientific, Wilmington, DE, USA) and gel electrophoresis were applied to evaluate the concentration and integrity of the extracted DNA, respectively. Amplification and allelic discrimination were performed in a GenaTi research center (King Abdulaziz University, King Fahad Medical Research Center) using Quant Studio 12K Flex Real-Time PCR System (Applied Biosystems, Foster City, CA, USA). Five microliters TaqMan GTXpress Master Mix (2×) (Cat no. 4403311, Applied Biosystems) were mixed with 0.5 μL TaqMan genotyping assay mix (20×), 2.5 μL nuclease-free water, and 2.0 μL gDNA (20 ng/μL) in a total reaction volume of 10 μL/sample. The genotyping assays ID and the ready-to-use primer, and probe sequences for the specified study variants are summarized in Table S1. The PCR program was run as follows: enzyme activation at 95 °C for 10 min followed by 40 cycles of denaturation at 95 °C for 15 s and annealing/extension at 60 °C for 1 min [47]. All the quality control measurements were followed in each run, including using the appropriate controls. About 10% of the samples were reassessed with a 100% recall rate supporting the genotyping efficiency.
2.4. Statistical Analysis
Data were analyzed using the R software version 4.0.2 (RStudio 3.0.1) and BM Statistical Package for the Social Sciences (SPSS) Statistics for Windows, version 26.0 (IBM Corp., Armonk, NY, USA). After testing the normality of the continuous variables, using the Shapiro–Wilk test, quantitative data were expressed as means ± standard deviation (normally distributed data) or median and interquartile range, while qualitative data were expressed as numbers and percentages. Two-sided Chi-square, Student-t, and ANOVA tests were used for parametric data, while Mann–Whitney U and Kruskal–Wallis tests were employed for non-parametric variables. Analysis of allele frequencies (number of copies of a specific allele divided by the total number of alleles in the group) and genotype frequencies (the number of each genotype divided by the total number of individuals within the group) was carried out [48]. Genotype frequencies were assessed for deviation from the Hardy–Weinberg equation (HWE) using an online excel sheet to compare observed versus expected values. A Chi-square test was used to check goodness-of-fit [49]. Single and polygenic SNP analyses were performed. Genotype combination analysis was performed to associate obesity using the online SNPStats software (www.snpstats.net, accessed on 18 July 2020) [50]. The relationship between allele frequencies and obesity was determined under different inheritance models with logistic regression analysis after adjustment for age and sex. Genetic association models included heterozygote comparison, homozygote comparison, dominant model, and recessive models [51]. Iteration of analysis was performed to test the association with the risk of obesity. Significant results in univariate analysis were plotted as a forest plot using STAT version 16.0 (StataCorp. 2019. Stata Statistical Software: Release 16. College Station, TX, USA: StataCorp LLC). Next, multivariable regression analysis was performed to include significant molecular markers from univariate analysis with clinical data and laboratory testing. The Hosmer–Lemeshow test was used to assess goodness-of-fit. Results were reported as odds ratio (OR) and 95% confidence interval (CI). Regression models were applied with genetic variants alone then repeated to integrate clinical and laboratory data [51]. Pearson’s correlation test was performed for genotype-genotype and genotype–phenotype correlation. Both clinical and laboratory findings were tested for their association with each polymorphism. The correlation matrix was plotted in R using RColorBrewer, ggpubr, tidyverse, Hmisc, and corrplot packages [52]. A p-value of <0.05 was considered statistically significant.
3. Results
3.1. Characteristics of Obese and Non-Obese Cohorts
Table 1 shows the clinic-laboratory characteristics of the study subjects. The study population’s mean age was 38.7 ± 15.5 years (ranged 23 to 83 years old). Of these, 154 subjects (40.1%) were obese. Obese cohorts were significantly older (41.49 ± 16.2 vs. 36.96 ± 14.7, p = 0.005). There was no significant difference in their sex (p = 0.10). However, they were more likely to have hypertension (20.1 vs. 11.7%, p = 0.029) and dyslipidemia (22.7 vs. 11.3%, p = 0.004). Laboratory testing showed higher levels of serum glucose (p = 0.003) and insulin (p = 0.006).

Table 1.
Clinical and biochemical characteristics of the study population.
3.2. Allelic Discrimination Analysis in Obese and Non-Obese Subjects
Table 2 summarizes allele and genotype frequencies of 12 genetic variants in obese and non-obese cohorts. Of these, six SNPs were significantly associated with development of obesity. (1) GSTM1 rs1056806*C/T heterozygosity was significantly more prevalent in obese cohorts (21 vs. 12%, p = 0.039); (2) SOD1 rs2234694*A allele was exclusively present in patients (100 vs. 97%, p = 0.048); (3) SOD2 rs4880*G allele was more common in obese cohorts (52 vs. 43%, p = 0.038); (4) SOD3 rs2536512*A allele was associated with obesity (56 vs. 51%, p < 0.001), similarly, A/A genotype was more frequent in patient group (36 vs. 23%, p = 0.033); (5) GPX1 rs1800668*A allele carriers were more representative in patients (25 vs. 19%, p = 0.041); (6) NOS3 rs1799983*G allele was more prevalent in obese group (83 vs. 75%, p = 0.029).
Table 2.
Association of gene variant panel with the risk of obesity.
3.3. Monogenic Risk of Obesity with Each Polymorphism
Inheritance association models revealed that four SNPs to have a prediction value for developing obesity, namely GSTM1 rs1056806 (C/T), SOD2 rs4880 (A/G), SOD3 rs2536512 (A/G), and GPX1 rs1800668 (A/G). GSTM1 rs1056806 showed a higher risk of obesity under heterozygote comparison (C/T vs. C/C: OR = 2.02, 95%CI = 1.15–3.55, p = 0.015) and dominant models (C/T-T/T vs. C/C: OR = 1.92, 95%CI = 1.11–3.31, p = 0.019). SOD2 rs4880 had higher odds of developing obesity under homozygote comparison model (G/G vs. A/A: OR = 1.97, 95%CI = 1.0–3.86, p = 0.045). GPX1 rs1800668 had an increased risk of obesity under homozygote comparison (G/G vs. A/A: OR = 2.65, 95%CI = 1.11–6.32, p = 0.048) and recessive models (G/G vs. A/A-A/G: OR = 2.63, 95%CI = 1.12–6.18, p = 0.024). In contrast, SOD3 rs2536512 carriers were less likely to be obese under heterozygote comparison (A/G vs. A/A: OR = 0.47, 95%CI = 0.26–0.83, p = 0.033) and dominant models (A/G-G/G vs. A/A: OR = 0.53, 95%CI = 0.31–0.91, p = 0.021) (Figure 1 and Table 2).
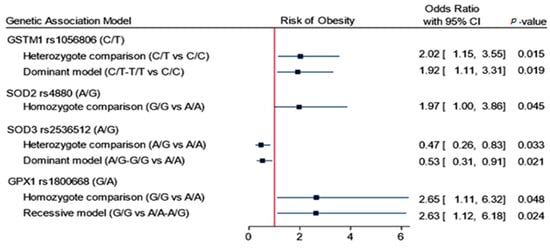
Figure 1.
Association of genetics variant panel with the risk of obesity. Data are presented as the odds ratio and 95% confidence interval (CI). p-value < 0.05 was considered as statistically significant. Binary logistic regression analysis was adjusted for age and sex.
3.4. Polygenic Risk of Obesity in Association with Gene Variants
Genotype combination analysis of GSTM1 rs1056806 (C/T), SOD2 rs4880 (A/G), SOD3 rs2536512 (A/G), and GPX1 rs1800668 (A/G) revealed four common combinations with higher risk of obesity; CGAG (OR = 6.15, 95%CI = 1.46–25.8, p = 0.014), CAAA (OR = 5.0, 95%CI = 1.23–20.3, p = 0.025), TGGG (OR = 3.25, 95%CI = 1.06–9.95, p = 0.040), and CGAG (OR = 2.95, 95%CI = 1.27–6.86, p = 0.012) (Table 3).
Table 3.
Genotype combination analysis of risk alleles for obesity.
3.5. Association of Gene Variants with Clinical and Biochemical Characteristics
Correlation analysis of the study gene variants with clinical and laboratory data is shown in Figure 2. Obesity was positively correlated with GSTM1 (r = 0.109, p = 0.035) and SOD2 (r = 0.121, p = 0.046). Serum LDL-C levels also showed weak positive correlation with SOD2 (r = 0.113, p = 0.047), and type 2 diabetes mellitus showed moderate correlation with NOS2 (r = 0.397, p < 0.001).
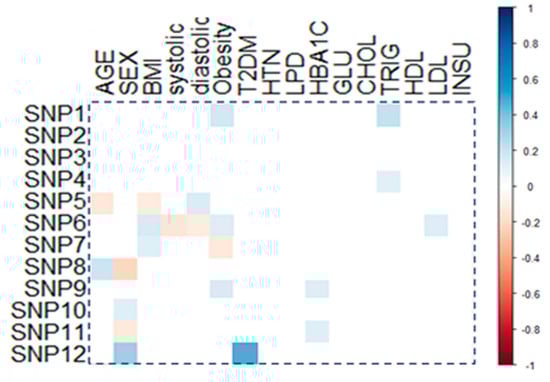
Figure 2.
Correlation of genetic variants with patients’ characteristics. Correlation between gene variants and demographic/clinic-laboratory characteristics. Pearson correlation was applied, and a significant correlation coefficient is only shown. BMI: body mass index; systolic: systolic blood pressure, diastolic: diastolic blood pressure; T2DM: type 2 diabetes mellitus, HTN: hypertension; LPD: hyperlipidemia, HbA1C: glycosylated hemoglobin, GLU: glucose; CHOL: total cholesterol, TRIG: triacylglycerol; HDL: high-density lipoprotein; LDLL: low-density lipoprotein; INSU: serum insulin; SNP1: GSTM1 rs1056806, SNP2: GSTT1 rs17856199, SNP3: GSTP1 rs1695, SNP4: MGST3 rs2065942, SNP5: SOD1 rs2234694, SNP6: SOD2 rs4880, SNP7: SOD3 rs2536512, SNP8: CAT rs7943316, SNP9: GPX1 rs1800668, SNP10: GPX4 rs713041, SNP11: NOS3 rs1799983, SNP12: NOS2 rs2297518.
4. Discussion
Oxidative-stress-related indices are reported to be associated with increased obesity risk and related comorbidities [10,15,53]. To the best of our knowledge, no studies have investigated the role of the selected 12 antioxidant-related SNPs collectively in the same obese/non-obese cohort. Preliminarily, the obese group in this study was older, had a higher frequency of dyslipidemia and hypertension, and had higher serum glucose and insulin levels than non-obese individuals. This reflects the typical clinical presentation of obesity and associated comorbidities. Several population surveys have shown that the obesity prevalence increases progressively from 20 to 60 years of age [54], and significant associations were reported between obesity and hyperglycemia [55], dyslipidemia [56], hyperinsulinemia [57], and hypertension [58].
In this study, we found that six SNPs were significantly more prevalent in obese cohorts: (1) GSTM1 rs1056806*C/T heterozygosity, (2) SOD1 rs2234694*A allele, (3) SOD2 rs4880*G allele, (4) SOD3 rs2536512*A allele, (5) GPX1 rs1800668*A allele, and (6) NOS3 rs1799983*G allele. Furthermore, four variants from these SNPs showed significant association with the risk of developing obesity under several genetic association models that will be detailed in the next sections.
Our enrichment analysis of the studied antioxidant enzymes revealed their implication in several obesity-related pathways and processes such as lipid metabolism/response to lipid processes and dysregulation of fatty acid metabolism [59], cellular biosynthetic process derangement [60], intracellular signal transduction regulation, response to oxidative stress [61], and regulation of blood pressure [62], as shown in Figure 3.
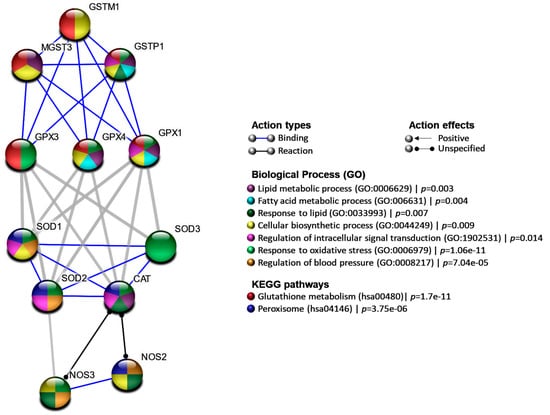
Figure 3.
Protein–protein interaction network. Nodes represented the genes colored according to the functional enrichment pathways and biological process, while edges showed interactions. STRING database version 11.0 was used.
As a member of phase II drug metabolism-related family catalyst, GSTM1 can detoxify the electrophilic products generated from lipid peroxidation that considers one of the major pathogenic cellular changes in obesity onset and progression [63]. Although Yang, [64] did not find an association of GSTM1 rs1056806 (c.528C > T) polymorphism with susceptibility of obesity in the Korean cohort (117 overweight/obese cases versus 125 non-overweight/obese subjects), a higher frequency of the heterozygous genotype was evident in the current obese subjects than non-obese. Furthermore, this synonymous variant (i.e., associated with no change to the encoded amino acid) showed a significant association with obesity risk under heterozygote comparison and dominant models. Previous estimates identified that 5–10% of human genes include at least one locus where synonymous variants could be harmful and impact protein conformation, expression, and/or function by affecting the post-transcriptional processing [65]. The later report highlighted the importance of including such types of variants in follow-up mechanistic and functional studies. The inconsistency observed between our finding and the previous Korean study may be attributable to the limited sample size, the different genotyping methodology, and different genetic backgrounds among the study population. This warrants work replication in large-scale studies with different ethnic populations to validate the findings.
The vital family of antioxidant catalysts in humans that neutralize the reactive oxygen species “superoxide anion” consists of three isozymes: Cu, Zn-dependent cytosolic SOD1, manganese-dependent mitochondrial SOD2, and Cu, Zn-dependent extracellular SOD3 [29,31]. The SOD1 rs2234694*A allele was more prevalent in the current obese cohort relative to non-obese individuals. This result agrees with Lewandowski et al., in which this variant could be associated with differences in SOD concentrations based on the obesity status [33]. A previous study found that patients with diabetes mellitus homozygous for the minor allele were characterized by a decline in the total SOD activity compared to their counterparts [66]. Additionally, SOD2 rs4880*G allele was more frequent in the current obese cohort than controls, and the GG genotype carriers had two-fold the risk to be obese versus the AA carriers. This finding was consistent with previous studies [33,67].
Interestingly, the activity of the mitochondrial SOD2 isozyme coded by this gene has been underscored in neutralizing the mitochondrial O2•−, preventing the uncoupler proteins hyperactivity that is induced by this reactive oxygen species in the context of obesity [68]. The rs4880 variant causes alanine to valine substitution, which was reported to be associated with conformational changes in the “mitochondrial targeting peptide” of the enzyme, which alters the importing efficiency and the enzyme catalytic activity in the mitochondrial matrix [69]. This type of substitution has also been associated with variability in SOD total activity, leptin, total cholesterol, and oxidative-stress-related biomarkers blood levels in obese/non-obese individuals [66,70]. This latter association can support the significant correlation this variant showed with LDL-C levels in the study cohort (Figure 2). Furthermore, in the present obese cohort, the GG genotype code for alanine showed increased odds of obesity than other genotype carriers. This means that higher enzyme activity could be associated with obesity risk. Under metabolic derangement, higher SOD2 isozyme activity might induce higher mitochondrial hydrogen peroxide (H2O2) accumulation associated with oxidative-stress-related insulin resistance, dyslipidemia, and unbalanced energy homeostasis, which characterize the obesity state [71,72]. Interestingly, adipocyte-targeted “SOD2 knockout mice” has prevented high-fat-diet-induced obesity and insulin resistance [73], supporting the present findings.
Otherwise, SOD3 rs2536512*A allele carriers in the present cohort were less likely to be obese under heterozygote comparison and dominant models. This variant causes alanine to threonine substitution at position 58 (Ala58Thr) in SOD3 isozyme, and “A-allele” was associated previously with higher SOD activity [74]. This could explain the protective role this allele displays in the present obese cohort. Although, to the authors’ knowledge, no previous study related this variant to the increased/decreased odds of obesity development, other studies have explored the role of this polymorphism with type 2 diabetes mellitus [75] and altered serum TG/HDL-C levels [71]. Originally SOD family was related to obesity due to “its protective role as an antioxidant”, and high SOD3 concentration/activity is expected to neutralize the high levels of the superoxide anion (O2•−) effectively [29,71]. This isozyme’s availability on the extracellular compartment and the endothelial cells add advantage to its action to neutralize (O2•−) generated in the extracellular matrix and discontinue the peroxynitrite generation [76]. This latter pro-oxidant was recently implicated in impaired “endothelium-dependent vasodilation”, one of the mediators of “obesity-induced hypertension” [77]. Additionally, supporting our findings, overexpression of SOD3 in adipose tissues in cases of diet-induced obesity was associated with blocking the development of obesity, fatty liver, and insulin resistance [78]. The latter investigators also found that even in the liver, increased SOD3 activity was associated with upregulation of the genes responsible for “energy expenditure”.
The cytosolic GPx1 enzyme is one of the most studied catalysts of the GPx family. Related variants to this SNP exist in the human population and modify GPx1 activity as reviewed in detail previously [16]. The 5’UTR GPX1 rs1800668*A allele was more prevalent in our obese cohort than non-obese one and showed association with obesity risk under homozygous comparison and recessive models. Although SNP does not impact the structure of the protein directly, the GG genotype carriers showed relatively higher GPx1 activity than GA or AA genotype carriers [36]. This variant was not associated with obesity risk previously, up to the authors’ knowledge, and it is the least studied antioxidant variant in association with different diseases [79]. However, given the essential roles that the encoded enzyme plays in the reduction in hydroperoxides of non-esterified polyunsaturated fatty acids [35], as well as regulation of “insulin sensitivity” and “obesity-induced insulin resistance” [80,81], it is not surprising that it is one of the obesity-related susceptibility SNPs that deserves work replication in other populations to confirm this finding.
Lastly, the NOS3 enzyme has been identified to play an essential role in lipolysis modulation, and obesity condition per se has profound effects on covalent modification of the NOS enzyme by insulin-dependent activation of protein kinase B [39]. The NOS3 rs1799983 (Glu298Asp) genetic variant may influence NOS3 expression and serum nitrate levels [82]. Our study results are consistent with MacKenzie and colleagues’ observation, in which the rs1799983GG genotype was frequently present in obese children, but the association with the disease did not reach statistical significance [83]. So far, various studies in other populations have explored the association between this variant and obesity risk [39,42,84,85]. Malhotra et al. reported that obese rs1799983*T allele carriers exhibited increased cardiac output and decreased NO metabolites during stress than non-obese participants [84]. In another study, the association between this variant and the diabetes risk was modified by BMI, with clear evidence of interactions between obesity and the rs1799983TT genotype [85]. Nasr et al. also observed a significant association of rs1799983*T allele with obesity and BMI in the Tunisian population [42]. Additionally, recently, Pawlik et al. reported a significant association of this variant with BMI and waist circumference in female patients with unstable angina [43]. Although in some studies, including ours, the rs1799983*G allele was more prevalent in the obese cohort than controls that differs from other studies in which the rs1799983*T allele was the risky one, previous reports have indicated interethnic differences in rs1799983 distribution and evidence for linkage disequilibrium with other SNPs exists among populations [86,87].
Apart from the variants discussed with obesity risk, there were no significant differences in the prevalence of other studied SNPs among the current groups. However, some variants showed a significant correlation(s) with the studied cohort’s laboratory parameters and/or associated comorbidities. For example, the NOS2 rs2297518 variant showed a significant correlation with diabetes mellitus (Figure 2). This missense variant (S608L), which is mapped in the catalytic domain of the enzyme [88], was reported to increase NOS2 activity and impact many disease prevalence [89]. This observation agrees with other genetic association studies on type 2 diabetes mellitus cohort in our lab [90] and in Caucasians [91].
Genotype combination analysis for the significantly associated four SNPs with the risk of obesity development in the present study revealed that four common combinations were identified to increase the odds of obesity. These combinations were CGAG (6-fold), CAAA (5-fold), TGGG (3-fold), and CGAG (2-fold). Recent evidence suggests that investigating multiple SNPs that increase susceptibility to obesity may predict the degree of risk for obesity and strategically contribute to weight-management programs [92,93]. Single SNP analysis is often underpowered due to the small effect size of individual SNP; however, the combined or additive effect of several variants from different loci have a larger effect size and, hence, greater predictive power, as evident in recent obesity studies [92,94,95].
Although the present study uncovered the association of antioxidants related to 12 SNPs collectively with obesity risk in a sample of the Middle Eastern population for the first time, having GWAS would offer further insight in future association studies. As a preliminary study, this work needs to be extended and validated on large-scale multicenter studies. The absence of functional studies to explore the studied variants’ impact on the encoded antioxidant enzyme levels/activities and other oxidative-stress-related biomarkers could limit this study. Additionally, given the high consanguinity rate in the Saudi population [96] and unavailability of the data related to this parameter in the present work, the potential effects of consanguinity with other genetic susceptibility variants on obesity risk should be considered.
Further functional studies with replication of the work in other ethnic populations are recommended to support the “ethnic-specific” genetic variations. Other supportive gene–gene and gene–environment studies are also recommended to expand the progress in this field.
5. Conclusions
The present findings confirmed the essential contribution of the studied oxidative-stress-related gene variants to obesity risk in the present population. This could help in the risk stratification of obese individuals in this region with other genetic and environmental determinants. Additionally, their encoded antioxidant enzymes could be promising targets for preventive and future individualized therapeutic strategies.
Supplementary Materials
The following is available online at https://www.mdpi.com/article/10.3390/antiox10040595/s1, Table S1: The ready-made assay probe sequences applied in the present study.
Author Contributions
Conceptualization, A.M.T.G. and S.Y.Q.; data curation, A.M.T.G. and S.Y.Q.; formal analysis, A.M.T.G. and E.A.T.; investigation, A.M.T.G. and E.M.A.; methodology, A.M.T.G.; resources, A.M.T.G. and E.M.A.; software, E.A.T.; supervision, S.Y.Q. and M.S.F.; validation, S.Y.Q., E.M.A., E.A.T. and M.S.F.; visualization, S.Y.Q. and E.A.T.; writing—original draft, A.M.T.G., E.M.A., E.A.T. and M.S.F.; writing—review and editing, S.Y.Q. and M.S.F. All authors have read and agreed to the published version of the manuscript.
Funding
This research received no external funding.
Institutional Review Board Statement
The study was conducted according to the Declaration of Helsinki’s guidelines and approved by the Institutional Review Board of the King Fahd Armed Forces Hospital (approval No. 201_19/04/2017), Jeddah, KSA.
Informed Consent Statement
Informed consent was obtained from all subjects involved in the study.
Data Availability Statement
All generated data in this study are included in the article and supplementary material.
Conflicts of Interest
The authors declare no conflict of interest.
References
- Dai, H.; Alsalhe, T.A.; Chalghaf, N.; Riccò, M.; Bragazzi, N.L.; Wu, J. The Global Burden of Disease Attributable to High Body Mass Index in 195 Countries and Territories, 1990-2017: An Analysis of the Global Burden of Disease Study. PLoS Med. 2020, 17, e1003198. [Google Scholar] [CrossRef]
- Williams, E.P.; Mesidor, M.; Winters, K.; Dubbert, P.M.; Wyatt, S.B. Overweight and Obesity: Prevalence, Consequences, and Causes of a Growing Public Health Problem. Curr. Obes. Rep. 2015, 4, 363–370. [Google Scholar] [CrossRef]
- Sherif, S.; Sumpio, B.E. Economic Development and Diabetes Prevalence in MENA Countries: Egypt and Saudi Arabia Comparison. World J. Diabetes 2015, 6, 304–311. [Google Scholar] [CrossRef]
- Al-Ghamdi, S.; Shubair, M.M.; Aldiab, A.; Al-Zahrani, J.M.; Aldossari, K.K.; Househ, M.; Nooruddin, S.; Razzak, H.A.; El-Metwally, A. Prevalence of Overweight and Obesity Based on the Body Mass Index; a Cross-Sectional Study in Alkharj, Saudi Arabia. Lipids Health Dis. 2018, 17, 134. [Google Scholar] [CrossRef] [PubMed]
- Azzeh, F.S.; Bukhari, H.M.; Header, E.A.; Ghabashi, M.A.; Al-Mashi, S.S.; Noorwali, N.M. Trends in Overweight or Obesity and other Anthropometric Indices in Adults Aged 18-60 Years in Western Saudi Arabia. Ann. Saudi. Med. 2017, 37, 106–113. [Google Scholar] [CrossRef] [PubMed]
- Fawzy, M.S.; AlSel, B.T.A. Association of Serum Uric Acid Levels with Components of Metabolic Syndrome: A Cross-Sectional Analysis in a Saudi Adult Population. Int. J. Biomed. 2020, 10, 457–466. [Google Scholar] [CrossRef]
- Fawzy, M.S.; Alhadramy, O.; Hussein, M.H.; Ismail, H.M.; Ismail, N.M.; Biomy, N.M.; Toraih, E.A. Functional and Structural Impact of ATP-Binding Cassette Transporter A1 R219K and I883M Gene Polymorphisms in Obese Children and Adolescents. Mol. Diagn. Ther. 2015, 19, 221–234. [Google Scholar] [CrossRef] [PubMed]
- Manna, P.; Jain, S.K. Obesity, Oxidative Stress, Adipose Tissue Dysfunction, and the Associated Health Risks: Causes and Therapeutic Strategies. Metab. Syndr. Relat. Disord. 2015, 13, 423–444. [Google Scholar] [CrossRef]
- Vincent, H.K.; Taylor, A.G. Biomarkers and Potential Mechanisms of Obesity-Induced Oxidant Stress in Humans. Int. J. Obes. 2006, 30, 400–418. [Google Scholar] [CrossRef]
- Furukawa, S.; Fujita, T.; Shimabukuro, M.; Iwaki, M.; Yamada, Y.; Nakajima, Y.; Nakayama, O.; Makishima, M.; Matsuda, M.; Shimomura, I. Increased Oxidative Stress in Obesity and its Impact on Metabolic Syndrome. J. Clin. Investig. 2004, 114, 1752–1761. [Google Scholar] [CrossRef]
- Lee, H.; Lee, Y.J.; Choi, H.; Ko, E.H.; Kim, J.W. Reactive Oxygen Species Facilitate Adipocyte Differentiation by Accelerating Mitotic Clonal Expansion. J. Biol. Chem. 2009, 284, 10601–10609. [Google Scholar] [CrossRef]
- Higuchi, M.; Dusting, G.J.; Peshavariya, H.; Jiang, F.; Hsiao, S.T.; Chan, E.C.; Liu, G.S. Differentiation of Human Adipose-Derived Stem Cells Into Fat Involves Reactive Oxygen Species and Forkhead box O1 Mediated Upregulation of Antioxidant Enzymes. Stem Cells Dev. 2013, 22, 878–888. [Google Scholar] [CrossRef]
- Horvath, T.L.; Andrews, Z.B.; Diano, S. Fuel Utilization by Hypothalamic Neurons: Roles for ROS. Trends Endocrinol. Metab. 2009, 20, 78–87. [Google Scholar] [CrossRef] [PubMed]
- Savini, I.; Catani, M.V.; Evangelista, D.; Gasperi, V.; Avigliano, L. Obesity-Associated Oxidative Stress: Strategies Finalized to Improve Redox State. Int. J. Mol. Sci 2013, 14, 10497–10538. [Google Scholar] [CrossRef] [PubMed]
- Čolak, E.; Pap, D. The Role of Oxidative Stress in the Development of Obesity and Obesity-Related Metabolic Disorders. J. Med. Biochem. 2021, 40, 1–9. [Google Scholar] [CrossRef]
- Picklo, M.J.; Long, E.K.; Vomhof-DeKrey, E.E. Glutathionyl Systems and Metabolic Dysfunction in Obesity. Nutr. Rev. 2015, 73, 858–868. [Google Scholar] [CrossRef] [PubMed]
- Ozata, M.; Mergen, M.; Oktenli, C.; Aydin, A.; Sanisoglu, S.Y.; Bolu, E.; Yilmaz, M.I.; Sayal, A.; Isimer, A.; Ozdemir, I.C. Increased Oxidative Stress and Hypozincemia in Male Obesity. Clin. Biochem. 2002, 35, 627–631. [Google Scholar] [CrossRef]
- Olusi, S.O. Obesity is an Independent Risk Factor for Plasma Lipid Peroxidation and Depletion of Erythrocyte Cytoprotectic Enzymes in Humans. Int. J. Obes. Relat. Metab. Disord. 2002, 26, 1159–1164. [Google Scholar] [CrossRef]
- Bełtowski, J.; Wójcicka, G.; Górny, D.; Marciniak, A. The Effect of Dietary-Induced Obesity on Lipid Peroxidation, Antioxidant Enzymes and Total Plasma Antioxidant Capacity. J. Physiol. Pharmacol. 2000, 51, 883–896. [Google Scholar]
- Lee, Y.S.; Kim, A.Y.; Choi, J.W.; Kim, M.; Yasue, S.; Son, H.J.; Masuzaki, H.; Park, K.S.; Kim, J.B. Dysregulation of Adipose Glutathione Peroxidase 3 in Obesity Contributes to Local and Systemic Oxidative Stress. Mol. Endocrinol. 2008, 22, 2176–2189. [Google Scholar] [CrossRef]
- Yang, X.; Deignan, J.L.; Qi, H.; Zhu, J.; Qian, S.; Zhong, J.; Torosyan, G.; Majid, S.; Falkard, B.; Kleinhanz, R.R.; et al. Validation of Candidate Causal Genes for Obesity that Affect Shared Metabolic Pathways and Networks. Nat. Genet. 2009, 41, 415–423. [Google Scholar] [CrossRef] [PubMed]
- Baez-Duarte, B.G.; Zamora-Ginez, I.; Mendoza-Carrera, F.; Ruiz-Vivanco, G.; Torres-Rasgado, E.; Gonzalez-Mejia, M.E.; Garcia-Zapien, A.; Flores-Martinez, S.E.; Perez-Fuentes, R. Serum Levels of Glutathione Peroxidase 3 in Overweight and Obese Subjects from Central Mexico. Arch. Med. Res. 2012, 43, 541–547. [Google Scholar] [CrossRef]
- Guerra, R.C.; Zuñiga-Muñoz, A.; Guarner Lans, V.; Díaz-Díaz, E.; Tena Betancourt, C.A.; Pérez-Torres, I. Modulation of the Activities of Catalase, cu-zn, mn Superoxide Dismutase, and Glutathione Peroxidase in Adipocyte from Ovariectomised Female Rats with Metabolic Syndrome. Int. J. Endocrinol. 2014, 2014, 175080. [Google Scholar] [CrossRef] [PubMed]
- Elizalde, M.; Rydén, M.; van Harmelen, V.; Eneroth, P.; Gyllenhammar, H.; Holm, C.; Ramel, S.; Olund, A.; Arner, P.; Andersson, K. Expression of Nitric Oxide Synthases in Subcutaneous Adipose Tissue of Non-Obese and Obese Humans. J. Lipid Res. 2000, 41, 1244–1251. [Google Scholar] [CrossRef]
- Rydén, M.; Elizalde, M.; van Harmelen, V.; Ohlund, A.; Hoffstedt, J.; Bringman, S.; Andersson, K. Increased Expression of eNOS Protein in Omental Versus Subcutaneous Adipose Tissue in Obese Human Subjects. Int. J. Obes. Relat. Metab. Disord. 2001, 25, 811–815. [Google Scholar] [CrossRef] [PubMed]
- Galvin, V.B.; Barakat, H.; Kemeny, G.; Macdonald, K.G.; Pories, W.J.; Hickner, R.C. Endothelial Nitric Oxide Synthase Content in Adipose Tissue from Obese and Lean African American and white American Women. Metabolism 2005, 54, 1368–1373. [Google Scholar] [CrossRef] [PubMed]
- Probst-Hensch, N.M.; Imboden, M.; Felber Dietrich, D.; Barthélemy, J.C.; Ackermann-Liebrich, U.; Berger, W.; Gaspoz, J.M.; Schwartz, J. Glutathione S-Transferase Polymorphisms, Passive Smoking, Obesity, and Heart Rate Variability in Nonsmokers. Environ. Health Perspect. 2008, 116, 1494–1499. [Google Scholar] [CrossRef]
- Afrand, M.; Bashardoost, N.; Sheikhha, M.H.; Afkhami-Ardekani, M. Association Between Glutathione S-Transferase GSTM1-T1 and P1 Polymorphisms with Metabolic Syndrome in Zoroastrians in Yazd, Iran. Iran. J. Public Health 2015, 44, 673–682. [Google Scholar]
- Lewandowski, Ł.; Kepinska, M.; Milnerowicz, H. The Copper-Zinc Superoxide Dismutase Activity in Selected Diseases. Eur. J. Clin. Investig. 2019, 49, e13036. [Google Scholar] [CrossRef]
- Zelko, I.N.; Mariani, T.J.; Folz, R.J. Superoxide Dismutase Multigene Family: A Comparison of the CuZn-SOD (SOD1), Mn-SOD (SOD2), and EC-SOD (SOD3) Gene Structures, Evolution, and Expression. Free Radic. Biol. Med. 2002, 33, 337–349. [Google Scholar] [CrossRef]
- Perry, J.J.; Shin, D.S.; Getzoff, E.D.; Tainer, J.A. The Structural Biochemistry of the Superoxide Dismutases. Biochim. Biophys Acta 2010, 1804, 245–262. [Google Scholar] [CrossRef]
- Kinnula, V.L.; Lehtonen, S.; Koistinen, P.; Kakko, S.; Savolainen, M.; Kere, J.; Ollikainen, V.; Laitinen, T. Two Functional Variants of the Superoxide Dismutase Genes in Finnish Families with Asthma. Thorax 2004, 59, 116–119. [Google Scholar] [CrossRef] [PubMed]
- Lewandowski, Ł.; Kepinska, M.; Milnerowicz, H. Alterations in Concentration/Activity of Superoxide Dismutases in Context of Obesity and Selected Single Nucleotide Polymorphisms in Genes. Int. J. Mol. Sci. 2020, 21, 5069. [Google Scholar] [CrossRef]
- Hernández-Guerrero, C.; Hernández-Chávez, P.; Romo-Palafox, I.; Blanco-Melo, G.; Parra-Carriedo, A.; Pérez-Lizaur, A. Genetic Polymorphisms in SOD (rs2070424, rs7880) and CAT (rs7943316, rs1001179) Enzymes Are Associated with Increased Body Fat Percentage and Visceral Fat in an Obese Population from Central Mexico. Arch. Med. Res. 2016, 47, 331–339. [Google Scholar] [CrossRef]
- Brigelius-Flohé, R.; Maiorino, M. Glutathione Peroxidases. Biochim. Biophys. Acta 2013, 1830, 3289–3303. [Google Scholar] [CrossRef] [PubMed]
- Najafi, M.; Ghasemi, H.; Roustazadeh, A.; Alipoor, B. Phenotype and Genotype Relationship of Glutathione Peroxidase1 (GPx1) and rs 1800668 Variant: The Homozygote Effect on Kinetic Parameters. Gene 2012, 505, 19–22. [Google Scholar] [CrossRef]
- Perez, R.V.; Machado, C.G.; Santos-Bezerra, D.P.; Admoni, S.N.; Patente, T.A.; Monteiro, M.B.; Cavaleiro, A.M.; Queiroz, M.S.; Nery, M.; Corrêa-Giannella, M.L. Allelic Variations in Genes Belonging to Glutathione System Increase Proliferative Retinopathy Risk in Type 1 Diabetes Individuals. Gene 2019, 703, 120–124. [Google Scholar] [CrossRef]
- Admoni, S.N.; Santos-Bezerra, D.P.; Perez, R.V.; Patente, T.A.; Monteiro, M.B.; Cavaleiro, A.M.; Parisi, M.C.; Moura Neto, A.; Pavin, E.J.; Queiroz, M.S.; et al. Glutathione Peroxidase 4 Functional Variant rs713041 Modulates the Risk for Cardiovascular Autonomic Neuropathy in Individuals with Type 1 Diabetes. Diab. Vasc. Dis. Res. 2019, 16, 297–299. [Google Scholar] [CrossRef] [PubMed]
- Sansbury, B.E.; Hill, B.G. Regulation of Obesity and Insulin Resistance by Nitric Oxide. Free Radic. Biol. Med. 2014, 73, 383–399. [Google Scholar] [CrossRef]
- Joost, H.-G.; Tschop, M.H. NO to Obesity: Does Nitric Oxide Regulate Fat Oxidation and Insulin Sensitivity? Endocrinology 2007, 148, 4545–4547. [Google Scholar] [CrossRef][Green Version]
- Chen, F.; Li, Y.M.; Yang, L.Q.; Zhong, C.G.; Zhuang, Z.X. Association of NOS2 and NOS3 Gene Polymorphisms with Susceptibility to Type 2 Diabetes Mellitus and Diabetic Nephropathy in the Chinese Han Population. IUBMB Life 2016, 68, 516–525. [Google Scholar] [CrossRef] [PubMed]
- Nasr, H.B.; Dimassi, S.; M’hadhbi, R.; Debbabi, H.; Kortas, M.; Tabka, Z.; Chahed, K. Functional G894T (rs1799983) Polymorphism and Intron-4 VNTR Variant of Nitric Oxide Synthase (NOS3) Gene are Susceptibility Biomarkers of Obesity Among Tunisians. Obes. Res. Clin. Pract. 2016, 10, 465–475. [Google Scholar] [CrossRef] [PubMed]
- Pawlik, A.; Błaszczyk, H.; Rać, M.; Maciejewska-Skrendo, A.; Safranow, K.; Dziedziejko, V. NOS3 Gene rs1799983 and rs2070744 Polymorphisms in Patients with Unstable Angina. J. Vasc. Res. 2020, 57, 136–142. [Google Scholar] [CrossRef] [PubMed]
- Whelton, P.K.; Carey, R.M.; Aronow, W.S.; Casey, D.E.; Collins, K.J.; Dennison Himmelfarb, C.; DePalma, S.M.; Gidding, S.; Jamerson, K.A.; Jones, D.W.; et al. 2017 ACC/AHA/AAPA/ABC/ACPM/AGS/APhA/ASH/ASPC/NMA/PCNA Guideline for the Prevention, Detection, Evaluation, and Management of High Blood Pressure in Adults: A Report of the American College of Cardiology/American Heart Association Task Force on Clinical Practice Guidelines. J. Am. Coll. Cardiol. 2018, 71, e127–e248. [Google Scholar] [CrossRef] [PubMed]
- Friedewald, W.T.; Levy, R.I.; Fredrickson, D.S. Estimation of the Concentration of Low-Density Lipoprotein Cholesterol in Plasma, Without Use of the Preparative Ultracentrifuge. Clin. Chem. 1972, 18, 499–502. [Google Scholar] [CrossRef] [PubMed]
- Health, N.I.O. ATP III Guidelines at-a-Glance Quick Desk Reference; NIH Publication: Bethesda, MD, USA, 2001; pp. 1–3305. [Google Scholar]
- Fawzy, M.S.; Ibrahiem, A.T.; AlSel, B.T.A.; Alghamdi, S.A.; Toraih, E.A. Analysis of Microrna-34a Expression Profile and rs2666433 Variant in Colorectal Cancer: A Pilot Study. Sci. Rep. 2020, 10, 16940. [Google Scholar] [CrossRef] [PubMed]
- Janssens, A.C.; Moonesinghe, R.; Yang, Q.; Steyerberg, E.W.; van Duijn, C.M.; Khoury, M.J. The Impact of Genotype Frequencies on the Clinical Validity of Genomic Profiling for Predicting Common Chronic Diseases. Genet. Med. 2007, 9, 528–535. [Google Scholar] [CrossRef] [PubMed]
- Haschenburger, J.K.; Spinelli, J.J. Assessing the Goodness-of-Fit of Statistical Distributions when Data are Grouped. Math. Geol. 2005, 37, 261–276. [Google Scholar] [CrossRef]
- Solé, X.; Guinó, E.; Valls, J.; Iniesta, R.; Moreno, V. SNPStats: A Web Tool for the Analysis of Association Studies. Bioinformatics 2006, 22, 1928–1929. [Google Scholar] [CrossRef]
- Horita, N.; Kaneko, T. Genetic Model Selection for a Case–Control Study and a Meta-Analysis. Meta. Gene. 2015, 5, 1–8. [Google Scholar] [CrossRef]
- Wei, T.; Simko, V.; Levy, M.; Xie, Y.; Jin, Y.; Zemla, J. Package’ Corrplot’. Statistician 2017, 56, e24. [Google Scholar]
- Găman, M.A.; Epîngeac, M.E.; Diaconu, C.C.; Găman, A.M. Evaluation of Oxidative Stress Levels in Obesity and Diabetes by the Free Oxygen Radical Test and Free Oxygen Radical Defence Assays and Correlations with Anthropometric and Laboratory Parameters. World J. Diabetes 2020, 11, 193–201. [Google Scholar] [CrossRef]
- Villareal, D.T.; Apovian, C.M.; Kushner, R.F.; Klein, S.; Nutrition, A.S.F.; NAASO, T.E.O.S. Obesity in Older Adults: Technical Review and Position Statement of the American Society for Nutrition and NAASO, The Obesity Society. Am. J. Clin. Nutr. 2005, 82, 923–934. [Google Scholar] [CrossRef]
- Martyn, J.A.; Kaneki, M.; Yasuhara, S. Obesity-Induced Insulin Resistance and Hyperglycemia: Etiologic Factors and Molecular Mechanisms. Anesthesiology 2008, 109, 137–148. [Google Scholar] [CrossRef] [PubMed]
- Klop, B.; Elte, J.W.; Cabezas, M.C. Dyslipidemia in Obesity: Mechanisms and Potential Targets. Nutrients 2013, 5, 1218–1240. [Google Scholar] [CrossRef] [PubMed]
- Kim, M.K.; Reaven, G.M.; Kim, S.H. Dissecting the Relationship Between Obesity and Hyperinsulinemia: Role of Insulin Secretion and Insulin Clearance. Obesity (Silver Spring) 2017, 25, 378–383. [Google Scholar] [CrossRef]
- Leggio, M.; Lombardi, M.; Caldarone, E.; Severi, P.; D’Emidio, S.; Armeni, M.; Bravi, V.; Bendini, M.G.; Mazza, A. The Relationship Between Obesity and Hypertension: An Updated Comprehensive Overview on Vicious Twins. Hypertens Res. 2017, 40, 947–963. [Google Scholar] [CrossRef] [PubMed]
- Morgan, A.; Mooney, K.; Mc Auley, M. Obesity and the Dysregulation of Fatty Acid Metabolism: Implications for Healthy Aging. Expert Rev. Endocrinol. Metab. 2016, 11, 501–510. [Google Scholar] [CrossRef] [PubMed]
- Tareen, S.H.K.; Adriaens, M.E.; Arts, I.C.W.; de Kok, T.M.; Vink, R.G.; Roumans, N.J.T.; van Baak, M.A.; Mariman, E.C.M.; Evelo, C.T.; Kutmon, M. Profiling Cellular Processes in Adipose Tissue during Weight Loss Using Time Series Gene Expression. Genes 2018, 9, 525. [Google Scholar] [CrossRef]
- Le Lay, S.; Simard, G.; Martinez, M.C.; Andriantsitohaina, R. Oxidative Stress and Metabolic Pathologies: From an Adipocentric Point of View. Oxid Med. Cell Longev. 2014, 2014, 908539. [Google Scholar] [CrossRef]
- Vávrová, L.; Kodydková, J.; Zeman, M.; Dušejovská, M.; Macášek, J.; Staňková, B.; Tvrzická, E.; Zák, A. Altered Activities of Antioxidant Enzymes in Patients with Metabolic Syndrome. Obes. Facts 2013, 6, 39–47. [Google Scholar] [CrossRef]
- Mattson, M.P. Roles of the Lipid Peroxidation Product 4-Hydroxynonenal in Obesity, the Metabolic Syndrome, and Associated Vascular and Neurodegenerative Disorders. Exp. Gerontol. 2009, 44, 625–633. [Google Scholar] [CrossRef] [PubMed]
- Yang, S.A. Lack of Association Between Glutathione s-Transferase Mu 1 (GSTM1) Gene Polymorphisms and Obesity. J. Exerc. Rehabil. 2017, 13, 608–612. [Google Scholar] [CrossRef]
- Sauna, Z.E.; Kimchi-Sarfaty, C. Understanding the Contribution of Synonymous Mutations to Human Disease. Nat. Rev. Genet. 2011, 12, 683–691. [Google Scholar] [CrossRef] [PubMed]
- Flekac, M.; Skrha, J.; Hilgertova, J.; Lacinova, Z.; Jarolimkova, M. Gene Polymorphisms of Superoxide Dismutases and Catalase in Diabetes Mellitus. BMC Med. Genet. 2008, 9, 30. [Google Scholar] [CrossRef] [PubMed]
- Montano, M.A.; Barrio Lera, J.P.; Gottlieb, M.G.; Schwanke, C.H.; da Rocha, M.I.; Manica-Cattani, M.F.; dos Santos, G.F.; da Cruz, I.B. Association Between Manganese Superoxide Dismutase (MnSOD) Gene Polymorphism and Elderly Obesity. Mol. Cell Biochem. 2009, 328, 33–40. [Google Scholar] [CrossRef]
- Echtay, K.S.; Murphy, M.P.; Smith, R.A.; Talbot, D.A.; Brand, M.D. Superoxide Activates Mitochondrial Uncoupling Protein 2 from the Matrix side. Studies Using Targeted Antioxidants. J. Biol. Chem. 2002, 277, 47129–47135. [Google Scholar] [CrossRef]
- Sutton, A.; Imbert, A.; Igoudjil, A.; Descatoire, V.; Cazanave, S.; Pessayre, D.; Degoul, F. The Manganese Superoxide Dismutase Ala16Val Dimorphism Modulates Both Mitochondrial Import and mRNA Stability. Pharm. Genom. 2005, 15, 311–319. [Google Scholar] [CrossRef] [PubMed]
- Becer, E.; Çırakoğlu, A. Association of the Ala16Val MnSOD Gene Polymorphism with Plasma Leptin Levels and Oxidative Stress Biomarkers in Obese Patients. Gene 2015, 568, 35–39. [Google Scholar] [CrossRef]
- Decharatchakul, N.; Settasatian, C.; Settasatian, N.; Komanasin, N.; Kukongviriyapan, U.; Intharaphet, P.; Senthong, V. Association of Genetic Polymorphisms in SOD2, SOD3, GPX3, and GSTT1 with Hypertriglyceridemia and Low HDL-C Level in Subjects with High Risk of Coronary Artery Disease. PeerJ 2019, 7, e7407. [Google Scholar] [CrossRef]
- Masschelin, P.M.; Cox, A.R.; Chernis, N.; Hartig, S.M. The Impact of Oxidative Stress on Adipose Tissue Energy Balance. Front. Physiol. 2019, 10, 1638. [Google Scholar] [CrossRef]
- Han, Y.H.; Buffolo, M.; Pires, K.M.; Pei, S.; Scherer, P.E.; Boudina, S. Adipocyte-Specific Deletion of Manganese Superoxide Dismutase Protects from Diet-Induced Obesity Through Increased Mitochondrial Uncoupling and Biogenesis. Diabetes 2016, 65, 2639–2651. [Google Scholar] [CrossRef] [PubMed]
- Dong, X.; Li, D.; Liu, H.; Zhao, Y. SOD3 and eNOS Genotypes are Associated with SOD Activity and NO. Exp. Ther. Med. 2014, 8, 328–334. [Google Scholar] [CrossRef] [PubMed][Green Version]
- Yang, Y.M.; Xie, X.R.; Jin, A.L. Genetic Polymorphisms in Extracellular Superoxide Dismutase Leu53Leu, Arg213Gly, and Ala40Thr and Susceptibility to Type 2 Diabetes Mellitus. Genet. Mol. Res. 2016, 15. [Google Scholar] [CrossRef]
- Stancill, J.S.; Happ, J.T.; Broniowska, K.A.; Hogg, N.; Corbett, J.A. Peroxiredoxin 1 Plays a Primary Role in Protecting Pancreatic β-Cells from Hydrogen Peroxide and Peroxynitrite. Am. J. Physiol. Regul. Integr. Comp. Physiol. 2020, 318, R1004–R1013. [Google Scholar] [CrossRef] [PubMed]
- Ottolini, M.; Hong, K.; Cope, E.L.; Daneva, Z.; Johnstone, S.R.; Isakson, B.; Sonkusare, S.K. Locally formed Peroxynitrite Inhibits Endothelial TRPV4 Channels and Elevates Blood Pressure in Obesity. FASEB J. 2020, 34, 1. [Google Scholar] [CrossRef]
- Cui, R.; Gao, M.; Qu, S.; Liu, D. Overexpression of Superoxide Dismutase 3 Gene Blocks High-Fat Diet-Induced Obesity, Fatty Liver and Insulin Resistance. Gene Ther. 2014, 21, 840–848. [Google Scholar] [CrossRef] [PubMed]
- Irfan, S.; Rani, A.; Sameem, M.; Nawaz, S.K.; Liaqat, I.; Arshad, M. Association of rs1800668 Polymorphism in Glutathione Peroxidase- 1 Gene and Risk of Rheumatoid Arthritis in Pakistani Population. Pak. J. Med. Sci. 2016, 32, 1204–1207. [Google Scholar] [CrossRef]
- Loh, K.; Deng, H.; Fukushima, A.; Cai, X.; Boivin, B.; Galic, S.; Bruce, C.; Shields, B.J.; Skiba, B.; Ooms, L.M.; et al. Reactive Oxygen Species Enhance Insulin Sensitivity. Cell Metab. 2009, 10, 260–272. [Google Scholar] [CrossRef]
- Merry, T.L.; Tran, M.; Stathopoulos, M.; Wiede, F.; Fam, B.C.; Dodd, G.T.; Clarke, I.; Watt, M.J.; Andrikopoulos, S.; Tiganis, T. High-Fat-Fed Obese Glutathione Peroxidase 1-Deficient Mice Exhibit Defective Insulin Secretion but Protection from Hepatic Steatosis and Liver Damage. Antioxid. Redox Signal. 2014, 20, 2114–2129. [Google Scholar] [CrossRef]
- Dosenko, V.E.; Zagoriy, V.Y.; Haytovich, N.V.; Gordok, O.A.; Moibenko, A.A. Allelic Polymorphism of Endothelial NO-Synthase Gene and its Functional Manifestations. Acta Biochim. Pol. 2006, 53, 299–302. [Google Scholar] [CrossRef] [PubMed]
- Wiltshire, E.J.; Peña, A.S.; MacKenzie, K.; Bose-Sundernathan, T.; Gent, R.; Couper, J.J. A NOS3 Polymorphism Determines Endothelial Response to Folate in Children with Type 1 Diabetes or Obesity. J. Pediatr. 2015, 166, 319–325.e311. [Google Scholar] [CrossRef] [PubMed]
- Malhotra, S.; Poole, J.; Davis, H.; Dong, Y.; Pollock, J.; Snieder, H.; Treiber, F. Effects of NOS3 Glu298Asp Polymorphism on Hemodynamic Reactivity to Stress: Influences of Ethnicity and Obesity. Hypertension 2004, 44, 866–871. [Google Scholar] [CrossRef] [PubMed]
- Bressler, J.; Pankow, J.S.; Coresh, J.; Boerwinkle, E. Interaction Between the NOS3 Gene and Obesity as a Determinant of Risk of Type 2 Diabetes: The Atherosclerosis Risk in Communities Study. PLoS ONE 2013, 8, e79466. [Google Scholar] [CrossRef]
- Tanus-Santos, J.E.; Desai, M.; Flockhart, D.A. Effects of Ethnicity on the Distribution of Clinically Relevant Endothelial Nitric Oxide Variants. Pharmacogenetics 2001, 11, 719–725. [Google Scholar] [CrossRef]
- Marroni, A.S.; Metzger, I.F.; Souza-Costa, D.C.; Nagassaki, S.; Sandrim, V.C.; Correa, R.X.; Rios-Santos, F.; Tanus-Santos, J.E. Consistent Interethnic Differences in the Distribution of Clinically Relevant Endothelial Nitric Oxide Synthase Genetic Polymorphisms. Nitric. Oxide 2005, 12, 177–182. [Google Scholar] [CrossRef]
- Dhillon, S.S.; Mastropaolo, L.A.; Murchie, R.; Griffiths, C.; Thöni, C.; Elkadri, A.; Xu, W.; Mack, A.; Walters, T.; Guo, C.; et al. Higher Activity of the Inducible Nitric Oxide Synthase Contributes to Very Early Onset Inflammatory Bowel Disease. Clin. Transl. Gastroenterol. 2014, 5, e46. [Google Scholar] [CrossRef]
- Qidwai, T.; Jamal, F. Inducible Nitric Oxide Synthase (iNOS) Gene Polymorphism and Disease Prevalence. Scand. J. Immunol. 2010, 72, 375–387. [Google Scholar] [CrossRef]
- Gusti, A.M.T.; Qusti, S.Y.; Bahijri, S.M.; Toraih, E.A.; Bokhari, S.; Attallah, S.M.; Alzahrani, A.; Alshehri, W.M.A.; Alotaibi, H.; Fawzy, M.S. Glutathione S-Transferase (GSTT1 rs17856199) and Nitric Oxide Synthase (NOS2 rs2297518) Genotype Combination as Potential Oxidative Stress-Related Molecular Markers for Type 2 Diabetes Mellitus. Diabetes Metab. Syndr. Obes. 2021, 14, 1385–1403. [Google Scholar] [CrossRef]
- Porojan, M.D.; Cătană, A.; Popp, R.A.; Dumitrascu, D.L.; Bala, C. The Role of NOS2A -954G/C and Vascular Endothelial Growth Factor +936C/T Polymorphisms in Type 2 Diabetes Mellitus and Diabetic Nonproliferative Retinopathy Risk Management. Ther. Clin. Risk Manag. 2015, 11, 1743–1748. [Google Scholar] [CrossRef]
- Shahid, S.U.; Hasnain, S. Use of a Gene Score of Multiple Low-Modest Effect Size Variants can Predict the Risk of Obesity Better than the Individual SNPs. Lipids Health Dis. 2018, 17, 155. [Google Scholar] [CrossRef]
- Hernández-Guerrero, C.; Parra-Carriedo, A.; Ruiz-de-Santiago, D.; Galicia-Castillo, O.; Buenrostro-Jáuregui, M.; Díaz-Gutiérrez, C. Genetic Polymorphisms of Antioxidant Enzymes CAT and SOD Affect the Outcome of Clinical, Biochemical, and Anthropometric Variables in People with Obesity Under a Dietary Intervention. Genes Nutr. 2018, 13, 1. [Google Scholar] [CrossRef] [PubMed]
- Tan, P.Y.; Mitra, S.R. The Combined Effect of Polygenic Risk from FTO and ADRB2 Gene Variants, Odds of Obesity, and Post-Hipcref Diet Differences. Lifestyle Genom. 2020, 13, 84–98. [Google Scholar] [CrossRef] [PubMed]
- Llanaj, E.; Pikó, P.; Nagy, K.; Rácz, G.; János, S.; Kósa, Z.; Fiatal, S.; Ádány, R. Applicability of Obesity-Related SNPs and Their Effect Size Measures Defined on Populations with European Ancestry for Genetic Risk Estimation Among Roma. Genes 2020, 11, 516. [Google Scholar] [CrossRef] [PubMed]
- Gosadi, I.M.; Goyder, E.C.; Teare, M.D. Investigating the Potential Effect of Consanguinity on Type 2 Diabetes Susceptibility in a Saudi Population. Hum. Hered. 2014, 77, 197–206. [Google Scholar] [CrossRef]


Publisher’s Note: MDPI stays neutral with regard to jurisdictional claims in published maps and institutional affiliations. |
© 2021 by the authors. Licensee MDPI, Basel, Switzerland. This article is an open access article distributed under the terms and conditions of the Creative Commons Attribution (CC BY) license (https://creativecommons.org/licenses/by/4.0/).