Article

Recovery of Gold from Ore with Potassium Ferrocyanide Solution under UV Light

1
School of Civil and Resource Engineering, University of Science and Technology, Beijing 100083, China
2
School of Energy and Environmental Engineering, University of Science and Technology, Beijing 100083, China
*
Author to whom correspondence should be addressed.
Minerals 2021, 11(4), 387; https://doi.org/10.3390/min11040387
Submission received: 1 March 2021 / Revised: 29 March 2021 / Accepted: 2 April 2021 / Published: 5 April 2021
(This article belongs to the Section Mineral Processing and Extractive Metallurgy)

Abstract

:
In this study, potassium ferrocyanide, a nontoxic cyanide precursor in dark and diffuse reflection environment, was applied as reagent for the leaching of gold. The free cyanide ions could gradually release from potassium ferrocyanide solution under the ultraviolet light. Orthogonal leaching experiments were performed in gold ore to analyze the effect of solution pH, potassium ferrocyanide dosage, and temperature in a potassium ferrocyanide solution system under UV light. Response surface methodology (RSM) was applied to explore the role of potassium ferrocyanide in gold leaching; optimized results showed that the gold recovery reached 67.74% in a high-alkaline environment at a 12.6 pH, 3.8 kg/t potassium ferrocyanide dosage, 62 °C, and irradiance of 10 mW·cm−2. The gold leaching kinetics were monitored by quartz crystal microbalance with dissipation (QCM-D) of potassium ferrocyanide solution. The results indicate that the gold extraction process could be divided into two stages: adsorption and leaching, and a rigid adsorption layer formed on the reaction surface. Furthermore, X-ray photoelectron spectroscopy (XPS) analysis of the gold sensor surface after leaching reaction showed that –C≡N appears on the gold sensor surface, and the gold is oxidized to form AuCN complexes.

1. Introduction

The hydrometallurgy is a main method of gold extraction. The leaching process as an important part of hydrometallurgy can be classified into three species depending on the different leaching conditions: under acid phase (pH < 3) with chlorine, thiourea [1], ferric chloride, and thiocyanate [2]; under neutral phase (pH within 5–9) with halogens [3] and thiosulfate [4]; and under the alkaline phase (pH > 10) with cyanide [5], sodium sulfide, ammonia [6], ammonia-cyanide, nitriles, and sulfur. Among them, thiosulfate leaching is the most potential method of gold leaching due to the low toxicity and high efficiency. The U.S. Bureau of Mines uses statistical experimental methods to determine the feasibility of thiosulfate leaching [7]. Up to 62% gold extraction rate can be obtained from the thiosulfate leaching of low-grade carbonaceous ore, and it has been successfully applied at Goldstrike mine, Nevada, of Barrick Gold Corp [8]. In addition, glycine leaching has the advantages of a simple process, stability in a wide Eh-pH range, easy recovery and nontoxicity, which attracted the interest of researchers. A new study shows the recovery of gold from oxidized ore in glycine alkaline solution is 85.1% under the condition of strong oxidation of potassium permanganate [9]. However, the basic phase cyanide is still the most widely used in industrial applications because of its mature technology, high selectivity, handy operation, and stable complexation to gold [5]. Meanwhile, disadvantages of cyanide leaching include long leaching time and poor adaptability towards Cu2+ and S2− [7].
Cyanide can be deadly in high concentrations, posing a serious health threat to a wide range of ecological entities [10]. With this limitation in mind, a nontoxic cyanide precursor, potassium ferrocyanide (PF), has been investigated. It could release free cyanide ions under the ultraviolet light but have the high stability of ferrous cyanide complex in diffuse light or in the darkness (acute toxicity test, LD50 = 1600–3200 mg/kg) [11]. PF solid is a product of the coal chemical industry, and it is considered a nontoxic strong metal-cyanide complex, widely used in the pharmaceutical, chemical, and food industries [12,13].
Ferrous cyanogen ions have ionic activity in solutions. Already in 1952 [14], the stability of PF solution had been tested, and the results showed that it could decompose free cyanide ions under ultraviolet light, but a reverse reaction occurred after interrupting the illumination. The photodissociation of PF includes photo-oxidation and photo-aquation for ferrous hexacyanide in aqueous solution [15]. At present, photocatalytic treatment of ferrous cyanide complex in wastewater is one of the motivations for the utilization of PF. LA Betancourt-Buitrago [16] described a method of complexed cyanide recovery from synthetic mining wastewater by means of anoxic photocatalytic treatment using TiO2 and scavengers. It demonstrated that the photocatalytic decomposition of the ferricyanide was carried out by the photoreduction of the metal complex. Sergio Hanela [17] introduced a treatment system by UV ozone and modified zeolite to remove ferricyanide complex from wastewater, which achieved effective removal rate of iron (55%) and cyanide (68%).
The above are the applications of photocatalytics in PF solution to eliminate cyanide, but there have been few reports of applying dissociation of cyanide ions for the recovery of gold from gold ore. Recently, Weida D. Chen [18] demonstrated that a cumulative light sensor made of gold, which was a photochemical device to convert light signals into electrical signals and convert photons into free cyanide ions in the presence of PF solution. It inspired us to apply free cyanide ions released by PF solution to extract gold from gold ore. It could make reutilization of ferrous cyanide complex in wastewater and avoid the highly toxic dangers of cyanide in transport and preservation. Although the price of PF (1800 $/ton) is slightly higher than that of cyanide (1600 $/ton), PF solid has greater advantages in terms of transportation cost and safety cost due to the strong toxicity of cyanide. This paper provides a novel hydrometallurgical method for gold extraction with PF solution irradiated by UV light.

2. Experimental

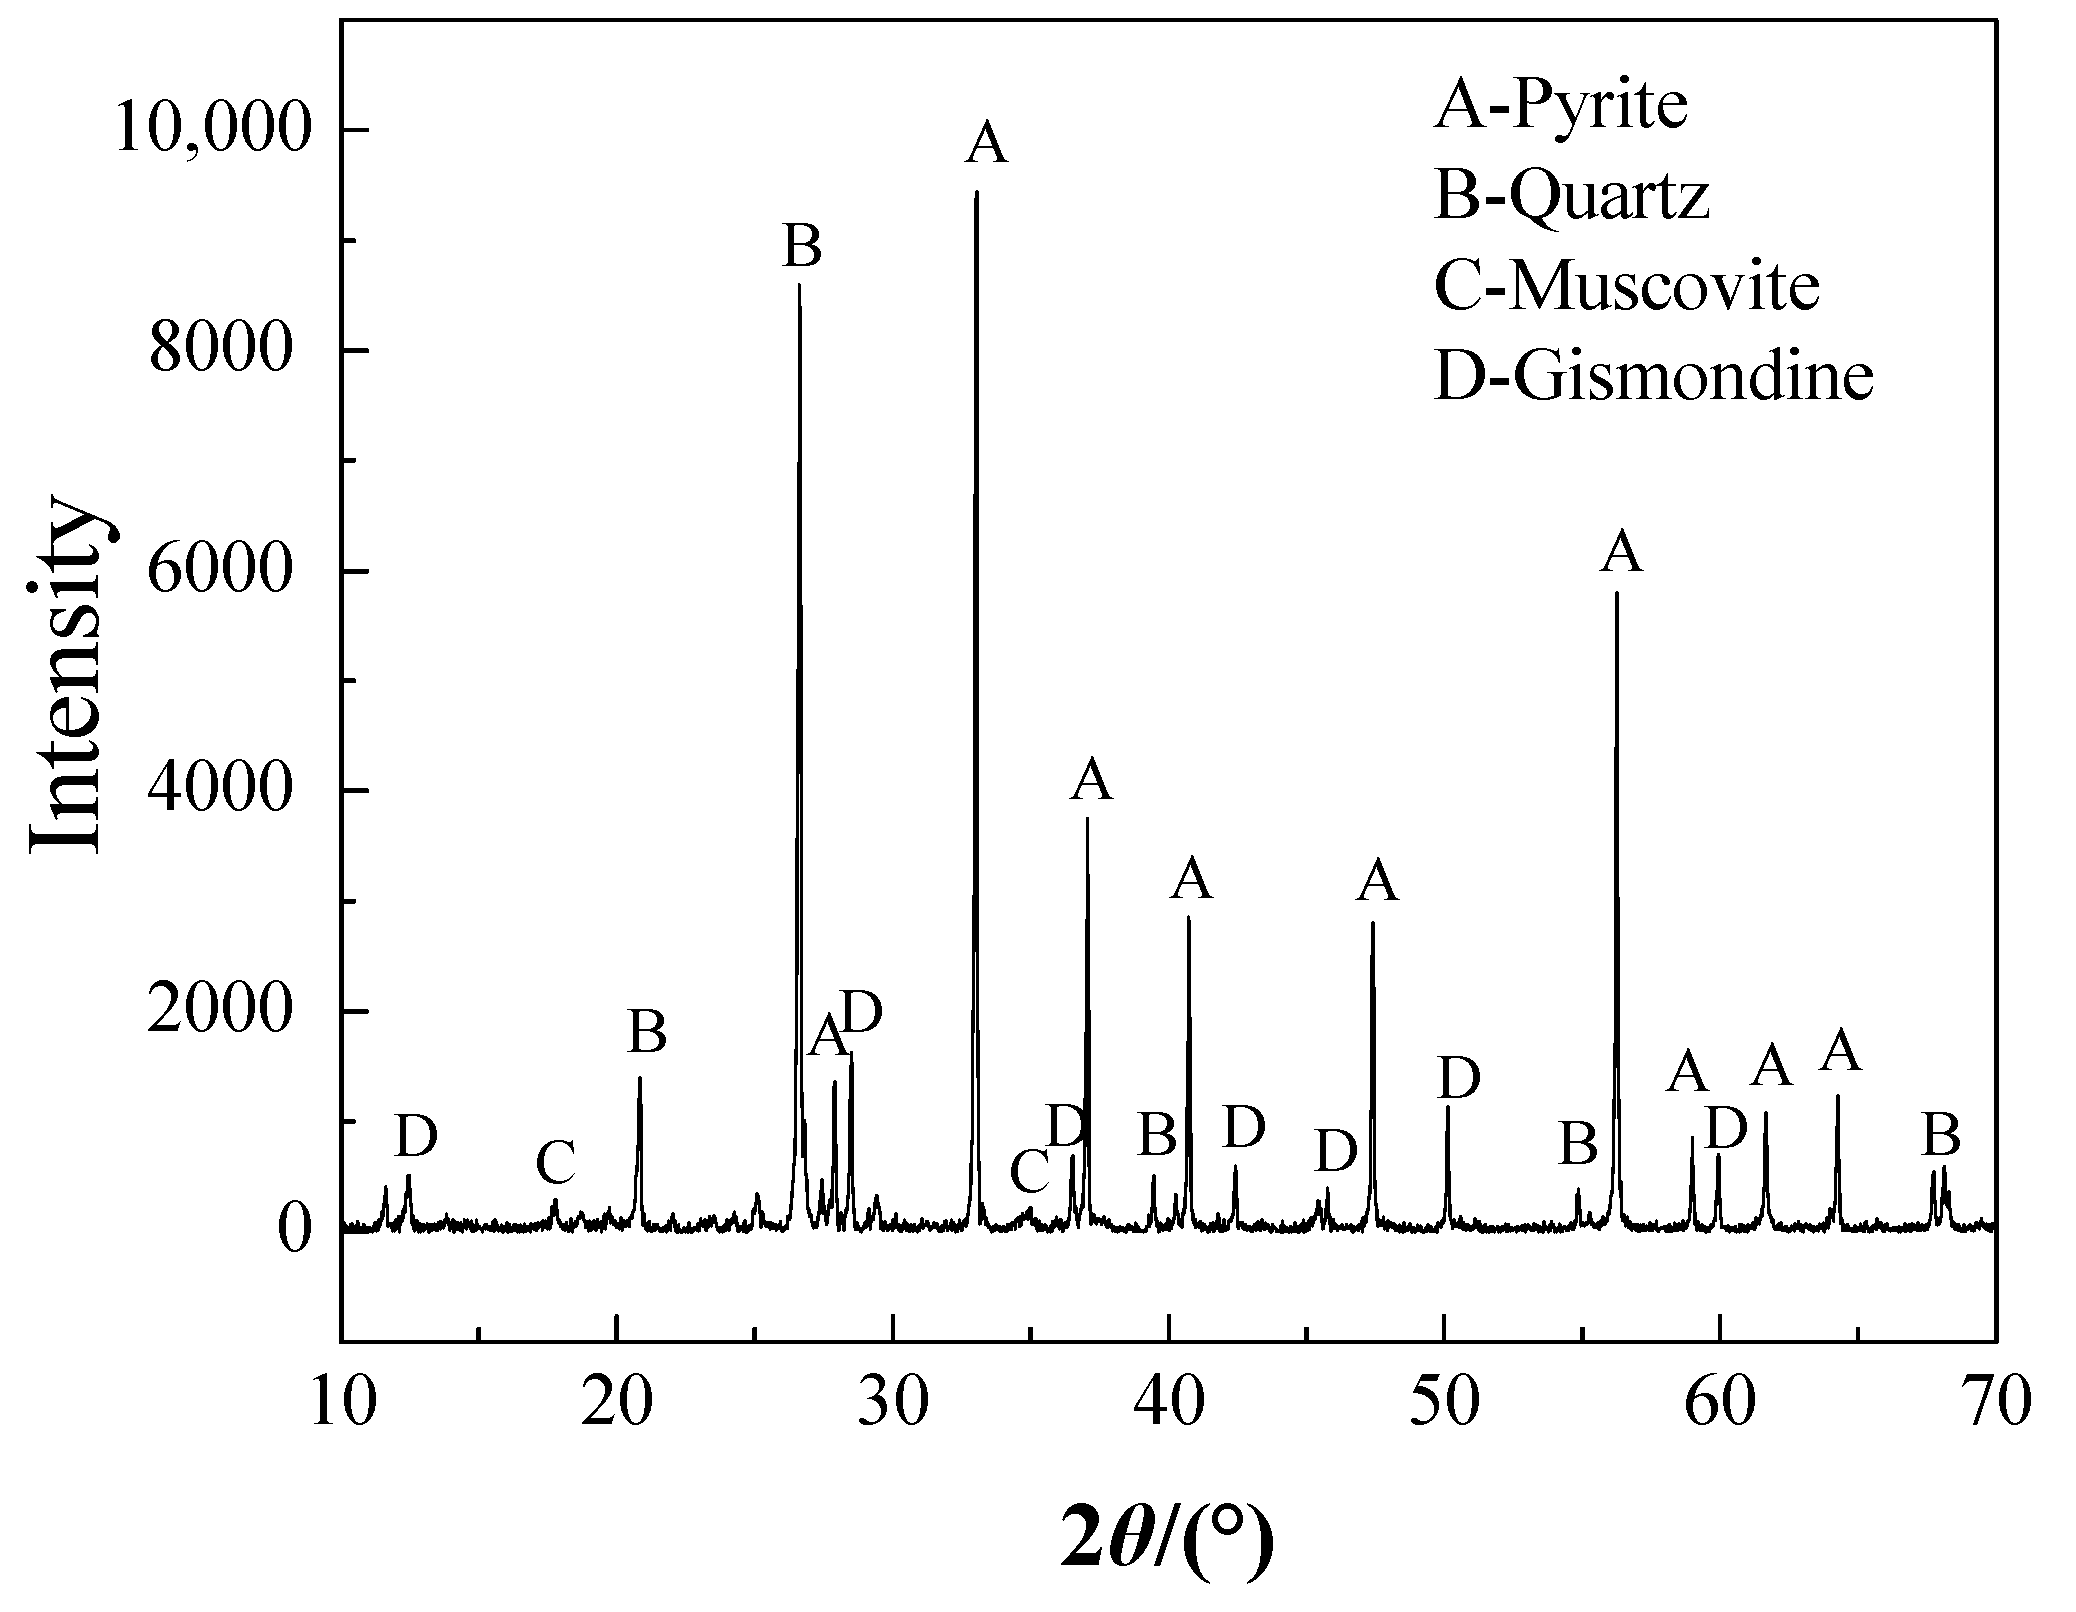
2.1. Materials and Reagents
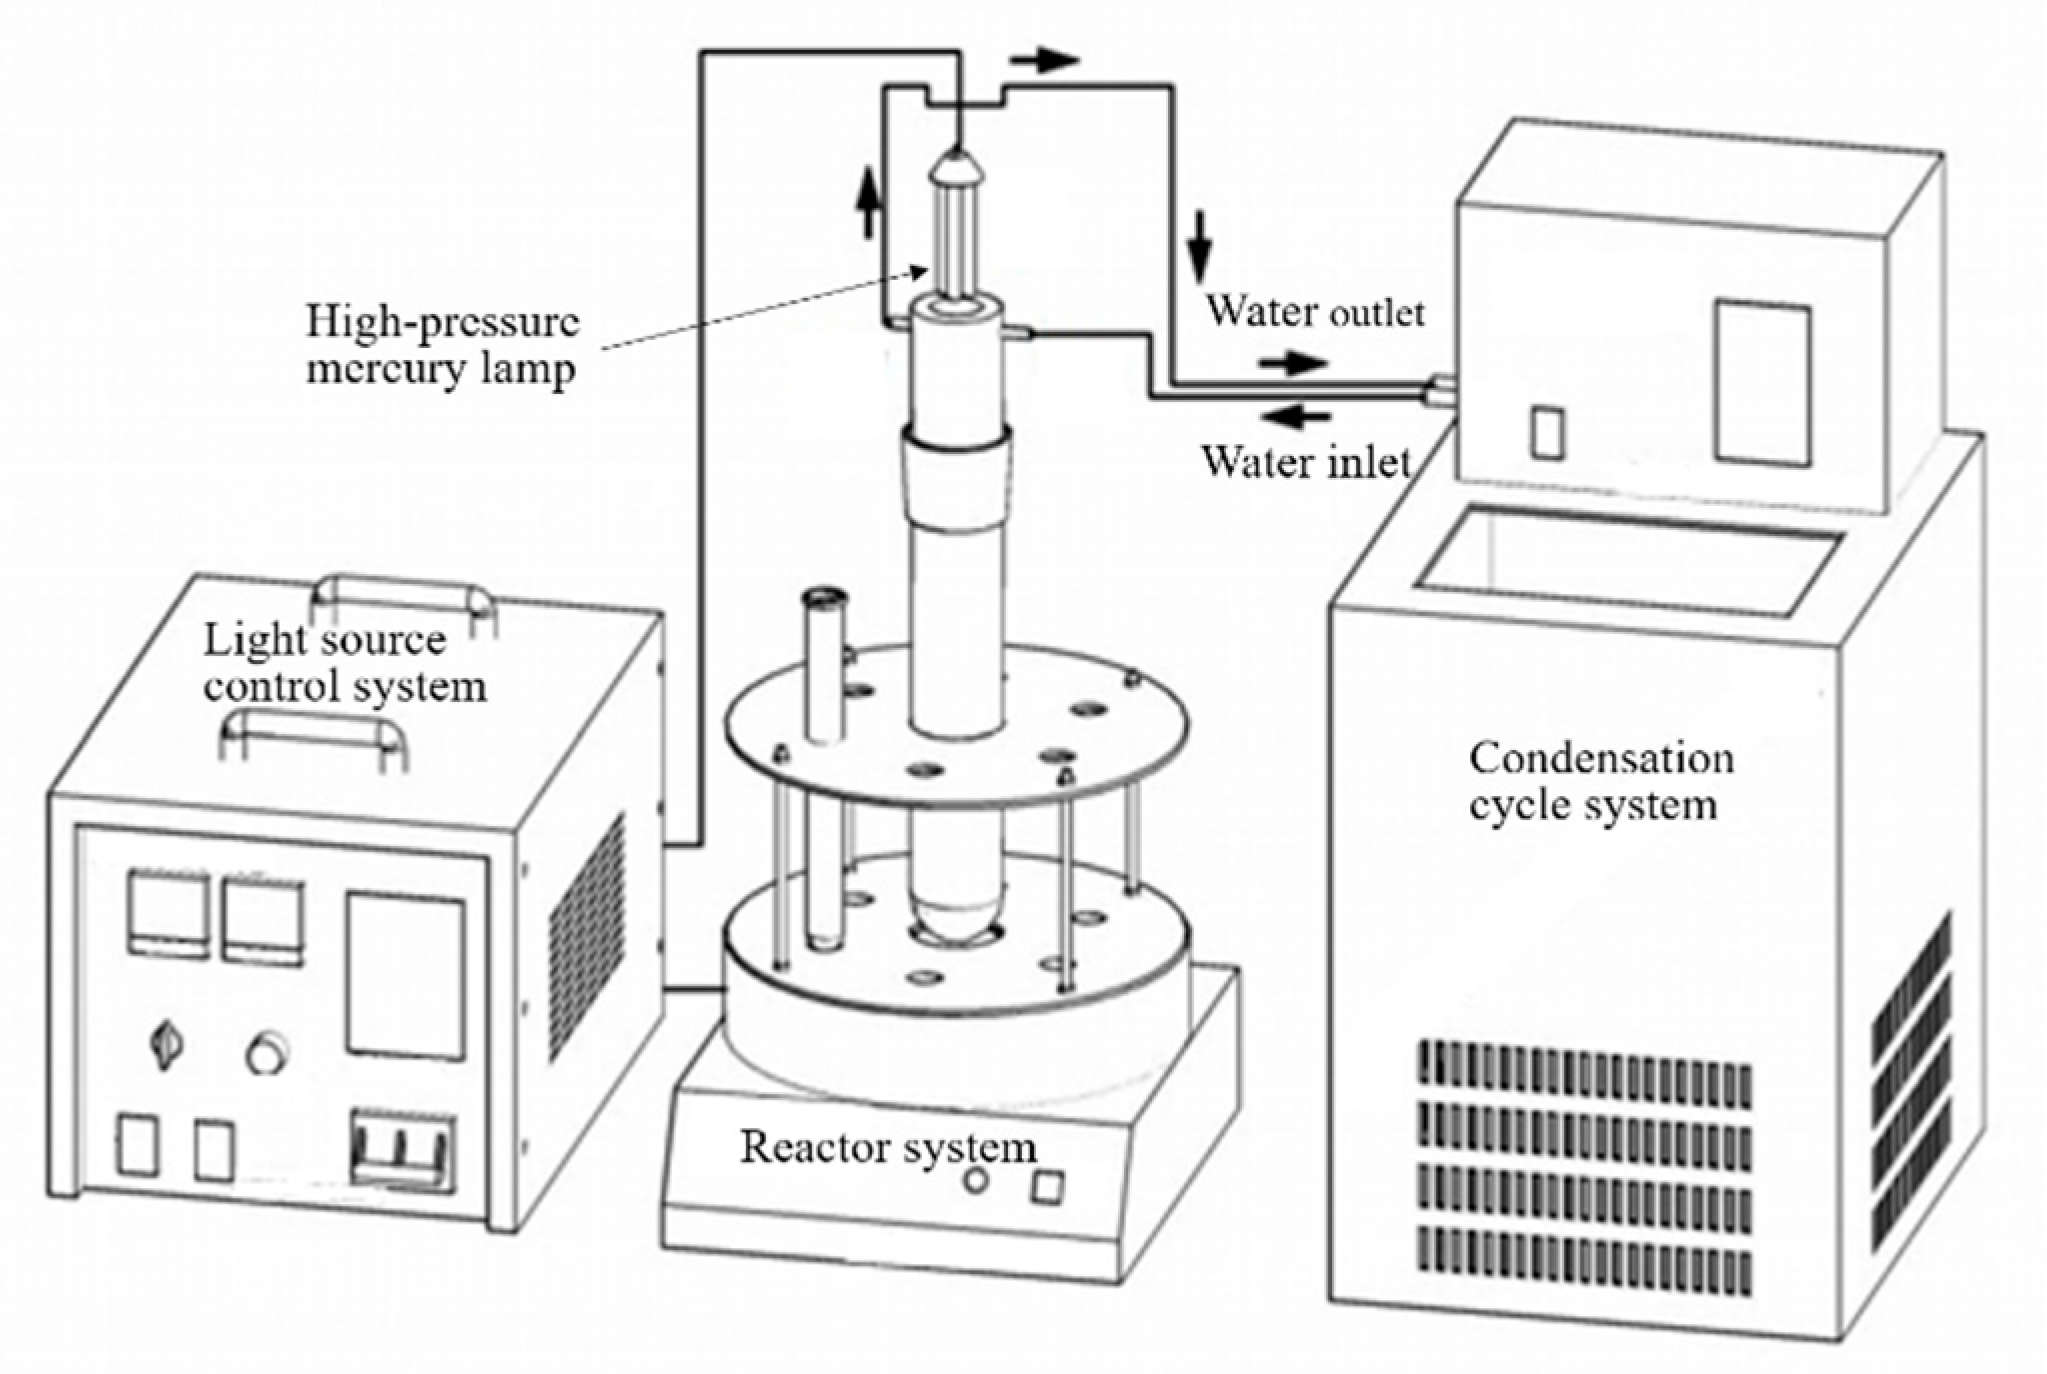
Gold concentrates from the flotation process at SQS (ShuangQiShan) Mining Industry, Quanzhou City, Fujian Province, China, were used as test samples for the experiments. The main chemical components of the test sample are shown in Table 1. The main valuable metals are gold and silver, with a grade of 56.78 g/t and 38.8 g/t, respectively. The X-ray powder diffraction (XRD) analysis was performed on a Rigaku-RA high power rotating anode X-ray diffractometer with Cu-Kα radiation (40 kV, 100 mA) at a scanning rate of 10° min, from 10° to 90°. The main mineral components are pyrite (FeS2), quartz (SiO2), muscovite (KAl2(AlSi3O10)(OH)2), and gismondine (CaAl2Si2O8·4(H2O)), as shown in Figure 1.
All experiments were performed with analytical grade reagents and deionized water. The solid PF trihydrate (K4Fe(CN)6·3H2O, ≥99.5%)and sodium hydroxide (NaOH, ≥99.5%) were purchased from XiLong SCIENTIFIC Co., Ltd (Shantou city, Guangdong province, China). The chemical structure of PF is shown in Figure 2. The PF solution was prepared by dissolving a known number of particles into deionized water, and its solubility curve is shown in Figure 3. The pH of the leaching system was adjusted by using 0.1 mol/L NaOH solution and measured by using a HQ30d-phc10103 (Hach Company, Loveland, CO, USA) portable pH meter.

2.2. Light Source

The photochemical system BL-GHX produced by BILON Co., Ltd (Shanghai, China) was shown in Figure 4. Illumination source was provided by a UVA high pressure mercury lamp with a peak emission at 365 nm. The spectral distribution and relative intensity of the high-pressure mercury lamp were shown in Table 2. For the photochemical reaction experiments, a 100 mL quartz test tube (diameter of 30 mm, height of 190 mm) was used as the photoreactor, which was placed 5 cm under the lamp. In addition, the system is equipped with a condensation cycle to cool the ultraviolet light source and adjust the reaction temperature. The irradiation intensity of incident light entering PF solution is adjusted by changing the current of the high-pressure mercury lamp in the reactor. Before the experiments, the irradiance corresponding to the current value of system was corrected quantitatively by using UVA-365 radiometer; the calibration results are shown in Figure 5.

2.3. Gold Ore Leaching Experimental Design

The gold leaching effect of the PF solution was investigated by a magnetic stirring system. The leaching tests were carried out in a 100 mL quartz test tube and the stirring frequency was set at 400 rpm. For each individual leaching test, 30 g of sample was leached for 24 h at a constant solid/liquid ratio of 1:3. In order to determine the optimal process parameters of gold leaching in PF solution under ultraviolet light, analysis experiments with three-factors and three-levels were designed using response surface methodology (RSM). All tests were carried out under ultraviolet irradiance of 10 mW·cm−2 high pressure mercury lamp. The results were analyzed using the Design Expert software. The experimental factors included initial pH (X1), PF dosage (X2), and leaching temperature (X3). As shown in Table 3, the ranges of X1, X2, and X3 were 11–13, 1–5 kg/t, and 45–75 °C, respectively, with central values of 12, 3 kg/t, and 60 °C, respectively. To avoid systematic errors, the sequence of experiments was set randomly. The obtained results were calculated by a quadratic equation to evaluate the coefficient of determination (R2), and statistically analyzed by analysis of variance (ANOVA).

2.4. Quartz Crystal Microbalance with Dissipation (QCM-D)

QCM-D is a real-time measuring instrument for surface reaction analysis. The main element of the QCM-D is a piezoelectric AT-cut quartz crystal between the metal film electrodes [20,21]. The quartz crystal produces mechanical deformation if an electric field is applied in the direction of the crystal polarization. Therefore, alternating currents can cause mechanical vibration on the quartz crystal, and crystal resonance occurs when the current frequency is the same as the crystal natural frequency [21]. The resonant frequency (Δf) of the quartz crystal varies with the mass (Δm) of the metal film electrode [22]. Through measuring changes in energy dissipation (ΔD), the surface property changes of quartz crystal become known. The Sauerbrey equation (Equation (1)) can describe the relationship between Δm and Δf [23].
Δ m = ρ q t q f 0 n Δ f = C Δ f n
where ρq is the density of the quartz crystal used as sensor; tq is the thickness of the quartz crystal; and n is the harmonic number, which is equal to 1, 3, 5, 7… (when n = 1, f0 = 5 MHz) [24]. The seventh overtone data was used in the plots for this study because it presented the lowest signal-to-noise ratio. The resonant frequency of the quartz crystal resonator changes linearly with the surface mass of the quartz crystal, and it decreases during the leaching process. The relationship is applicable to the corrosion process on the surface of coated quartz resonators [25]. Its mass sensitivity is 0.9 ng/cm2 in water [26]. The QCM-D measurement equipment was the Q-Sense E4 system (Biolin Scientific, Gothenburg, Sweden), shown in Figure 6. This system consists of three main parts: the chamber platform, which holds the sensor crystal modules; the electronics unit, which controls the sensor; and the software for data analysis [27].
The AT-Cut quartz crystal sensor was prepared with gold electrodes of 100 nm thickness as coat for the quartz crystals and a 5 nm chromium coat placed in the intermediate for enhanced adhesiveness. The fundamental frequency of the quartz crystal sensor was 5 MHz, as the f0 value mentioned above. Before the test, the sensors were cleaned with deionized water and dried with nitrogen. Limited by equipment conditions, the temperature was set at 30 °C which is the highest value of temperature-controlled chamber, and the flow rate of the leaching reagent was set to 50 μL/min in all experiments, unless otherwise specified.

3. Results and Discussion

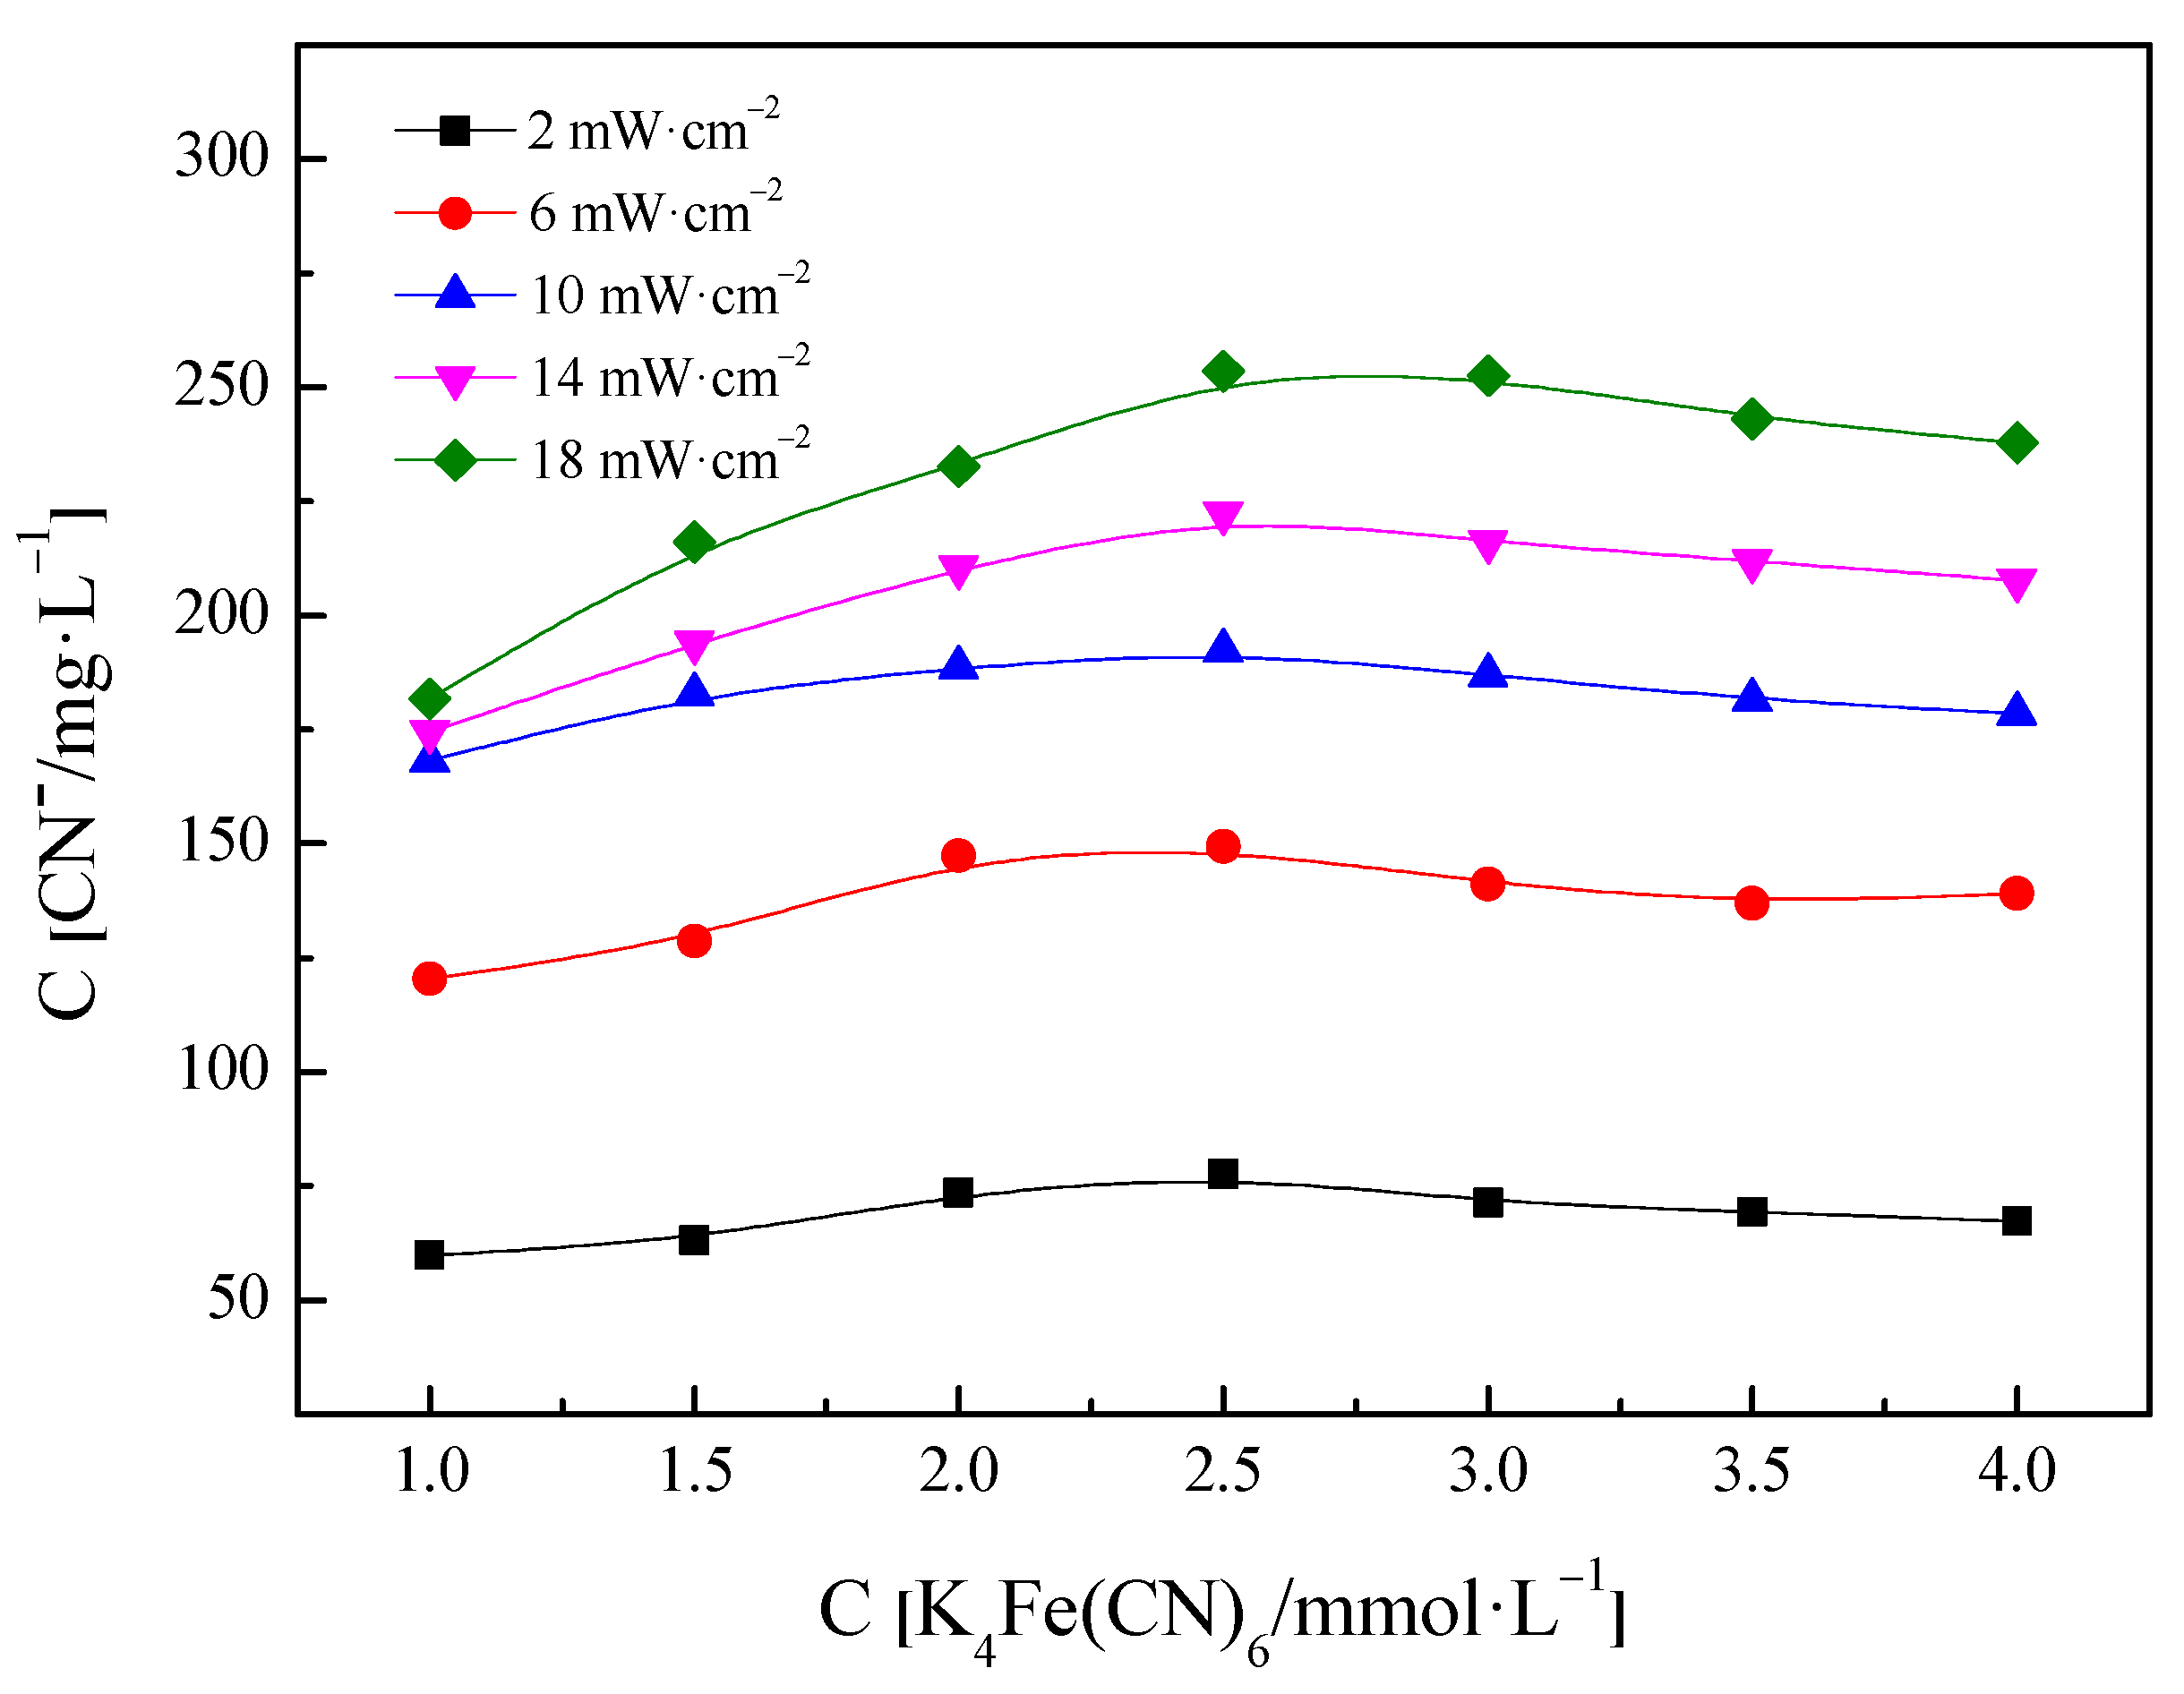
3.1. Decomposition of PF Solution under UV Light

In order to investigate the dependence of free cyanide ion decomposition on the concentration of PF and irradiation time, the first experiment was carried out by comparing the different concentration of PF solution at 0–100 mmol/L within 1 h. The results were shown in Figure 7. In addition, the effects of irradiation intensity on PF dissociation were observed by changing the current as shown in Figure 8. In the assay part, silver nitrate titration was selected to determine free cyanide concentrations in aqueous solutions.
For better comparison the effects of different reagent concentrations on cyanide ion release comprehensively, 10 mL solution were extracted every 15 min to detect its free cyanide ion concentration. The concentration of the free cyanide ion in solution is zero without ultraviolet irradiation, which is consistent with previous reports that the solution of PF is stable under dark or diffuse reflectance conditions. At different time intervals, PF undergoes a sequential photolysis reaction under ultraviolet irradiation for a long time, gradually releasing free cyanogen ions. A novel phenomenon is that the free cyanide ion has saturation value in the range of 1–5 mmol/L and decreases when exceeding the concentration range. In order to determine the maximum concentration of free cyanide ions released from the solution, the interval between the concentration ranges was narrowed, as shown in Figure 7. We found that the release concentration of free cyanide ion in solution is the highest when the concentration of PF is 2.5 mmol/L at different time intervals, which shows that there is saturated PF concentration of free cyanide ion decomposition under UV light. At this point, the conversion rate of cyanide ions is 65.28%.
The effect of illumination intensity on the release of free cyanide ions from PF solution was investigated. The initial solution of different concentration reacted for 30 min under ultraviolet light in the irradiance range of 2–18 mW·cm−2. The determination of free cyanide ions in the solution was shown in Figure 8. The release of cyanide ions increases under every concentration condition with the increase in illumination power, which is due to the increase of photon release under high power conditions promoting more decomposition of PF molecules. In addition, with the increase of irradiance, the gradient of the increase of free cyanide ions in solution slowed down gradually, but the concentration of the maximum release of free cyanide ion did not change with the change of irradiance.

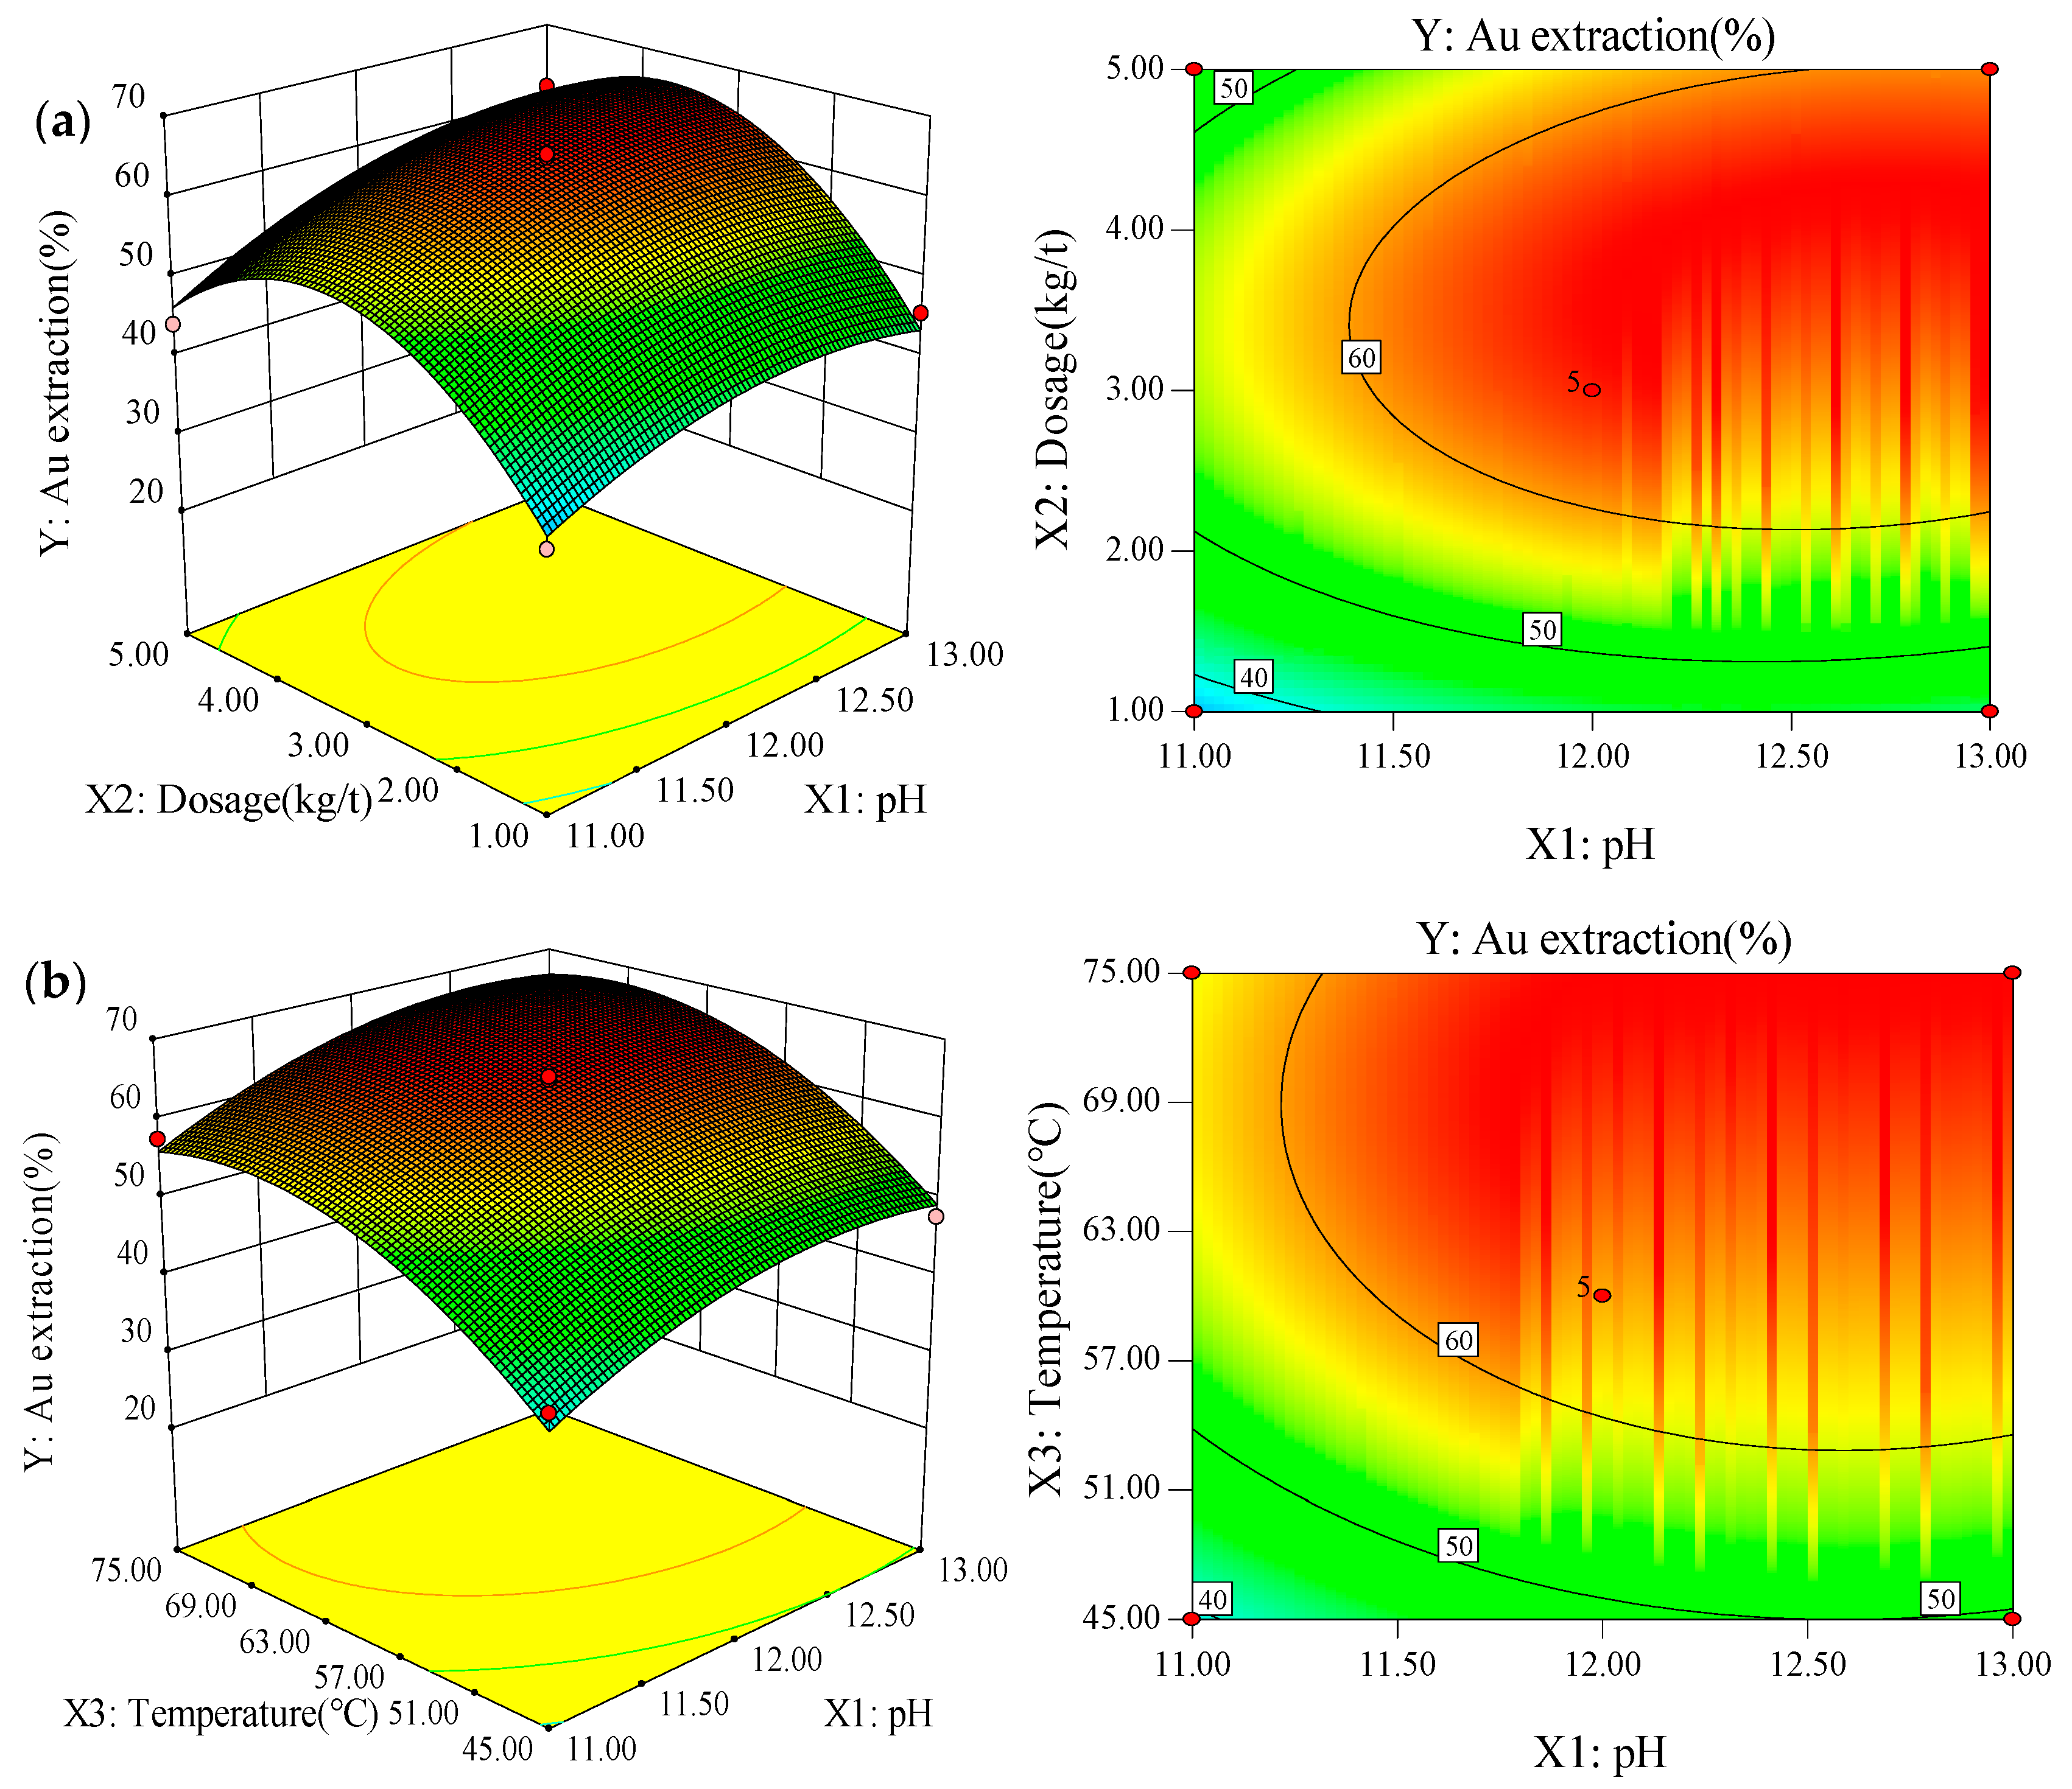
3.2. Box-Behnken Design and Response Surface Methodology

The influence of initial pH, PF dosage, leaching temperature and any two-way interactions between them on the extraction rate of gold under ultraviolet light were investigated using a multiple linear regression model. The experimental scheme was run for 17 combinations, and the results are shown in Table 4. All experiments were performed in triplicate. Fitting of the experimental data by regression analysis led to a second-order polynomial equation model (Equation (2)), as follows:
Y = 64.21 + 5.17X1 + 6.58X2 + 8.54X3 + 1.72X1X2 + 0.088X1X3 + 1.23X2X3 − 4.36X12 − 13.26X22 − 7.14X32
where Y was the predicted gold extraction rate; and X1, X2, and X3 were the code values of pH, PF dosage, and leaching temperature, respectively.
Table 5 shows the significance of the equation fitting, which was tested by ANOVA. The model yielded a coefficient of determination R2 of 0.9851 and the adjusted determination coefficient was 0.9660, which indicates that the model presented high significance. The F-value obtained from the F-test was 51.48, which implies that the model was adequate. The P-value was used to check the significance of the variables, and it reflected the interaction strength between each independent variable. The smaller the P-value, the more significant the corresponding variable [28]. The lack of fit F-value of 5.67 implies that the lack of fit was insignificant and the correlation between the variable and process response was sufficient.
The F-value was used to examine the statistical significance, and the model was evaluated for a P-value with a 95% confidence level. In the model, the values of P > F (<0.0001) indicated that the model terms were significant and the chance of model F-value noise was 0.01% (<5%). As shown in Table 5, the P-values for X2 and X3 were significantly lower than 5%, indicating that the PF dosage and temperature were more significant for the gold extraction rate than the other variables. In addition, the P-value for X1 was 0.0003, which suggested that the interaction strength to the gold extraction was strong. These three components (X1, X2, and X3) played a significant role in the gold extraction.
The interactions between these three components and their optimal level for gold extraction were further analyzed by RSM. The three-dimensional response surface presented by the Design-Expert 8.0 describes the interaction between the dual experimental factors and the extraction rate, whereas the other factor was held at the central level, as shown in Figure 9. All plots show relative peaks within the range of variables. The optimal extraction rate was determined based on the economic considerations and operational difficulty. Optimized results of RSM showed that, at a pH of 12.6, 3.8 kg/t PF dosage, and 62 °C, the optimal extraction of 67.74% was achieved. There was no clear extraction rate improvement when the pH and leaching temperature continuously increased. However, the reagent dosage had an optimal range, and the leaching effect deteriorates when the dosage is excessive. At this point, the amount of PF can be converted to a molar concentration of 2.64 mmol/L, which is consistent with the release law of cyanide ion under UV light.
In order to verify the reliability of RSM optimization, three sets of parallel leaching tests were conducted under the above optimal conditions. Comparison results of the test and predicted values are shown in Table 6. The gold leaching extraction was 67.01%, 67.47% and 67.33% respectively. The average gold leaching extraction is 67.27%, which shows that the experimental value is basically consistent with the predicted value and the error is only 0.69%. Additionally, the residual amount of cyanide ion in the pregnant solution was determined. As shown in the Table 6, the mean value of the free cyanide ion in the PF pregnant solution was 18.5 mg/L, which was lower than the free cyanide ion in the cyanide pregnant solution when the gold extraction was similar. The general regulatory threshold for cyanide emissions from mineral processing operation is 0.2 mg/L [29], and therefore the PF leaching solution still requires treatment before discharge.

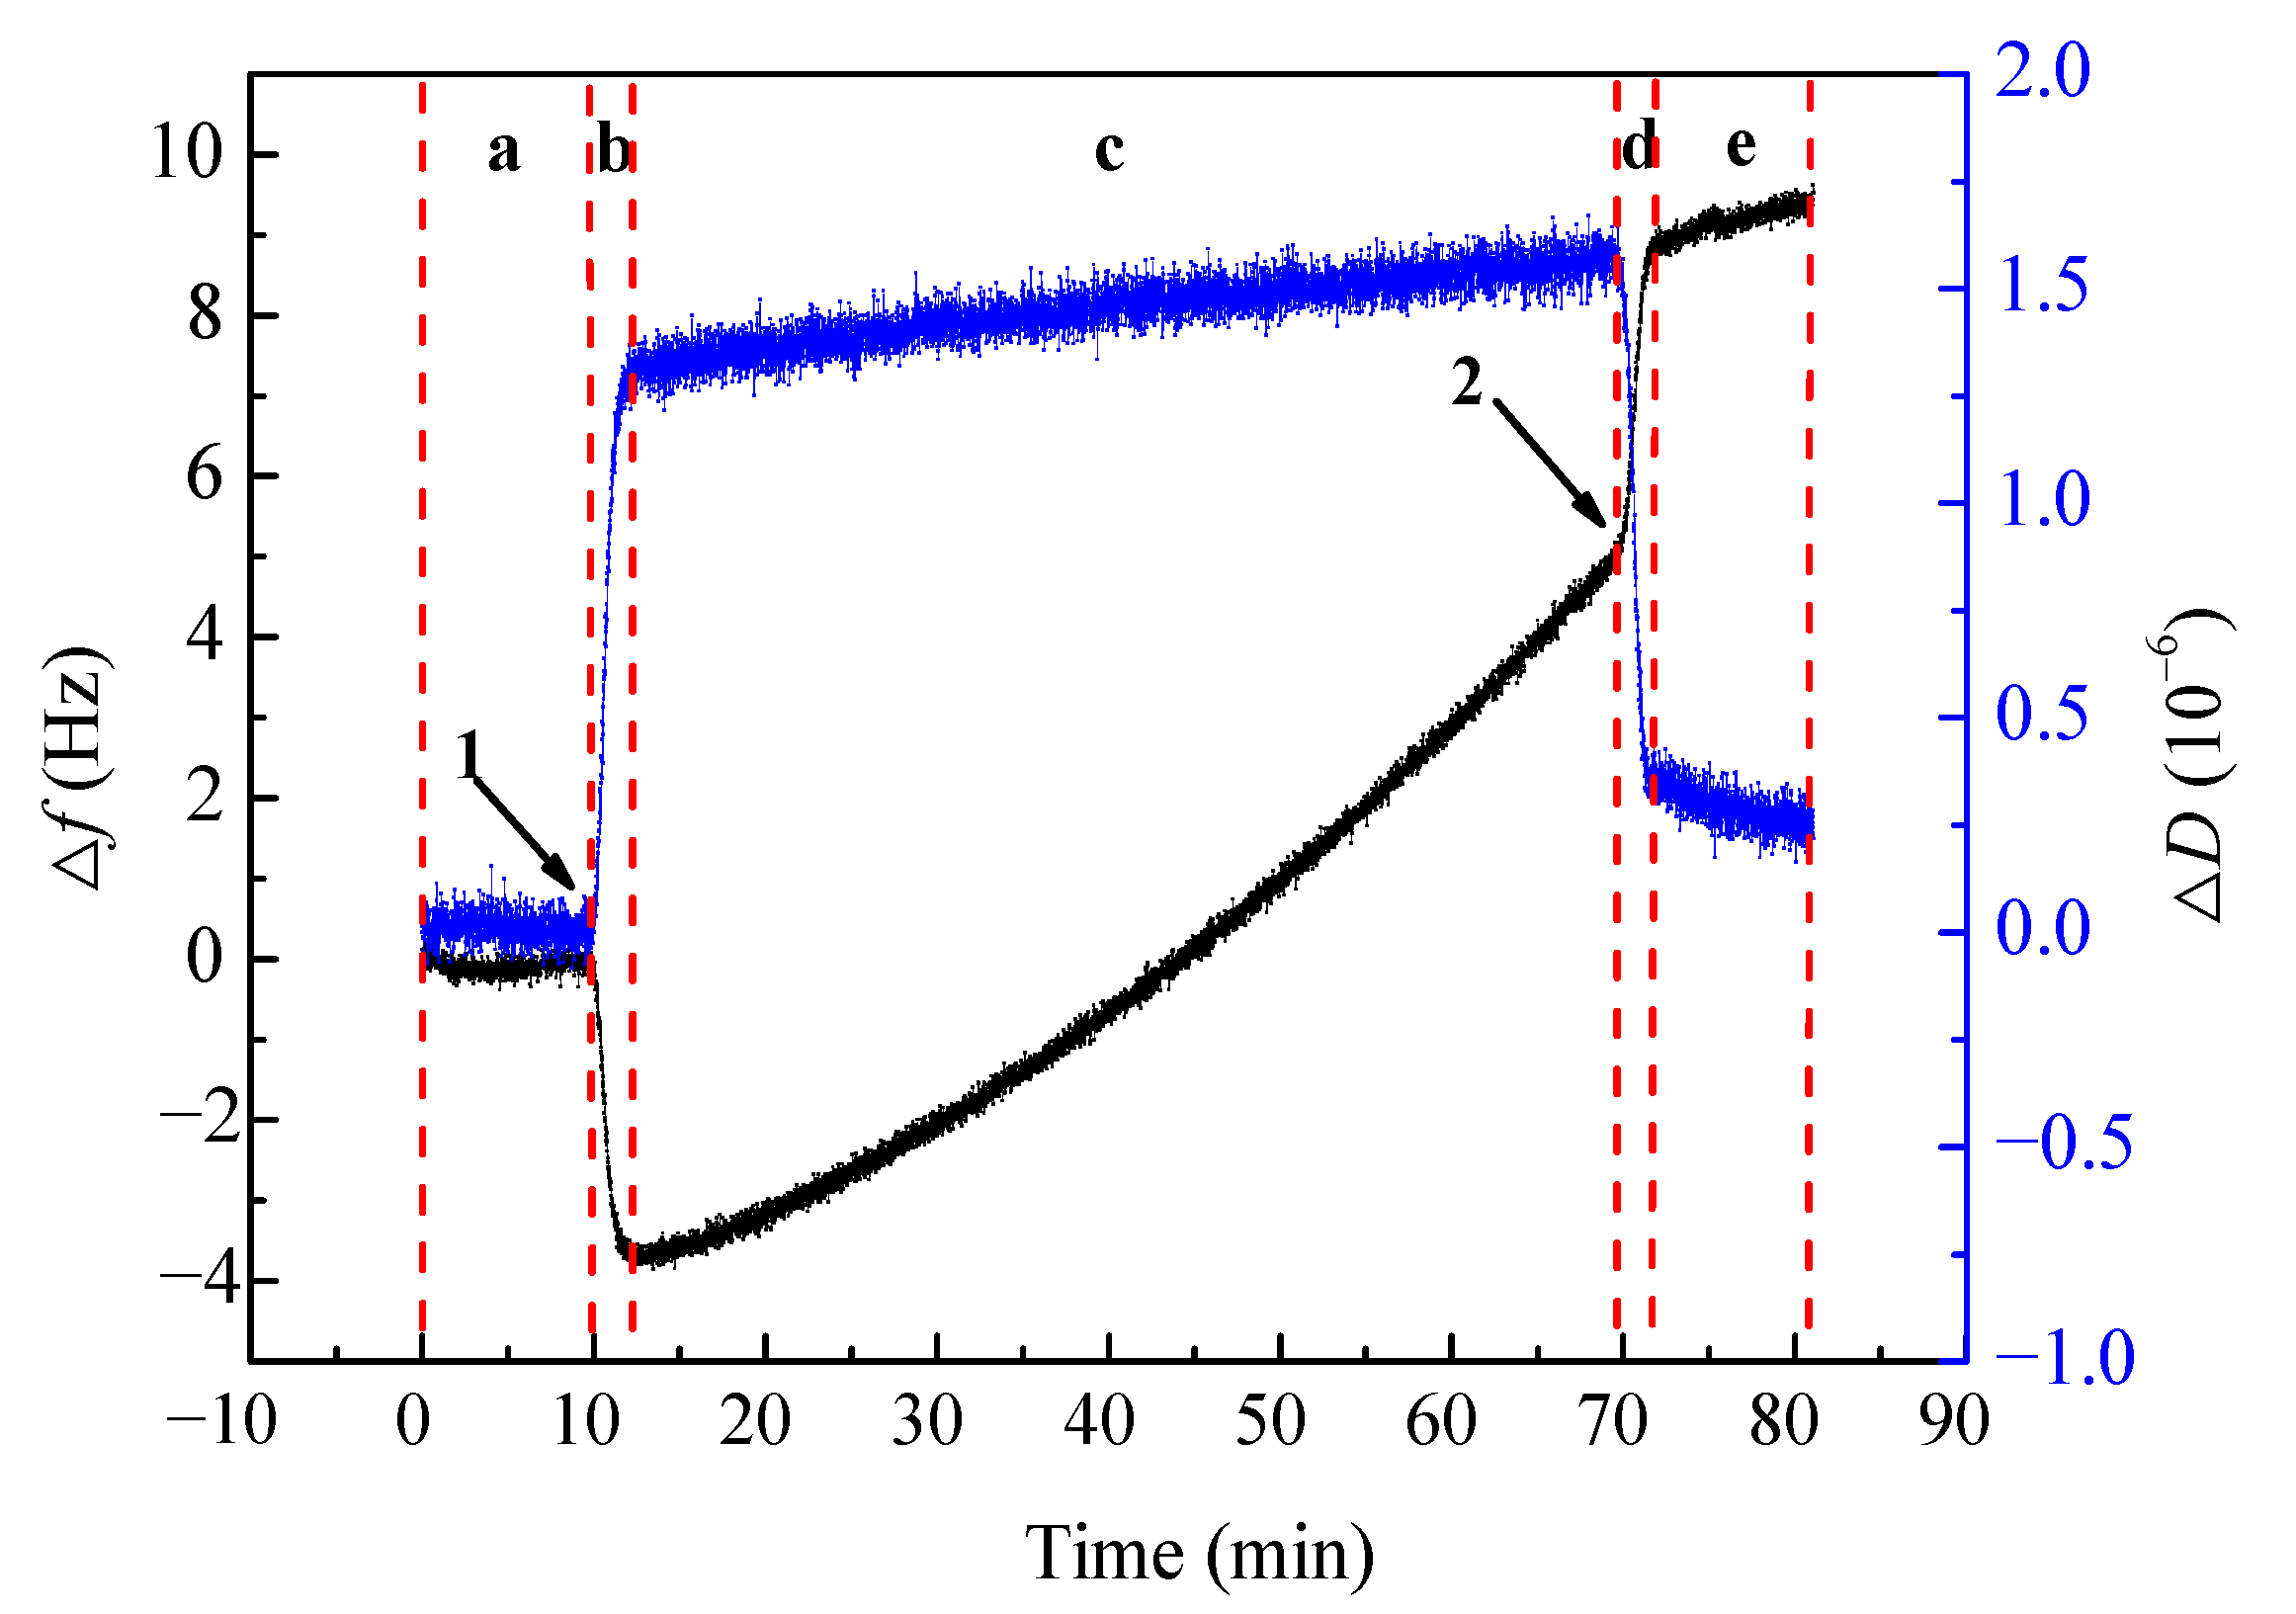
3.3. Kinetic Process of Gold Leaching on Au Sensor with PF by QCM-D

The kinetics of gold leaching for different concentrations of PF solution under UV irradiation of 10 mW·cm−2 on the Au sensor were determined by QCM-D. The real-time experimental data of frequency shift over time were obtained from the seventh overtone (resonance frequency = 35 MHz). All operations ensure that the baseline before the test was less than 1 Hz within 5 min. The frequency shift (Δf) and dissipation shift (ΔD) of the leaching process in PF solution are shown in Figure 10. Arrow 1 represents the injection of PF solution into the system, and arrow 2 indicates the entrance of background solution (deionized water) into the system after the leaching rate stabilized.
According to Figure 10, the injection of PF solution caused a decrease in ∆f and a sharp increase in ΔD, indicating that there are substances adsorbed on the surface of the sensor in stage b. This is due to AuCN and Au-hydroxide species form and precipitate on surfaces when there is a deficiency in free cyanide. Upon continuous injection of PF solution, ∆f reached its lowest point and then began to rise. The increase of Δf at a gradually increasing rate suggests that the cyanide ions in the solution increased with the extension of irradiation time in leaching stage c. Meanwhile, ΔD increased to an equilibrium state, indicating that the reaction between the leaching solution and Au had little effect on the surface viscoelasticity, and that behavior can be interpreted as rigid adsorption. When the background solution was pumped into the system, Δf exhibited a slightly faster upward trend and ultimately reached an equilibrium at a nonzero value, indicating that irreversible reactions had occurred between PF and gold. In contrast, ΔD declined nearly to its initial state, indicating that the surface properties of the sensor did not change significantly after this experiment.

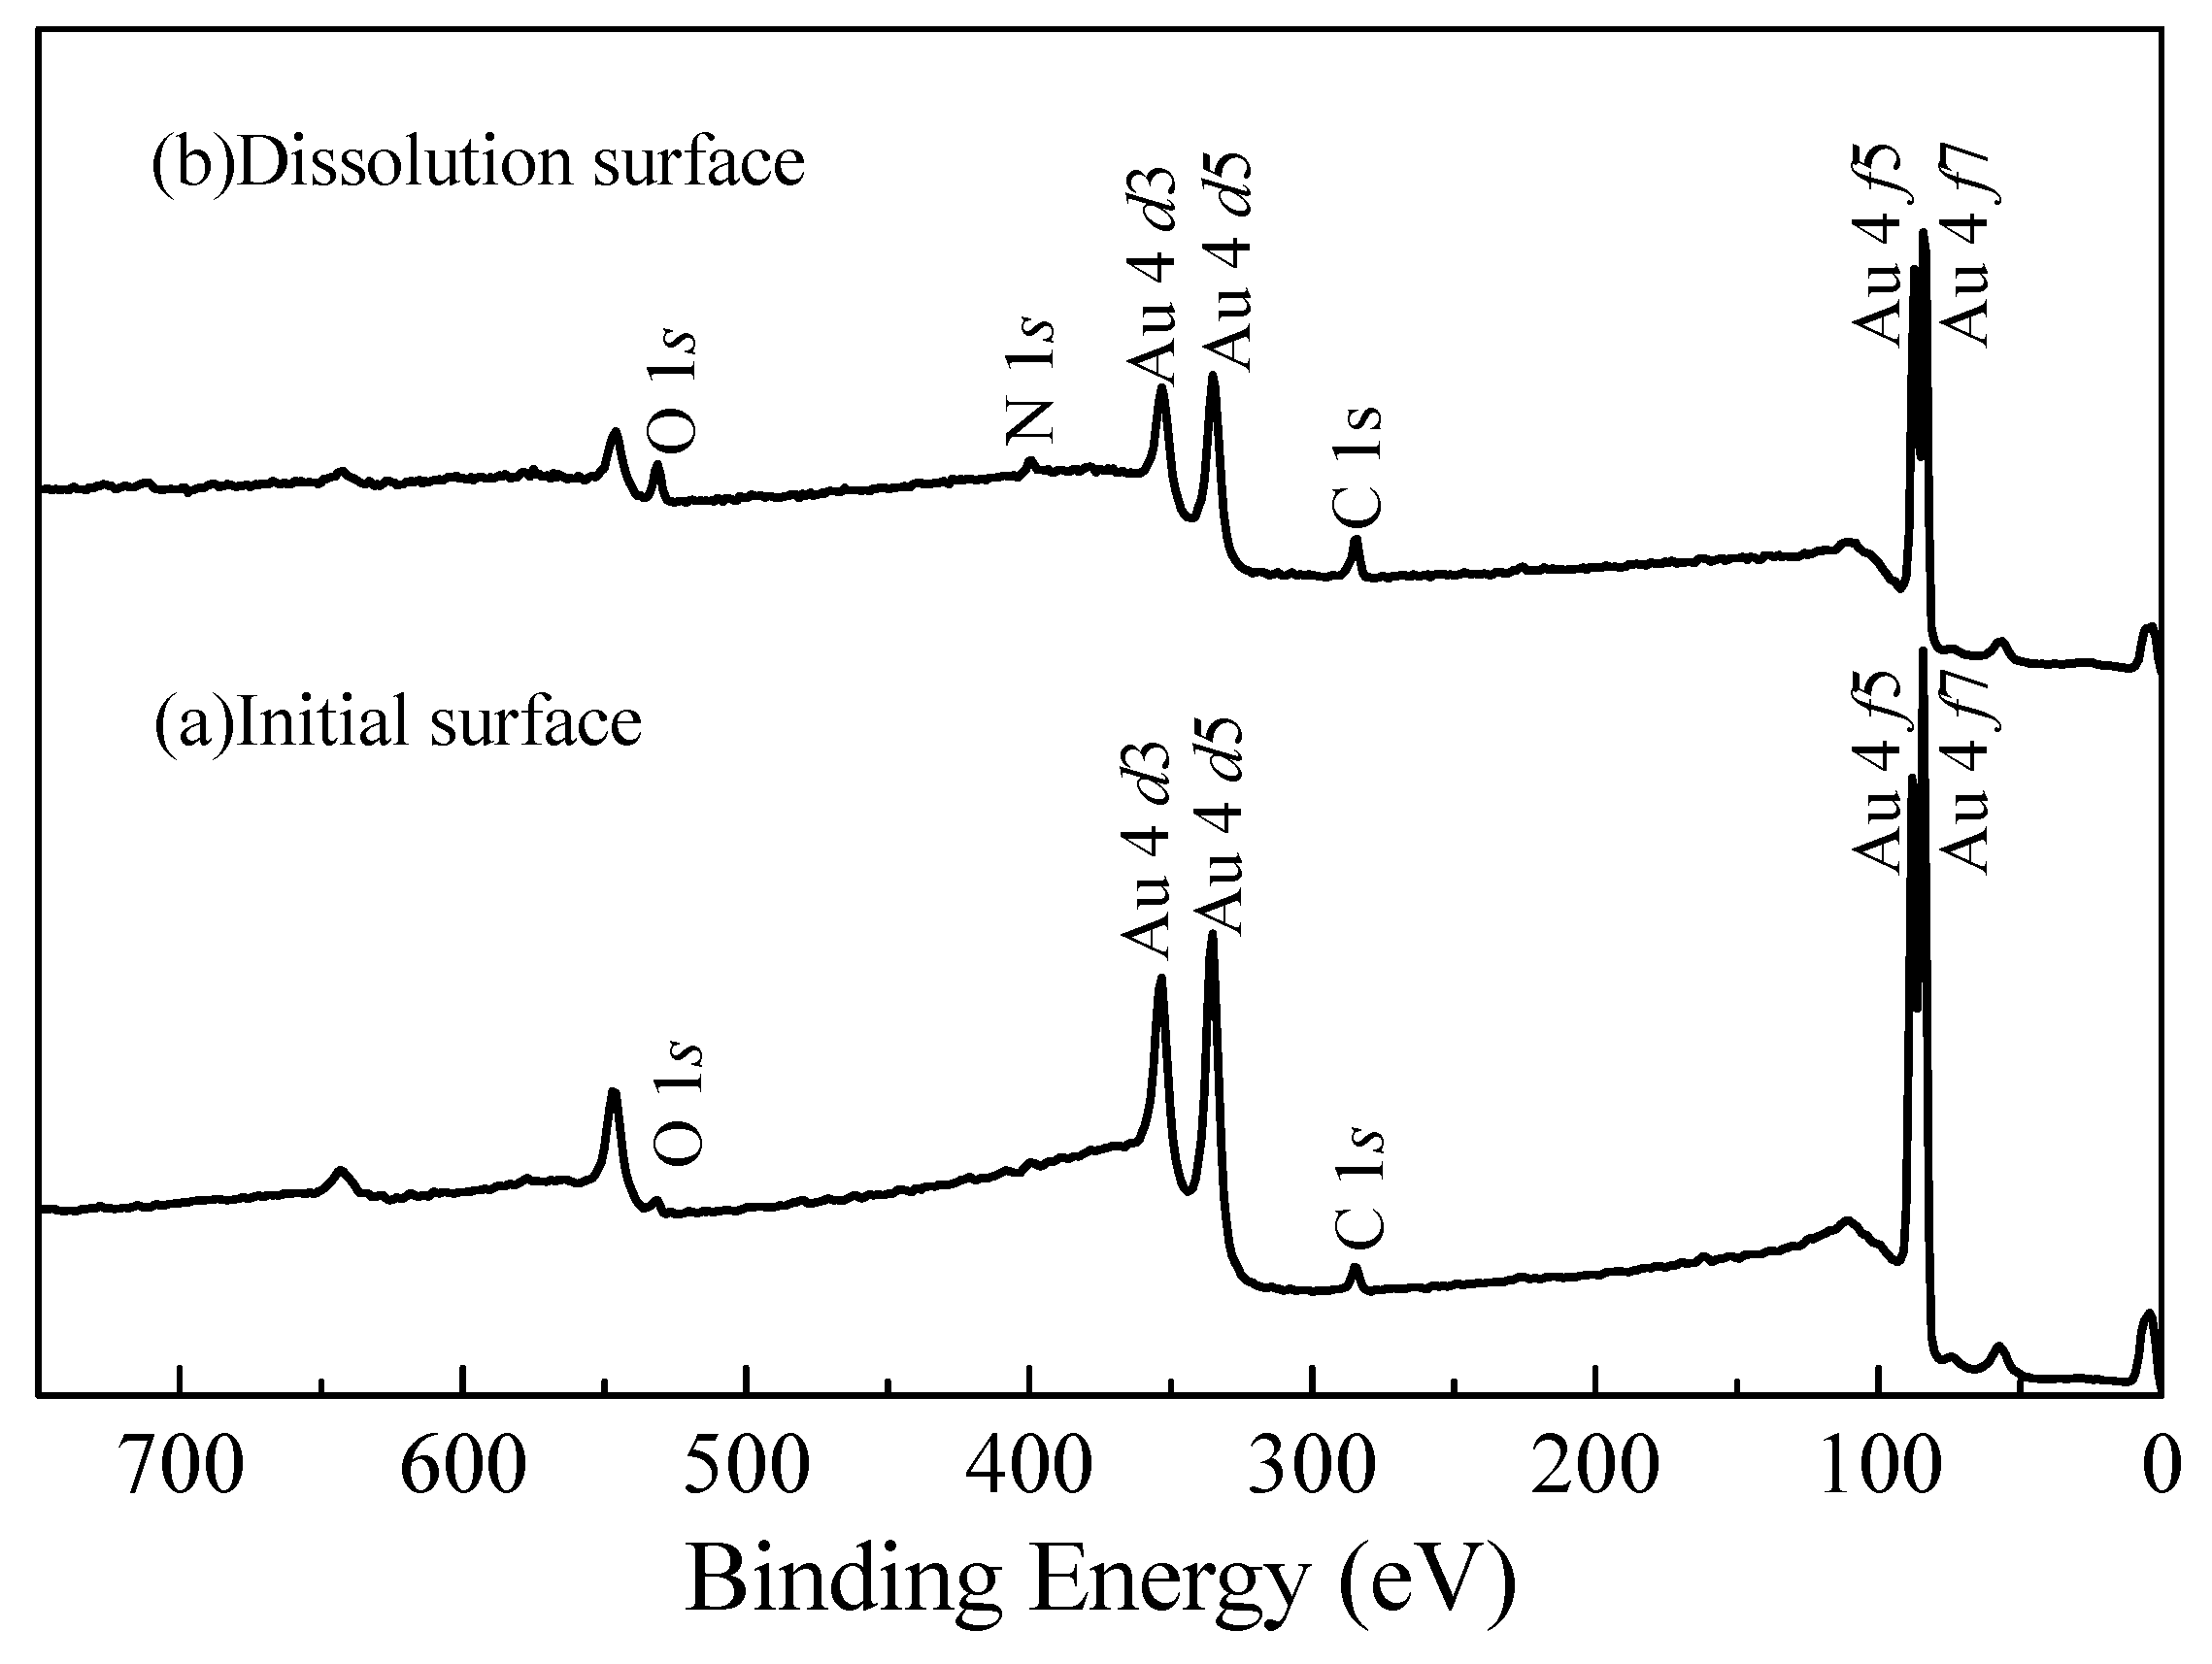
3.4. Surface Product Composition Analysis by XPS

To study the elemental composition and structural morphology of the surface products, the XPS wide energy spectrum of the clean and agent-treated sensors were obtained. The results were used to illustrate the chemical composition of the Au sensor surface. As shown in Figure 11, the surface of the clean sensor contains mainly Au 4f and a small amount of C 1s and O 1s, thus confirming that the gold was successfully coated onto the surface of the sensor without any other impure elements. After leaching, the relative content of C 1s and O 1s increased substantially, and a new element, N 1s, appeared. This new element indicated that C 1s, O 1s, and N 1s were deposited on the surface of the sensor after the leaching process, resulting in the formation of some complexes. To further determine the chemical morphology of the elements, the bonding properties of each element were investigated. Therefore, the Au, C, N, and O in the surface products were scanned at narrow energies, and the curve fitting program of the Thermo Avantage software was used to fit the obtained spectral lines.
The narrow sweep curve of Au on the initial and dissolution reaction surfaces are shown in Figure 12a. The binding energies of the two main peaks are approximately 83.90 eV, which is consistent with the binding energies of the 4f7 peak from the Handbook of X-ray Photoelectron Spectroscopy [30]. The obtained results confirmed that there was a large amount of Au on the surface of the sensor. In addition, the characteristic peak of the dissolution surface shifted towards the high energy direction compared to the initial surface. This result indicates that the charge density around Au atoms decreased after the reaction, and positively charged Au emerged to the surface of the sensor.
The high resolution XPS spectra of C 1s on the surface of original and reagent-treated sensors are shown in Figure 12b. According to the graph, the main peak of C 1s was at 284.80 eV, which demonstrates that the C on the surface approximates the characteristic peak of the nonbound state C due to trace hydrocarbon contamination on the surface of the sensor [31]. The spectra exhibited significant asymmetric characteristics, and the C 1s peak on the dissolution surface shifted 0.12 eV towards the high binding energy direction, thus indicating the existence of other carbon-containing species of C 1s [32]. Peak fitting was then performed to analyze the existent forms of C 1s. On the original surface, peaks were recorded at 284.84 and 286.70 eV in the XPS spectrum, and they correspond to the traces of organic pollutants pre-adsorbed on the sensor’s surface. Compared to the C 1s peak of the original surface, the decomposition of the C 1s peak on the dissolution surface consists of three peaks. In addition to the C peak at 284.96 and 286.78 eV, another peak with binding energy greater than the C-C bond appeared at 288.21 eV, corresponding to –C≡N from complexes formed during the leaching process [33].
As shown in Figure 12 c, the absence of an N 1s characteristic peak on the initial surface indicates that the detection of N was not affected by the environment. On the dissolution surface, the characteristic peak of N 1s was 399.96 eV, which coincides with the binding energy of the –C≡N bond [34]. Considering the XPS analysis of C and Au, it can be inferred that N exists in the form of –C≡N and in complexes with Au on the dissolution surface.
As shown by the O 1s spectra in Figure 12d, the binding energy of O 1s was 531.94 eV, which coincides with the standard peak of adsorbed oxygen (Oads) [35]. It is generally believed that the Oads is O2 or -OH when the binding energy is approximately 532 eV. According to the graph, the relative content of O 1s on the dissolution surface clearly increased, which indicates the presence of -OH and its existence likely in the form of Au(OH)n.

4. Conclusions

(1) Under the UV irradiation, PF solution could dissociate and release free cyanide ions little by little. Additionally, the amount of free cyanide ions gradually increased with the increase of irradiation time and intensity. However, there has been a saturation value of the release of free cyanide ions at the concentration. The maximum release amount corresponds to a PF concentration of 2.5 mmol/L, and the conversion rate of cyanide ions is 65.28% after irradiation for 60 min at the irradiance of 10 mW·cm−2.
(2) The leaching experiments analyzed by response surface methodology showed a 67.74% extraction of gold at 62 °C, pH of 12.6, and 3.8 kg/t dosage of reagent under the UV light of 10 Mw·cm−2. The leaching kinetics of the PF solution monitored by QCM-D showed that the release of cyanide ions is a process of gradual release. The leaching reaction in the solution consists of two processes: adsorption and leaching.
(3) The XPS analysis showed that there was –C≡N on the dissolution reaction surface, and that gold was oxidized to form AuCN complexes. It can be assumed that the free cyanide ion was released from the solution of PF during the leaching reaction, and it formed AuCN and Au (OH)n.

Author Contributions

Z.L. wrote the manuscript, with review from J.K., Y.X., and C.S. All authors have read and aggreed to the published version of the manuscript.

Funding

This work was supported by the National Natural Science Foundation of China (grant number: 51974016).

Data Availability Statement

Not applicable.

Acknowledgments

The authors would like to thank the Analytical and Testing Center of the University of Science and Technology Beijing, which supplied the facilities to perform the measurements.

Conflicts of Interest

The authors declare no conflict of interest.

References

  1. Vargas, C.; Navarro, P.; Espinoza, D.; Manríquez, J.; Mejía, E. Dissolution Behavior of Gold in Alkaline Media Using Thiourea. Int. J. Nonferrous Metall. 2018, 8, 1–8. [Google Scholar] [CrossRef] [Green Version]
  2. Wu, H.; Feng, Y.; Huang, W.; Li, H.; Liao, S. The role of glycine in the ammonium thiocyanate leaching of gold. Hydrometallurgy 2019, 185, 111–116. [Google Scholar] [CrossRef]
  3. Liang, C.; Li, J. Recovery of gold in iodine-iodide system—A review. Sep. Sci. Technol. 2019, 54, 1055–1066. [Google Scholar] [CrossRef]
  4. Dong, Z.; Jiang, T.; Xu, B.; Yang, Y.; Li, Q. An eco-friendly and efficient process of low potential thiosulfate leaching-resin adsorption recovery for extracting gold from a roasted gold concentrate. J. Clean. Prod. 2019, 229, 387–398. [Google Scholar] [CrossRef]
  5. Jeffrey, M.I.; Breuer, P.L. The cyanide leaching of gold in solutions containing sulfide. Miner. Eng. 2000, 13, 1097–1106. [Google Scholar] [CrossRef]
  6. Oraby, E.; Eksteen, J.; Karrech, A.; Attar, M. Gold extraction from paleochannel ores using an aerated alkaline glycine lixiviant for consideration in heap and in-situ leaching applications. Miner. Eng. 2019, 138, 112–118. [Google Scholar] [CrossRef]
  7. Hilson, G.; Monhemius, A. Alternatives to cyanide in the gold mining industry: What prospects for the future? J. Clean. Prod. 2006, 14, 1158–1167. [Google Scholar] [CrossRef]
  8. Azizitorghabeh, A.; Wang, J.; Ramsay, J.A.; Ghahreman, A. A review of thiocyanate gold leaching—Chemistry, thermodynamics, kinetics and processing. Miner. Eng. 2021, 160, 106689. [Google Scholar] [CrossRef]
  9. Oraby, E.; Eksteen, J.; O’Connor, G. Gold leaching from oxide ores in alkaline glycine solutions in the presence of permanganate. Hydrometallurgy 2020, 198, 105527. [Google Scholar] [CrossRef]
  10. Tran, Q.B.; Lohitnavy, M.; Phenrat, T. Assessing potential hydrogen cyanide exposure from cyanide-contaminated mine tailing management practices in Thailand’s gold mining. J. Environ. Manag. 2019, 249, 109357. [Google Scholar] [CrossRef]
  11. Meeussen, J.C.; Keizer, M.G.; De Haan, F.A. Chemical stability and decomposition rate of iron cyanide complexes in soil solutions. Environ. Sci. Technol. 1992, 26, 511–516. [Google Scholar] [CrossRef]
  12. Lim, H.S.; Hwang, J.Y.; Choi, E.; Lee, G.; Yun, S.S.; Kim, M. Assessment of ferrocyanide intake from food-grade salt in the Korean population. LWT Food Sci. Technol. 2018, 93, 620–627. [Google Scholar] [CrossRef]
  13. Van Nguyen, M.; Thorarinsdottir, K.A.; Thorkelsson, G.; Gudmundsdottir, A.; Arason, S. Influences of potassium ferrocyanide on lipid oxidation of salted cod (Gadus morhua) during processing, storage and rehydration. Food Chem. 2012, 131, 1322–1331. [Google Scholar] [CrossRef]
  14. Ašpergěr, S. Kinetics of the decomposition of potassium ferrocyanide in ultra-violet light. Trans. Faraday Soc. 1952, 48, 617–624. [Google Scholar] [CrossRef]
  15. Pommeret, S.; Naskrecki, R.; van der Meulen, P.; Ménard, M.; Vigneron, G.; Gustavsson, T. Ultrafast events in the electron photodetachment from the hexacyanoferrate (II) complex in solution. Chem. Phys. Lett. 1998, 288, 833–840. [Google Scholar] [CrossRef]
  16. Betancourt-Buitrago, L.; Vásquez, C.; Veitia, L.; Ossa-Echeverry, O.; Rodriguez-Vallejo, J.; Barraza-Burgos, J.; Marriaga-Cabrales, N.; Machuca-Martínez, F. An approach to utilize the artificial high power LED UV-A radiation in photoreactors for the degradation of methylene blue. Photochem. Photobiol. Sci. 2017, 16, 79–85. [Google Scholar] [CrossRef] [PubMed]
  17. Hanela, S.; Durán, J.; Jacobo, S. Removal of iron–cyanide complexes from wastewaters by combined UV–ozone and modified zeolite treatment. J. Environ. Chem. Eng. 2015, 3, 1794–1801. [Google Scholar] [CrossRef]
  18. Chen, W.D.; Kang, S.-K.; Stark, W.J.; Rogers, J.A.; Grass, R.N. The light triggered dissolution of gold wires using potassium ferrocyanide solutions enables cumulative illumination sensing. Sens. Actuators B 2019, 282, 52–59. [Google Scholar] [CrossRef]
  19. Chemical Book Database. Available online: https://www.chemicalbook.com/ProductChemicalPropertiesCB3329047.htm (accessed on 26 March 2021).
  20. Jeffrey, M.I.; Woods, R. Frequency changes observed with the EQCM resulting from hydrophilic/hydrophobic transitions. Colloids Surf. 2007, 302, 488–493. [Google Scholar] [CrossRef]
  21. Kou, J.; Xu, S. In situ kinetics and conformation studies of dodecylamine adsorption onto zinc sulfide using a quartz crystal microbalance with dissipation (QCM-D). Colloids Surf. 2016, 490, 110–120. [Google Scholar] [CrossRef]
  22. Hieda, M.; Garcia, R.; Dixon, M.; Daniel, T.; Allara, D.; Chan, M. Ultrasensitive quartz crystal microbalance with porous gold electrodes. Appl. Phys. Lett. 2004, 84, 628–630. [Google Scholar] [CrossRef]
  23. Sauerbrey, G. Verwendung von Schwingquarzen zur Wägung dünner Schichten und zur Mikrowägung. Z. Phys. 1959, 155, 206–222. [Google Scholar] [CrossRef]
  24. Swiatek, S.; Komorek, P.; Jachimska, B. Adsorption of β-lactoglobulin A on gold surface determined in situ by QCM-D measurements. Food Hydrocoll. 2019, 91, 48–56. [Google Scholar] [CrossRef]
  25. Jeffrey, M.I.; Linda, L.; Breuer, P.L.; Chu, C.K. A kinetic and electrochemical study of the ammonia cyanide process for leaching gold in solutions containing copper. Miner. Eng. 2002, 15, 1173–1180. [Google Scholar] [CrossRef]
  26. Josefsson, P.; Henriksson, G.; Wågberg, L. The physical action of cellulases revealed by a quartz crystal microbalance study using ultrathin cellulose films and pure cellulases. Biomacromolecules 2008, 9, 249–254. [Google Scholar] [CrossRef] [PubMed]
  27. Gutig, C.; Grady, B.P.; Striolo, A. Experimental studies on the adsorption of two surfactants on solid—Aqueous interfaces: Adsorption isotherms and kinetics. Langmuir 2008, 24, 4806–4816. [Google Scholar] [CrossRef]
  28. Liu, J.-Z.; Weng, L.-P.; Zhang, Q.-L.; Xu, H.; Ji, L.-N. Optimization of glucose oxidase production by Aspergillus niger in a benchtop bioreactor using response surface methodology. World J. Microbiol. Biotechnol. 2003, 19, 317–323. [Google Scholar] [CrossRef]
  29. Johnson, C.A. The fate of cyanide in leach wastes at gold mines: An environmental perspective. Appl. Geochem. 2015, 57, 194–205. [Google Scholar] [CrossRef]
  30. Chastain, J.; King, R.C., Jr. Handbook of X-ray photoelectron spectroscopy. Perkin Elmer Corp. 1992, 40, 221. [Google Scholar]
  31. Xu, S.; Kou, J.; Sun, T.; Jong, K. A study of adsorption mechanism of dodecylamine on sphalerite. Colloids Surf. 2015, 486, 145–152. [Google Scholar] [CrossRef]
  32. Ping, Z.; Xiaolin, W.; Jiangrong, Y.; Xiaoguo, F.; Lizhu, L. Effect of Vacuum Heat Treatment on oxidation of Uranium Surfaces. Rare Met. Mater. Eng. 2008, 1, 94–97. [Google Scholar]
  33. Xu, Y.; Sun, B.-L.; Ma, C.; Zhang, P.; Cai, M.-L.; Wu, X.-M. XPS and SEM spectroscopy study of hyperdispersant on atrazine surface. Spectrosc. Spectral Anal. 2011, 31, 2569–2573. [Google Scholar]
  34. Abbott, A.P.; Frisch, G.; Gurman, S.J.; Hillman, A.R.; Hartley, J.; Holyoak, F.; Ryder, K.S. Ionometallurgy: Designer redox properties for metal processing. Chem. Commun. (Camb.) 2011, 47, 10031–10033. [Google Scholar] [CrossRef] [PubMed]
  35. Liu, J.; Feng, Y. Investigation on the electrocatalytic characteristics of SnO2 electrodes with nanocoating prepared by electrodeposition method. Sci. China Ser. E Technol. Sci. 2009, 52, 1799–1803. [Google Scholar] [CrossRef]
Figure 1. XRD patterns of the sample.
Minerals 11 00387 g001
Figure 2. Chemical structure of PF.
Minerals 11 00387 g002
Figure 3. Solubility of PF vs. temperature [19].
Minerals 11 00387 g003
Figure 4. Diagram of photochemical reaction device.
Minerals 11 00387 g004
Figure 5. Irradiance vs. current value of device.
Minerals 11 00387 g005
Figure 6. QCM-D instrumental setup.
Minerals 11 00387 g006
Figure 7. Number of free cyanide ions release in various concentrations of PF at time stages (0–60 min) under ultraviolet irradiance of 10 Mw·cm−2 high pressure mercury lamp (buffered at pH 12).
Minerals 11 00387 g007
Figure 8. Five different irradiation intensities which were assessed, all with the same reaction time of 30 min (buffered at pH 12).
Minerals 11 00387 g008
Figure 9. Response surface plots, corresponding contour plots, and interactions between pH (X1), dosage (X2), and temperature (X3) for Au extraction under ultraviolet radiation of 10 mW·cm−2 high pressure mercury lamp. (a) pH vs. dosage (b) pH vs. temperature(c) dosage vs. temperature.
Minerals 11 00387 g009aMinerals 11 00387 g009b
Figure 10. Frequency shift (Δf) and dissipation shift (ΔD) vs. leaching time at 1 mmol/L PF, pH = 12. a, b, c, d and e represent the initial, adsorption, leaching, desorption and flushing stages. 1 and 2 indicate PF solution and deionized water enter the system, respectively.
Minerals 11 00387 g010
Figure 11. XPS wide energy spectrum of initial and dissolution surfaces.
Minerals 11 00387 g011
Figure 12. High-resolution XPS spectrum of Au 4f (a), C 1s (b), N 1s (c), and O 1s (d).
Minerals 11 00387 g012
Table 1. Main chemical components of the test sample (%).
Au *Ag *FeCuAsZn
56.7838.826.030.110.0820.044
PbSCaOMgOAl2O3SiO2
0.1026.641.270.956.6933.51
* Unit is g/t.
Table 2. Spectral distribution and relative intensity of high-pressure mercury lamp.
Wavelength/nm250313365400510620720
Relative intensity/%208510030204080
Table 3. Selected ranges for coded and actual values of the independent variables.
LevelsX1: pHX2: Dosage (kg/t)X3: Temperature (°C)
−111145
012360
113575
Table 4. Independent variables and their levels for the Box-Behnken design.
RunFactorsResponse
X1: pHX2: Dosage (kg/t)X3: Temperature (°C)Y: Au Extraction (%)
11156044.17
21214529.38
31236063.19
41334547.69
51236062.49
61337564.42
71257560.73
81137557.56
91254540.65
101236065.13
111236064.95
121316045.58
131134541.18
141217544.52
151116035.01
161356061.61
171236065.30
Table 5. ANOVA of the fitted models for gold extraction.
SourceSum of SquaresDegree of FreedomAdjusted Mean SquareF ValueP Value Probability > F
Model2289.299254.3751.48<0.0001
X1214.041214.0443.320.0003
X2346.771346.7770.19<0.0001
X3583.621583.62118.13<0.0001
X1X211.8111.802.390.1662
X1X30.03110.0310.00620.9394
X2X36.116.101.230.3032
X1280.17180.1716.230.005
X22739.881739.88149.76<0.0001
X32214.411214.4143.400.0003
Lack of Fit2839.335.670.0634
R2 = 98.51%, R2 (adj) = 96.60%; significant at 95% confidence degree (p < 0.05).
Table 6. Comparison of gold extraction predicted value and test value.
ReagentpHDosage (kg/t)Temperature (°C)Cyanide Ion (mg/L)Gold Extraction (Test Value %)
PF12.63.86219.167.01
PF12.63.86217.967.47
PF12.63.86218.467.33
Cyanide12.626284.968.02
Publisher’s Note: MDPI stays neutral with regard to jurisdictional claims in published maps and institutional affiliations.

