Article

European Union Green Deal and the Opportunity Cost of Wastewater Treatment Projects

by
Jose M. Vindel
1,*,
Estrella Trincado
2 and
Antonio Sánchez-Bayón
3
1
Centro de Investigaciones Energéticas, Medioambientales y Tecnológicas (CIEMAT), Energy Department, Renewable Energy Division, Avda. Complutense 40, 28040 Madrid, Spain
2
Department of Applied Economics, Structure and History, Faculty of Economics and Business, Campus de Somosaguas, Universidad Complutense de Madrid, Pozuelo de Alarcón s/n, 28223 Madrid, Spain
3
Department of Business Economics (ADO), Applied Economics II and Fundamentals of Economic Analysis, Social and Legal Sciences School, Universidad Rey Juan Carlos, Paseo de Artilleros s/n, 28033 Madrid, Spain
*
Author to whom correspondence should be addressed.
Energies 2021, 14(7), 1994; https://doi.org/10.3390/en14071994
Submission received: 7 March 2021 / Revised: 29 March 2021 / Accepted: 1 April 2021 / Published: 4 April 2021
(This article belongs to the Section C: Energy Economics and Policy)

Abstract

:
The European Union Green Deal aims at curbing greenhouse gas emissions and introducing clean energy production. But to achieve energy efficiency, the opportunity cost of different energies must be assessed. In this article, two different energy self-sufficient systems for wastewater treatment are compared. On the one hand, high-rate algal ponds system (HRAP) is considered; on the other hand, a conventional activated sludge system (AS) which uses photovoltaic power (PV) is studied. The paper offers a viability analysis of both systems based on the capacity to satisfy their energetic consumption. This viability analysis, along with the opportunity cost study, will be used in the article to compare these two projects devoted to the treatment of wastewater. In order to assess viability, the probability of not achieving the energy consumption threshold at least one day is studied. The results point that the AS+PV system self-sufficiency is achieved with much lesser land requirements than the HRAP system (for the former, less than 6500 m2, for the latter 40,000 m2). However, the important AS capital cost makes still the HRAP system more economic, although storage provides a great advantage for using the AS+PV in locations where a lot of irradiance is available.

Graphical Abstract

1. Introduction

In the last decade, international institutions have taken on a strong commitment to achieve a climate neutral economy with the Horizon 2030 [1]. For this commitment, the European Union (EU) passed the EU Green Deal in 2019 aiming at promoting the clean energy production [2,3]. In particular, growing energy demand and water consumption have increased concerns about efficient wastewater treatment [4,5,6]. But for this basic utility at least two possible systems are used. One is the activated sludge process (AS), which entails the biological reduction of organic matter in the wastewater. The oxidation and digestion of carbonaceous biological matter using aerobic micro-organisms in wastewater remove the non-active microbes from the system and provide an effective reduction of pollutant parameters [7,8]. This system has been installed for various municipalities and industries [9]. Another system of wastewater treatment is the high rate algal ponds system (HRAP) that have great potential for biofuel production [10,11,12] when climate is favourable, since the costs of algal cultivation and harvest for biofuel production are covered by the wastewater treatment function. It can be used to provide community-level energy supply. Microalgae are promising alternative renewable sustainable energy sources as they produce large amounts of biomass which can be used for production of “third-generation biofuels” [13]. Recent projects of wastewater treatment use various types of microalgae for resource recovery [14,15,16,17] as microalgae can utilize more than 70% nutrient loads from wastewater [18].
HRAP system shows important advantages as compared to the AS, among which the biomass production [19,20], the atmospheric CO2 fixation [21,22] and a lesser energy consumption [23,24] may be cited. Indeed, the wastewater tertiary and quaternary treatments take advantage of the microalgae culture as, while generating biomass, they need inorganic nitrogen and phosphorus for their growth [25,26]. Moreover, microalgae avoid secondary pollution as they remove heavy metals, as well as certain toxic organic compounds.
Regarding the economic aspect, HRAP is considered a low-cost wastewater treatment system as compared to conventional electromechanical systems with construction costs typically 70% less than AS [27]. Operation cost is also less in HRAP as it requires substantially less energy than AS systems [28,29,30]. This also cuts down greenhouse gas emissions [31]. Besides, in HRAPs the electricity requirement is only 0.04–0.15 kWh kg−1 O2 produced [32]. The integrated wastewater treatment amortized capital and operation costs in HRAP are only 25–33% of those of secondary-level AS treatment [33,34]. However, if the same wastewater needs are to be covered, that is, the same population equivalent is to be served, as this study shows, the algal wastewater systems have a clear disadvantage as compared to AS systems: HRAP takes up a much larger installation area than the AS systems [35]. The availability of large installation areas or land requirement, as well as the cost of these wide terrains, are the main inconveniences of these algae systems. Thus, they are best fitted for rural, suburban and remote communities as they require minimum power and little on-site management [27,30,36].
On the other hand, the algal growth is affected by several aspects, such as the interactions among physical factors, the nutrient availability, biotic factors, the temperature and the light intensity [25,37]. Thus, under outdoor conditions, the meteorology is a decisive element in the algal productivity. Indeed, excessively high or low values of temperature or light intensity can lead to the algal productivity inhibition [38,39]. Thus, in the case of outdoor conditions, it is important to analyze the viability of algal wastewater plant projects according to these two variables, which can strongly vary along the year.
The viability of wastewater treatment plant projects could be assessed by the exceedance probabilities, such as the viability of solar plant projects [40,41,42]. Indeed, every project output is exceeded with certain probability (exceedance probability). Then, as probability increases, the output decreases. That is to say, every exceedance probability is associated with the complementary percentile: for example, P90 (exceedance probability of 90%) is associated with percentile 10; P99 (exceedance probability of 99%) is associated with percentile 1, and so on. According to [43], in the assessment of the viability of solar plant projects three exceedance probabilities are recommended (P50, P90 and P99). These probabilities represent bad cases (small percentiles) and thus, they allow us to estimate damaging outcomes in the project. However, for now a threshold which allows to qualify a project as viable or not viable is not available, and this viability depends on each case considered. Indeed, the storage capacity, as well as the energy demand, plays a main role in this qualification [44,45]. This handicap is even more evident if several systems, whose power needs are very different, are compared. Thus, the study has to focus on their capacity of storage and energy demand.
Actually, the discontinuity in the productivity can be largely diminished by storage. When the photovoltaic technology is used, solar energy may be considered as random and then, uncertain. However, it may be made certain by compensating energy lacks below a certain threshold with energy surpluses. Thus, entropy as a measure of uncertainty is reduced. Self-sufficiency may be attained taking the conventional threshold as the demand, and guaranteeing the supply that meets this demand. In economic theory, this is the flow-fund model, the stock being the storage hoarded and the flow being the inflows of energy that pass by. It moves from a linear economy to a circular economy or even a ‘Spiral Economy’ [46,47].
Besides, more environment-concerned storage design is needed and then, natural biomass derived carbons are excellent alternatives for substituting conventional carbon materials toward a wide range of applications [48,49]. Some biomass is even recycled from the agricultural daily wastes [50]. In particular, the HRAP system can achieve energetic self-sufficiency from its own biomass. But the AS system needs an additional facility that provides energy and, within the Green Deal commitment, this energy is better provided with a renewable technology (such as photovoltaic or wind energy). In this work, the option of complementing the AS system with photovoltaic technology is addressed, leaving for future works the possibility of studying other renewable sources, such as the small wind energy system. The availability of photo-synthetically active radiation (PAR) ground measurement is scarce worldwide. But the Project CGL2016-79284-P AEI/FEDER/UE has made it possible to have an ample network of such measurements in the peninsular Spanish territory, covering different types of climates, such as the Arid Mediterranean and the Oceanic climates.
According to the previous considerations, the main aim of this work is to compare the viability of wastewater treatment projects under outdoor conditions by HRAP and by AS conventional systems, reinforcing this last system with a photovoltaic facility (PV). Indeed, as previously mentioned, there are several studies devoted to the comparison between both systems, but in these studies the inclusion of a PV system is not considered. Thus, the novelty of the article is the comparison between both systems, which must have self-consumption capacity. The different needs of space and energy consumption of these two wastewater treatment systems determines the assessment of their viability considering land requirement and consumption. Another contribution of the paper is the conceptualization of viability as the capacity of the project self-sufficiency (when the energy consumption associated to the system is covered by the energy supplied by the system). This viability is assessed from the probability of meeting certain consumption thresholds considering two cases: absence of storage and full capacity of storage. Obviously, self-sufficiency does not always imply cheaper energy prices, but energy needs for wastewater treatment projects must be maximised.
The work is organized as follows: first, the models performed to estimate the algal productivity and the PV power have been described, as well as the stations where the study takes place. Second, the methodology of the work is presented. Next, the results are shown and discussed. In this sense, a large analysis is developed, according to the PV installation area requirement, where systems with and without storage are compared. Finally, an opportunity cost analysis is included.

2. Materials and Methods

The two wastewater systems compared in this work (HRAP and AS+PV) are designed to serve a population equivalent to 10,000. The HRAP and AS systems used have been taken from the scenarios defined in [51]. According to these scenarios, HRAP only consumes 0.06 kWh m−3, while the AS conventional system consumes 0.89 kWh m−3. The viability of covering these consumptions in a self-sufficient way is analysed: the necessary energy for the AS system is provided by a PV system, while the energy for the HRAP system will come from algal productivity. In this sense, two aspects must be taken into account: on the one hand, the areas which must be covered by algal ponds and by PV panels in order to satisfy the respective demands; on the other hand, the economic aspect of both systems.

2.1. Site of Data Acquisition/Setting

GHI, PAR and temperature collected from two measurement stations are used for the work. The coordinates and type of climate corresponding to both stations are shown in Table 1.
The station located in Tabernas (Spain) has an arid Mediterranean climate (BShs in Köppen classification) with cool winters and very warm summers. Temperatures range from −5 °C to 45 °C. Rainfall is very low, accumulating an average of only 243 mm.
On the other hand, Lugo is a city in north-western Spain. It has a humid oceanic climate with dry summers, Cfb in the Köppen climate classification. Due to its remoteness from the Atlantic, its annual precipitation of 1084 mm can be considered low compared to the near areas.

2.2. Methodology

Below the steps followed to carry out this work are detailed:
(a)
PAR and temperature measurements are collected. These measurements are used for the GEOPAR project (Project CGL2016-79284-P AEI/FEDER/UE) developed by Centro de Investigaciones Energéticas, Medioambientales y Tecnológicas (CIEMAT). Lugo station includes an Apogee SQ-110 pyranometer for PAR measuring, as well as a HOBO S-THB Temperature/Humidity M002 psychrometer that measure humidity and temperature. PAR and temperature measurements in Tabernas are obtained by an Eko ML-020P device, and by a Vaisala HMP60 psychrometer to measure humidity and temperature.
(b)
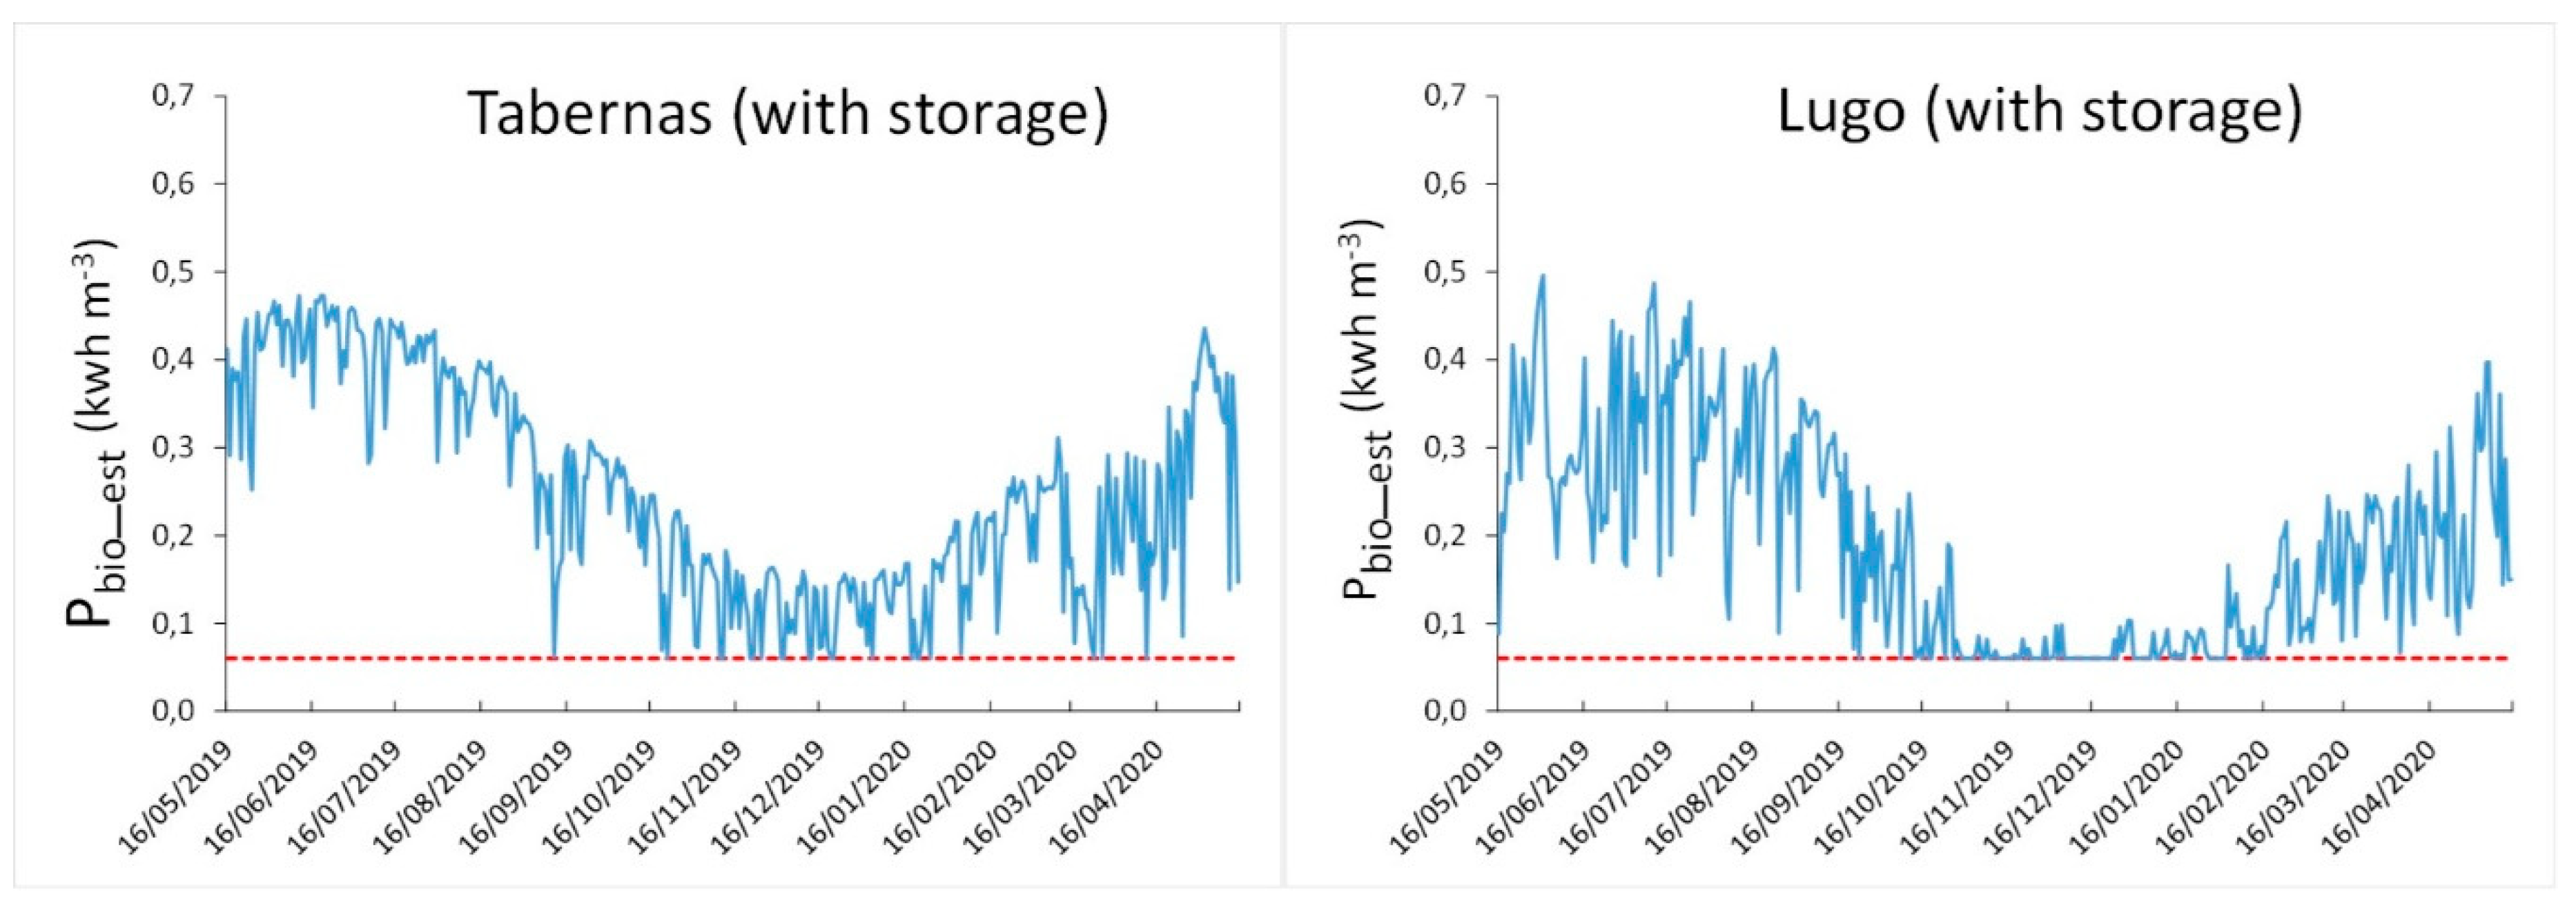
Algal and PV productivities are estimated from PAR and temperature data in the study stations. These estimations are carried out for the two systems studied (HRAP and AS + PV), considering the results both with storage and without storage. In turn, the PV facility is performed for different land requirements.
(c)
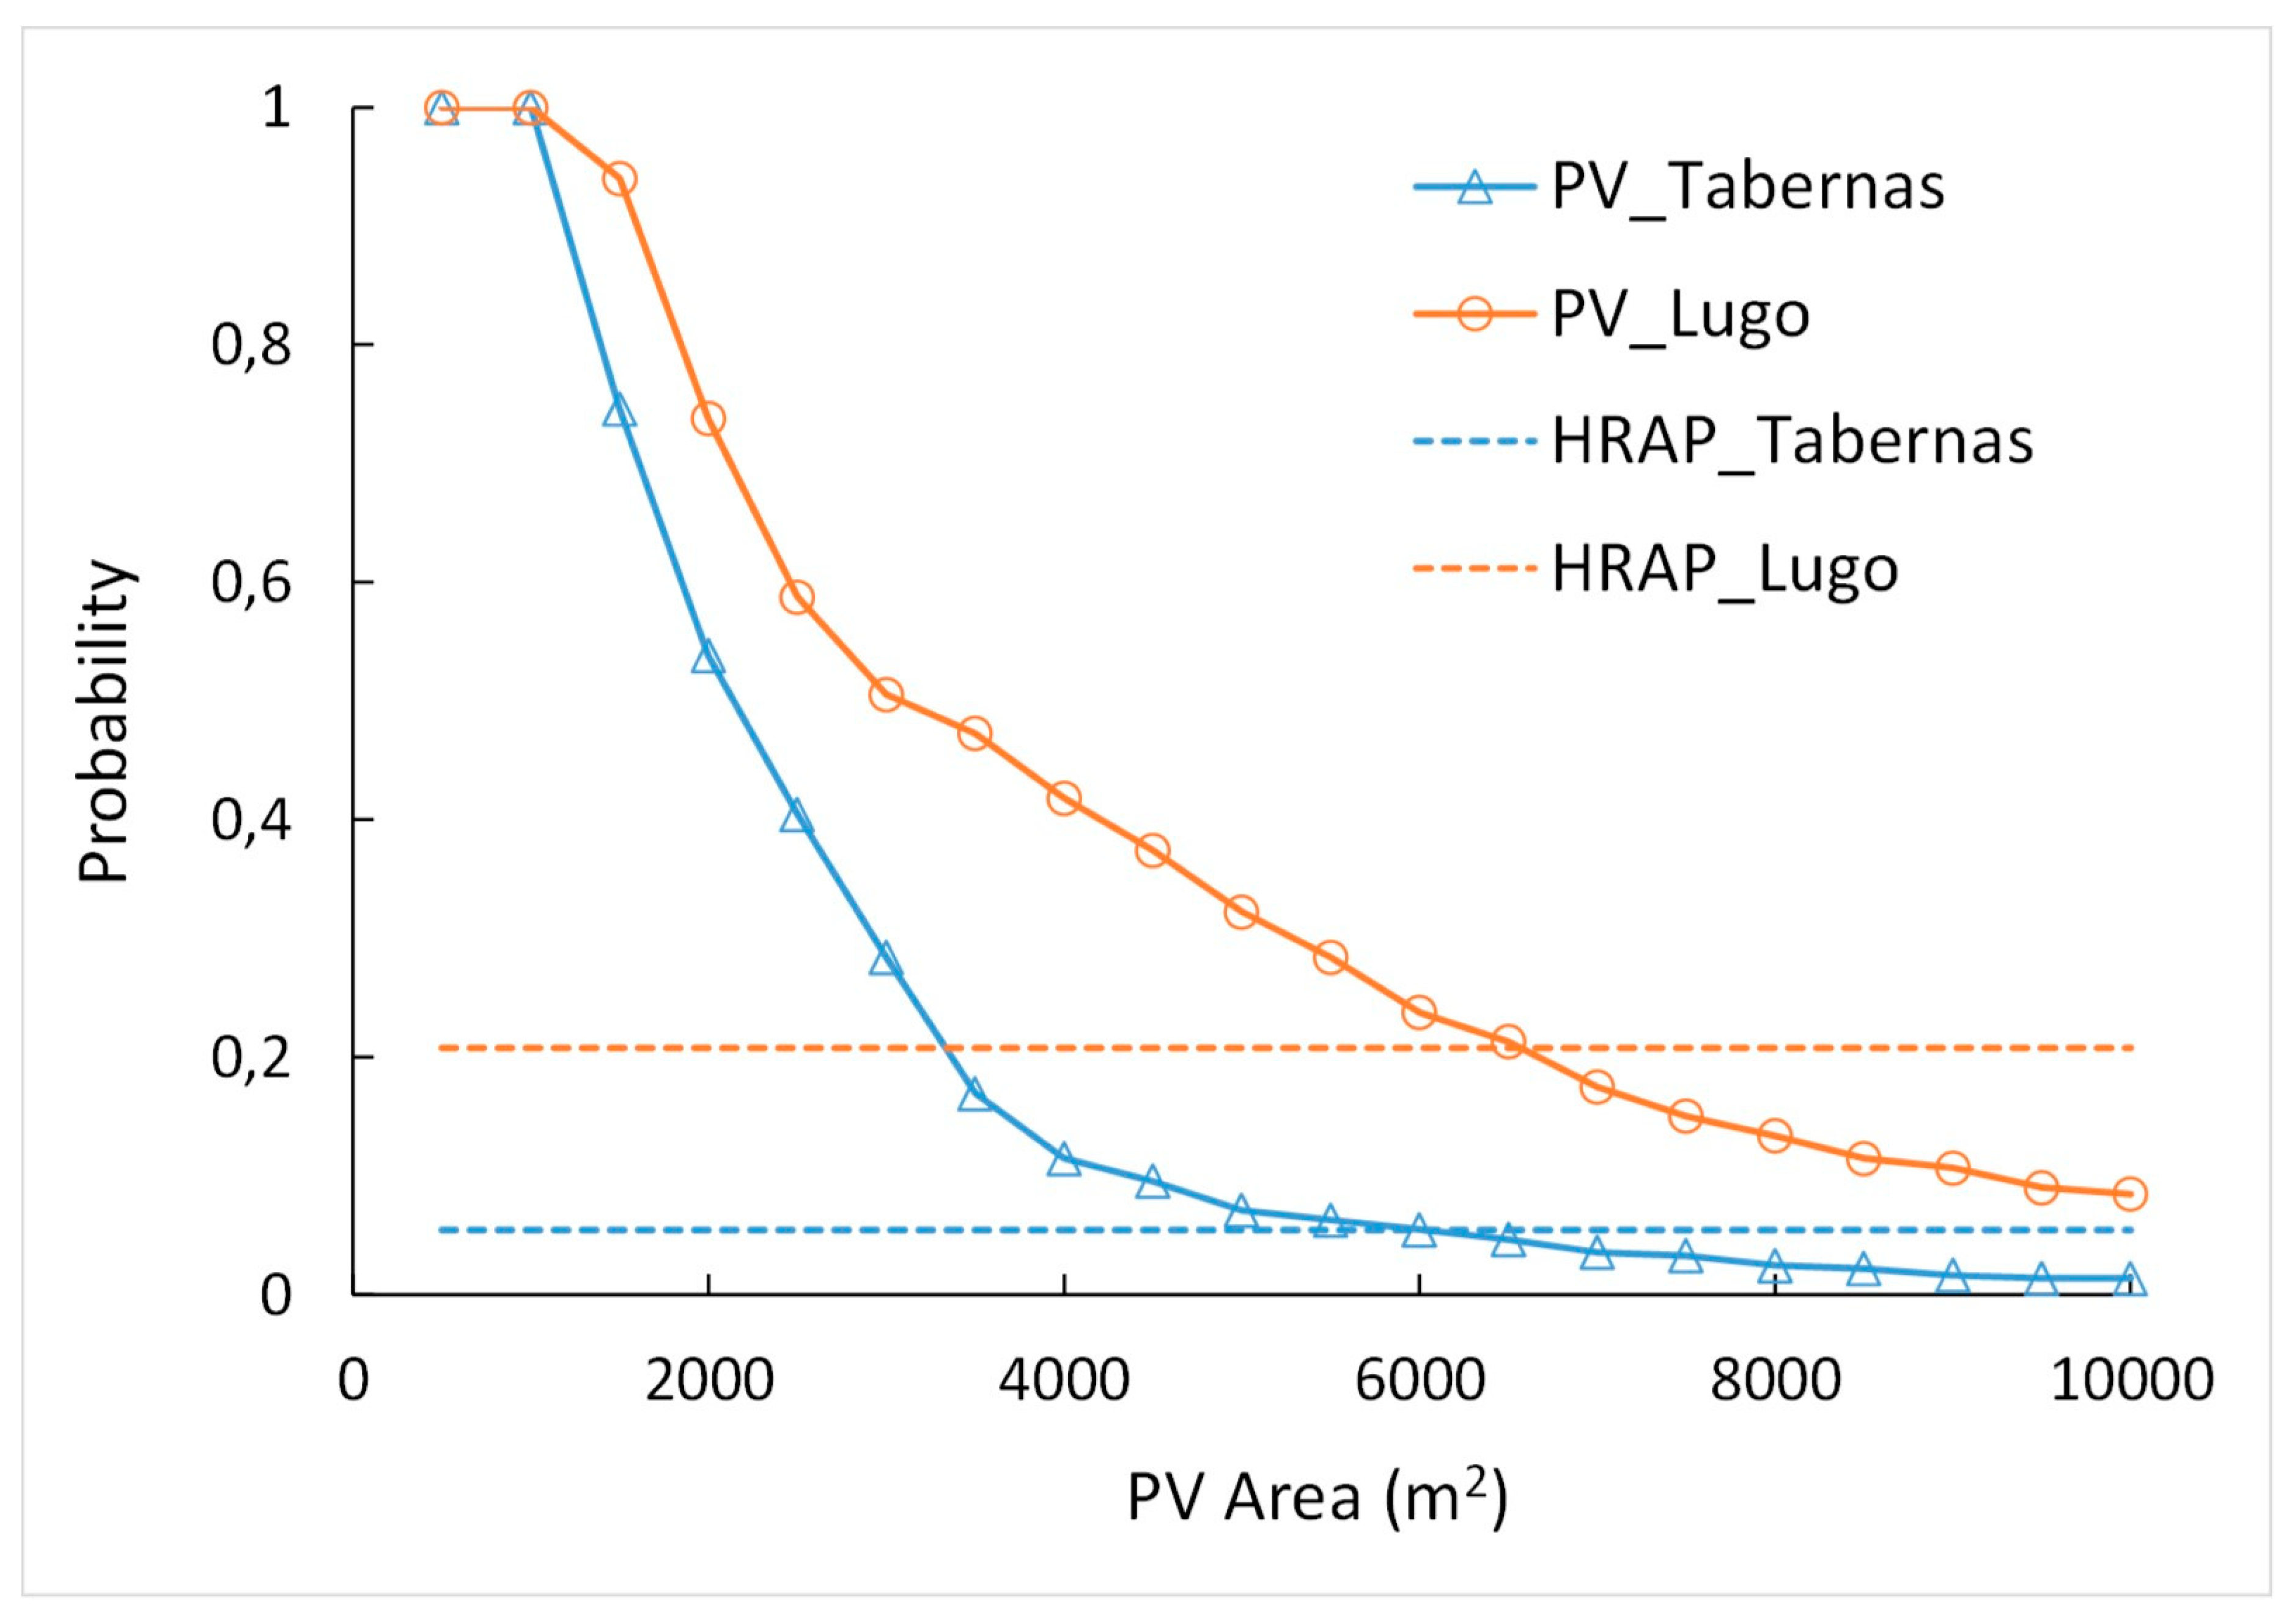
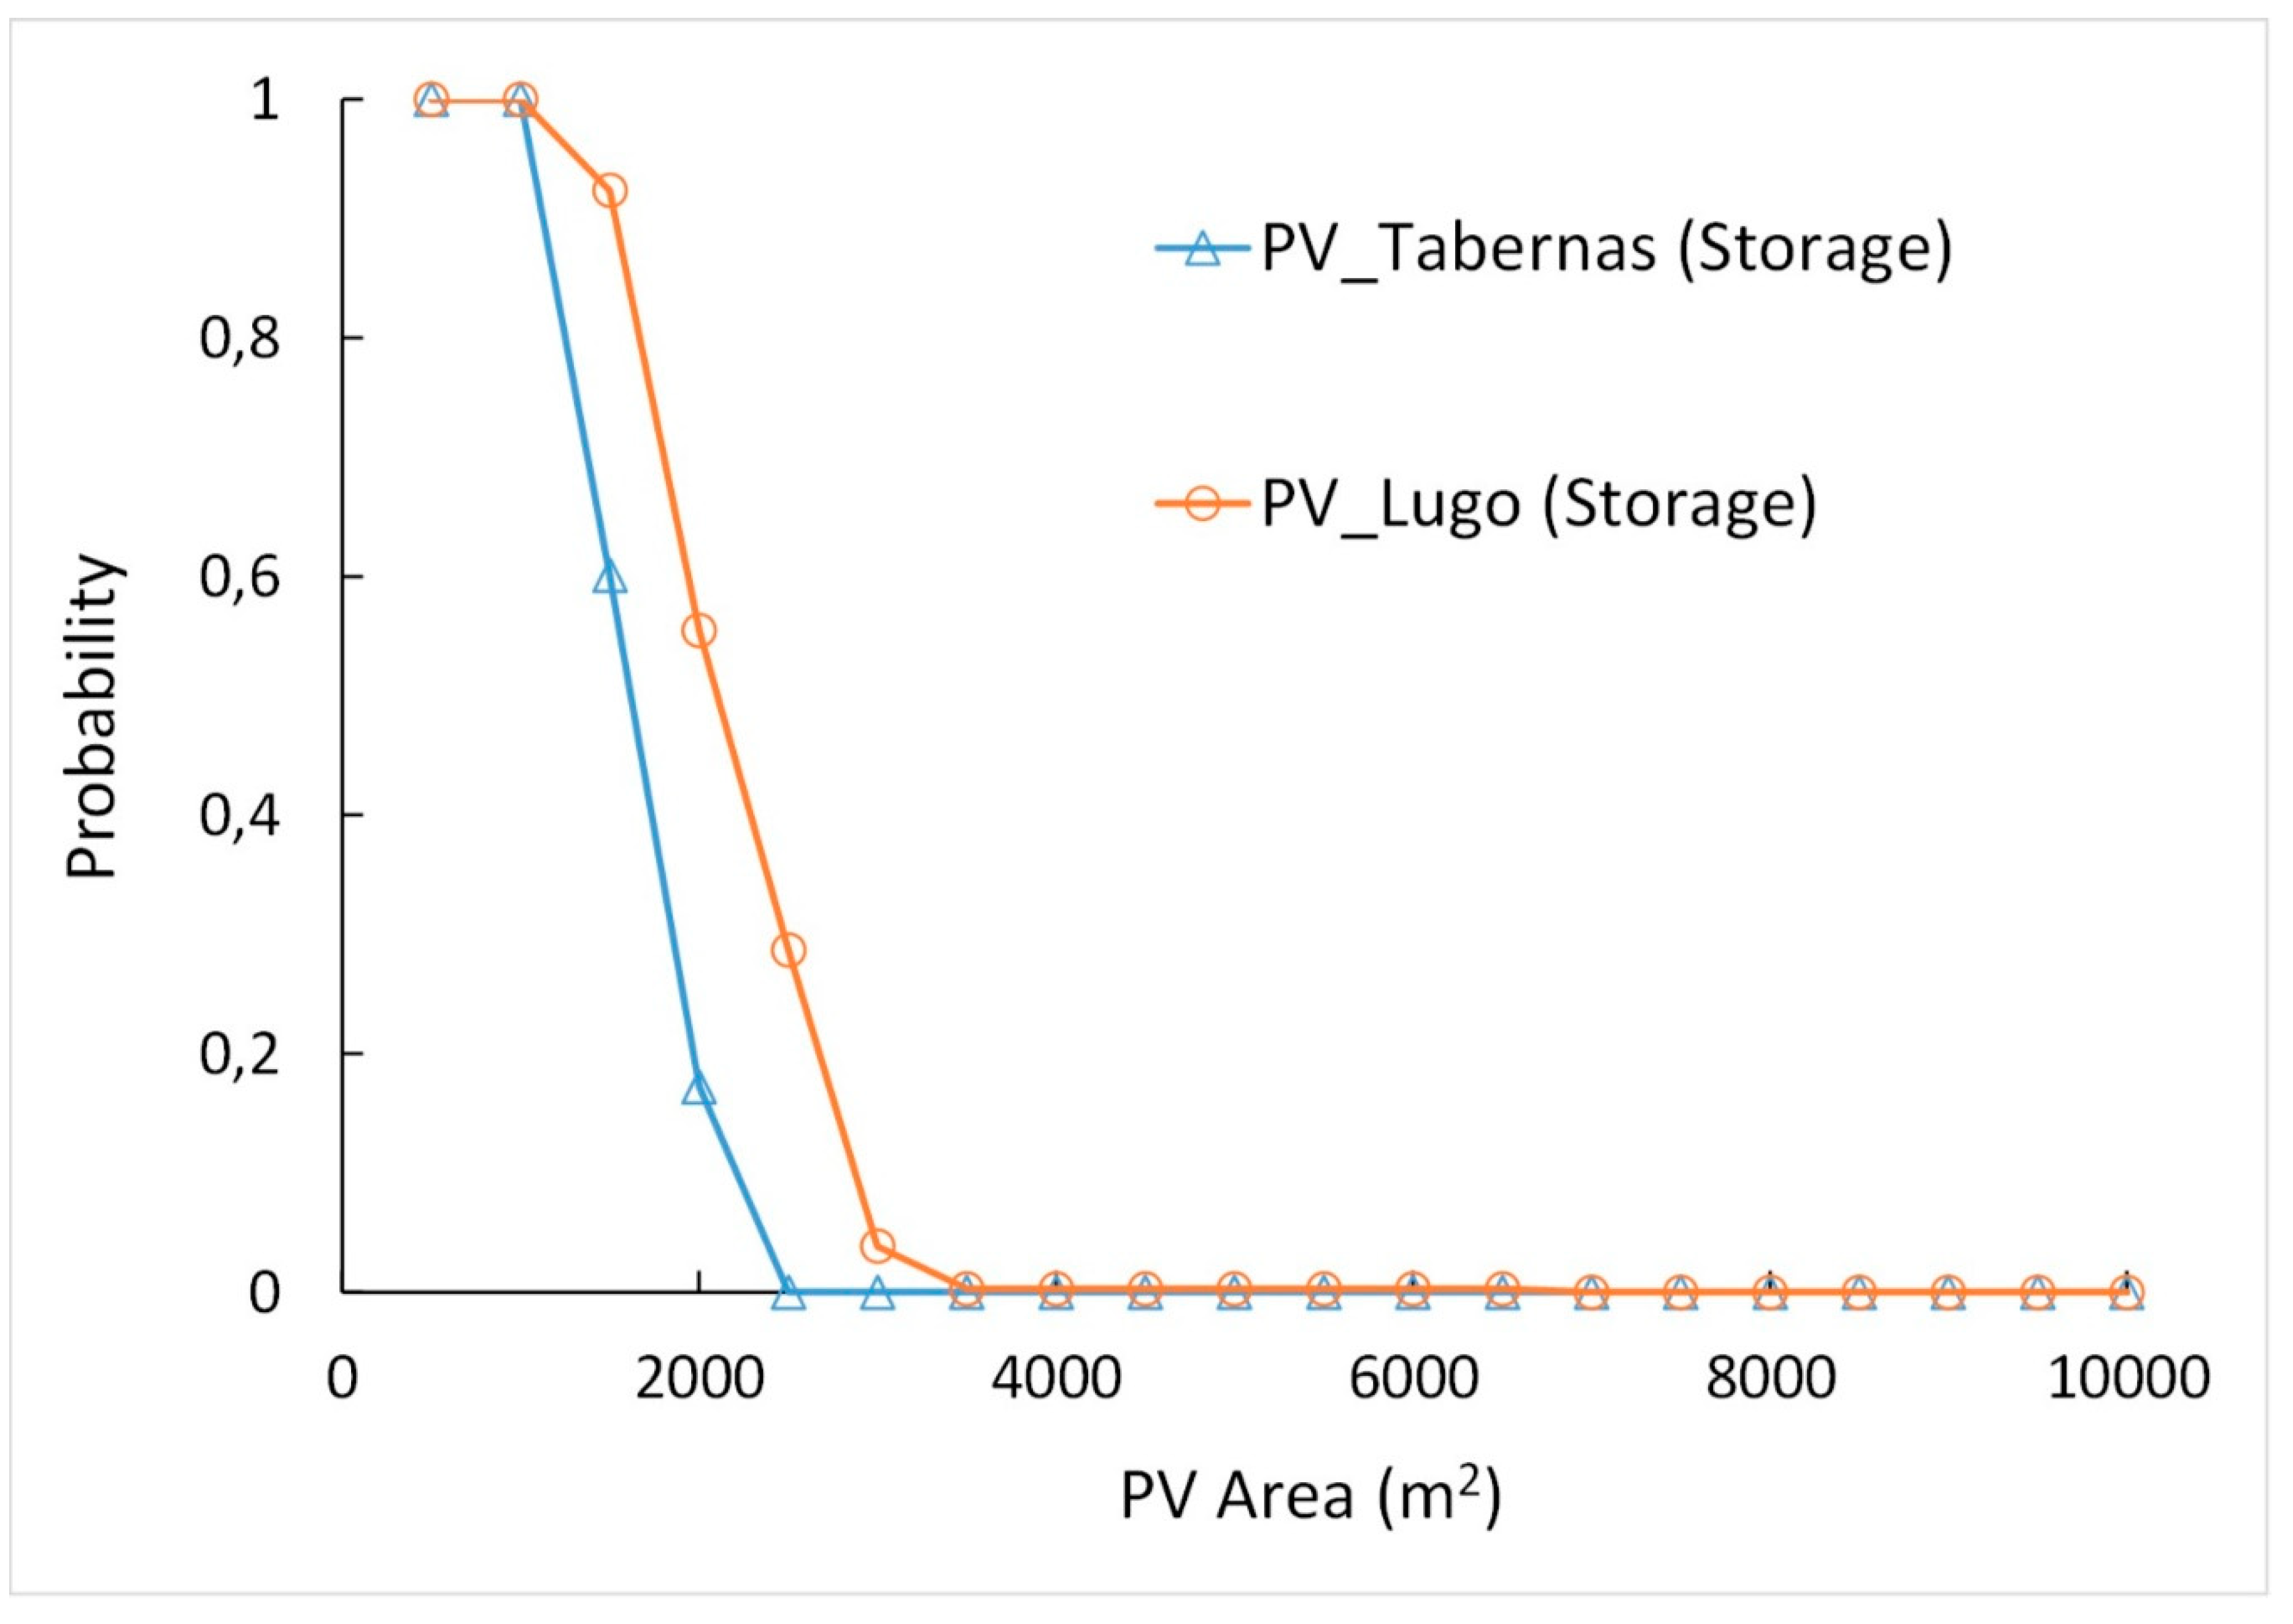
Probabilities of not achieving the energy consumption threshold (0.89 kWh m−3) one day in the AS system, according to the areas occupied by PV panels, are determined for each station and for different PV installation areas.
(d)
Probabilities of not achieving the corresponding HRAP energy consumption threshold (0.06 kWh/m3) are also determined for each station.
(e)
A PV facility viability assessment by exceedance probabilities is also included. For it, P50, P90 and P99 are estimated according to the PV installation areas for both cases, with and without storage.
(f)
Finally, an opportunity cost analysis is included. For this analysis, the costs associated to both studied systems (HRAP and AS + PV) are compared. For HRAP case, two costs are considered: the capital cost and the terrain cost. For AS + PV, besides the capital cost of AS, the capital and operation cost of PV, the terrain cost and, in the case of storage, the economic storage pack cost, are considered. Other possible opportunity costs are pointed out.

2.3. Calculations/Performance Models

The algal productivity depends on two meteorological variables: photo-synthetically active radiation (PAR) and temperature. In the case of the PV system, its productivity depends on the Global Horizontal Irradiance (GHI). Two scenarios described in [46] to perform two productivity models are used, one for the HRAP system and the other for the AS system.

2.3.1. Algal Productivity Model

A revision of models developed to estimate the algal productivity can be seen in [52]. In this work, the model performed in [53] is used, according to which the productivity P b i o _ e s t can be estimated from the difference between the specific growth rate, G , and the specific respiration rate, R . In turn, these rates can be assessed as follows [54].
G = 1 l p 0 l p μ m   x σ   I   e σ x z K I + σ   I   e σ x z d z
R   = λ r   x
The parameters of these expressions are shown in Table 2.
Where:
μ m = μ m , m a x T K I = K I , m a x T λ r = λ r , m a x T
being T the temperature-dependent function:
T = 0   if   T p T m i n   or   if   T p T m a x T = ( T p T m a x ) ( T p T m i n ) 2 ( T o p t T m i n ) [ ( T o p t T m i n ) ( T p T o p t ) ( T o p t T m a x ) ( T o p t + T m i n 2 T p ) ]   otherwise
Tmin and Tmax are the minimum and maximum temperatures, respectively. Thus, they show the minor and major thresholds for the specific growth rate; Topt is the optimum temperature for this rate.
Experimental values for these parameters have been taken from [54,55] (Table 3).
Besides, the HRAP system described in [51] is studied. The scenario 1 of this work considers a system with a total installation area of 40,000 m2 and a flow rate of 1950 m3 d−1, whose total energy consumption is 0.06 kWh m−3.

2.3.2. PV Productivity Model

PV power can be estimated from GHI and temperature using the following expression [56,57]:
P V e s t = G H I   P V i n s   P C S l o s s     S y s t e m l o s s   1 G s   T l o s s
where P V e s t is the power generation estimation, P V i n s is the PV installation capacity, P C S l o s s   are the power losses due to the power conditioning system, S y s t e m l o s s   are the losses associated to PV system, G s is the GHI at standard test conditions and T l o s s is a reduction parameter related to the PV module temperature. This last parameter can be estimated as follows:
T l o s s = 1 + α p m a x ( T a i r + Δ T 25 ) 100
where α p m a x is the temperature dependency of PV power generation, T a i r is the atmospheric temperature and Δ T is the difference in PV module temperature.
The efficiency of the system as a function of the operating time can also decrease due to a decrease in the energy efficiency of photovoltaic panels and in the efficiency of energy storage (battery consumption). However, being the study conducted for one year time, the losses of efficiency of the PV system with the operation time can been considered negligible. If the study were for more years, these losses should be included—the average annual decrease in electricity yield could be near 0.60%·yr−1 [58].
The values taken from [57] for the different parameters are shown in Table 4.
The model above described has been performed again from a scenario drawn in [51] (scenario 3 of this work, corresponding to an AS system). The flow rate is the same than in the HRAP system (1950 m3 d−1), but the total installation area is much lesser than in the algal pond system (only 900 m2 vs. 40,000 m2). The total energy consumption in this system is 0.89 kWh m3 (much higher than that of the first system). It needs to be stressed that the daily energy demand of wastewater treatment is determined by an uneven wastewater inflow and pollutant load. The weather conditions and the wastewater temperature also affect the efficiency of the wastewater aeration system (solubility of oxygen in water). So, the amount of energy needed to remove a unit of load of organic pollutants from wastewater could have been calculated in kWh per kg BOD (biological oxygen demand) that is removed from wastewater. However, in the scenarios described in [51], energy consumption is considered constant. Actually, as shown in [59], in recent biological processes, technology has lowered energy requirements, making energy consumption much more stable.

3. Results and Discussion

3.1. Installation Area Analysis

3.1.1. Installation Area Analysis in Absence of Storage

The intra-annual variability of the HRAP system productivity, along with that of the meteorological variables (PAR and temperature) affecting this productivity are shown in Figure 1. This productivity has been estimated from the model and scenario previously described (40,000 m2 of land requirements and flow rate of 1950 m3 d−1).
The seasonal variability of PAR and temperature can also be observed in the power curves. Regarding PAR, Lugo station shows more fluctuations than Tabernas station, due to the oceanic climate of the former. In this climate, precisely, the seasonal variation is less pronounced. Thus, as mentioned, the power curves under outdoor conditions are clearly affected by these climatological aspects.
On the other hand, the difference between the areas occupied by both systems (HRAP and AS system) is very large (40,000 m2 vs. 900 m2). The energy consumption of the HRAP and of the AS system is also very different (0.06 kWh m−3 vs. 0.89 kWh m−3), so the power need is much lower in the case of the algal system. In fact, the power derived from HRAP covers this consumption most of the year. However, covering the 900 m2 of the AS system with PV panels of 2 m2 with an installation capacity of 400 W (450 solar panels), the PV power never reaches this threshold.
Thus, in order to achieve self-sufficiency, the PV power must be increased and thus, the area occupied by panels. In Figure 2, the PV power obtained for different areas is shown.
As areas occupied by the PV facility increases, the number of days in which the energy consumption threshold is overcome also increases. The same as the case of power derived from biomass, the seasonal evolution, associated to climate characteristic, is evident. This evolution is more pronounced in Tabernas and has more daily fluctuations in Lugo.
In order to compare the PV powers (Figure 2) with the energy consumption threshold (0.89 kWh m−3), the probability of not achieving that threshold at least one day is estimated, according to the areas occupied by PV panels (Figure 3). This probability can serve to assess the viability of the project when a PV facility supplies the energy needed by the AS system. As observed, the decreasing slope is very pronounced for smaller areas, but later this slope strongly diminishes. This change in the slope is more abrupt in the case of Tabernas. In Figure 3, the probabilities of not achieving the corresponding HRAP energy consumption threshold (0.06 kWh m−3) have been included. These probabilities are 0.0546 for Tabernas case and 0.2077 for Lugo. In this situation, the behaviour of both systems could be considered similar, as the probabilities of not achieving the corresponding thresholds, according to the system considered (HRAP or AS system with PV power), are the same. These intersection points are obtained for 6030 m2 in Tabernas and for 6552 m2 in Lugo. Thus, these areas of PV panels are needed to obtain the same probability than in the 40,000 m2 HRAP system.

3.1.2. Installation Area Analysis Including Storage

The former study does not consider the possibility of storing the energy surplus during those days in which the corresponding energy consumption threshold is exceeded. However, this possibility must be taken into account, as it is very difficult to reach the consumption threshold every day. Thus, in this section the self-sufficiency in both analysed systems is studied assuming that the possible energy surplus of one day is available for subsequent days.

Results for HRAP System

In the case of the HRAP system, the estimated power from biomass shown in Figure 1e,f can be modified by storing the energy that overcomes 0.06 kWh m−3 and by supplying this energy those days in which the power is lower than this threshold. By this storage system, the power intra-annual evolution no longer shows values below 0.06 kWh m−3 (Figure 4).

Results for AS System with PV Panels

Similar to the variability without storage represented in Figure 2, the PV power intra-annual variability in case of storage for different PV installation areas is shown in Figure 5. The graphs show that, as area increases, the possibility that the threshold is achieved all days also increases. Indeed, for the area represented in Figure 5, this achievement is accomplished from 4000 m2 both in Tabernas and in Lugo. The daily fluctuations are again much more pronounced in Lugo than in Tabernas.
Similarly to the case without storage (Figure 3), storage may be included and the probability of not achieving the corresponding threshold at least one day according to the area occupied by PV panels may be obtained (Figure 6). This probability can serve again to assess the viability of the AS system based on PV facility. In this case, the null probability is quickly reached (for 2500 m2 in Tabernas and for 3500 m2 in Lugo) as shown in Figure 6, unlike the case without storage where this null probability is never reached, as represented in Figure 3. That is, the storage allows us to ensure that the demand is always satisfied by using much less PV area, making the project more viable. On the other hand, the probabilities of not achieving the corresponding threshold for one day in the HRAP system, when storage is used, are 0 in both stations, as all values overcome this threshold (0.06 kWh m−3) (Figure 4). Thus, 2500 m2 in Tabernas and 3500 m2 in Lugo are, precisely, the areas needed to reach the same probability than in case of 40,000 m2 HRAP system with storage. Therefore, thanks to storage, the land requirement has been greatly reduced in both locations.

3.1.3. Comparison between the Storage and the Absence of Storage Cases

The project viability based on PV power has also been assessed by three recommended exceedance probabilities (P50, P90 and P99). In Figure 7, exceedance probabilities vs. the PV installation area have been represented for both cases, with and without storage. Since the PV power increases with the area used, the exceedance probabilities also increase as this area increases.
As observed, the slopes are higher in Tabernas than in Lugo, as the power achieved by PV is clearly higher in Tabernas, with a Mediterranean climate, than in Lugo, and this is more evident as the PV installation area increases. Storage brings probabilities higher or equal than those obtained in absence of storage, as power is increased by storage. Besides, storage affects small PV power, so the lower percentiles increase with storage. Thus, there is a greater difference between both cases (storage and absence of storage) for higher exceedance probabilities, associated to lower percentiles. That is, the differences between P99s are higher than the differences between P50s.
These probabilities provide information about the system, but they do not allow us to qualify a project as viable or not viable, unlike the study based on the project self-sufficiency. To achieve self-sufficiency, the estimate of the size of a power facility is of great interest. Indeed, the PV facility installation area required to satisfy the need of energy consumption in the AS system has been above estimated (Figure 3 in absence of storage and Figure 6 with storage). According to the results, storage leads to a large diminishing in this area: in absence of storage, the probability of not achieving the energy consumption threshold is always higher than zero in both stations, while this probability is zero for 2500 m2 at Tabernas and for 3500 m2 at Lugo, when storage is considered.

3.2. Opportunity Cost Analysis

In the previous sections, space needs for self-sufficiency of two projects were assessed. However, the European Union Green Deal needs also to assess the opportunity cost of different energy sources, in special in terms of the availability and possible alternative uses of land or capital. Some green energy sources have great inconveniencies in terms of the needs of land and the loss of its alternative uses. Besides, the wastewater treatment systems proposed in the work need specific orographic conditions, such as non-steep slopes and they must not be installed in protected areas due to environmental reasons. Finally, other terrain uses must be considered, such as the profitability of a possible agriculture or livestock exploitation, which also implies benefits for farmers drawn from the diversification of income. In this sense, the fact that the optimal social and private solutions may differ must be taken into account.
The EU Green Deal aims at reaching the target of climate neutrality. Then, the energy system must be decarbonised, energy efficiency prioritised and a power sector based largely on renewable resources developed. But this objective will only be achieved by an opportunity cost analysis between alternative renewable energies. For instance, the extensive need for terrain in the HRAP projects limits their viability and convenience as compared to AS+PV—the need for land is 40,000 m2 versus less than 6500 m2. However, the prices of both systems also need to be compared. A von Thünen framework [60] is suitable for analysing economic decisions when distance from different uses of energy matters. Transport is costly and reduces the profitability of bioenergy production when the distance to the power plant increases. In this case, distance is zero, but the result obtained with the alternative supplies of energy from other possible locations could be compared, as well as the possible uses of the energy produced in these locations in other facilities or industries. Some studies compare the process which uses the combustion of biomass with that of bio crude extraction [61]. Besides, as previously mentioned, different possible uses of the installation areas could be assessed [62,63]. These price comparisons are very specific of each location and moment and, so, they need to be done by each project.
Being aware of the circumstantial character of this price analysis, an economic analysis comparing the costs associated to both analysed systems, HRAP and AS system with PV facility, has been undertaken. For HRAP case, two type of costs are considered: the capital cost and the terrain cost. The operation and maintenance cost (energy and flocculants consumption) is not included as the energy consumption is supplied by the algae itself. According to [48], the capital cost is 192.55 €/p.e. Since the system was designed to serve a population equivalent to 10,000 p.e. the total capital cost will be 1,925,500 €. The terrain cost is also different according to the site considered (71.9 €/m2 at Lugo and 150.8 €/m2 at Tabernas according to the Spanish Official Statistics, http://www.fomento.es/be2/, accessed on 1 September 2020). As regards to the AS system with PV facility, according to [24], the AS construction costs are typically 70% higher than those of HRAPs, so the capital costs may be established in 6,418,333 €. On the other hand, the capital and operation cost of PV is 350 €/m2 (an average estimation of the one offered in [64]). Additionally, the terrain cost must be added. Finally, the economic storage pack cost is included, that according to [65] can be estimated in 200 €/kWh of the battery energy storage systems. For the case of Lugo, the need of storage for 3500 m2 is of 94.7 kWh, while in Tabernas for 2500 m2 this need is of 81.1 kWh. The costs obtained for both systems are shown in Table 5:
As shown, the total cost in the HRAP system is clearly lesser than in the AS + PV system in absence of storage. The difference is mainly due to the important capital cost of AS, although the difference in the terrain cost is, especially in Tabernas, very high, something that affects more the cost of the HRAP system. On the other hand, the presence of storage allows for a significant reduction of the costs of the PV facility. For example, in the case of Tabernas, although the HRAP system is 15.7% less costly than the AS + PV system, storage makes it more costly in a 3.5%. Indeed, storage provides a great advantage for using the AS + PV in locations where a lot of irradiance is available, as is the case with Tabernas. The existence of a threshold of irradiance may be needed so as to improve the costs of the AS + PV as compared to HRAP.
Then, the previous considerations about disadvantages linked to large land requirements of HRAP system seem to be balanced out by the little requirement of capital linked to HRAP. As shown, this opportunity cost analysis is then essential for a better assessment of different energy sources.

4. Conclusions

The present study concludes that the energy consumption is much smaller for HRAPs than for AS systems, where PV power is needed to supplement energy. However, HRAPs has much larger land requirements. Besides, storage reduces significantly the cost of the PV facility, providing a great advantage for the use of AS + PV in locations where a lot of irradiance is available. This study shows that climate characteristics are crucial for projects viability (the evolution of PV power according to seasonal evolution is more pronounced in Tabernas and has more daily fluctuations in Lugo). However, land prices should be compared, as well as the distance from different uses of energy. Here, a comparison of the total cost of the HRAP system with that of AS + PV has been made, showing that the latter is higher due to the important capital costs associated to AS, in spite of the fact that land requirements lead to a significant increase in the cost of the HRAP system. Another insight of the article is that PV power exceedance probabilities increase with the PV installation area, and that the probability differences between situations with storage and without storage increase for higher exceedance probabilities. These probabilities do not allow to qualify a project as viable or not, unlike the study based on the project self-sufficiency. In short, the opportunity cost analysis is essential for a better assessment and understanding of different energy sources. For future works, other renewable sources, such as the small wind energy, will be studied.

Author Contributions

Conceptualization, J.M.V., E.T.; investigation, J.M.V., E.T., A.S.-B.; writing—original draft preparation, J.M.V., E.T.; writing—review and editing, J.M.V., E.T., A.S.-B.; supervision, J.M.V., E.T., A.S.-B. All authors have read and agreed to the published version of the manuscript.

Funding

This work was funded by the Ministry of Economy, Industry and Competitiveness (MINECO) (Project CGL2016-79284-P AEI/FEDER/UE).

Institutional Review Board Statement

Not applicable.

Informed Consent Statement

Not applicable.

Data Availability Statement

Not applicable.

Acknowledgments

The authors gratefully acknowledge the Santiago de Compostela University for maintaining the Lugo station, the Solar Platform of Almería-CIEMAT for maintaining the Tabernas station and Francisco Ferrera-Cobos, from CIEMAT, for checking the functioning of both stations. Likewise, the authors want to thank the Autonomous Community of Madrid (Spain) and the FEDER “A way of making Europe” ALGATEC-CM (P2018/BAA-4532), Spanish Ministry of Economic and Competitiveness (CGL2016-79284-P AEI/FEDER/UE). We also acknowledge the contribution of GESCE-URJC and TRANS-REAL LAB-UVA.

Conflicts of Interest

The authors declare no conflict of interest.

References

  1. Sánchez-Bayón, A. Renewal of business & economic thought after the globalization. Bajo Palabra 2020, 24, 293–318. [Google Scholar] [CrossRef]
  2. European Commission. The European Green Deal COM/2019/640 Final. Available online: https://eur-lex.europa.eu/legal-content/EN/TXT/?uri=COM%3A2019%3A640%3AFIN (accessed on 15 November 2020).
  3. Heredia Yzquierdo, J.; Sánchez-Bayón, A. The European transition to a green energy production model. Italian feed-in tariffs scheme & Trentino Alto Adige mini wind farms case study. Small Bus. Int. Rev. 2020, 4, 39–52. [Google Scholar] [CrossRef]
  4. Pitas, V.; Fazekas, B.; Banyai, Z.; Karpati, A. Energy efficiency of the municipal wastewater treatment. J. Biotechnol. 2010, 150, 163–164. [Google Scholar] [CrossRef]
  5. Gu, Y.; Li, Y.; Li, X.; Luo, P.; Wang, H.; Wang, X.; Wu, J.; Li, F. Energy self-sufficient wastewater treatment plants: Feasibilities and challenges. Energy Procedia 2017, 105, 3741–3751. [Google Scholar] [CrossRef]
  6. Li, Z.H.; Zou, Z.H.; Wang, L.P. Analysis and Forecasting of the Energy Consumption in Wastewater Treatment Plant. Math. Probl. Eng. 2019, 2019. [Google Scholar] [CrossRef] [Green Version]
  7. Ge, H.; Batstone, D.J.; Keller, J. Operating aerobic wastewater treatment at very short sludge ages enables treatment and energy recovery through anaerobic sludge digestion. Water Res. 2013, 47, 6546–6557. [Google Scholar] [CrossRef]
  8. Michałkiewicz, M. Comparison of Wastewater Treatment Plants Based on the Emissions of Microbiological Contaminants. Environ. Monit. Assess. 2018, 190, 680. [Google Scholar] [CrossRef] [Green Version]
  9. Orhon, D. Evolution of the activated sludge process: The first 50 years. J. Chem. Technol. Biotechnol. 2015, 90, 608–640. [Google Scholar] [CrossRef]
  10. Park, J.B.K.; Craggs, R.J. Algal production in wastewater treatment high rate algal ponds for potential biofuel use. Water Sci. Technol. 2011, 63, 2403–2410. [Google Scholar] [CrossRef]
  11. Craggs, R.J.; Sutherland, D.; Campbell, H. Hectare-scale demonstration of high rate algal ponds for enhanced wastewater treatment and biofuel production. J. Appl. Phycol. 2012, 24, 329–337. [Google Scholar] [CrossRef]
  12. Mehrabadi, A.; Craggs, R.; Farid, M.H. Wastewater Treatment High Rate Algal Ponds (Wwt Hrap) for Low-Cost Biofuel Production. Bioresour. Technol. 2015, 184, 202–214. [Google Scholar] [CrossRef]
  13. Maity, J.P.; Hou, C.P.; Majumder, D.; Bundschuh, J.; Kulp, T.R.; Chen, C.-Y.; Chuang, L.-T.; Chen, C.-N.N.; Jean, J.-S.; Yang, T.-C.; et al. The production of biofuel and bioelectricity associated with wastewater treatment by green algae. Energy 2014, 78, 94–103. [Google Scholar] [CrossRef]
  14. Ansari, F.A.; Singh, P.; Guldhe, A.; Bux, F. Microalgal cultivation using aquaculture wastewater: Integrated biomass generation and nutrient remediation. Algal Res. 2017, 21, 169–177. [Google Scholar] [CrossRef]
  15. Guldhe, A.; Ansari, F.A.; Singh, P.; Bux, F. Heterotrophic cultivation of microalgae using aquaculture wastewater: A biorefinery concept for biomass production and nutrient remediation. Ecol. Eng. 2017, 99, 47–53. [Google Scholar] [CrossRef]
  16. Garcia-Martinez, J.B.; Urbina-Suarez, N.A.; Zuorro, A.; Barajas-Solano, A.F.; Kafarov, V. Fisheries Wastewater as a Sustainable Media for the Production of Algae-Based Products. Chem. Eng. Trans. 2019, 76, 1339–1344. [Google Scholar]
  17. Quintero-Dallos, V.; García-Martínez, J.B.; Contreras-Ropero, J.E.; Barajas-Solano, A.F.; Barajas-Ferrerira, C.; Lavecchia, R.; Zuorro, A. Vinasse as a Sustainable Medium for the Production of Chlorella vulgaris UTEX 1803. Water 2019, 11, 1526. [Google Scholar] [CrossRef] [Green Version]
  18. Goswami, R.K.; Mehariya, S.; Verma, P.; Lavecchia, R.; Zuorro, A. Microalgae-based biorefineries for sustainable resource recovery from wastewater. J. Water Process. Eng. 2021, 40, 101747. [Google Scholar] [CrossRef]
  19. Fonseca, A.; Calijuri, M.L.; Assemany, P.; Calijuri, M.C.; Dos Reis, A. Algal biomass production and wastewater treatment in high rate algal ponds receiving disinfected effluent. Environ. Technol. 2013, 34, 1877–1885. [Google Scholar]
  20. Pienkos, P.T. BETO, Project Peer Review Algal Biomass Conversion WBS 1.3.4.201, Advanced Algal Systems B, 8 March 2017; NREL: Washington, DC, USA, 2017.
  21. Kurano, N.; Ikemoto, H.; Miyashita, H.; Hasegawa, T.; Hata, H.; Miyachi, S. Fixation and Utilization of Carbon Dioxide by Microalgal Photosynthesis. Energy Convers. Manag. 1995, 36, 689–692. [Google Scholar] [CrossRef]
  22. Razzak, S.A.; Ali, S.A.M.; Hossain, M.M.; de Lasa, H. Biological CO2 fixation with production of microalgae in wastewater—A review. Renew. Sustain. Energy Rev. 2017, 76, 379–390. [Google Scholar] [CrossRef]
  23. Lyon, S.R.; Ahmadzadeh, H.; Murry, M.A. Algae-Based Wastewater Treatment for Biofuel Production: Processes, Species, and Extraction Methods. In Biomass and Biofuels from Microalgae. Biofuel and Biorefinery Technologies; Moheimani, N., McHenry, M., de Boer, K., Bahri, P., Eds.; Springer: Cham, Switzerland, 2015; Volume 2, pp. 95–115. [Google Scholar]
  24. Maktabifard, M.; Zaborowska, E.; Makinia, J. Achieving energy neutrality in wastewater treatment plants through energy savings and enhancing renewable energy production. Rev. Environ. Sci. Biotechnol. 2018, 17, 655–689. [Google Scholar] [CrossRef] [Green Version]
  25. Abdel-Raouf, N.; Al-Homaidan, A.A.; Ibraheem, I.B. Microalgae and wastewater treatment. Saudi J. Biol. Sci. 2012, 19, 257–275. [Google Scholar] [CrossRef] [PubMed] [Green Version]
  26. Patel, A.; Barrington, S.; Lefsrud, M. Microalgae for phosphorus removal and biomass production: A six species screen for dual-purpose organisms. GCB Bioenergy 2012, 4, 485–495. [Google Scholar] [CrossRef]
  27. DOE—U.S. Department of Energy. National Algal Biofuels Technology Review; U.S. Department of Energy, Office of Energy Efficiency and Renewable Energy, Bioenergy Technologies Office: Washington, DC, USA, 2016.
  28. Shilton, A.; Mara, D.; Craggs, R.; Powell, N. Solar-powered aeration and disinfection, anaerobic co-digestion, biological CO2 scrubbing and biofuel production: The energy and carbon management opportunities of waste stabilisation ponds. Water Sci. Technol. 2008, 58, 253–258. [Google Scholar] [CrossRef]
  29. Woertz, I.; Fulton, L.; Lundquist, T. Nutrient removal & greenhouse gas abatement with CO2 supplemented algal high rate ponds. Proc. Water Environ. Fed. 2009, 2009, 7924–7936. [Google Scholar]
  30. Craggs, R.; Heubeck, S.; Lundquist, T.; Benemann, J. Algal biofuels from wastewater treatment high rate algal ponds. Water Sci. Technol. 2011, 63, 660–665. [Google Scholar] [CrossRef] [PubMed]
  31. Acién, F.G.; Gómez-Serrano, C.; Morales-Amaral, M.; Fernández Sevilla, J.; Molina-Grima, E. Wastewater treatment using microalgae: How realistic a contribution might it be to significant urban wastewater treatment? Appl. Microbiol. Biotechnol. 2016, 100, 9013–9022. [Google Scholar] [CrossRef]
  32. Oswald, W.J. Micro-algae and waste-water treatment. In Micro-Algal Biotechnology; Borowitzka, M.A., Borowitzka, L.J., Eds.; Cambridge University Press: Cambridge, UK, 1988; pp. 305–328. [Google Scholar]
  33. Green, F.B.; Lundquist, T.J.; Oswald, W.J. Energetics of advanced integrated wastewater pond systems. Water Sci. Technol. 1995, 31, 9–20. [Google Scholar] [CrossRef]
  34. Downing, J.B.; Bracco, E.; Green, F.B.; Ku, A.Y.; Lundquist, T.J.; Zubieta, I.X.; Oswald, W. Low cost reclamation using the advanced integrated wastewater pond systems technology and reverse osmosis. Water Sci. Technol. 2002, 45, 117–125. [Google Scholar] [CrossRef]
  35. Nordlander, E.; Olsson, J.; Thorin, E.; Yan, J. Simulation of energy balance and carbon dioxide emission for microalgae introduction in wastewater treatment plants. Algal Res. 2017, 24, 251–260. [Google Scholar] [CrossRef] [Green Version]
  36. Garcia, J.; Green, B.; Lundquist, T.; Mujeriego, R.; Hernández-Mariné, M.; Oswald, W. Long term diurnal variations in contaminant removal in high rate ponds treating urban wastewater. Bioresour. Technol. 2006, 97, 1709–1715. [Google Scholar] [CrossRef] [PubMed]
  37. Wang, C.; Wang, Z.; Wang, P.; Zhang, S. Multiple Effects of Environmental Factors on Algal Growth and Nutrient Thresholds for Harmful Algal Blooms: Application of Response Surface Methodology. Environ. Model. Assess. 2016, 21, 247–259. [Google Scholar] [CrossRef]
  38. Singh, S.P.; Singh, P. Effect of temperature and light on the growth of algae species: A review. Renew. Sustain. Energy Rev. 2015, 50, 431–444. [Google Scholar] [CrossRef]
  39. Gonçalves, A.L.; Pires, J.C.M.; Simões, M. The effects of light and temperature on microalgal growth and nutrient removal: An experimental and mathematical approach. RSC Adv. 2016, 6, 22896–22907. [Google Scholar] [CrossRef] [Green Version]
  40. Dobos, A.; Gilman, P.; Kasberg, M. P50/P90 analysis for solar energy systems using the system advisor model. In Proceedings of the World Renewable Energy Forum, Denver, CO, USA, 13–17 May 2012; pp. 1–6. [Google Scholar]
  41. McMahan, A.C.; Grover, C.N.; Vignola, F. Chapter 4—Evaluation of Resource Risk in Solar-Project Financing. In Solar Energy Forecasting and Resource Assessment; Kleissl, J., Ed.; Academic Press: Cambridge, MA, USA, 2013; pp. 81–95. [Google Scholar]
  42. Fernández Peruchena, C.M.; Ramírez, L.; Silva, M.; Lara, V.; Bermejo, D.; Gastón, M.; Moreno-Tejera, S.; Pulgar, J.; Liria, J.; Macías, S.; et al. A statistical characterization of the long-term solar resource: Towards risk assessment for solar power projects. Sol. Energy 2016, 123, 29–39. [Google Scholar] [CrossRef]
  43. Rating Criteria for Solar Power Projects, Utility-Scale Photovoltaic and Concentrating Solar Power; Fitch Ratings: New York, NY, USA, 2011.
  44. Barzegkar-Ntovoma, G.A.; Chatzigeorgioub, N.G.; Nousdilisc, A.I.; Vomva, S.A.; Kryonidis, G.C.; Kontis, E.O.; Georghiou, G.E.; Christoforidis, G.C.; Papagiannis, G.K. Assessing the viability of Battery Energy Storage Systems coupled with Photovoltaics under a pure self-consumption scheme. Renew. Energy 2020, 152, 1302–1309. [Google Scholar] [CrossRef] [Green Version]
  45. Hoppmann, J.; Volland, J.; Schmidt, T.S.; Hoffmann, V.H. The Economic Viability of Battery Storage for Residential Solar Photovoltaic Systems—A Review and a Simulation Model. Renew. Sustain. Energy Rev. 2014, 39, 1101–1118. [Google Scholar] [CrossRef]
  46. Georgescu-Roegen, N. The Entropy Law and the Economic Process; Harvard University Press: Cambridge, MA, USA, 1971. [Google Scholar]
  47. Ashby, A.; Callegaro, A.M.; Adeyeye, K.; Granados, M. The Spiral Economy: A Socially Progressive Circular Economy Model? In Sustainable Development Goals and Sustainable Supply Chains in the Post-Global Economy. Greening of Industry Networks Studies; Yakovleva, N., Frei, R., Rama Murthy, S., Eds.; Springer: Cham, Switzerland, 2019; Volume 7. [Google Scholar]
  48. Gu, X.; Lai, C.; Liu, F.; Yang, W.; Hou, Y.; Zhan, S. A conductive interwoven bamboo carbon fiber membrane for Li–S. batteries, J. Mater. Chem. A 2015, 3, 9502–9509. [Google Scholar] [CrossRef] [Green Version]
  49. Lv, W.; Wen, F.; Xiang, J.; Zhao, J.; Li, L.; Wang, L.; Liu, Z.; Tian, Y. Peanut shell derived hard carbon as ultralong cycling anodes for lithium and sodium batteries. Electrochim. Acta 2015, 176, 533–541. [Google Scholar] [CrossRef]
  50. Tang, W.; Zhang, Y.; Zhong, Y.; Shen, T.; Wang, S.; Xia, X.; Tu, J. Natural Biomass-Derived Carbons for Electrochemical Energy Storage. Mater. Res. Bull. 2017, 88, 234–241. [Google Scholar] [CrossRef]
  51. Arashiro, L.T.; Montero, N.; Ferrer, I.; Acién, F.G.; Gómez, C.; Garfí, M. Life Cycle Assessment of high rate algal ponds for wastewater treatment and resource recovery. Sci. Total Environ. 2018, 622–623, 1118–1130. [Google Scholar] [CrossRef] [PubMed] [Green Version]
  52. Béchet, Q.; Shilton, A.; Guieysse, B. Modeling the effects of light and temperature on algae growth: State of the art and critical assessment for productivity prediction during outdoor cultivation. Biotechnol. Adv. 2013, 31, 1648–1663. [Google Scholar] [CrossRef]
  53. De-Luca, R.; Bezzo, F.; Béchet, Q.; Bernard, O. Meteorological data-based optimal control strategy for microalgae cultivation in open pond systems. Complexity 2019, 2019, 4363895. [Google Scholar] [CrossRef]
  54. Béchet, Q.; Chambonniere, P.; Shilton, A.; Guizard, G.; Guieysse, B. Algal productivity modeling: A step toward accurate assessments of full-scale algal cultivation. Biotechnol. Bioeng. 2015, 112, 987–996. [Google Scholar] [CrossRef] [PubMed]
  55. Bernard, O.; Rémond, B. Validation of a simple model accounting for light and temperature effect on microalgal growth. Bioresour. Technol. 2012, 123, 520–527. [Google Scholar] [CrossRef] [PubMed]
  56. Kawajiri, K.; Oozeki, T.; Genchi, Y. Effect of temperature on PV potential in the world. Environ. Sci. Technol. 2011, 45, 9030–9035. [Google Scholar] [CrossRef] [PubMed]
  57. Ohtake, H.; Uno, F.; Oozeki, T.; Yamada, Y.; Takenake, H.; Nakajima, T.Y. Estimation of satellite-derived regional photovoltaic power generation using a satellite-estimated solar radiation data. Energy Sci. Eng. 2018, 6, 570–583. [Google Scholar] [CrossRef]
  58. Knutel, B.; Pierzyńska, A.; Dębowski, M.; Bukowski, P.; Dyjakon, A. Assessment of Energy Storage from Photovoltaic Installations in Poland Using Batteries or Hydrogen. Energies 2020, 13, 4023. [Google Scholar] [CrossRef]
  59. Capodaglio, A.; Olsson, G. Energy Issues in Sustainable Urban Wastewater Management: Use, Demand Reduction and Recovery in the Urban Water Cycle. Sustainability 2019, 12, 266. [Google Scholar] [CrossRef] [Green Version]
  60. Von Thünen, J. The Isolated State in Relation to Agriculture and Political Economy; Palgrave Macmillan: London, UK, 2009. [Google Scholar]
  61. Ramos Tercero, E.A.; Sforza, E.; Bertucco, A. Energy Profitability Analysis for Microalgal Biocrude Production. Energy 2013, 60, 373–379. [Google Scholar] [CrossRef]
  62. Walsh, M.; de la Torre, D.; Shapouri, H.; Slinksky, S. Bioenergy crop production in the United States. Environ. Resour. Econ. 2003, 24, 313–333. [Google Scholar] [CrossRef]
  63. Lankoski, J.; Ollikainen, M. Bioenergy Crop Production and Climate Policies: A von Thunen Model and the Case of Reed Canary Grass in Finland. Eur. Rev. Agric. Econ. 2008, 35, 519–546. [Google Scholar] [CrossRef]
  64. Selectra. Available online: https://selectra.es/autoconsumo/info/instalacion (accessed on 5 October 2020).
  65. Litjens, G.B.M.A.; Worrell, E.; van Sark, W.G.J.H.M. Economic benefits of combining self-consumption enhancement with frequency restoration reserves provision by photovoltaic-battery systems. Appl. Energy 2018, 223, 172–187. [Google Scholar] [CrossRef]
Figure 1. Temporal evolution of: PAR (a,b); Temperature (c,d); Power from biomass estimated along with HRAP energy consumption (0.06 kWh m−3) (e,f).
Energies 14 01994 g001
Figure 2. PV power for different areas; the energy consumption threshold (0.89 kWh m−3) is included.
Energies 14 01994 g002
Figure 3. Probability of not meeting the energy consumption threshold at least one day.
Energies 14 01994 g003
Figure 4. Temporal evolution of power from biomass using storage along with energy consumption (0.06 kWh m−3).
Energies 14 01994 g004
Figure 5. PV power for different areas considering storage; the energy consumption threshold is included (0.89 kWh m−3).
Energies 14 01994 g005
Figure 6. Probability of not meeting the energy consumption threshold considering storage.
Energies 14 01994 g006
Figure 7. Exceedance probabilities according to the PV installation area.
Energies 14 01994 g007
Table 1. Measurement stations.
StationCoordinatesClimate
Tabernas37.09° N2.35° WArid Mediterranean
Lugo42.99° N7.54° WOceanic
Table 2. Productivity model parameters.
ParameterUnitsDescription
z mlocal depth
σ m2 kg−1extinction coefficient
μ m s−1specific growth rate
I W m−2Photo-synthetically active radiation at the pond top surface
K I W kg−1half-saturation parameter
l p mpond depth
T p °Cpond temperature
x Kg m−3biomass concentration
λ r s−1respiration coefficient
Table 3. Experimental parameters.
x
(kg m3)
l p
(m)
σ
(m2 kg1)
T m i n
(°C)
T m a x
(°C)
T o p t
(°C)
μ m , m a x
(s−1)
K I , m a x
(W kg−1)
λ r , m a x
(s−1)
0.40.3120−1042.135.86.48 × 10−57192.922.01 × 10−6
Table 4. Estimation of parameters for PV productivity model.
ParameterUnitsEstimation
P C S l o s s 0.95
S y s t e m l o s s 0.95
G s kW m21.0
α p m a x %−0.485
Δ T °C20.0
Table 5. Economic costs for the systems and stations considered (with storage and without storage).
SystemStationStorageArea
(m2)
Capital Cost of HRAP or AS (€)Capital and Operation Cost of PV (€)Storage Pack Cost (€)Terrain Cost (€)Total Cost (€)
HRAPLugoNo40,0001,925,500 2,876,0004,801,500
TabernasNo40,0001,925,500 6,032,0007,957,500
AS + PVLugoNo65526,418,3332,293,200 471,0899,182,622
Yes35006,418,3331,225,00018,940251,6507,913,923
TabernasNo60306,418,3332,110,500 909,3249,438,157
Yes25006,418,333875,00016,220377,0007,686,553
Publisher’s Note: MDPI stays neutral with regard to jurisdictional claims in published maps and institutional affiliations.

