1. Introduction
Measurement of displacements may be useful in many various fields. Because it is based on point-wise measurements, they offer solutions to relatively simple problems. One of the uses of the method could be in the medical field. The new application of digital image correlation (DIC), proposed in this paper, is to detect micro-shifts in the skin caused by pulsation of the underlying veins. The most important methods currently used for precise vein imaging are—Magnetic Resonance Angiography (MRA) methods, hyperspectral imaging methods (data captured in the range 900–1700 nm) and ultrasound imaging methods. However, mainly due to cost reasons, near infrared (NIR) with a wavelength from 740 nm to 760 nm imaging is the most popular method [
1]. Use of vein finders minimalizes the risk of pre-analytical error, reduces potential pain of patient and is fast to perform. This method is based on the fact that hemoglobin absorbs the light emitted by diodes. Hemoglobin is composed of protein and iron containing compounds. The main function of hemoglobin is to transport blood rich in oxygen (O
) from lungs to all tissues of the body and blood rich in carbon dioxide (CO
) in the opposite direction [
2]. It is also worth to mention that blood rich in oxygen will be transparent for NIR and will not visualize arteries. With the help of vein detector, it is possible to observe veins under the skin, as it appears in darker colors than background.
Medical diagnostics play a key role in the process of disease recognition. To provide the patient with the best quality medical care, it is important to plan the diagnostic procedure properly, starting with the sample. Blood is an extremely important source of information about the patient; therefore, it is most often used in diagnostic tests as a sample. Blood collection is an invasive method, so it is extremely important to choose veins accurately, so the patient experiences the least discomfort during the procedure. To obtain reliable information about a patient, samples should be taken in an appropriate manner, in order to reflect actual state of the patient. Many previous studies reported that there is a high percentage of error in blood sample collection. That is why it is extremely important to ensure proper preparation of the pre-analytical phase [
3,
4]. Peripheral venous access is very frequently performed procedure in hospitals. There are over 1 billion venipunctures performed every day, to obtain blood sample for testing. This procedure may be time-consuming and difficult in various groups of patients, such as neonates, children, obese patients, or patients after difficult, long treatment for example, chemotherapy. Venipuncture involves piercing a vein with a needle that makes it possible to draw it. This procedure can lead to patient stress, pain, and other unwanted reactions. Failures during blood collection can cause various types of complications, including thrombosis [
5,
6]. Such events can lead to court hearings in extreme cases because patients can hold people responsible for health damage. To locate a vein, a compression band and a gentle knock are usually used around the elbow joint. Locating vein is not easy due to various factors such as skin color, obesity, and dehydration of patients.
First attempts to use vein detectors were back in early 2000 [
7]. A device, the Luminetx VeinViewer (LVV), produced by Luminetx Corp was tested. The aim of the work was to test whether LVV would be helpful in detecting feeder veins in various conditions and situations, especially in patients with telangiectasia. Device allowed localization of bigger number of veins than naked eye would, because feeder veins are too deep. Treating this disease was reliant on experience of physician, which is not a pleasant situation. LVV was compared to another device and showed a higher resolution and sensitivity. LVV proved to be an excellent device, however, the research was conducted on a relatively small group of 23 patients.
Along with globally increasing health awareness, the authors of [
8] had the idea of developing an application that would allow mobile devices, such as smartphones or tablets, to act as vein detectors with the use of NIR. Considering the importance of portable devices in everyday life, it had a good chance of being successful. Nevertheless, it should be considered that the use of devices such as telephones is not a fairly reliable reference point from a medical point of view. Most applications that are now used to take care of health have not been tested for their effectiveness and reliable value of the results obtained. During their work they used vein detectors available on the market and had valuable clinical reviews. High cost and efficacy of studied vein detectors were not always as good as would be required. There were also several other problems with vein detectors and their evaluation. Most of the research was performed on small, homogenous groups which did not allow them to draw clear conclusions in the context of a larger, diverse population. Cost-effectiveness is one of the biggest problems for vein detectors. Those devices are not cheap themselves. They may even cost a few hundred dollars and they require trained personnel to use them. Preparations and training are also time consuming and cost money.
On the contrary, the authors of [
9] created a device characterized by high-intensity and low-leak light source, near-infrared CMOS camera and a small and light one-eye head mounted display. With the use of these technologies, they could visualize veins at a depth of 67 mm. This allowed the performance of several venous interventions with a low chance of failure.
The authors of [
10] also developed their version of vein detectors with the use of NIR. They used a CCD camera but were obliged to eliminate the cut-off filter to gain access to the infrared part of radiation spectrum. Source of light used to develop their detector were Infrared LEDs. Obtained images in resolution of 640 × 480 were then transferred to computer. Images were then processed with the use of several algorithms and programs, including LabVIEW. Proposed system managed to obtain vein images; however, they were not at the highest quality and indicated the need of future improvements in both software and hardware. Authors also pointed out that the vein detecting systems in general have difficulties with vein detection in people with many tattoos that blocked the transmission of light.
Despite many advantages, vein detectors also have disadvantages. One of which is the cost of devices and their portability. These facts can encourage researchers to continue their work to improve the devices and create reliable cost-effective and efficient vein finders for medical applications. It is also an area where roads of medics and biomedical engineers may cross. The concept of vein finders may seem to be simple, however, there are a lot of factors which hinder the task of creating the best one—to combine high quality devices with attractive price. The growth of interest in vein detectors led various producers to create their own devices.
Most of the vein detection methods based on image processing algorithms relate to biometrics. The use of the finger venous system due to its individual uniqueness. Biometric security features are much more effective than passwords or Personal Identification Numbers (PINs). Therefore, the authors of [
11] proposed a method recognizing the venous pattern of the finger. The authors used algorithm based on gradient correlation. The proposed method consists in obtaining a high-quality image, which is then processed and stored in the database. The result of such operations is then compared with the pattern. Based on the arrangement of the finger veins, access can therefore be allocated or denied.
The authors of [
12] used infrared images to detect finger veins. The method they proposed used the Gabor filter and the SIFT feature. It is characterized by a low error rate (below 0.5%). However, this method only focuses on the detection of the finger veins.
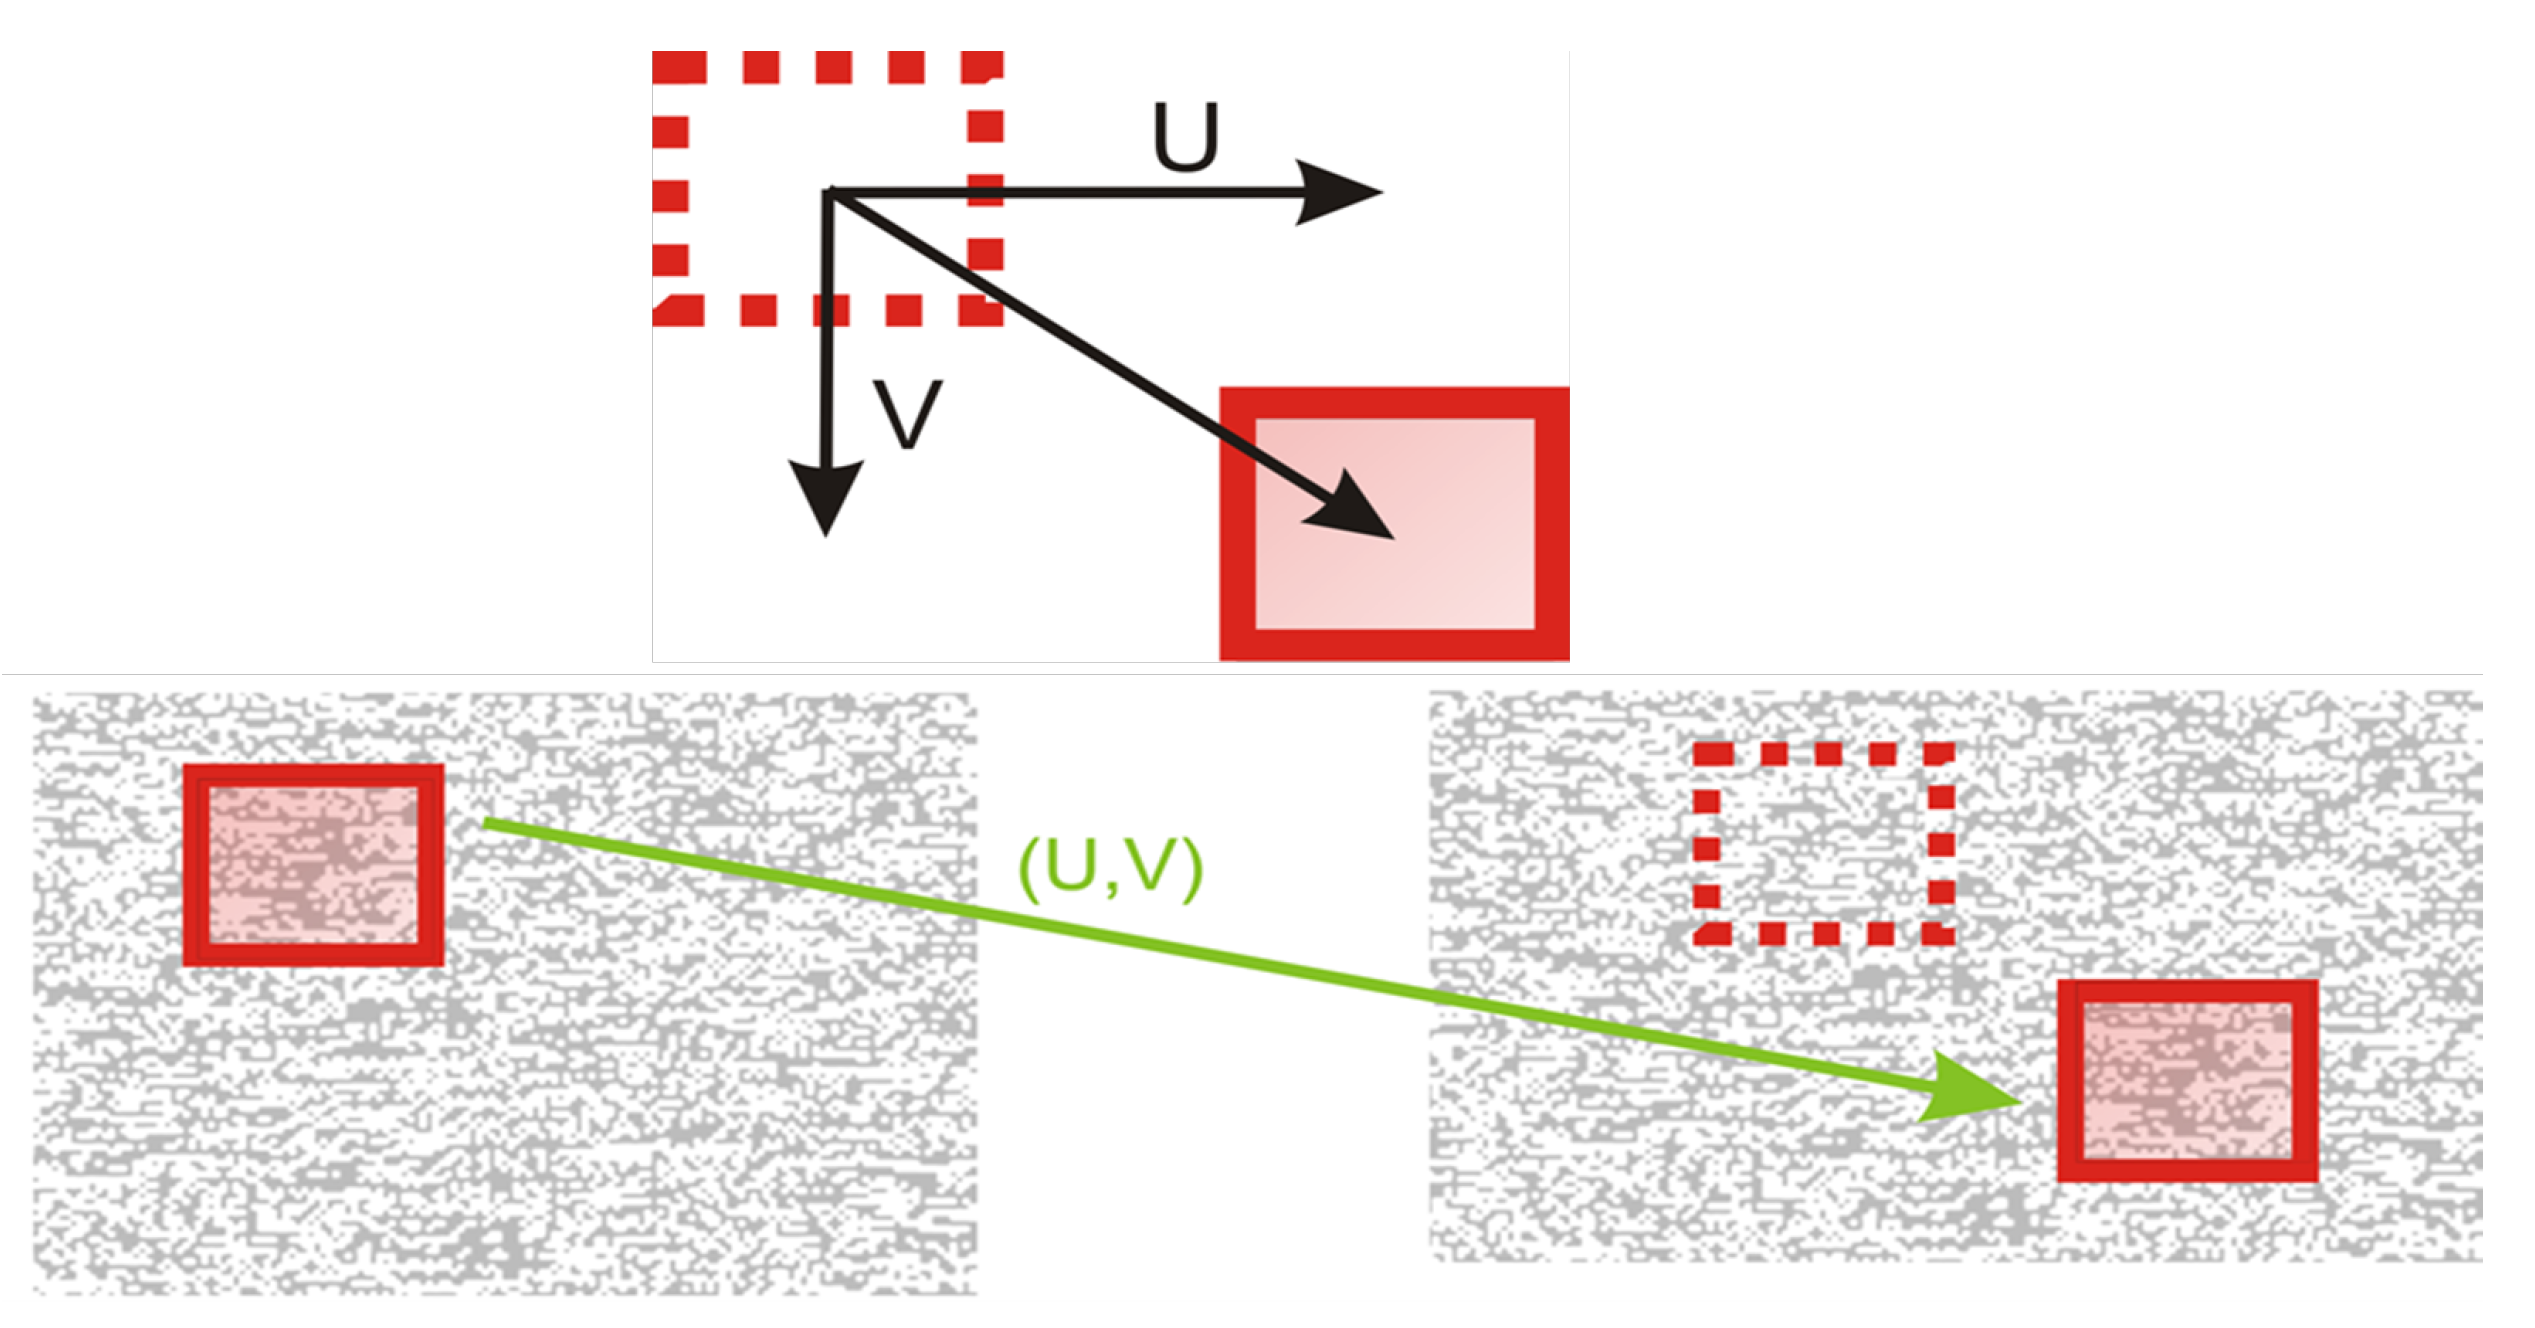
This is why the field needs to be more deeply explored and novel solutions need to be proposed. Most of the known solutions are based on the use of NIR, which automatically makes it necessary to have an illuminator and a camera working with such a wavelength of light. Looking for the cheapest solution that does not require any additional hardware components and is easily accessible to as many potential users as possible, our team decided to use a technique unique in this field—the correlation of images obtained with a camera of a typical mobile phone. The main idea of the method is based on the comparison of two images taken within a small amount of time, to capture skin deformation caused by blood flow. It is possible to increase the resolution of this method with the use of sub-pixel information calculations. There are many algorithms that allow this kind of calculation. One of the methods used for many years is the basic theory of digital image correlation (DIC), which enables the determination of image motion, distortions, or cracks. The theoretical accuracy of sub-pixel methods is well known; however, little is known about its real accuracy [
13]. The goal of the research is to locate veins with the use of a camera directed at the examined limb. This allows observation of skin pulsations during blood flow through the veins. However, we should take into consideration the fact that it is impossible to keep a limb perfectly immobilized—the human body naturally shakes, which influences the quality of the obtained pictures. Regardless, it is possible to indicate pictures on which there are visible veins.
3. Methodology Improvements and Results
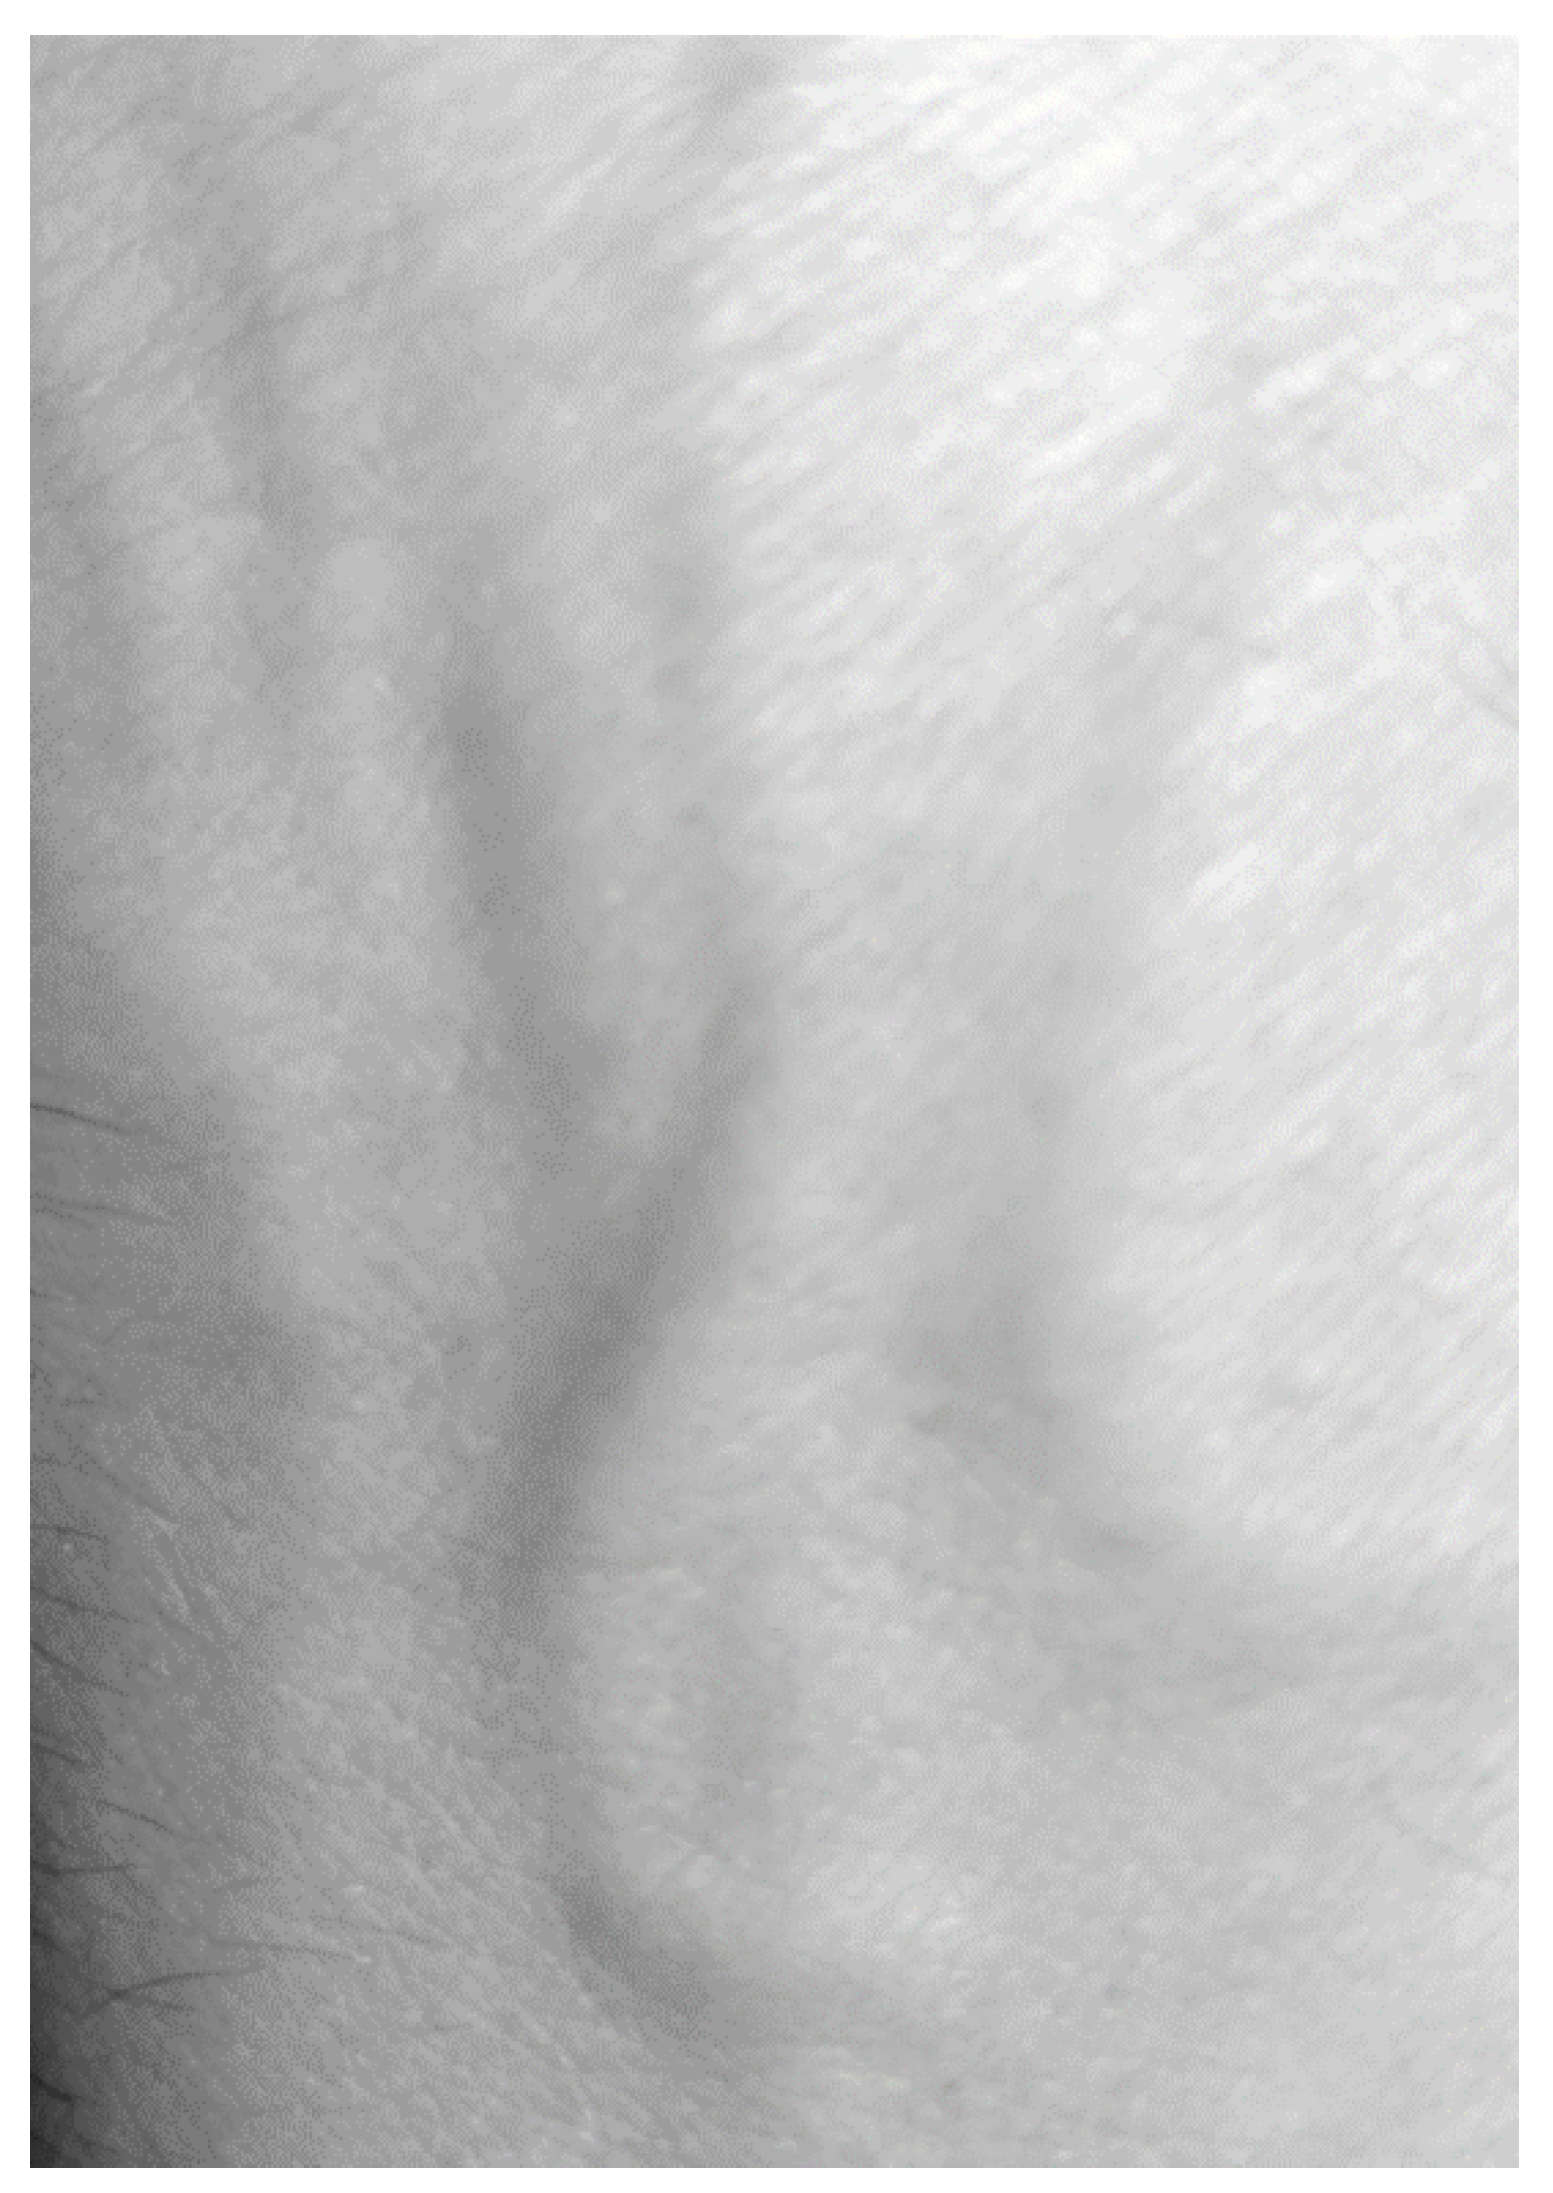
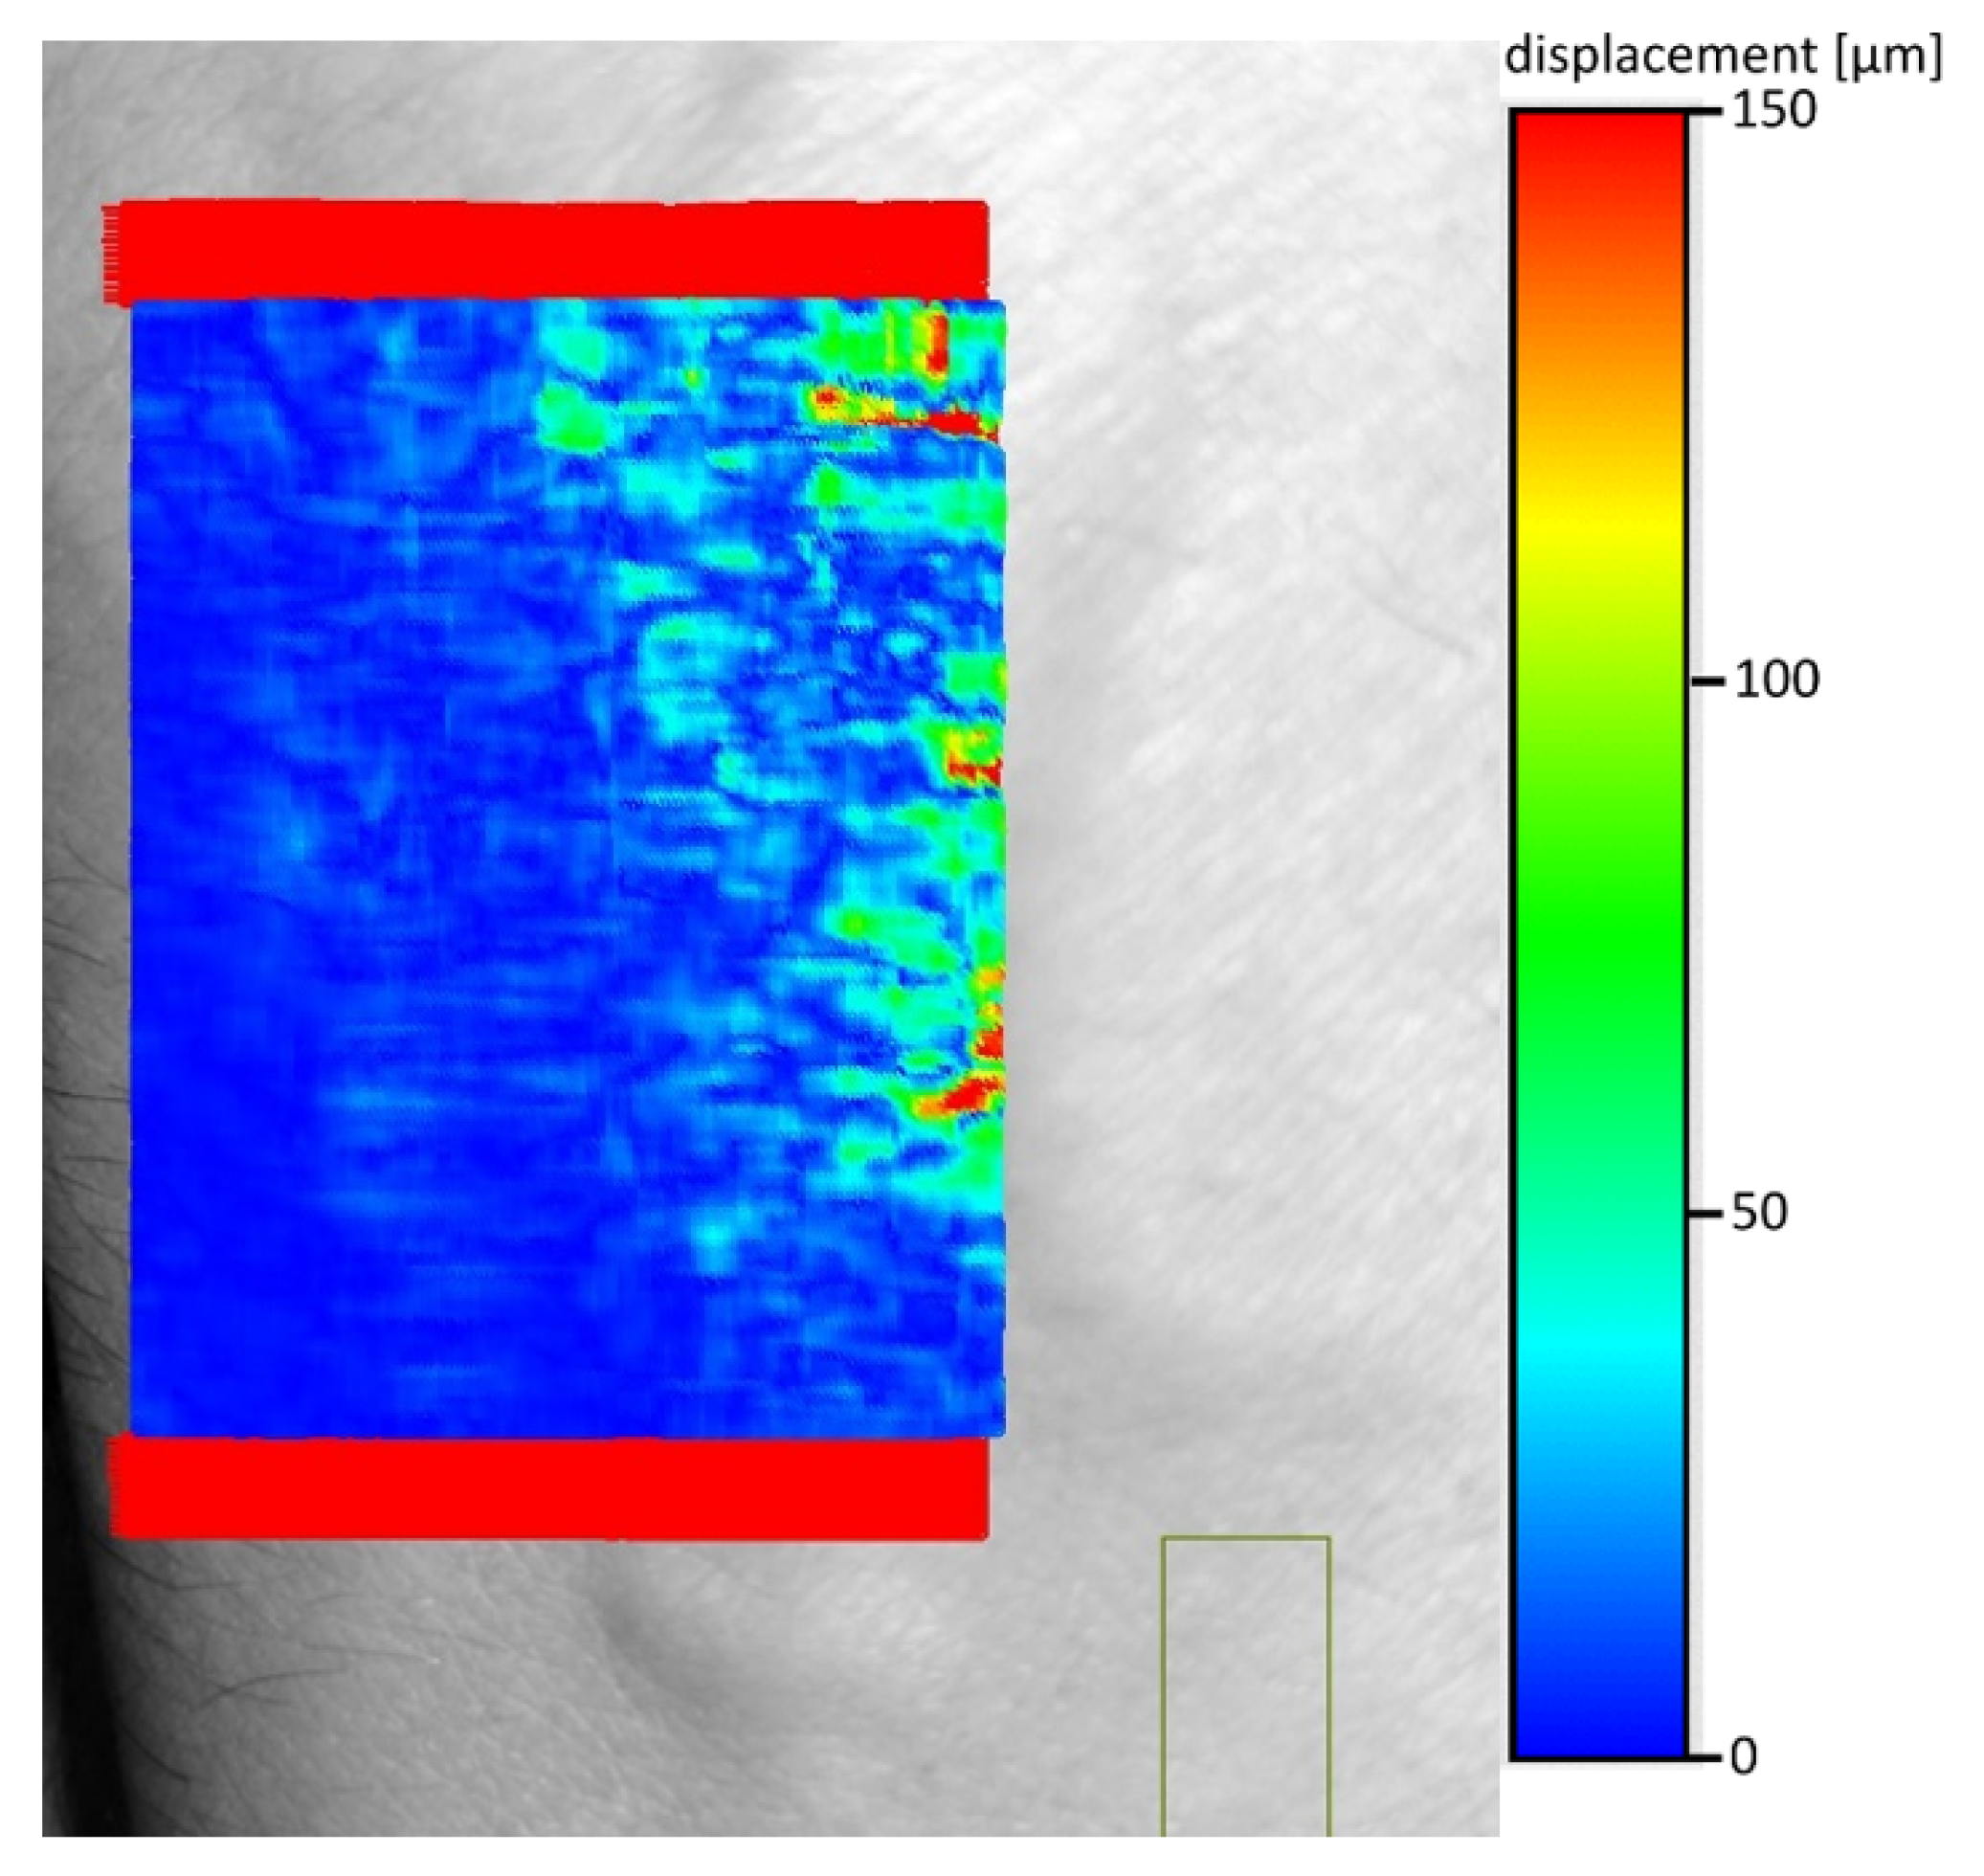
The direct use of the methodology described in the previous chapter gave completely illegible shift maps. This was due to the fact that the limb vibrations were greater several orders of magnitude than the skin movements caused by the change in pressure during the blood flow through the blood vessel (
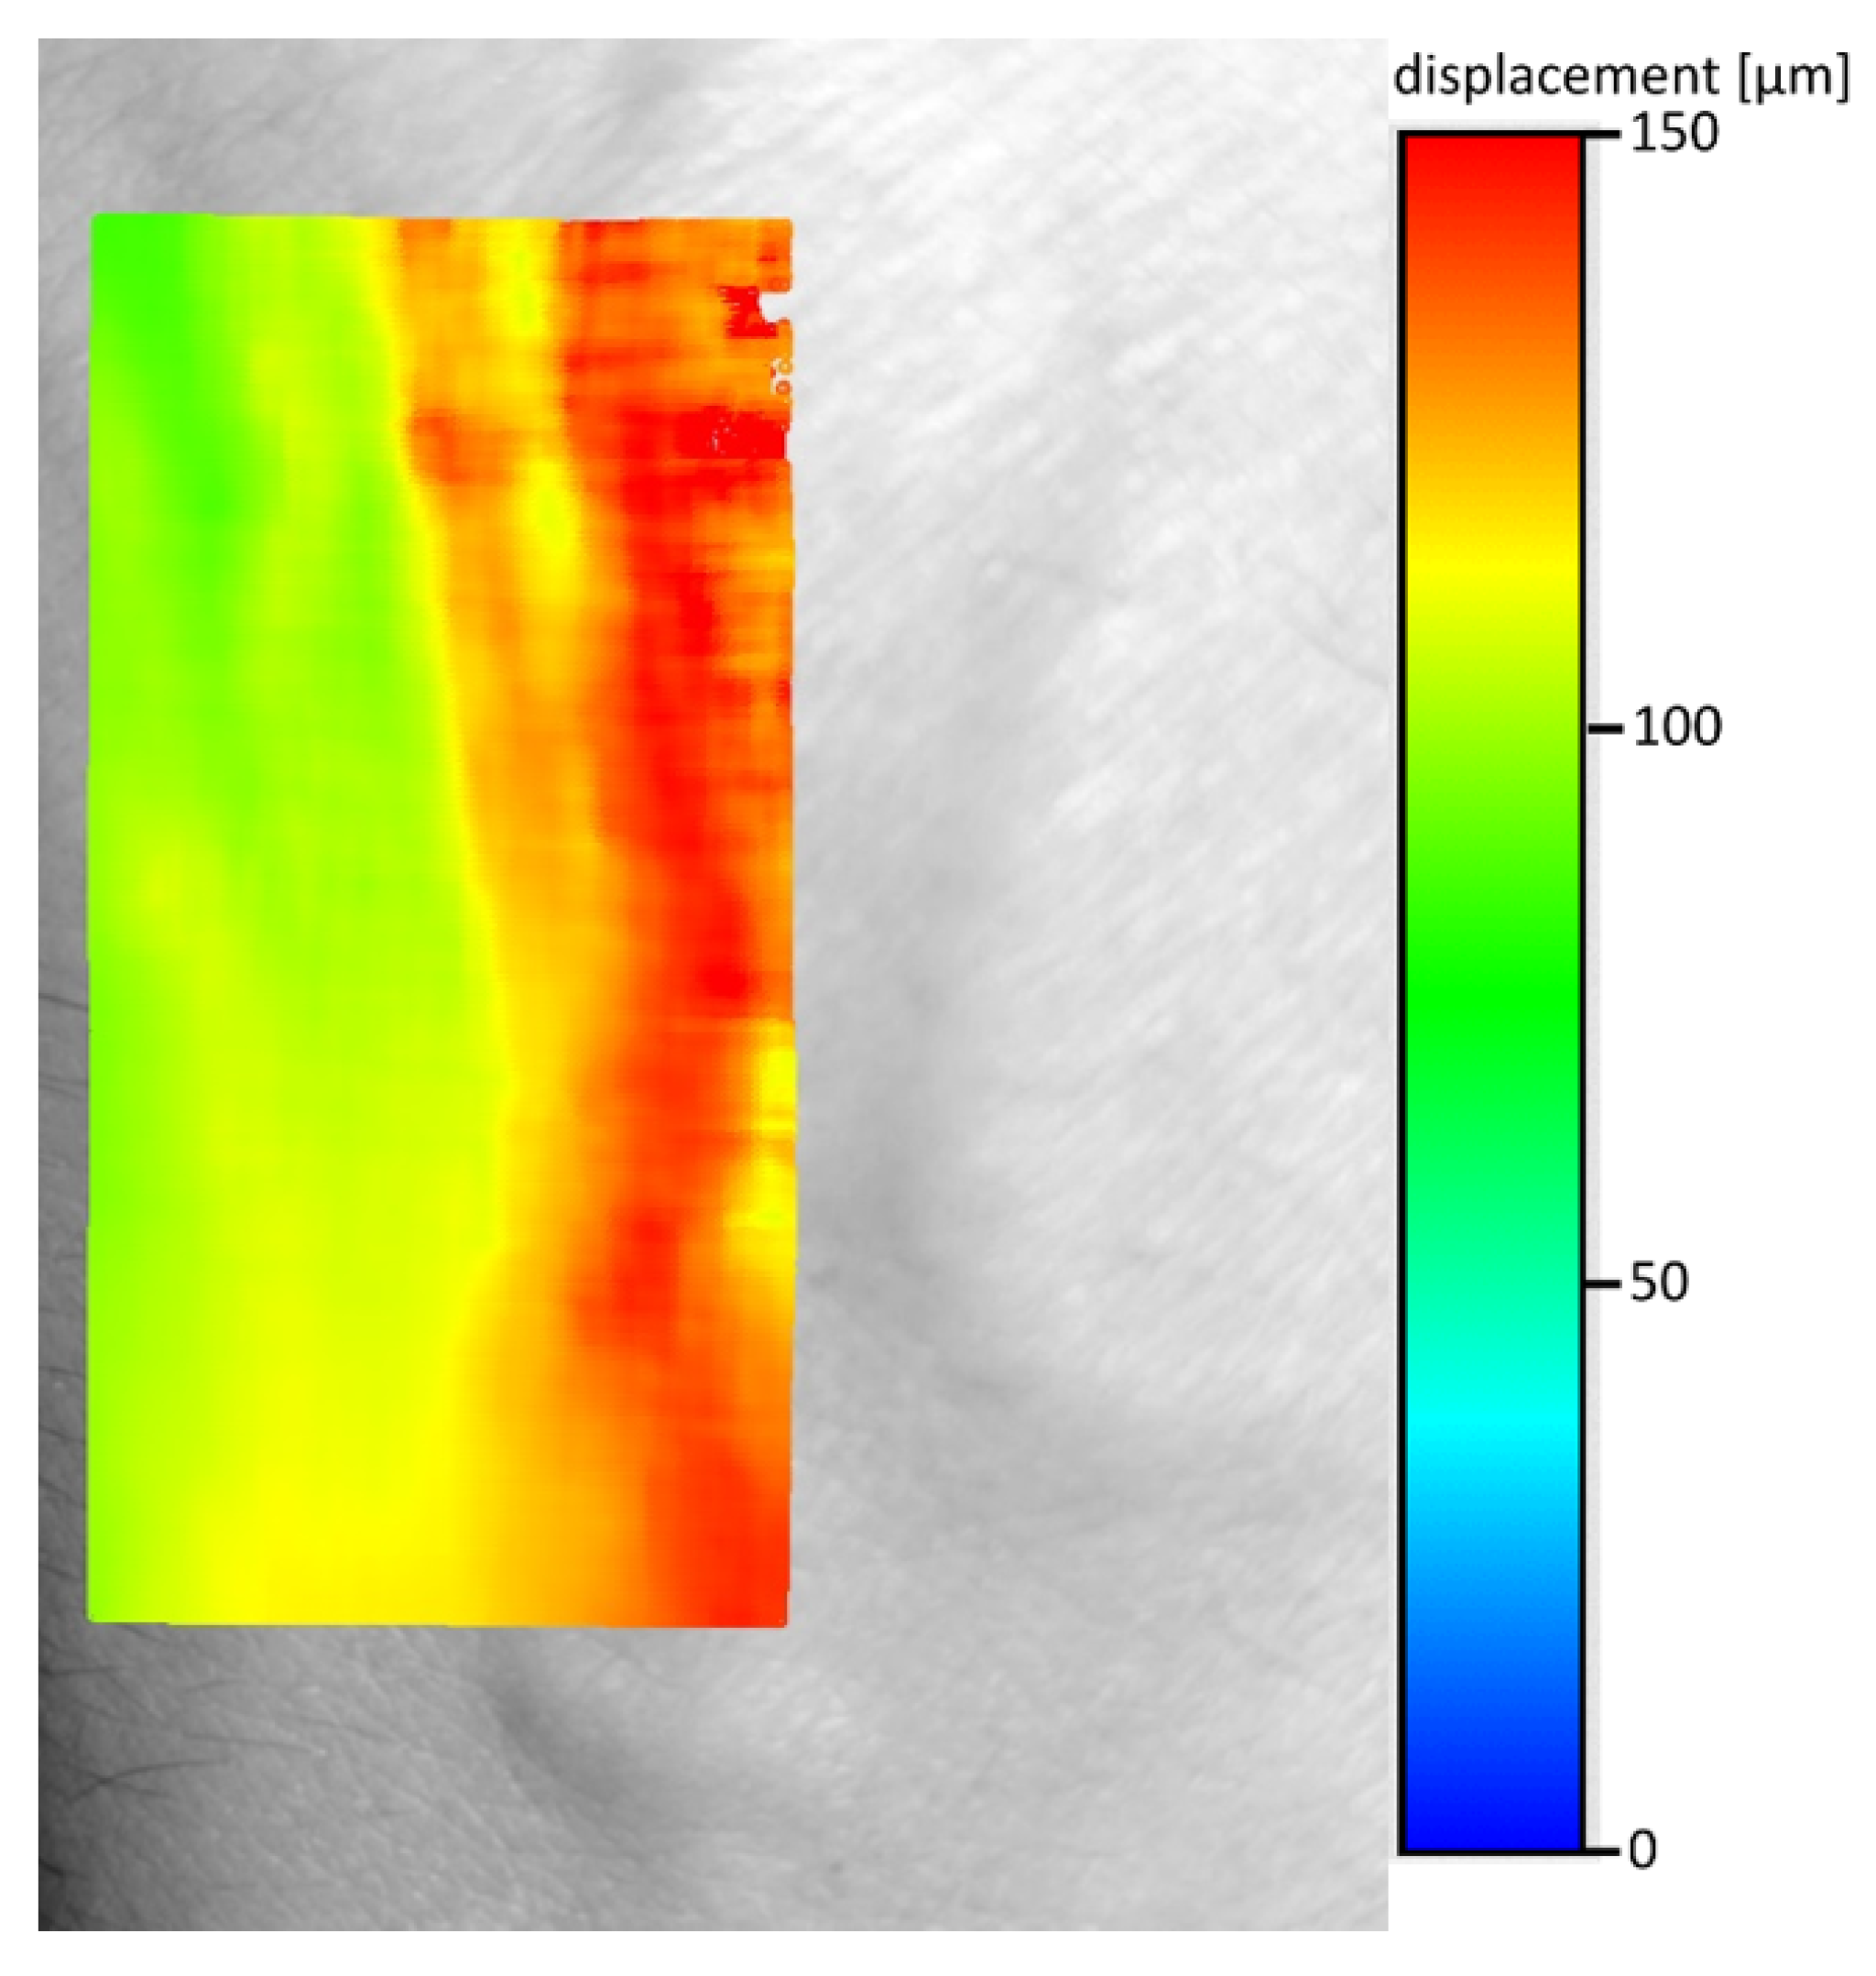
Figure 3). Therefore, the resulting movements map was filtered using average shift calculated from 100 × 300 pixel area without visible veins. Then the calculated vector was subtracted from the shift map (
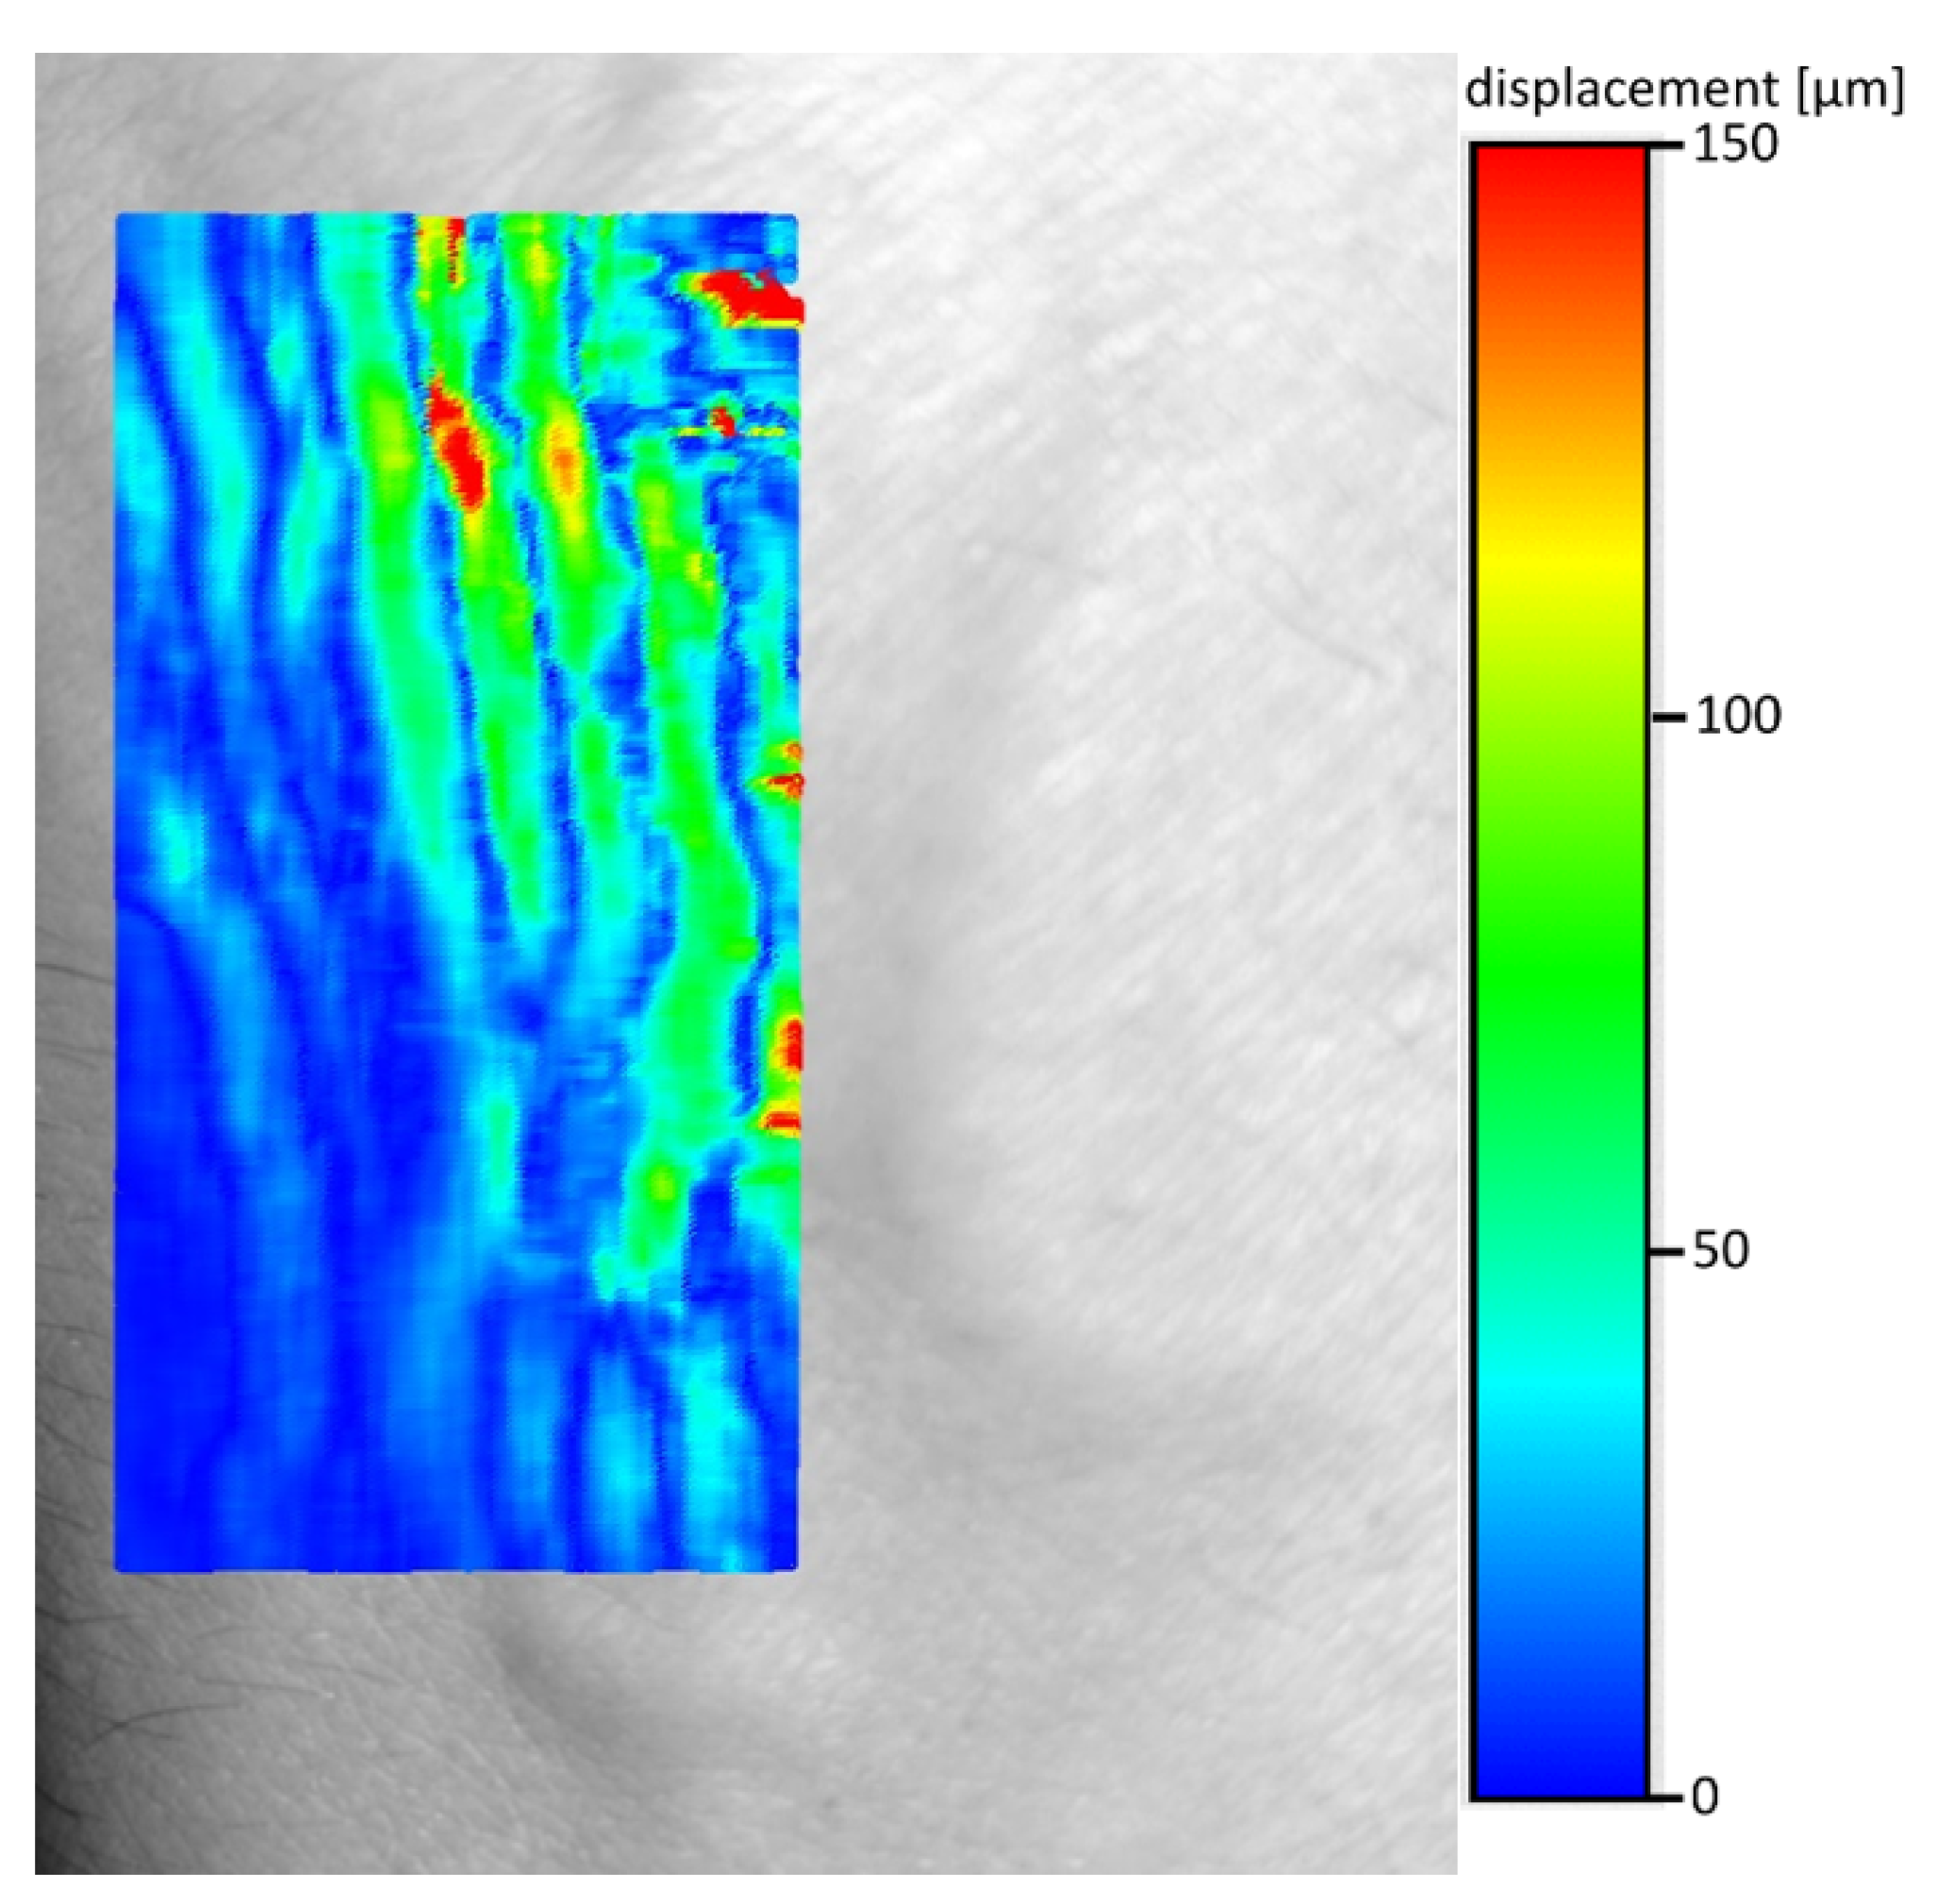
Figure 4). The shifts maps on Figures 4, 6 and 8 are colored according to the absolute shift value, where the minimum shift value is blue and the maximum shift is red. Due to the poor visibility of the vessels at the edges of the hands, filtering using one, fixed shift vector turned out to be insufficient.
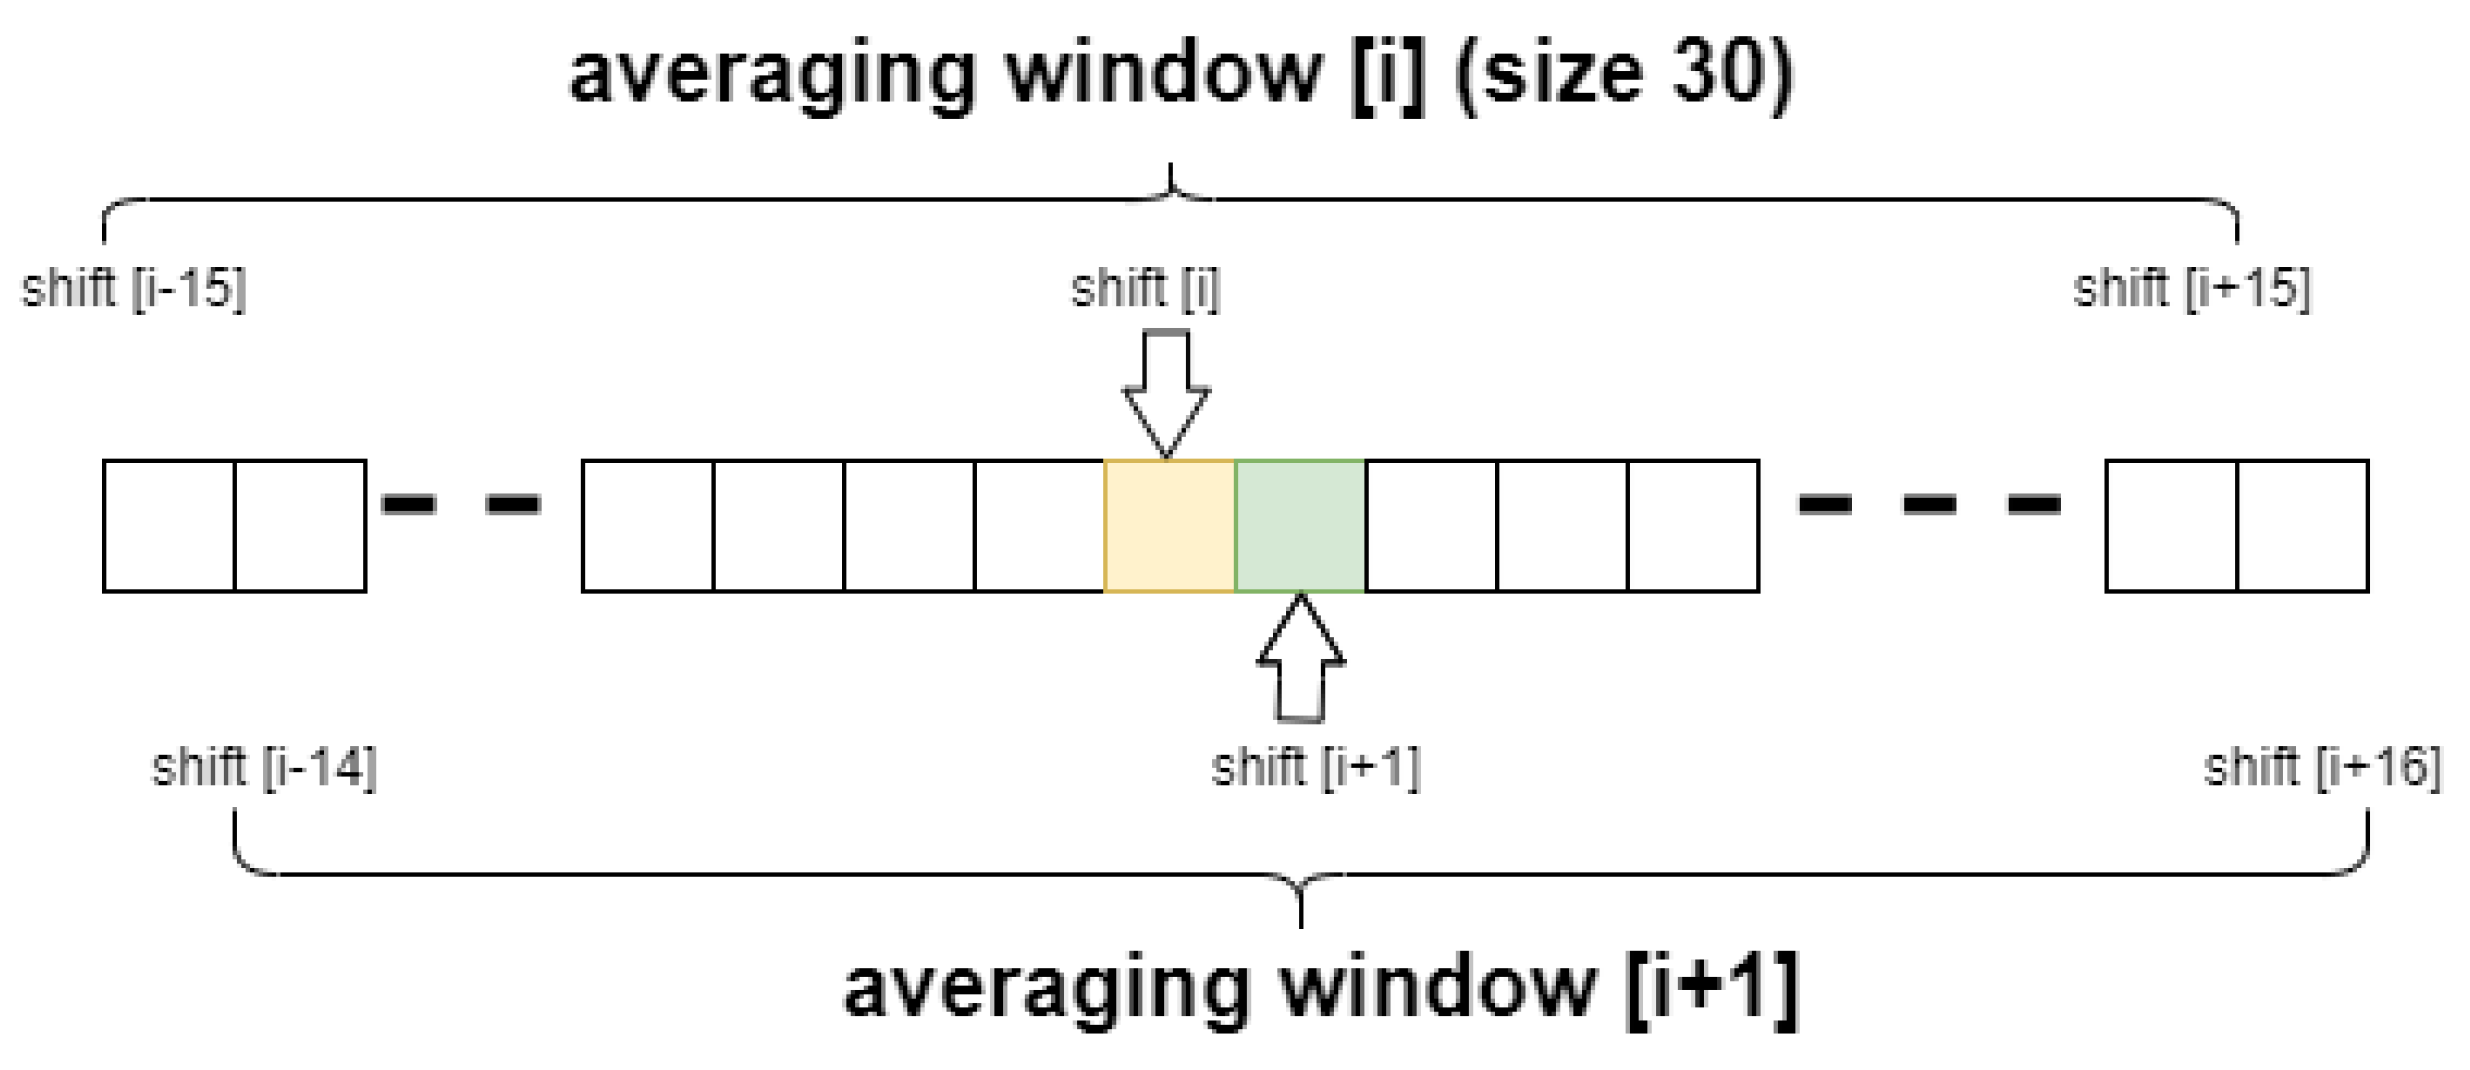
The next improvement was to use the subtraction of the average calculated not once for the entire shift map, but the average determined by a sliding window, as shown on
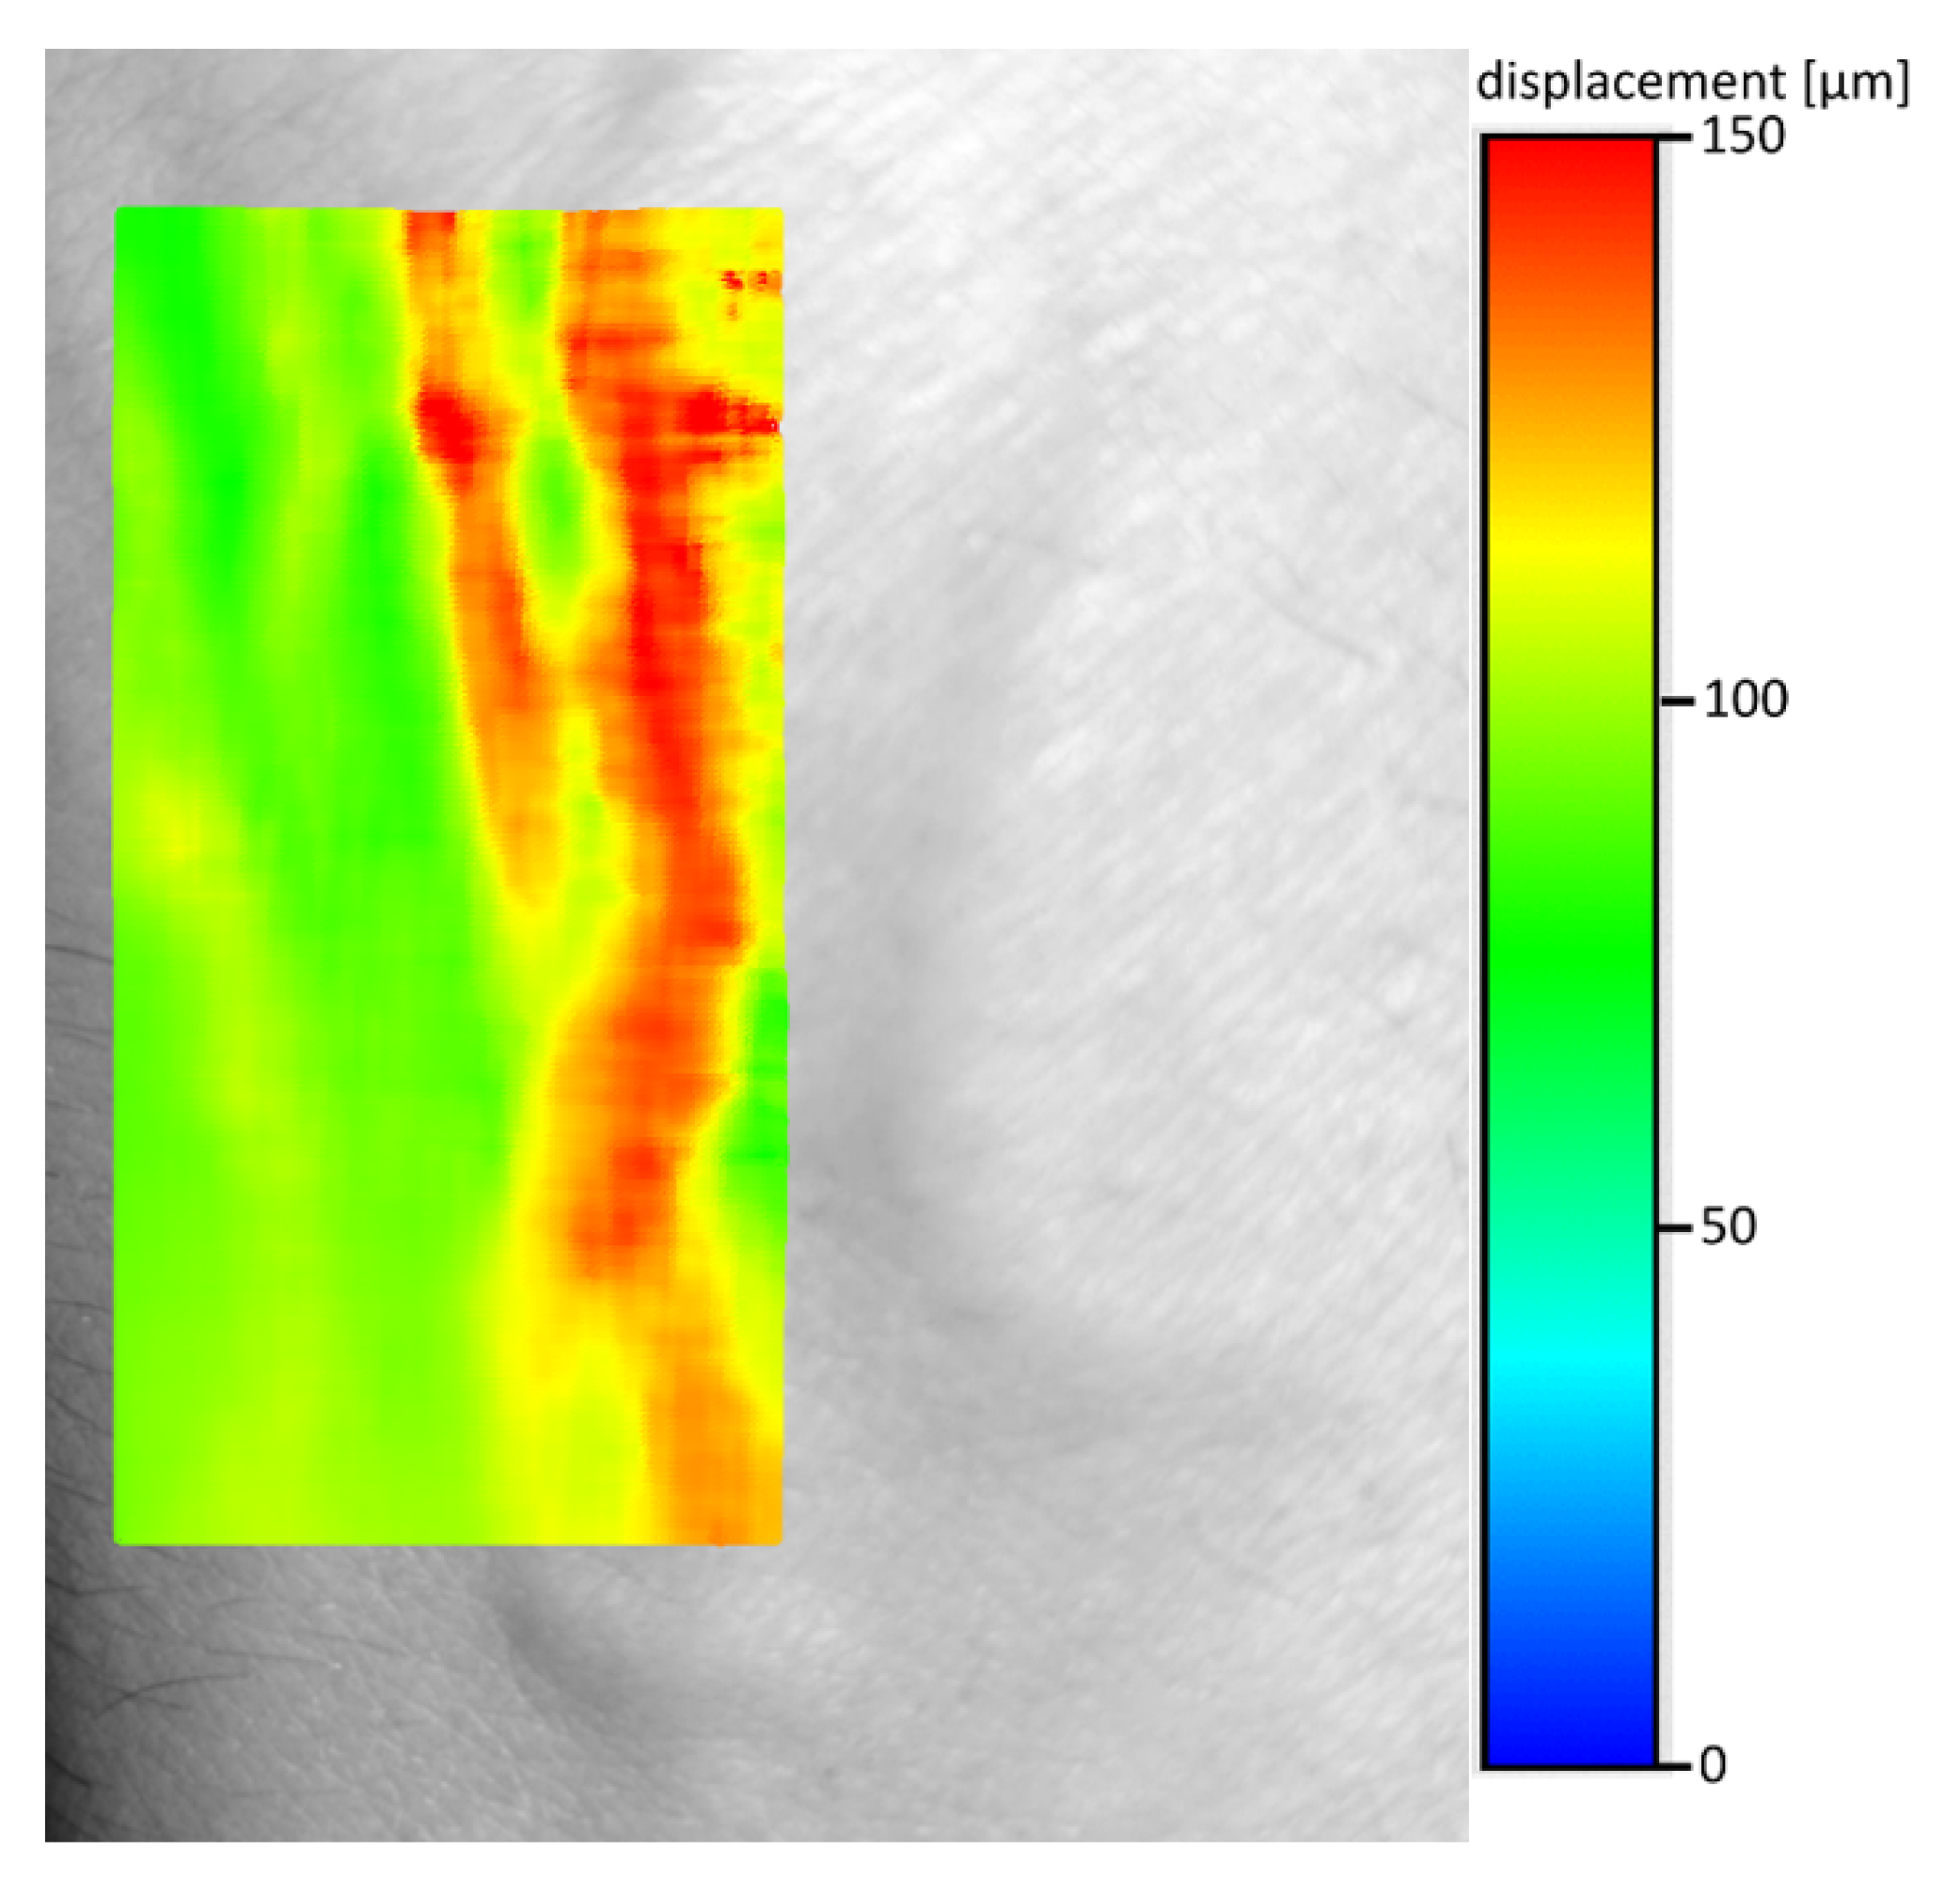
Figure 5. From each point in the shift map, the local average was subtracted. This local average was calculated from 30 adjacent shift points (15 from left and 15 from right), so each point in shift map was corrected by its own local average value. The resulting shifts map is shown on
Figure 6. Comparison of
Figure 4 and
Figure 6 indicates better separation of vein edges in
Figure 6. The optimal size of the averaging window, in terms of filtration, depends on the ratio of the distance between individual points of the offset map to the expected size of the vein. Thanks to the use of the window mechanism to determine the local mean, the effect of automatic adjustment of the algorithm to the non-uniform vector of the entire hand shift was achieved. These heterogeneities result from both the complicated nature of forehand vibrations and the distortions introduced by its curvature. Too small averaging window will “blur” the most interesting information about the location of the edges of the veins. On the other hand, too large will not consider the local changes in the optical shift of the entire hand area. The proposed value was selected experimentally.
Because the averaging window is determined only based on a single row of shifts, the presented approach will not work for veins running parallel to the x-axis of the image (
Figure 7). Since we focused on analyzing the images of the arm, we considered the above disadvantage to be insignificant at this stage of the research, but in the case of an unpredictable direction of the veins, it would probably be more appropriate to choose a filtering window with the size of not a single line, but the entire square area around the analyzed point. The resulting shifts map shows one more interesting effect—as it is clearly visible on
Figure 8—map shows only edges of veins.
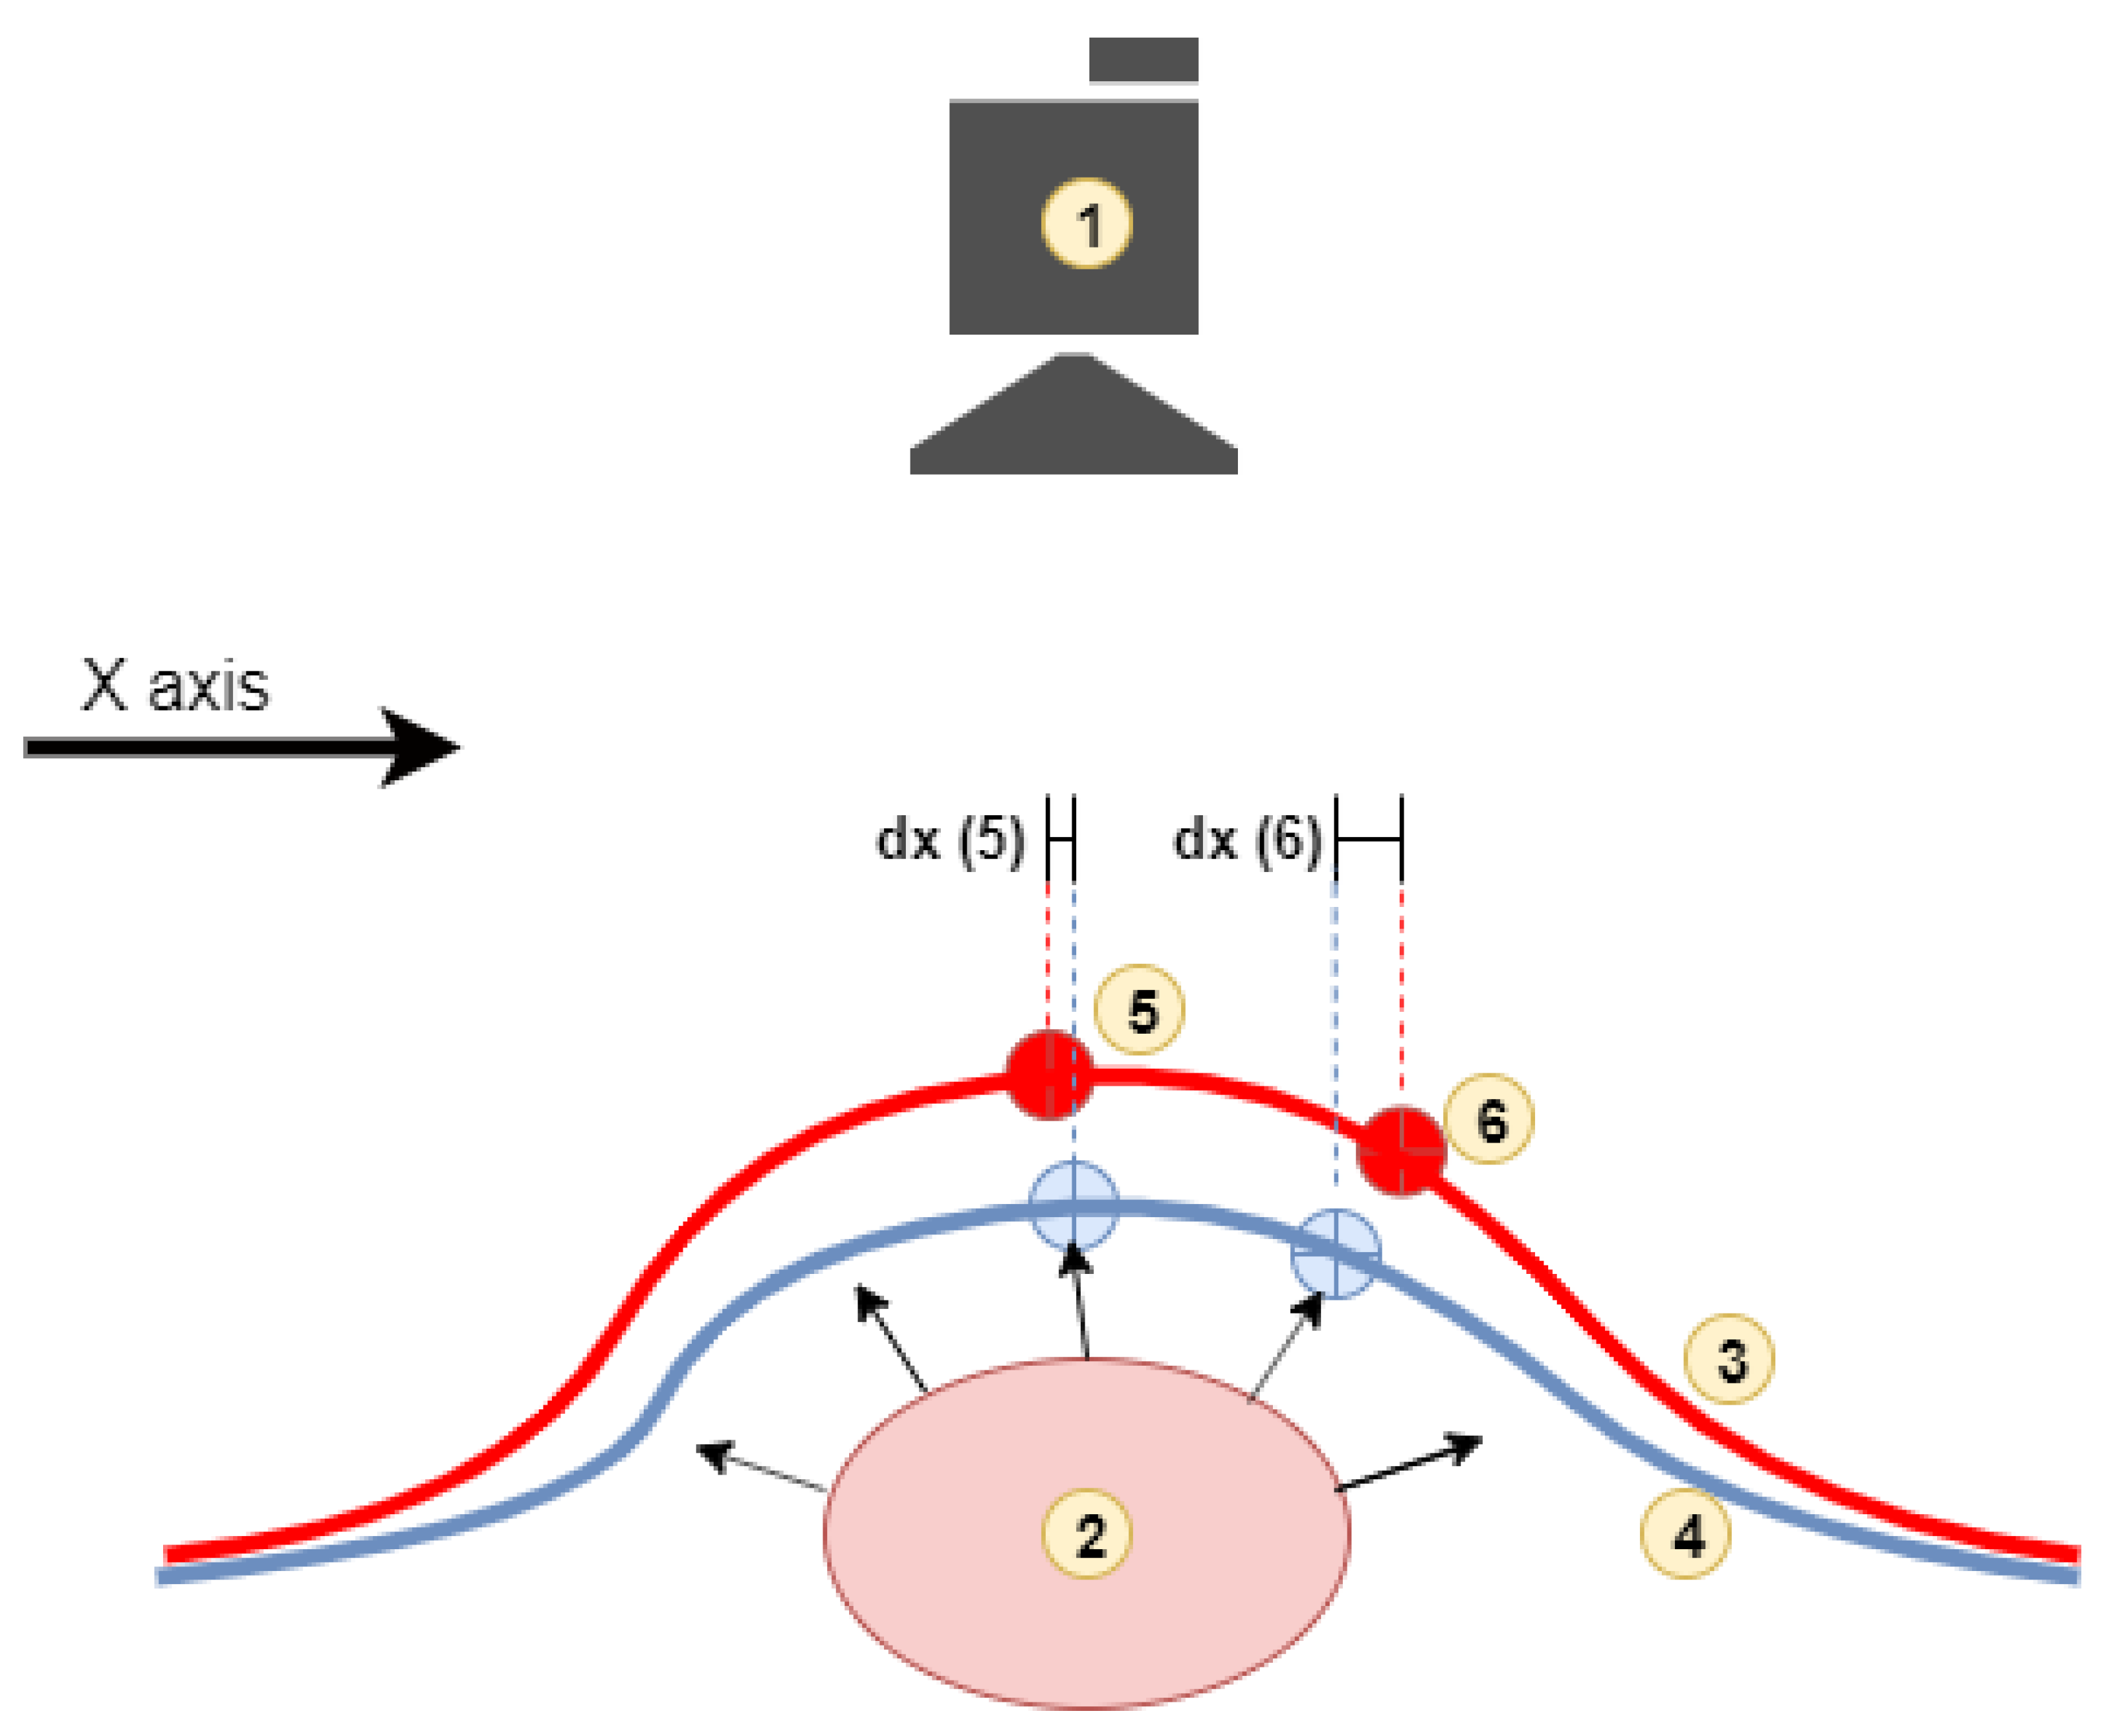
The vein edge detection mechanism causing visualization of two edges per single vein is explained in
Figure 9. The method detects only shifts in axes parallel to the image plane, so the movement of point 6 has greater axis
X delta value than the movement of point 5.
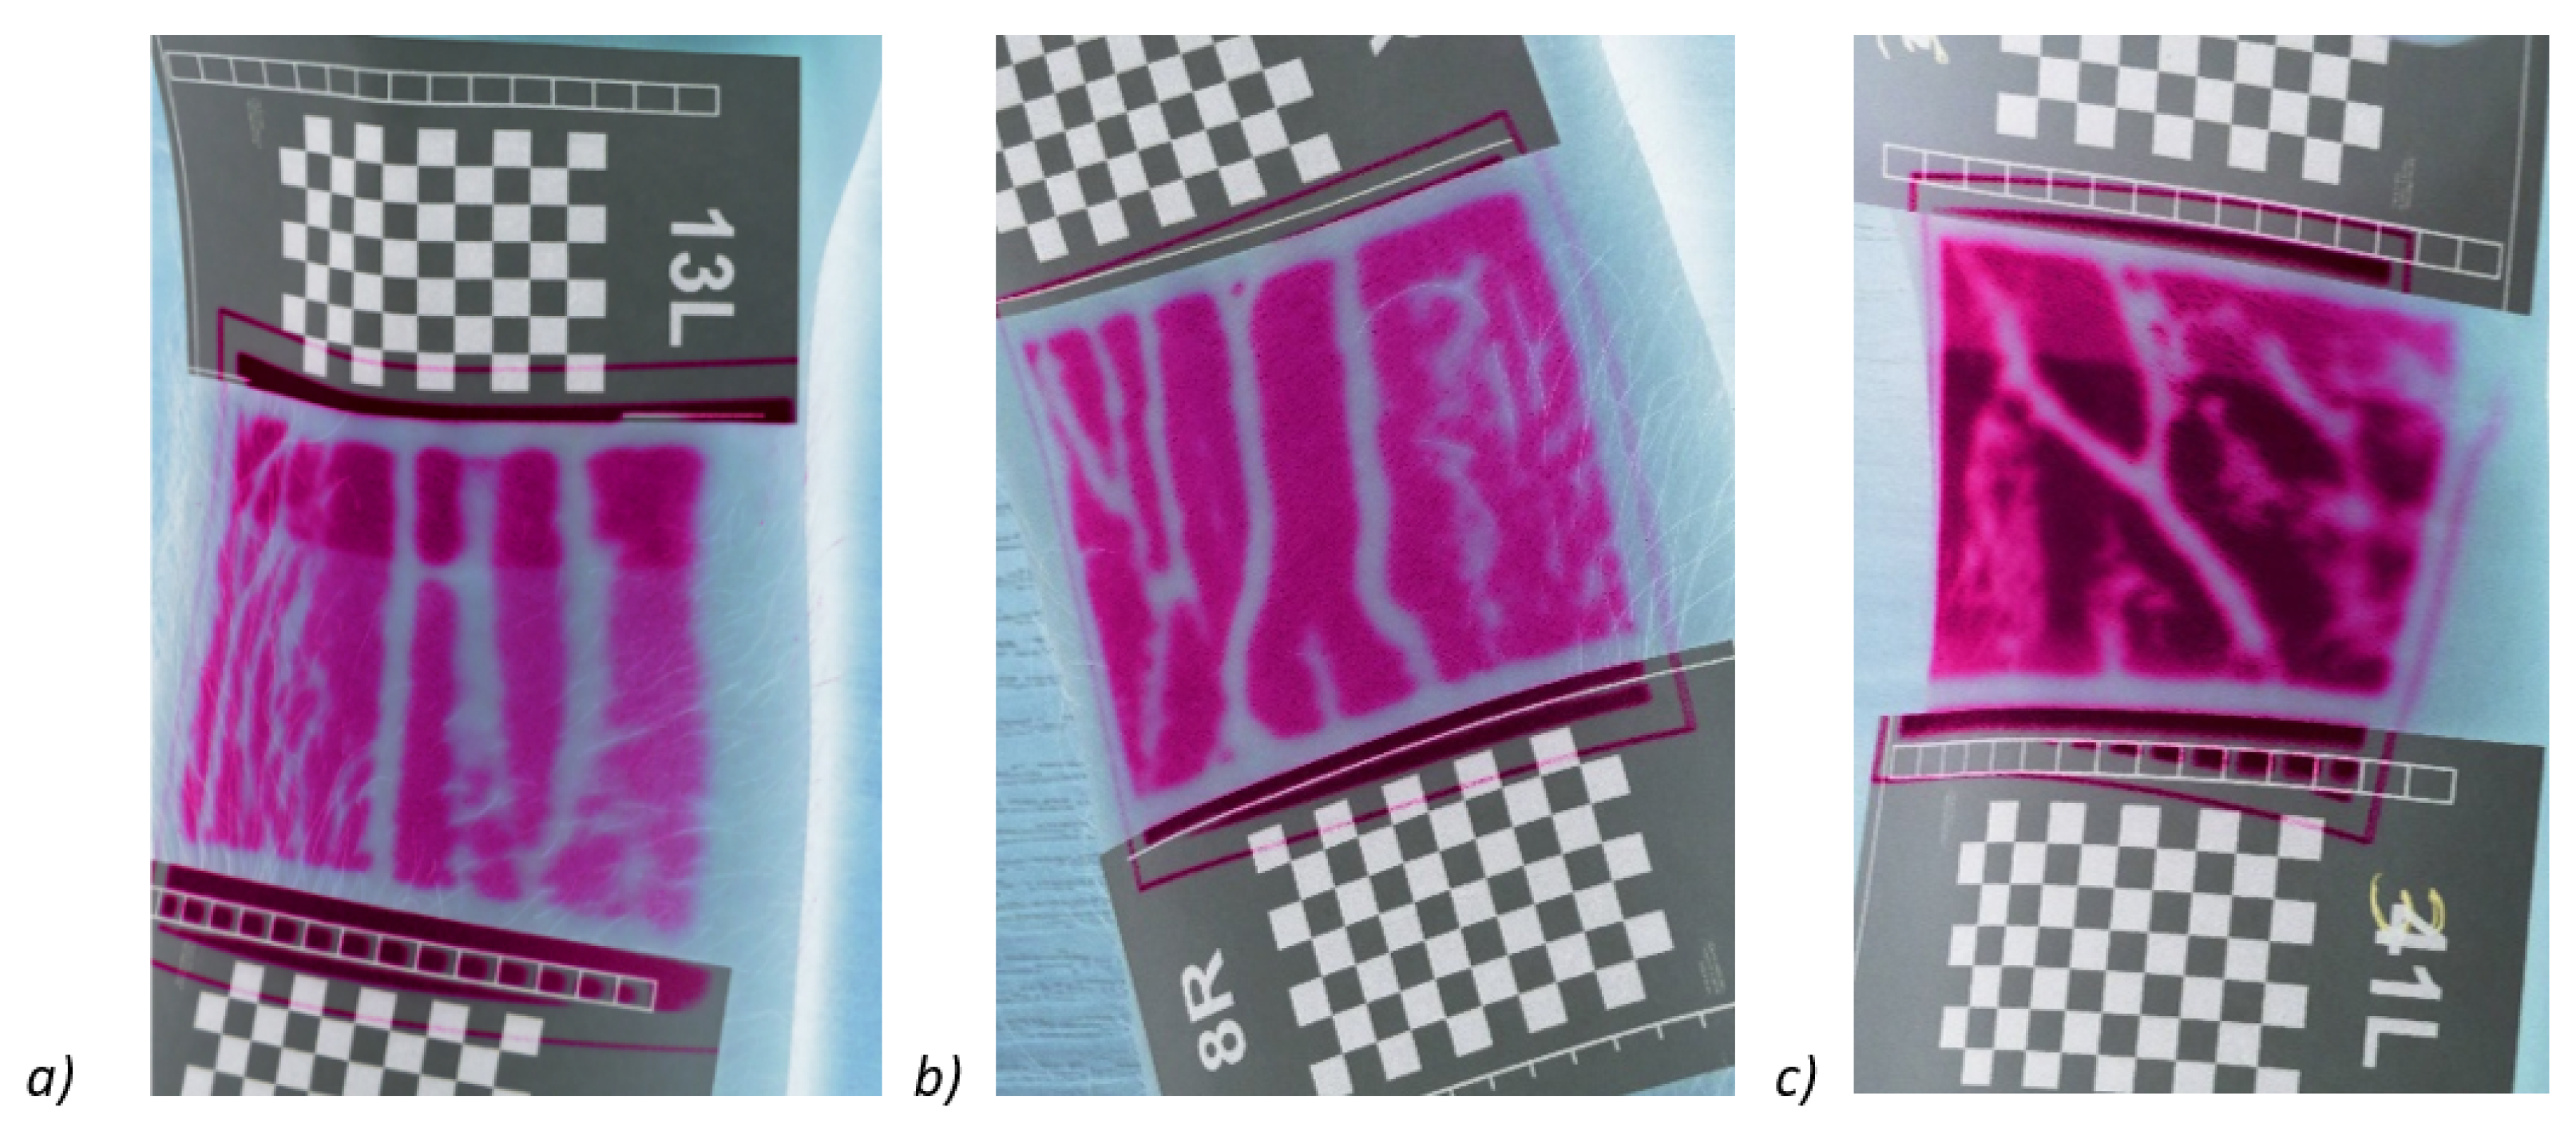
In the next step, we tested the presented method on a group of 31 people. Veins were detected in each of the participants using the proposed method on both hands (
Figure 10). The images of veins obtained with the proposed method were compared with the images obtained with the ‘Infrared vein finder Medcaptain NAVI-60’ device. Some examples of vein detection in one randomly selected participant is described below.
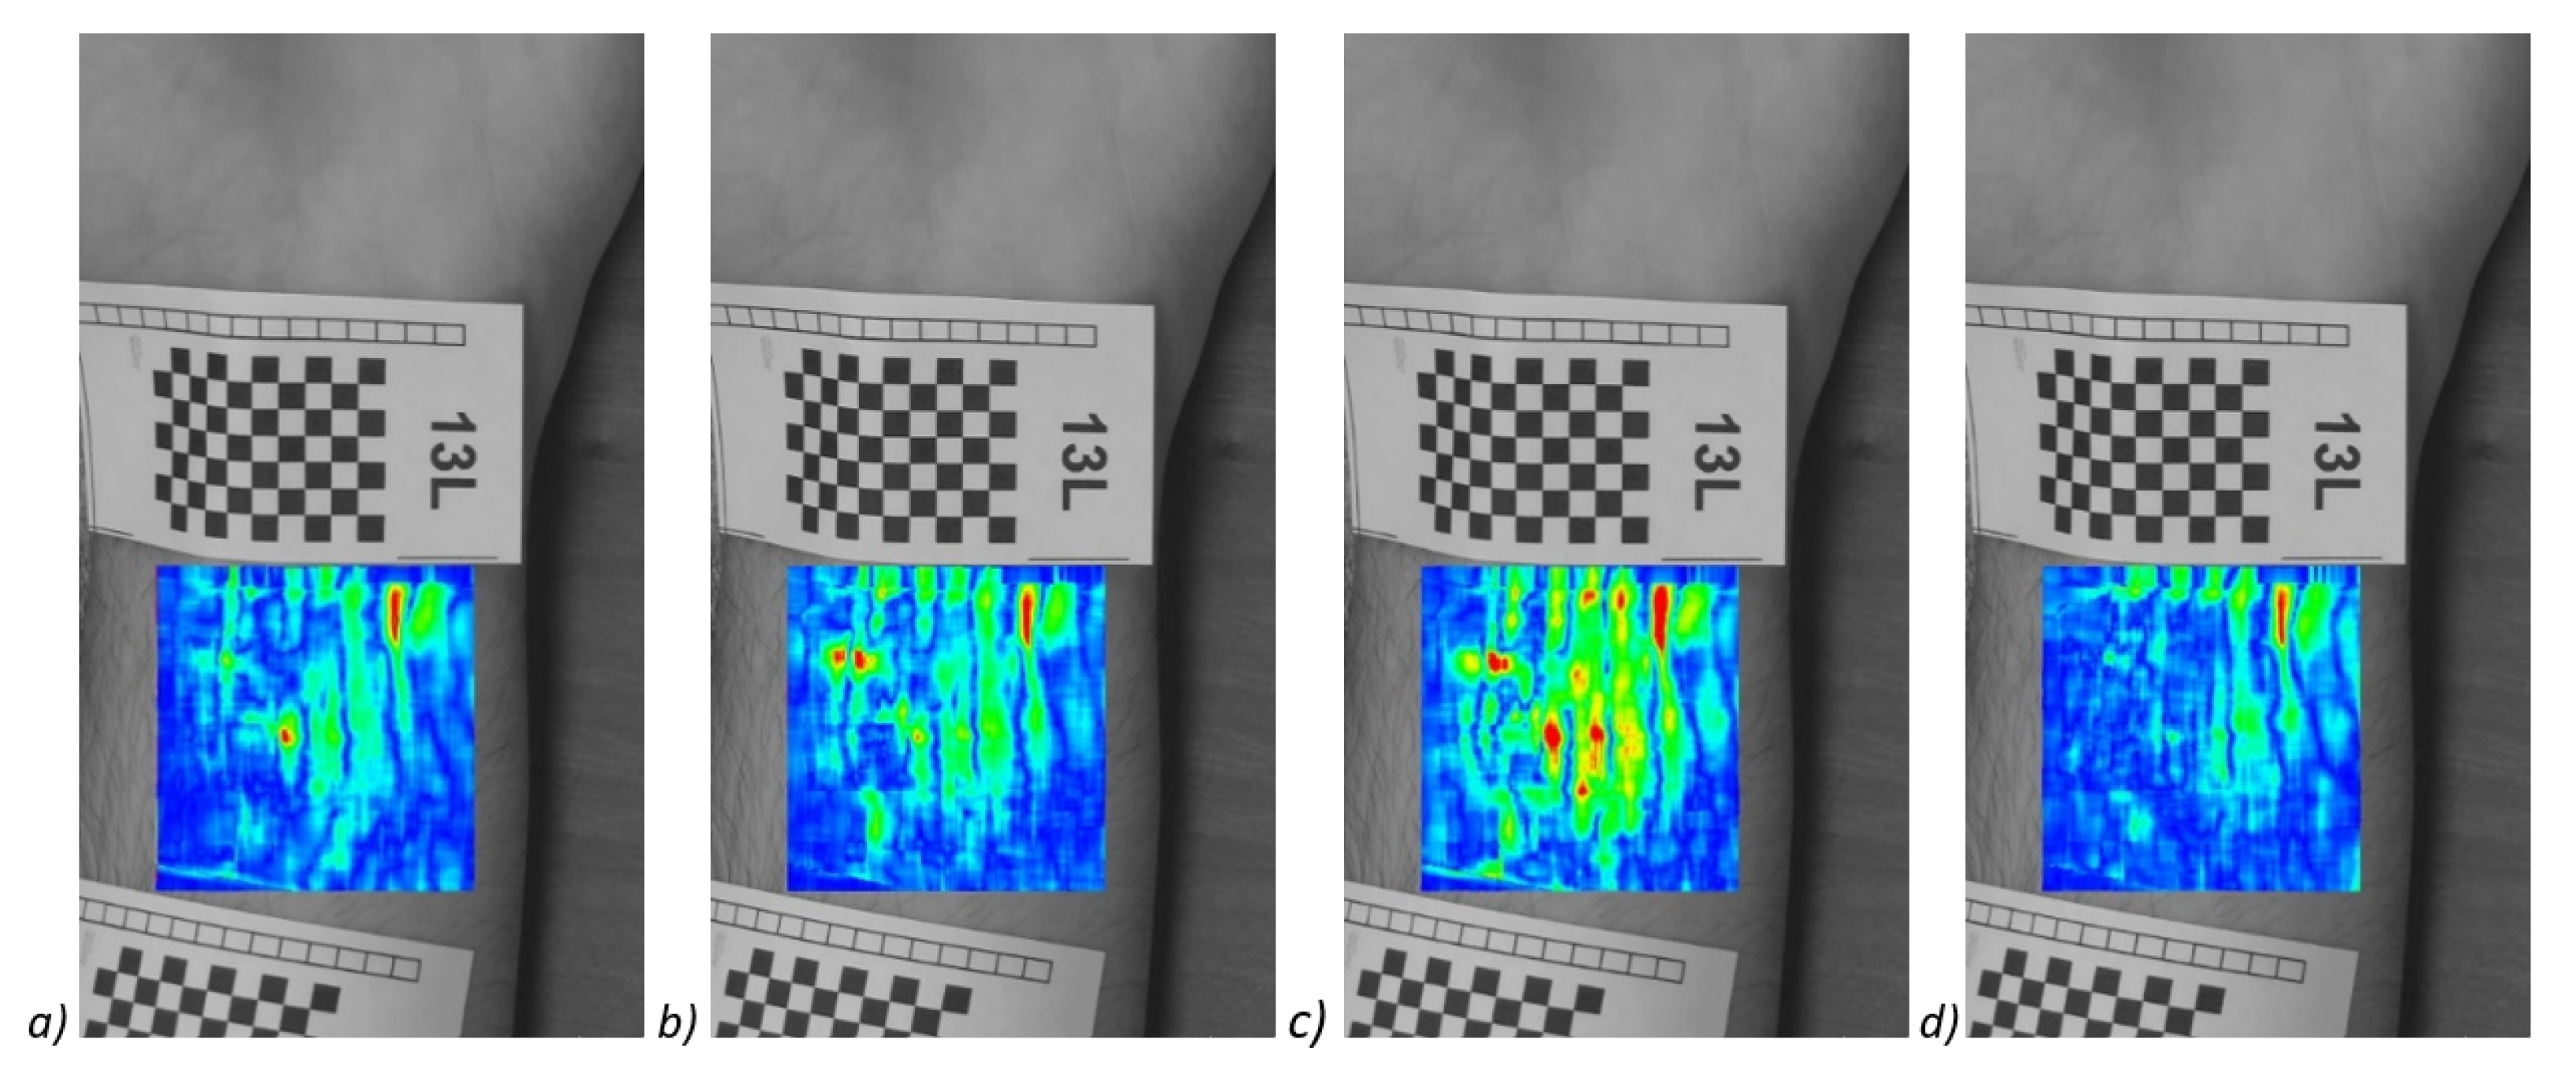
Presented method shows the image of the pulsation of the veins at a selected moment in time, in order to obtain a complete image of the veins, the frames of shifts from all time moments had to be summed up into one. Examples of images from different time moments are shown in
Figure 11, which shows the shift maps making up the
Figure 12.
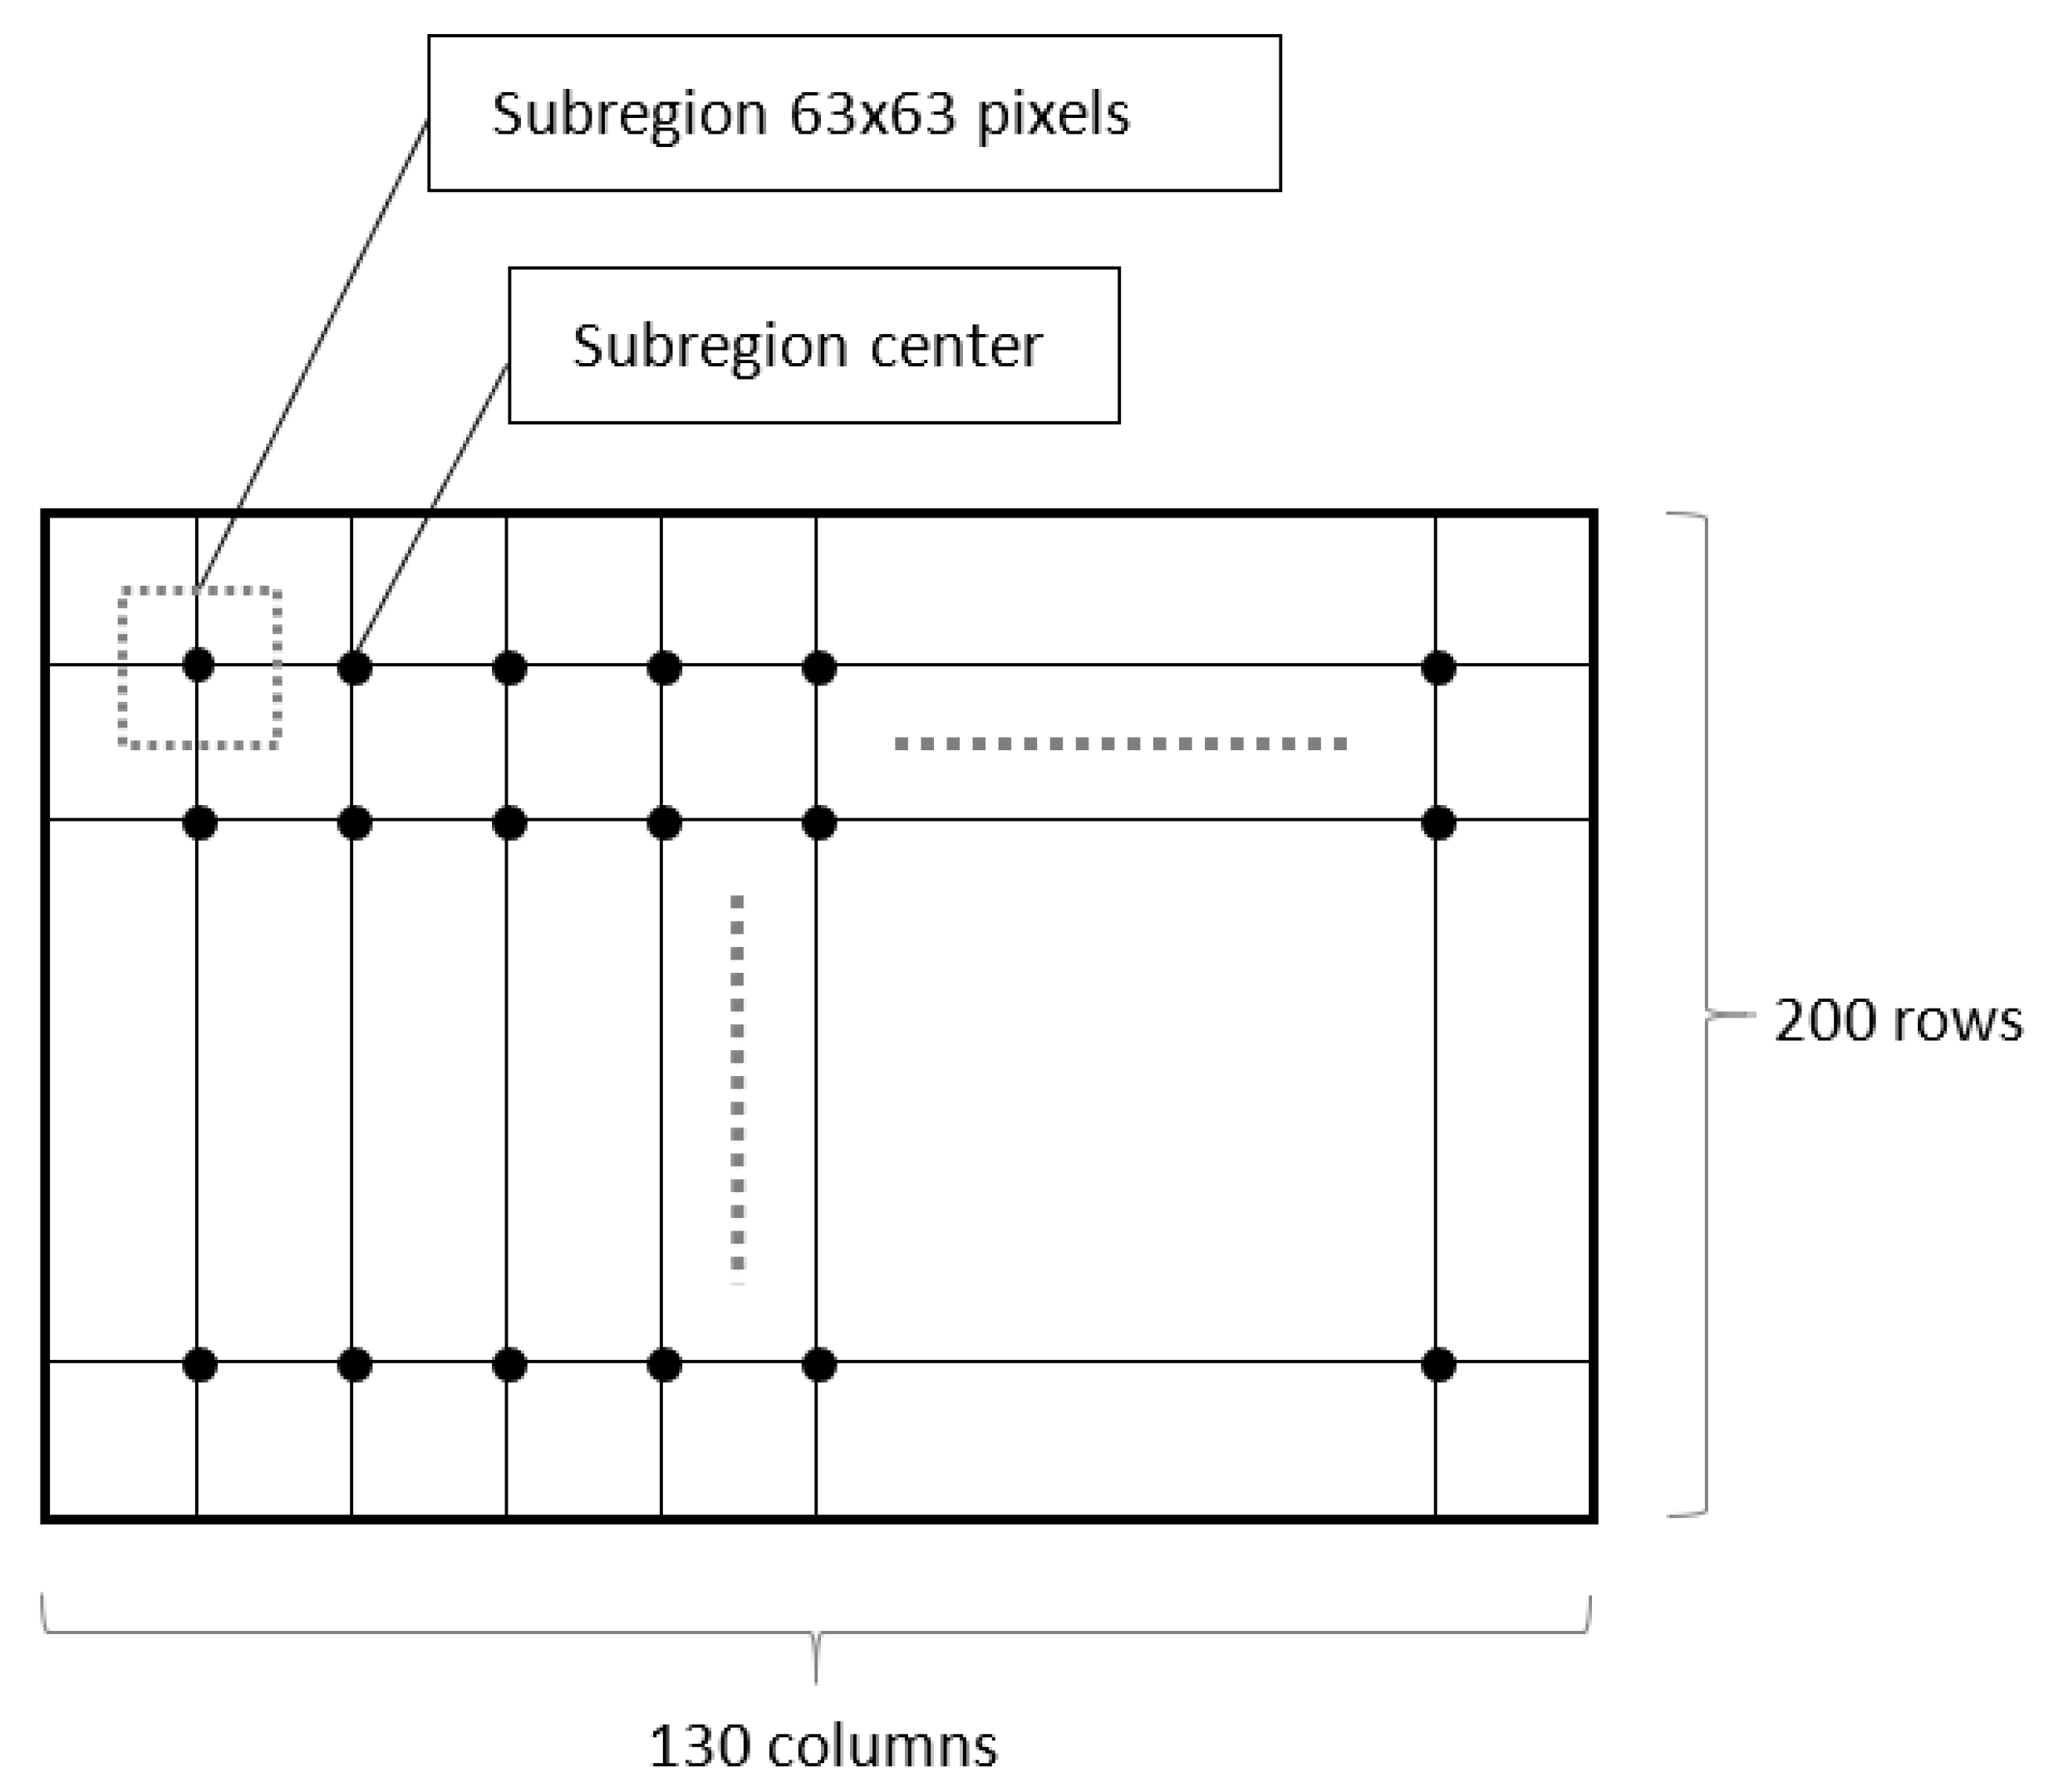
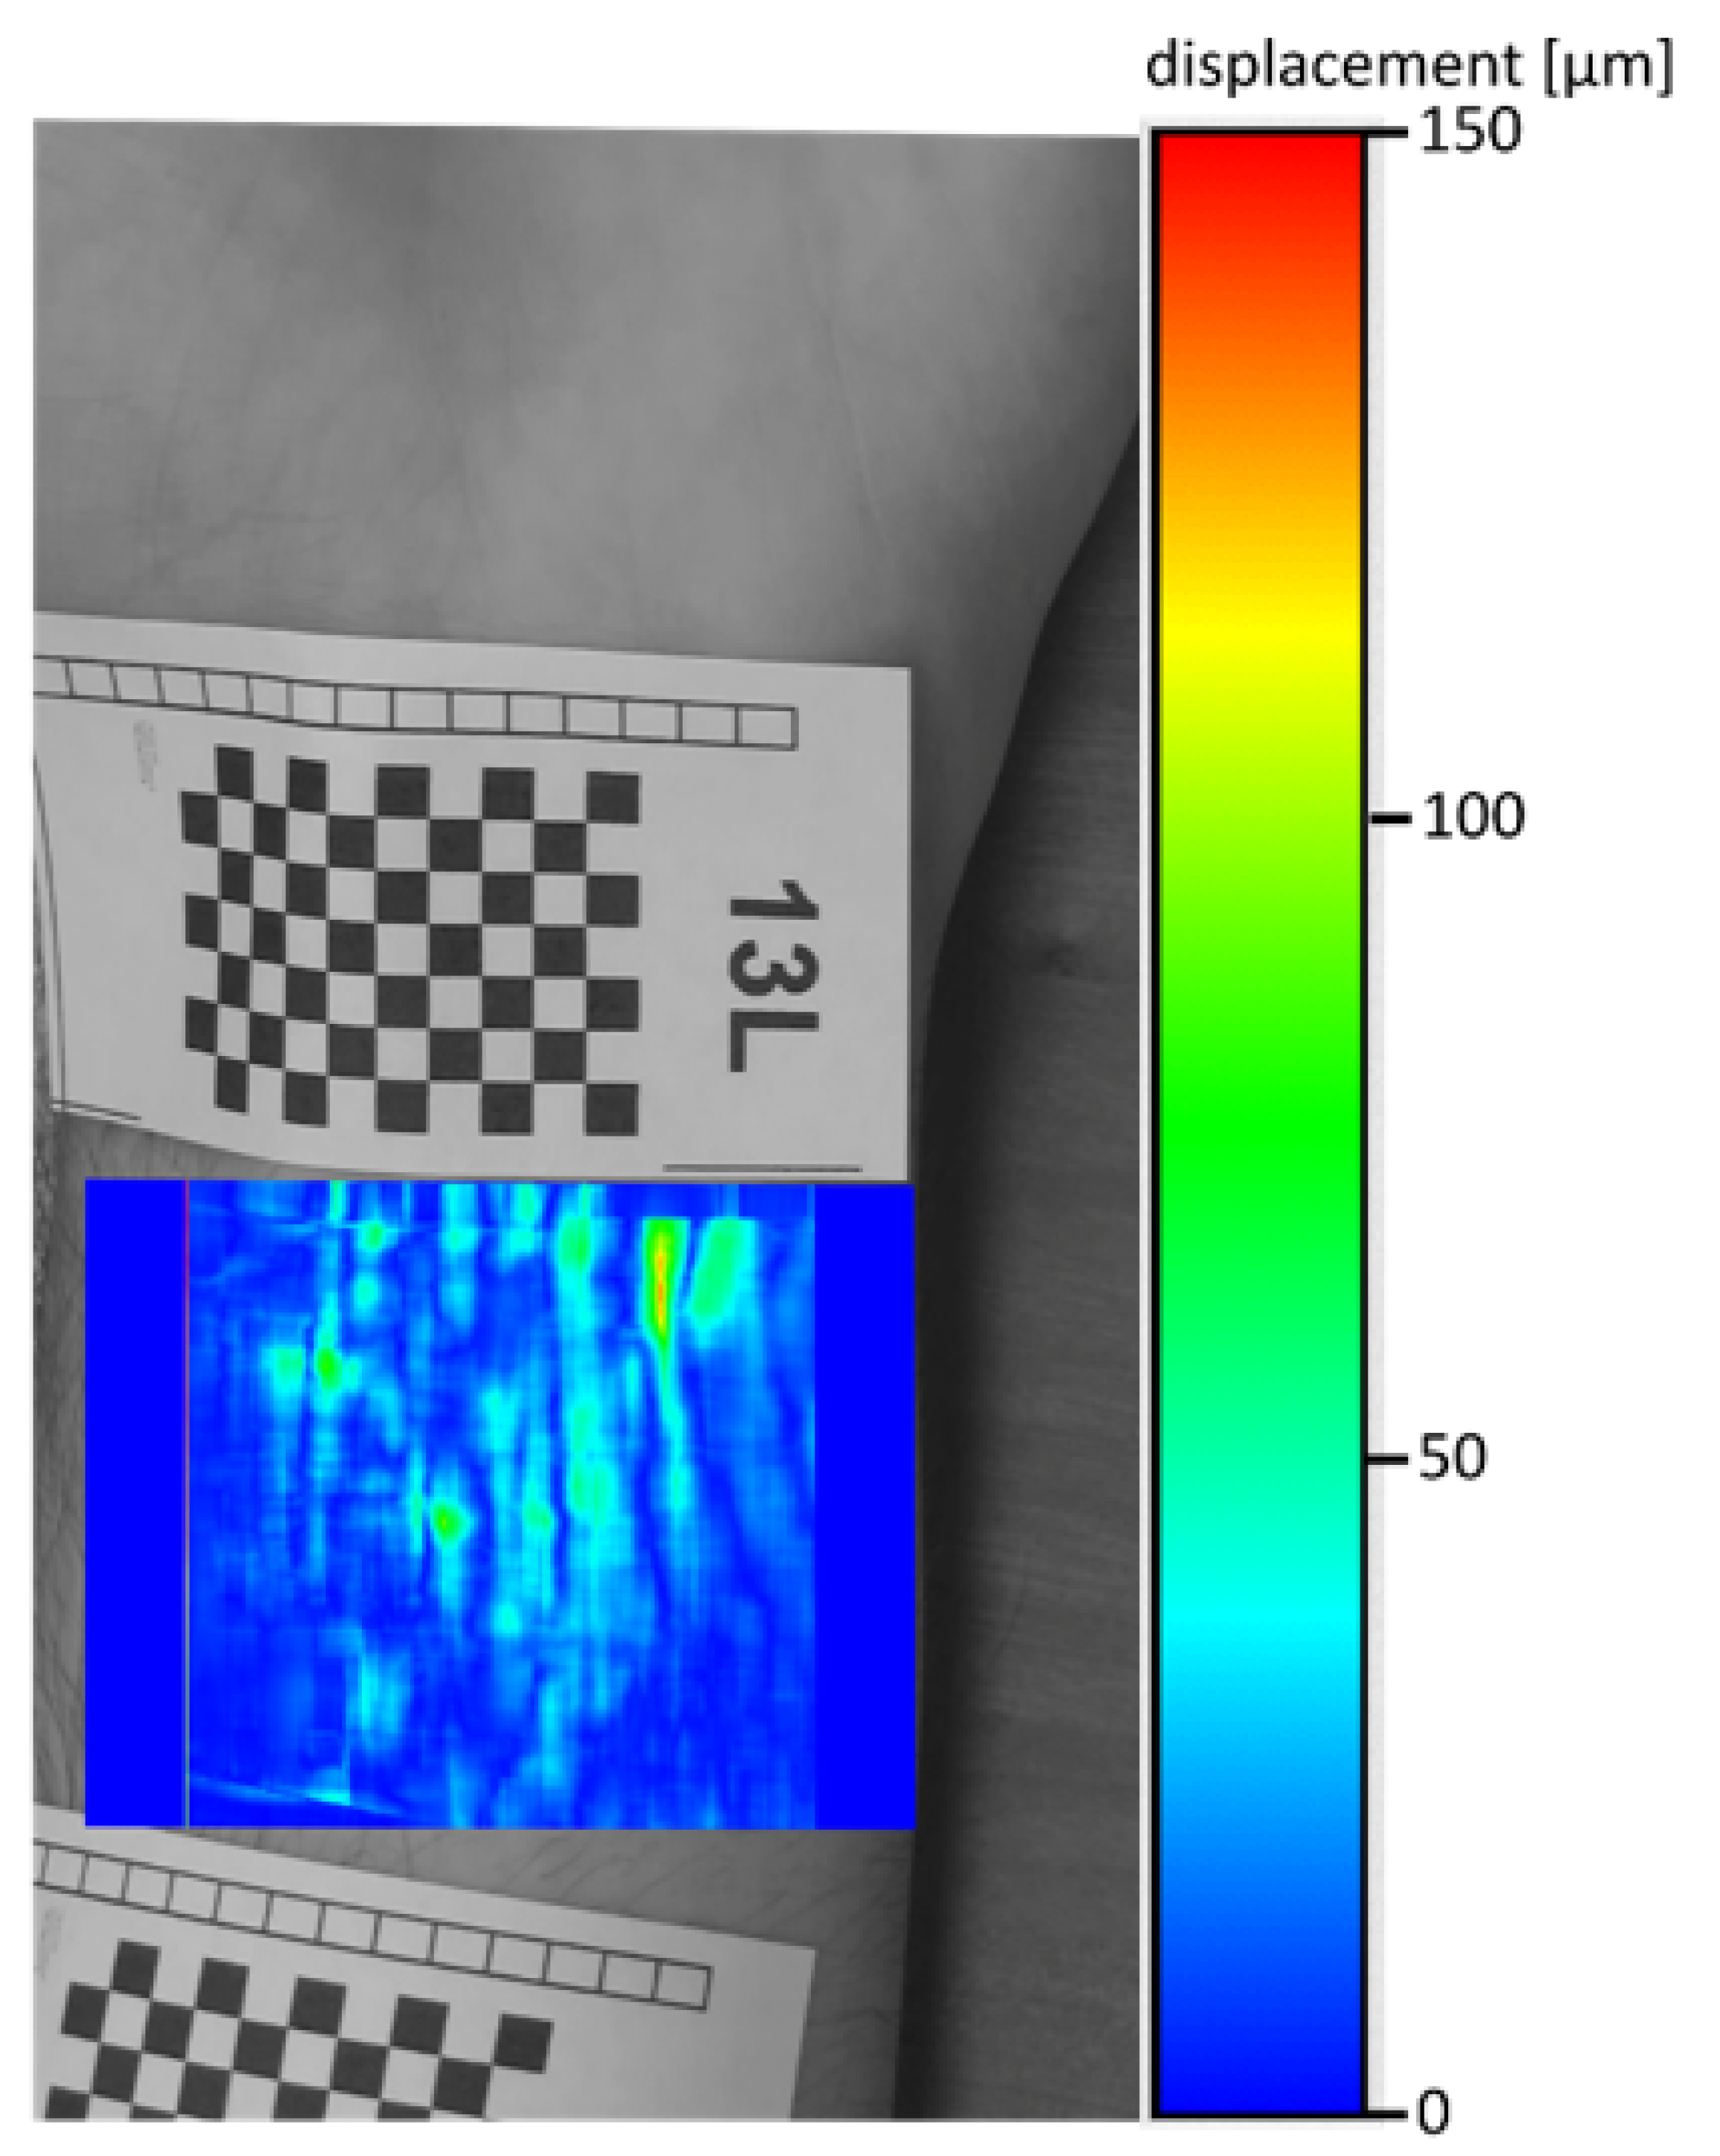
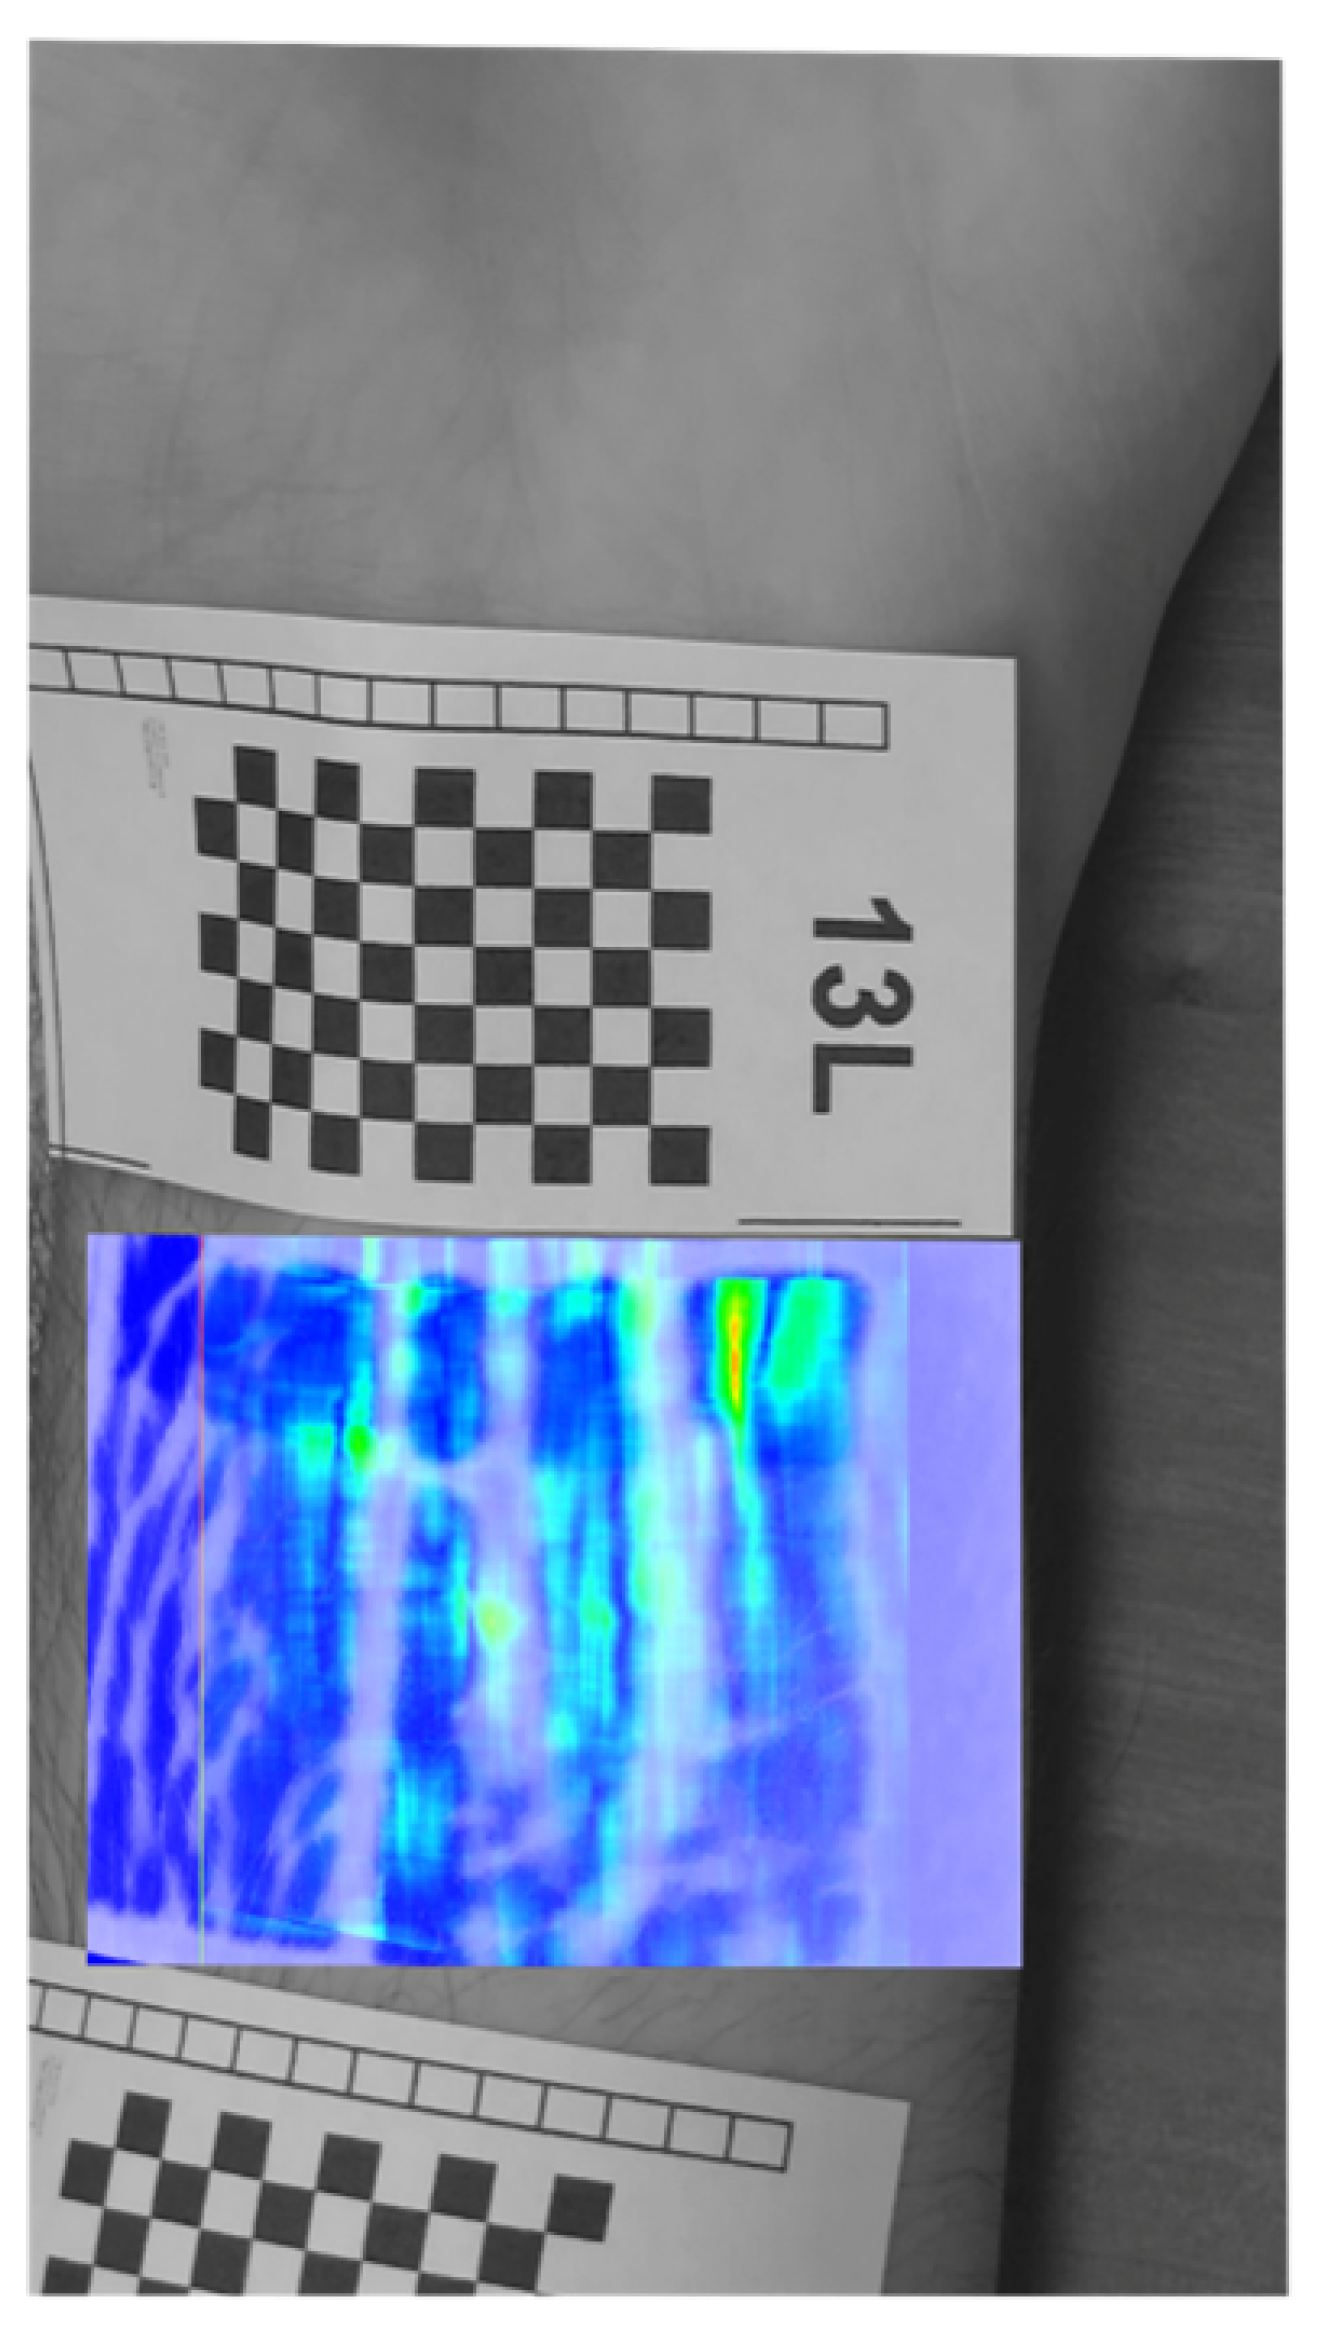
Figure 12 shows cumulative (sum) shifts for 120 frames (movie with 30 FPS, that is, about 4 s of the movie) for 13L participant. Calculation parameters of the map was: a grid of points 400 × 310, the matching area for one point of the grid: 97 pixels. Dark blue places of the image indicate no shift, which means that they indicate the edges of the veins (where the skin does not pulsate).
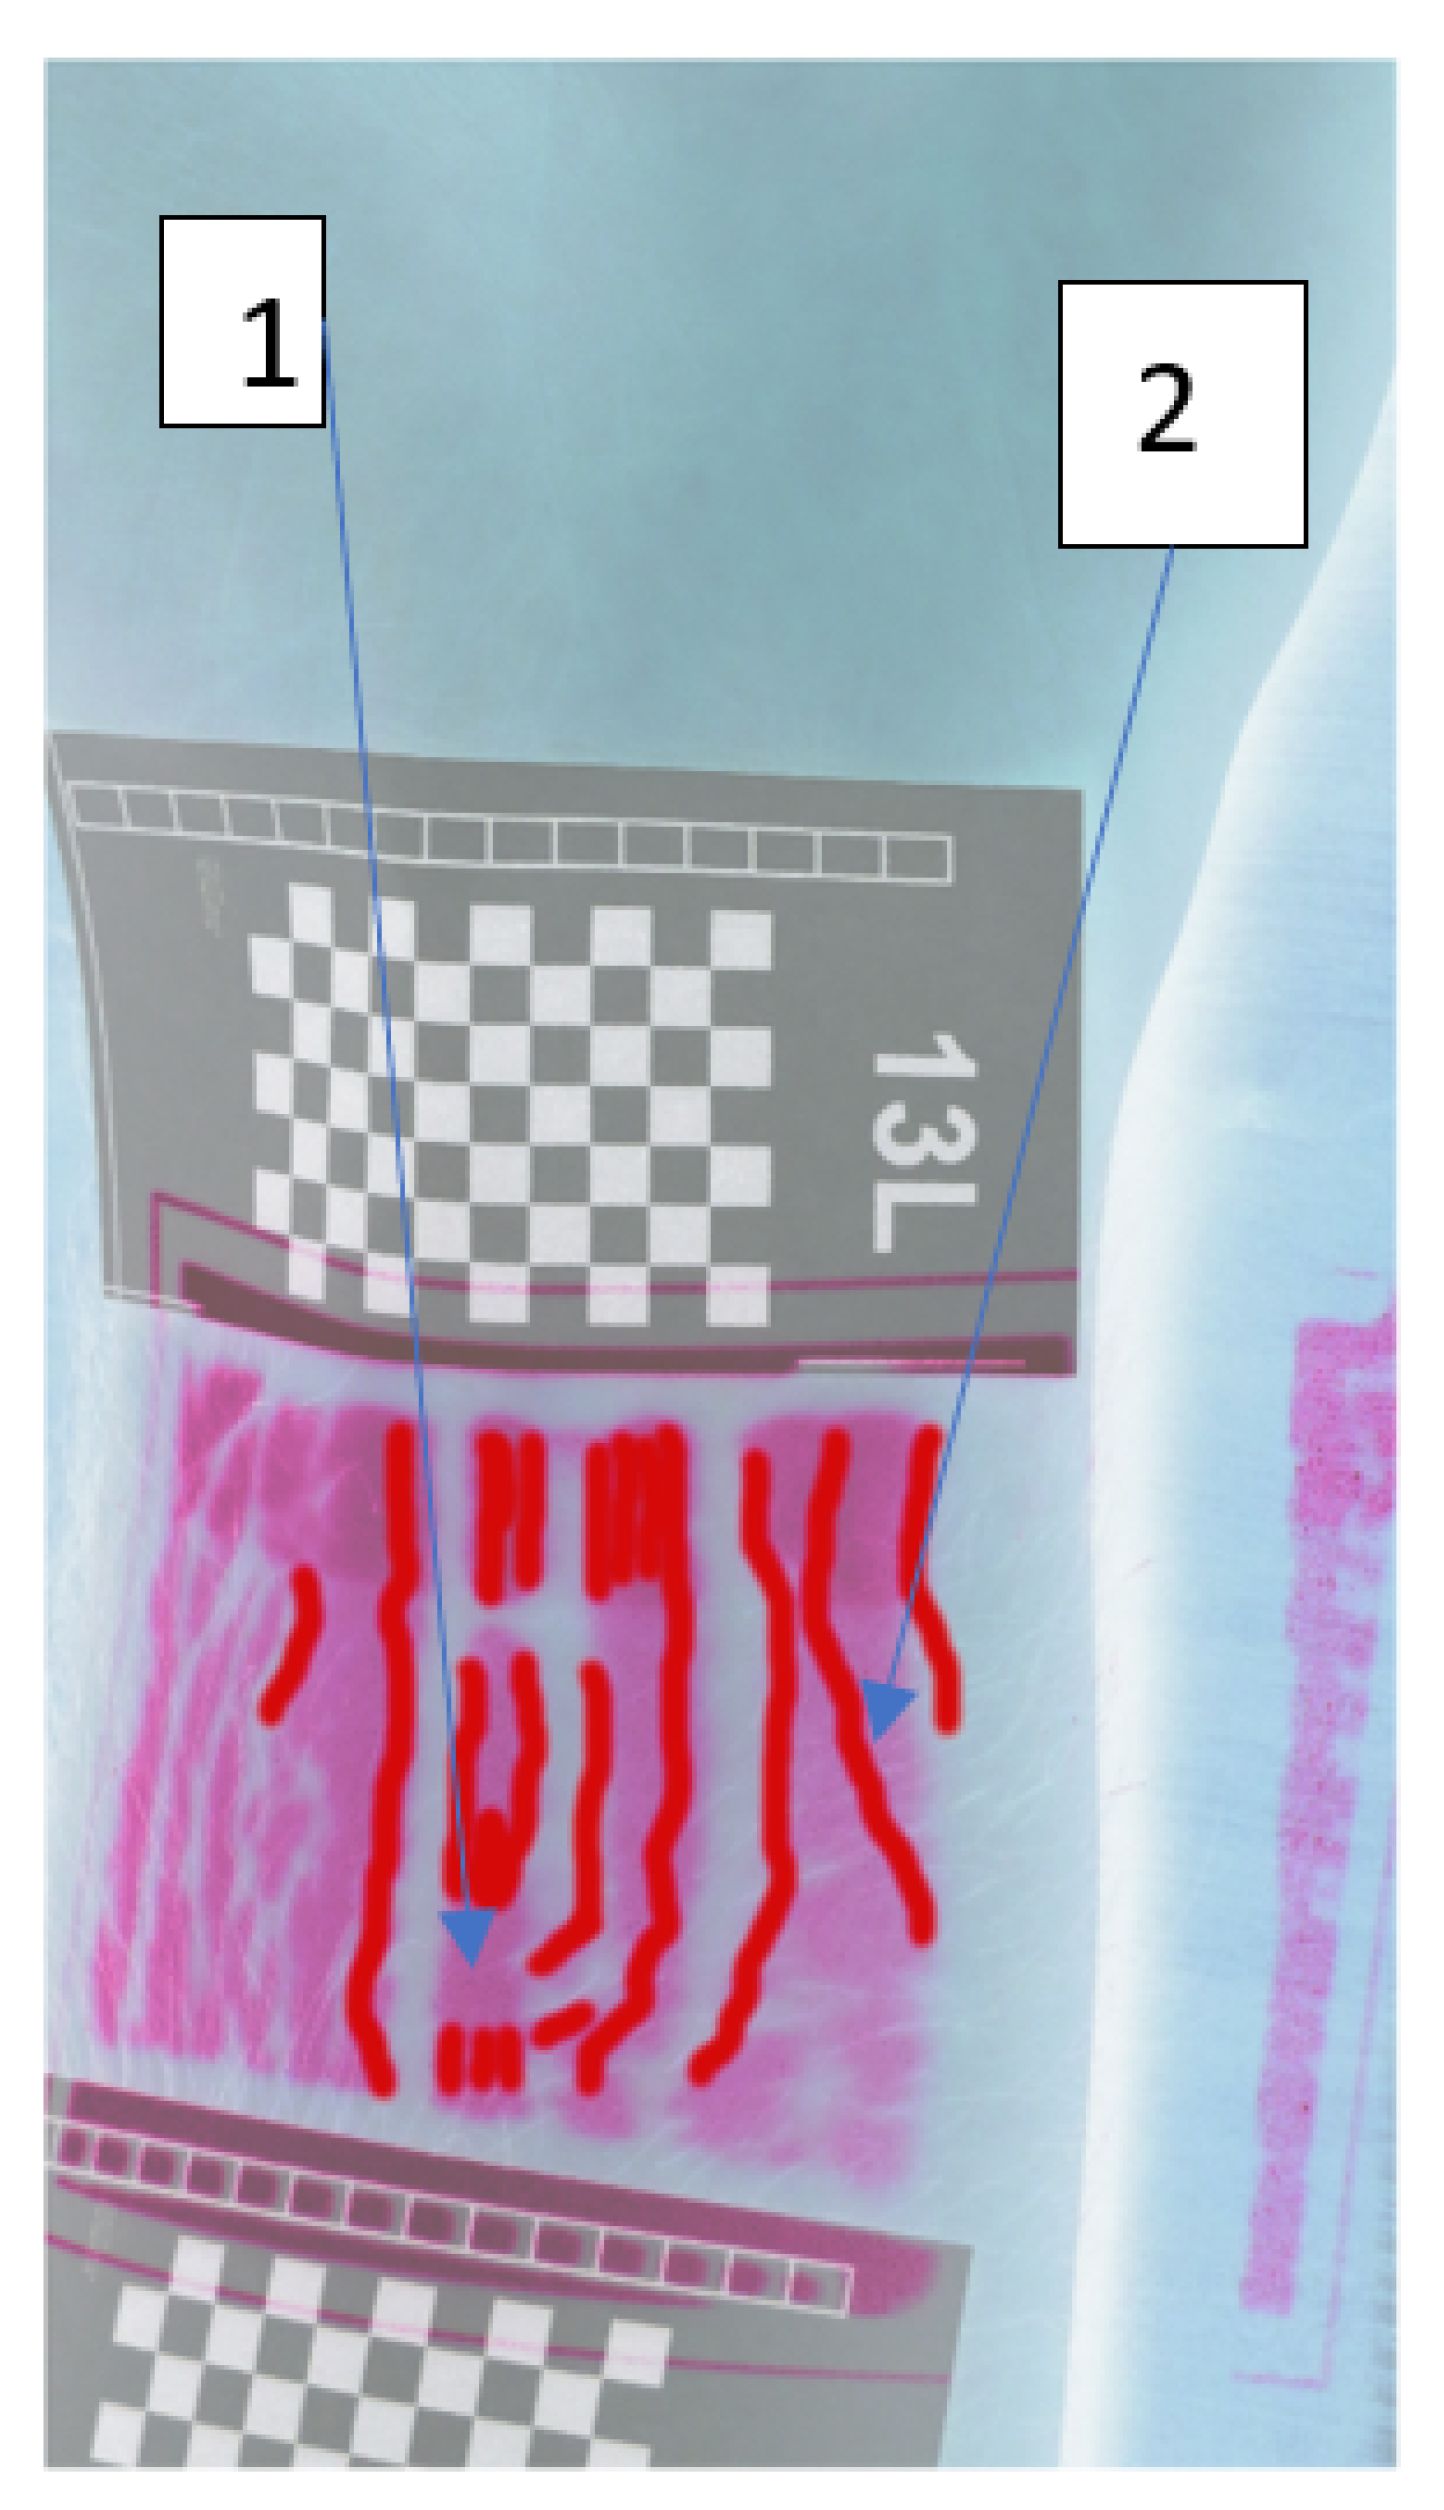
Figure 13 shows reference image with overlaid cumulative shifts from
Figure 12. In our opinion, this is the least accurate and legible image of the veins, so based on this image, we created the manually traced edges of the veins detected—
Figure 14. Some areas detected as ‘pulsating’ do not coincide with the base (1), and edges of veins not visible in the base were also detected (2).
The research carried out on a test group of 31 people confirmed that the proposed method can be used to detect pulsating veins, however, determining the qualitative parameters (accuracy of determining the location of veins, maximum depth of detected veins) of the method requires even more detailed tests. Our method allowed to detect the pulsation of about 70% of the veins visualized with the NAVI-60 device. Typically, compared to the reference device, the smallest veins were hardly visible. The calculations were made using our own software based on the OpenCV library. The average computation time for 120 measurement frames was 10 s (on the computer with Intel i5 8265 processor and 8GB RAM). According to the processor specifications and benchmark results, similar computation times should be possible with the Exynos 9820 processor used in the mobile device used for image acquisition. Therefore, it seems that the proposed algorithms can be fully implemented on mobile devices.


 ,
, 