Article

Unlocking the Patterns of the Tunisian Durum Wheat Landraces Genetic Structure Based on Phenotypic Characterization in Relation to Farmer’s Vernacular Name

1
Banque Nationale de Gènes, Boulevard du Leader Yasser Arafat Z. I Charguia 1, Tunis 1080, Tunisia
2
International Center for Agricultural Research in the Dry Areas (ICARDA), Rabat 10112, Morocco
3
Centro Internacional de Mejoramiento de Maíz y Trigo (CIMMYT), El Batán, Texcoco 56237, Mexico
4
Departamento de Genética, Escuela Técnica Superior de Ingeniería Agronómica y de Montes, Edificio Greogor Mendel, Campus de Rabanales, Universidad de Córdoba, CeiA3, 14071 Córdoba, Spain
*
Authors to whom correspondence should be addressed.
Agronomy 2021, 11(4), 634; https://doi.org/10.3390/agronomy11040634
Submission received: 27 January 2021 / Revised: 9 March 2021 / Accepted: 11 March 2021 / Published: 26 March 2021

Abstract

:
During the 1970s, Tunisian durum wheat landraces were replaced progressively by modern cultivars. These landraces are nowadays maintained by smallholder farmers in some ecological niches and are threatened gradually by extinction resulting in the narrowing of the genetic diversity. This study aims to investigate patterns of phenotypic variability using twelve quantitative traits in a panel of 189 durum wheat landraces and seven checks, based on farmer’s population name attribution and genetic structure. Our results showed high phenotypic variability among and within landraces and checks for ten out of twelve studied traits. The principal components analysis showed similar grouping using farmers name attribution and genetic structure using K = 6. These results confirmed the identification of a new gene pool in the oases of Tunisia, represented by the sub-population Jenah Zarzoura and the robustness and high relationships between phenotypic and genome-wide genetic structure using DArTseq method. These findings will enhance the conservation efforts of these landraces and their use in breeding efforts at national and international levels to adapt to dry conditions.

1. Introduction

Tetraploid wheats are among the first crops that were domesticated in the Fertile Crescent around 10,000 years ago [1,2], the period that coincided with the human civilization emergence, marked by several events such as the development of agricultural practices and the shift from the hunter-gatherer to a sedentary and cultivator lifestyle [3,4]. Domestication of durum wheat from its wild progenitor has undergone a series of genetic modifications, known as “the domestication syndrome” [5], involving changes in some morpho-physiological key traits through natural and ancient farmer’s selection, such as non-shattering seeds, non-brittle rachis, bigger seed size, seed dormancy reduction, reproductive strategy [4,5,6,7]; which enabled easier harvest and use.
The tetraploid wheat spread is associated with human migration, from the Fertile Crescent towards remote geographical regions and continents to reach North Africa. The oldest described way of this migration is terrestrial, which started from Egypt and continued south to Sudan and Ethiopia and north to eastern Libya [8]. The second route is maritime, first from Greece and Crete to Libya and then from the Sicilian peninsula to reach the coasts of Tunisia, Algeria, and Morocco [9]. The process of domestication and genetic evolution of the tetraploid wheat in the Mediterranean Basin was strongly influenced by environmental conditions and different farmers’ strategies selection for desirable agronomic and end-use traits, which induced the development of diverse and well-adapted durum wheat landraces to their agro-ecological zones of origin [10].
Several studies have described a wide genetic diversity in durum wheat populations from different geographical origins, based on qualitative and quantitative traits [11,12,13]. Particularly, the Mediterranean landraces showed a higher level of polymorphism and allelic richness for some quality traits compared to those from Southwest Europe and Southwest Asia [14,15]. The West Mediterranean landraces have shown their resistance to drought [16,17] and diseases [18], their phenotypic plasticity and their adaptability to harsh environmental conditions, and low in-put farmers agro-systems [19,20,21]. However, these landraces including the Tunisian ones are continually lost, due to farmer’s adoption of new high-yielding and homogenous cultivars released since the period of the Green Revolution in the 1970s, which resulted in narrowing the genetic diversity of durum wheat [10,22]. Boeuf [23] has described a large number of Tunisian durum wheat landraces, which have been crossed later since the 1970s with foreign landraces and have given rise to a large diversity of local populations [24], which erected Tunisia within the secondary centers of diversity for durum wheat [25]. Nowadays, only Tunisian smallholder farmers under traditional farming systems maintain some of these landraces with traditional agricultural practices and methods of conservation, in some ecological niches, to meet their food needs. The vernacular name of the Tunisian local traditional varieties was attributed by traditional farmers based on the color and shape of the spike as well as the geographical origin or the name of the oldest maintainers to recognize their innovative role [24].
Farmer’s management of these landraces has shaped the genetic diversity between and within landraces and their genetic structure. Several studies have reported high phenotypic diversity among the Tunisian durum wheat germplasm through evaluating agronomic and adaptative traits [19,26], and through phenotypic characterization based on the international standards descriptors of the International Plant Genetic Resources Institute (IPGRI) and the International Union for the Protection of New Varieties of Plants (UPOV) [26,27]. Besides the phenotypic diversity of durum wheat landraces, genetic population structure is also an important criterion to buffer the effects of climate change and biotic and abiotic stresses. Several molecular tools were used to assess the population structure of durum wheat collections [28,29,30]. To date, few studies were done on Tunisian germplasm [31,32]. Kehel et al. [33] demonstrated a structure of the genetic diversity of Moroccan and Syrian durum wheat landraces in relation to their spatial distribution using Bayesian and Eigen approaches. Soriano et al. [11] described a relationship between phenotypic performance and genetic structure. Our previous studies also described different patterns and a genetic structure of 196 lines issued from durum wheat landraces, collected in the south of Tunisia, based on Diversity Array Technology sequencing (DArTseq) [31]. However, no investigations up to now have been done on the structure based on agro-morphological diversity among these landraces in relation to farmers’ nomenclature and management. Towards a better understanding of the genetic population structure of this collection, the present study aims to (1) assess the phenotypic diversity based on ten agro-morphologic and two phenological traits evaluated across six environments, (2) unlock the genetic structure based on agro-morphological characterization related to farmers’ vernacular name or/and to the genetic groups described on our previous study [31], and (3) characterize the newly identified Tunisian population Jenah Zarzoura.

2. Materials and Methods

2.1. Plant Material

In this study, we used a collection of 189 lines derived from six Tunisian durum wheat landraces. These landraces were collected from the Central, the Southern and the Oases of Tunisia and were identified by farmers as (Table 1): Bidi (30), Biskri (37), Jenah Zarzoura (30), Jenah Khoutifa (32), Mahmoudi (30), and Rommani (30). The landraces Biskri and Jenah Khotifa are represented by two populations as described in Table 1. Seven ICARDA elite lines were used as checks (Table 2). In our previous work seven lines of Biskri were identified as local improved varieties [31].

2.2. Field Experimental Trials

Field trials were conducted in two contrasting zones of Tunisia: (i) Mornag locality, belonging to the semi-arid bioclimatic zone with mild winter (latitude: 35°59′31.36″ N; longitude: 9°58′48.12″ E), where the experiments were carried out under rainfed conditions during two cropping seasons 2015 and 2016 (MOR RF), and (ii) Kairouan locality belonging to the arid bioclimatic zone with cool winter (latitude: 35°39′31.93″ N; longitude: 9°55′39.53″ E), where the experiments were carried out under two controlled water regimes during two cropping seasons 2016 and 2017 (full irrigated regime (KAIR IR) using 100% of the evapotranspiration (ETR) and stressed regime (KAIR STR) using 25% of the evapotranspiration (ETR)). The 196 lines were sown at a seeding rate of 350 seeds/m2 in a two m2 plot (with 4 rows of 2 m long and 0.25 m apart) and arranged respectively on 14×14 alpha lattice design with two replications. Optimal agronomic management including soil preparation, fertilization, weeding, and disease control were applied in each site.

2.3. Phenotypic Characterization

Five plants were randomly sampled from the two central rows of each plot and were used to record five agro-morphological traits: Plant height (H; cm) measured from tillering node to the top of the spike (excluding awns) of the main stem at maturity stage, flag leaf area (FLA; cm2) estimated by a planimeter (AM 300 Field Portable Leaf Area Meter—Opti-Sciences), spike length (MLB; cm), awn length ( MLE, cm) and number of spikelet per spike (NEE) were scored based on wheat descriptors of the International Board for Plant Genetic Resources (IBPGR). The remaining grain morphological traits were recorded after harvesting the two central rows and analyzed in CIMMYT Wheat Chemistry and Quality laboratory, including thousand kernel weight (TKW; g) seed width (SW, mm), seed thickness (ST, mm), seed length (SL, mm) and seed total area (TA, mm2), which were measured by digital image analyzer (SeedCount SC5000, Next Instruments, Condell park NSM, Australia).
The phenological data were recorded according to Zadoks scale, on plot basis, for days to heading (HD, days) and days to maturity (DM, days).

2.4. Genetic Landraces Patterns Analysis

The panel of 196 lines was analyzed in a previous study [31] for genetic diversity and population structure using DArTseq method. Two outcomes were highlighted in this study. First, a population structure with number of groups K = 5, which was efficient to differentiate most of the landraces related to their Farmer’s nomenclature. Second, on the basis of number of groups K = 6, the genetic structure showed a mixture of landraces lines separated from all other landraces and was considered as local improved varieties (MIX_VAR).
Therefore, the lines used in this study were categorized based on their names attributed by farmers, and to their respective groups K = 5 and K = 6 issued from the genetic population structure.

2.5. Statistical Analysis

Phenotypic data recorded for twelve traits from separate environments were analyzed based on a linear mixed model below:
Y   =   μ   +   r   +   ICB   +   G   +   ε
where μ and r are the grand mean and replication effects considered to be as fixed. ICB and G are incomplete blocks within a replica and the genotypes effects considered to be random. ε   are the residuals from the model assumed to be randomly and normally distributed.
Broad sense heritability (H2) of a trait in each environment was computed as follow [34]:
H 2 = Var   ( G ) Var   ( G ) +   Var   ( ε ) n
where Var (G) and Var (e) are genotypic and residual variances and n is the replication number. Percentage genotypic variance was computed the percentage of variance explained by the genotype from the total phenotypic variance.
A multi-environment analysis was done using a linear mixed model as follow:
Y   =   μ   +   E +   r   ( E )   +   ICB   ( E )   +   G   +   GxE +   ε
where μ , E and r(E) are the grand mean, environment and replication effects considered to be as fixed. ICB (E), G and GxE are incomplete blocks within an environment, genotype and the genotype by environment effects considered to be random. ε   are the residuals from the model assumed to be randomly and normally distributed. Broad sense heritability (H2) of a trait across environments was computed as follow:
H 2 = Var   ( G ) Var   ( G ) + Var   ( GxE ) e   +   Var   ( ε ) n     e
where Var (G), Var (GxE) and Var ( ε ) are genotypic, GxE and residual variances and e, n are the environment and replication numbers respectively.
Three other linear mixed models were fitted for the twelve traits according to the three genetic landraces patterns as below:
Y = μ + r + ICB + Grp + G +   ε
where μ and r are the grand mean and replication effects considered to be as fixed. ICB, G, and Grp are incomplete blocks within a replica, the genotypes effects and the group effects were considered to be random. The group effects were based on landrace’s name, landraces grouping using K = 5 and K = 6 [31]. ε   are the residuals from the model assumed to be randomly and normally distributed.
Variation explained by the groups was computed as Var (Grp)/Total variance x 100 which reflects the reduction from the genotypic variance due to the group covariate in the model. All mixed modeling was done using AsReml-R 3.0 package [35,36] in R (R Core Team 2018).
Principal component analysis PCA using adjusted means values of all the traits across environments from the first mixed model was executed using pcaMethods package in R [37]. We used singular value decomposition (svd) and data was scaled and centered.
Finally, we tested statistically the significant difference between different group of landraces in a multi-trait level framework using the three different grouping: Name, genetic group assessed with K = 5 and with K = 6 by analysis of the partitioning sums of squares based on dissimilarities. The analysis was done using vegan package in R project [38,39].

3. Results

3.1. Heritability and Variability of Agro-Morphological and Phenological Traits in Tunisian Durum Wheat Germplasm Collection

In this study, the broad sense heritability (H2) estimated for ten agro-morphological and two phenological traits across six environments, in a collection of 196 accessions, showed high values (H’2 ~ 0.9) for ten out of twelve traits (Table 3). The highest value was observed for heading date (HD, 0.98) and the lowest value was seen for plant height (H’2, 0.60).
Across the different environments, the highest values of heritability were observed for the two phenological traits, heading date (HD) and maturity date (MD), with a range from 0.94 to 0.98 and from 0.80 to 0.96, respectively. A similar range was observed for plant height (0.86–0.96) and seed length (SL) (0.80–0.98). For the remaining agro-morphological traits, our results showed medium to high heritability estimates for the majority of the traits in most of the environments. Medium heritability values were observed for ST (0.65), SW (0.71), TKW (0.64), and LB (0.66) in Mornag locality (MOR RF 2016), and very low values were seen (H2 ≤ 0.36) for flag leaf area (FLA) in Kairouan locality (KAIR IR 2017). However, the number of spikelets/spike (NEE) showed lower heritability across all environments ranging from 0.61 to 0.71.
The Tunisian durum wheat landraces lines showed higher values of plant height with a range of 50.89 cm and 95.82 cm compared to the checks (min: 49.73 cm–max: 69.51 cm), bigger flag leaf area (FLA, mean: 3906.32), later heading date (HD, mean = 128) and maturity date (MD, mean = 168), respectively (Supplementary Table S1). For the durum wheat lines, the highest variability was observed for FLA (12.38%), flowed by TKW (10.83%) and plant height (9.80%) compared to those for checks, which showed the highest variability for plant height (12.28%), spike length (11.15%) and flag leaf area (10.87%) (Supplementary Table S1).

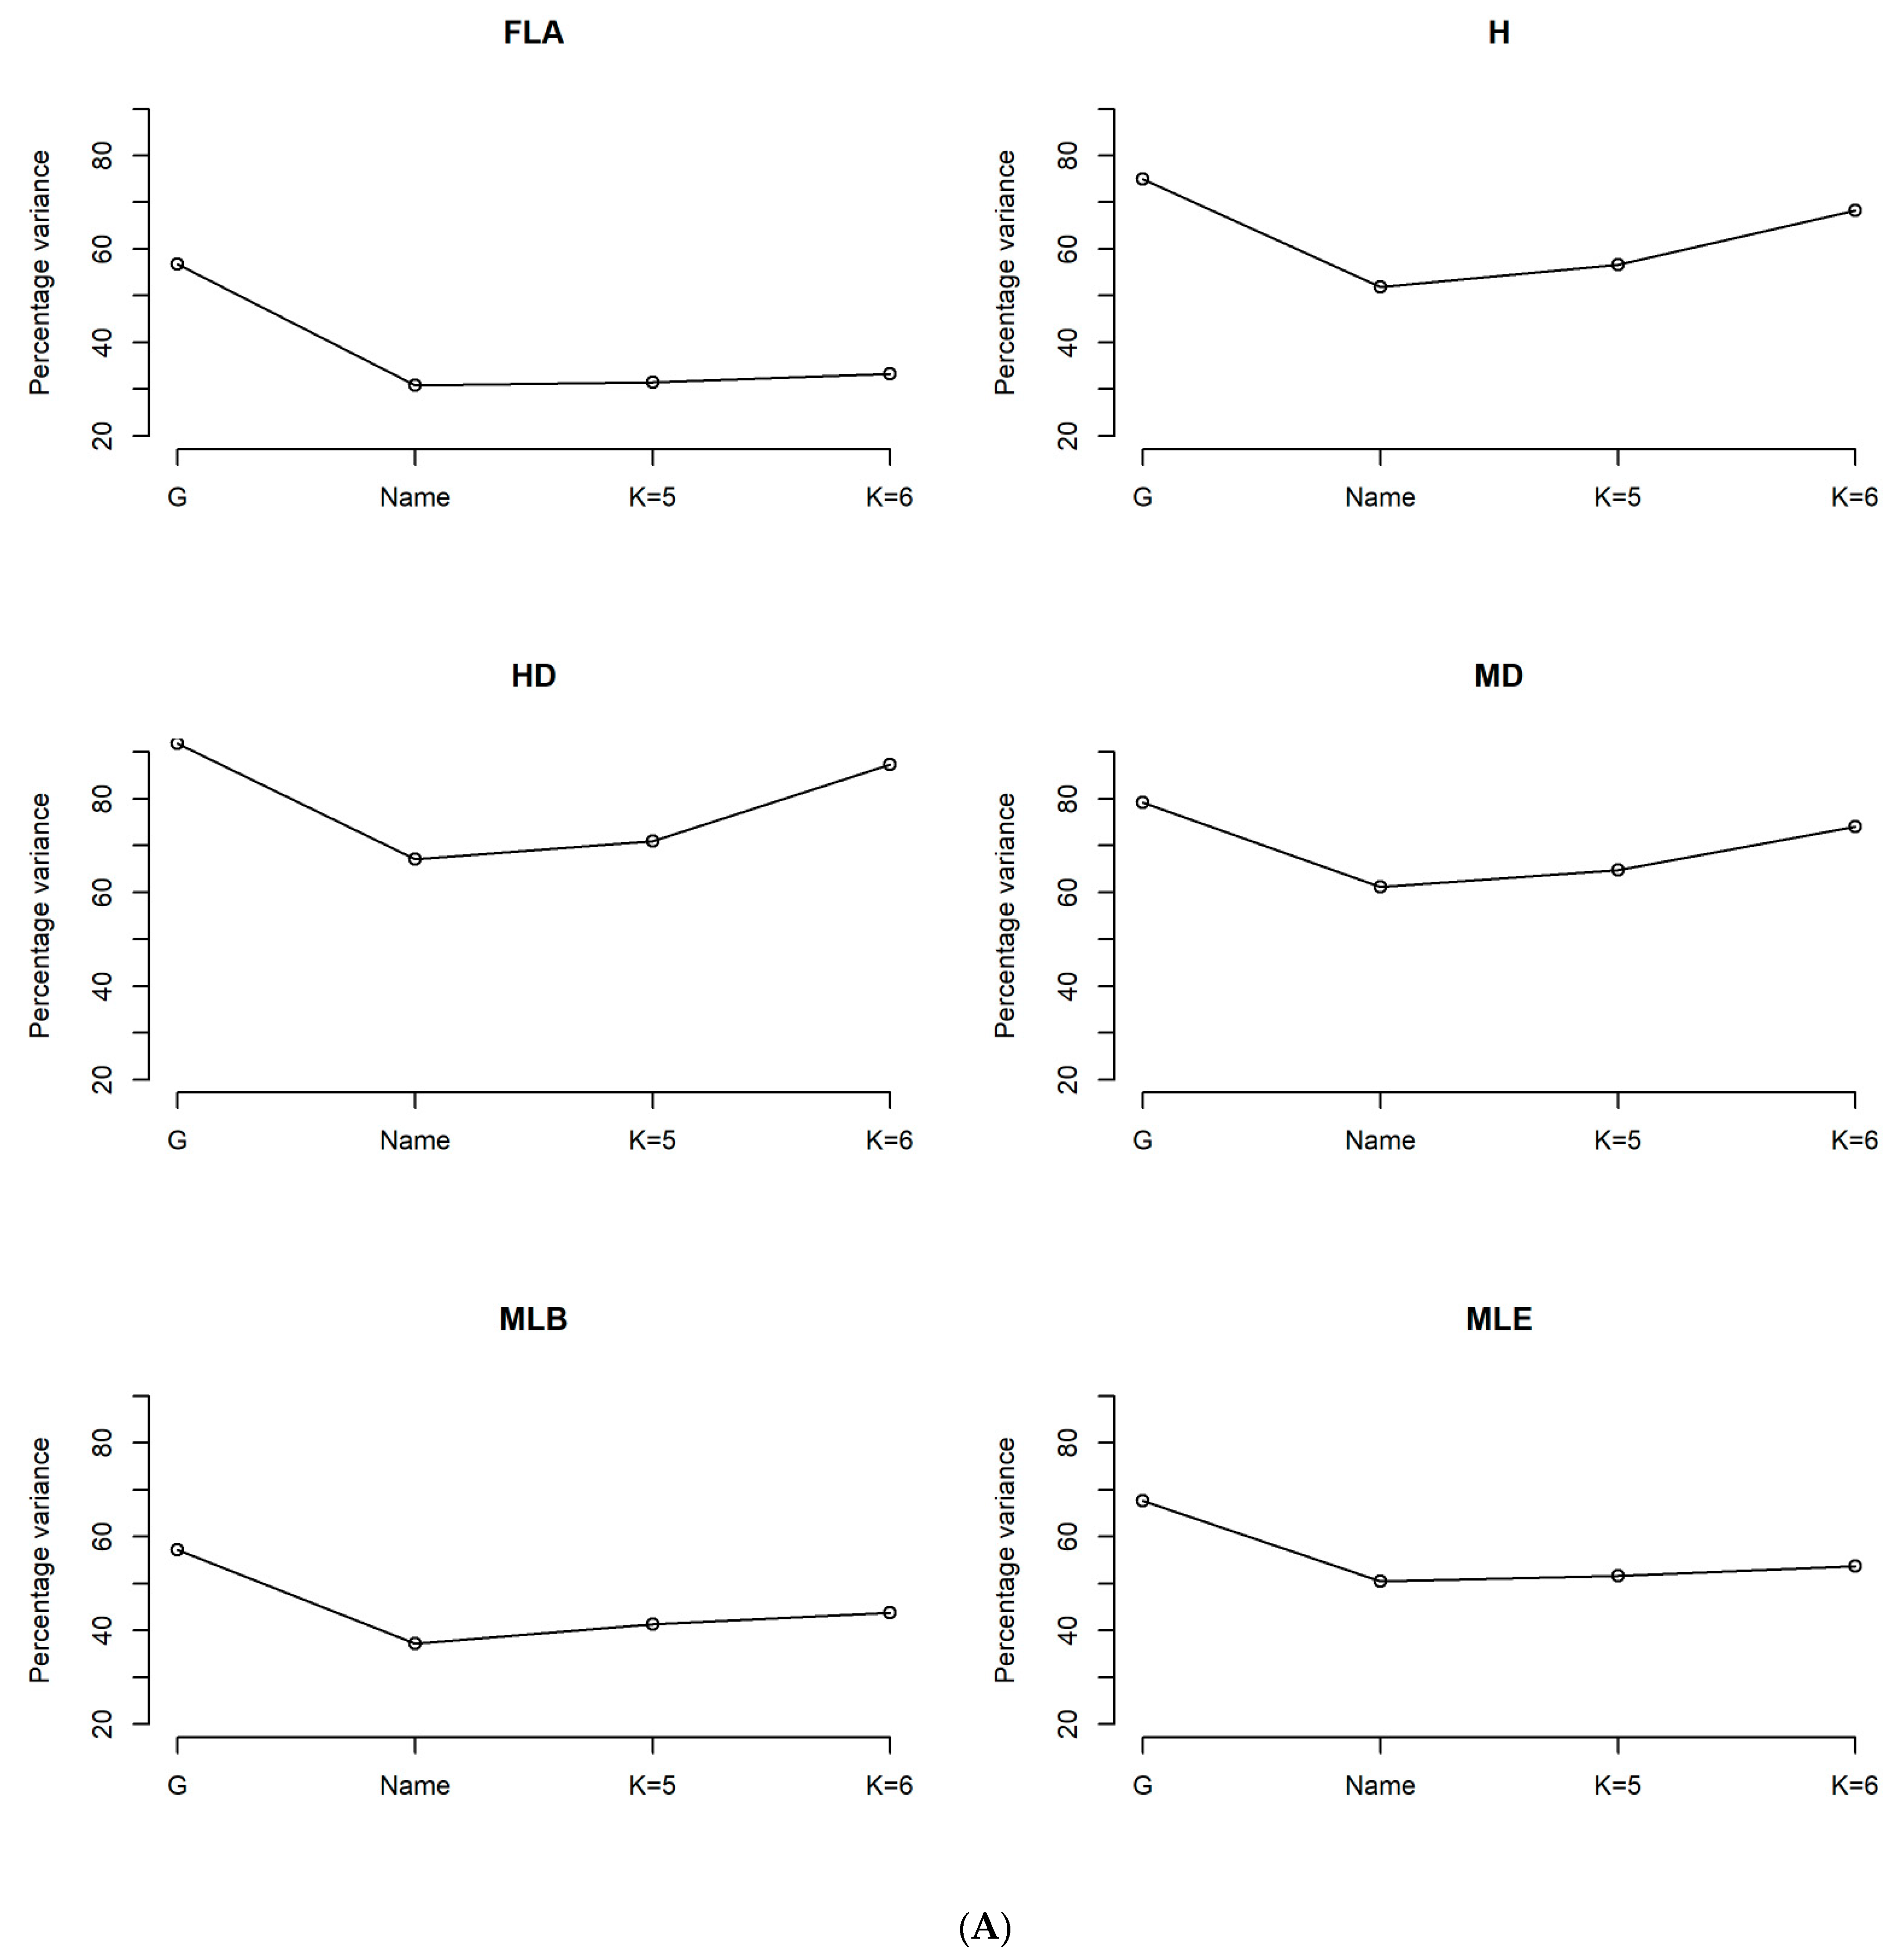
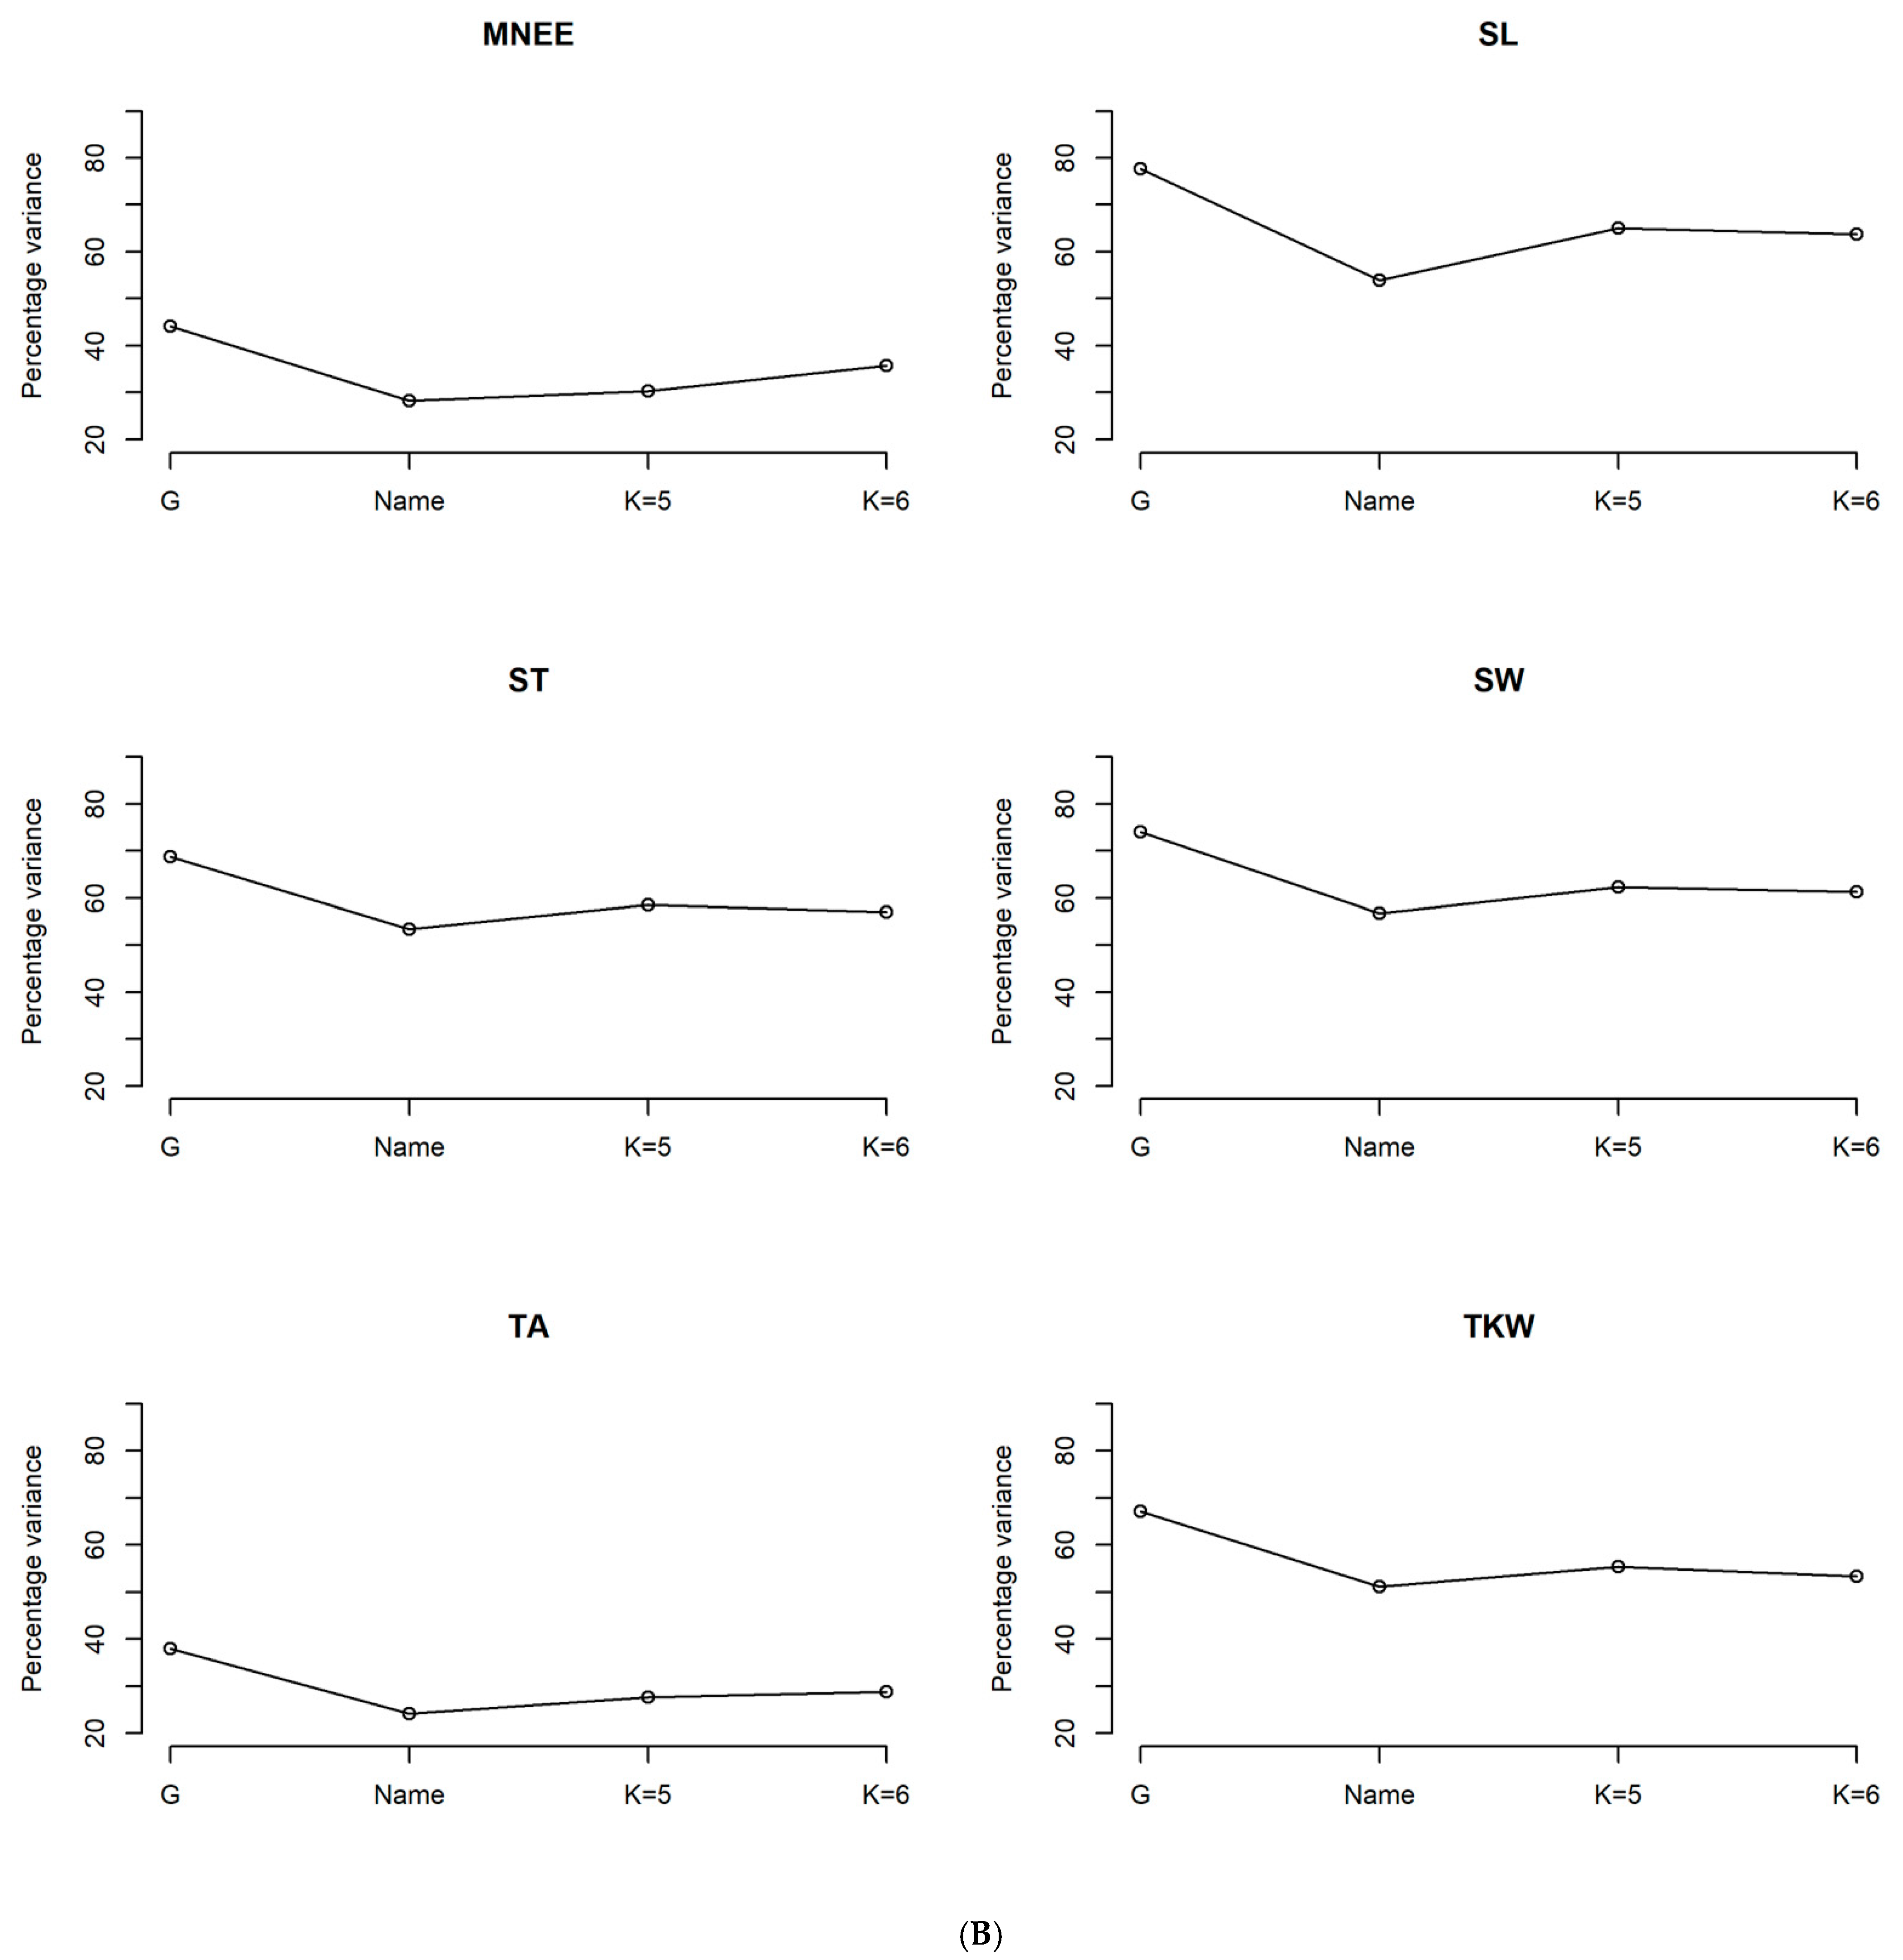
3.2. Analysis of Variance

The percentage of variance explained by the genotypes (G) across the six environments (Figure 1A,B), showed the lowest value for the total seed area (TA; 38%) compared to the highest one observed for heading date (HD; 91%). The genotypic variance (G) explained more than 50% of the total phenotypic variation for 10 out of 12 studied traits (Figure 1).
The percentage variance explained by the farmer’s population name (Name) as showed in Figure 1A,B had a large contribution of the total phenotypic variation, which was more than 50% for 8 traits. However, we observed a different level of the phenotypic variance reduction due to the farmer’s name attribution. This reduction was low for TA (14%), ST (17%), TKW (13%), and MNEE (15%), but it was higher for FLA (25%), SL, and HD (23%).
The collection of 196 accessions used in this study was structured in our previous work into five sub-populations K = 5 to differentiate between the sub-populations and into six sub-populations K = 6, which showed a mixture of landraces lines considered as local improved varieties [31]. Landraces assignment to the genetic groups using the number of sub-populations K = 5, explained a slightly higher portion of the total phenotypic variation compared to that explained by farmer’s name attribution. This increase was observed mainly for SL (11%), ST (5%), and SW (5%) (Figure 1B). The observed explained variation for the eight traits, as that due to the farmer’s name attribution, was almost conserved. The highest explained variation was observed for HD trait (70%), followed by MD and SL (64%), SW (62%), and H (51%) traits, and the lowest one was seen for TA (27%), MNEE (30%) and FLA (31%) traits (Figure 1A,B).
For landraces assignment to the genetic groups using the number of sub-populations K = 6, we noticed in Figure 1A,B an increase of the explained variance compared to that explained by farmer’s name attribution and also to that explained by the landraces assignment with K = 5. This increase ranged from 2 to 4 % for TKW, FLA, MLE, ST, SW, and TA to 16% and 20% for H and HD, respectively.
A complementary analysis of partitioning sum of squares of all the traits used in this study based on different landraces grouping levels: “Names” for farmers population name attribution, “K = 5 and K = 6” for sub-populations structured by Robbana et al. [31], revealed that all the grouping levels explained a large portion of the trait variance (>64%) (Table 4) and showed a highly significant difference (p = 0.001) among the sub-populations. The highest variance was explained by the genetic population structure assessed with K = 6 (76%), followed by the grouping level with K = 5 (65.06%), in comparison to the one based on farmers population name attribution (64.81%).

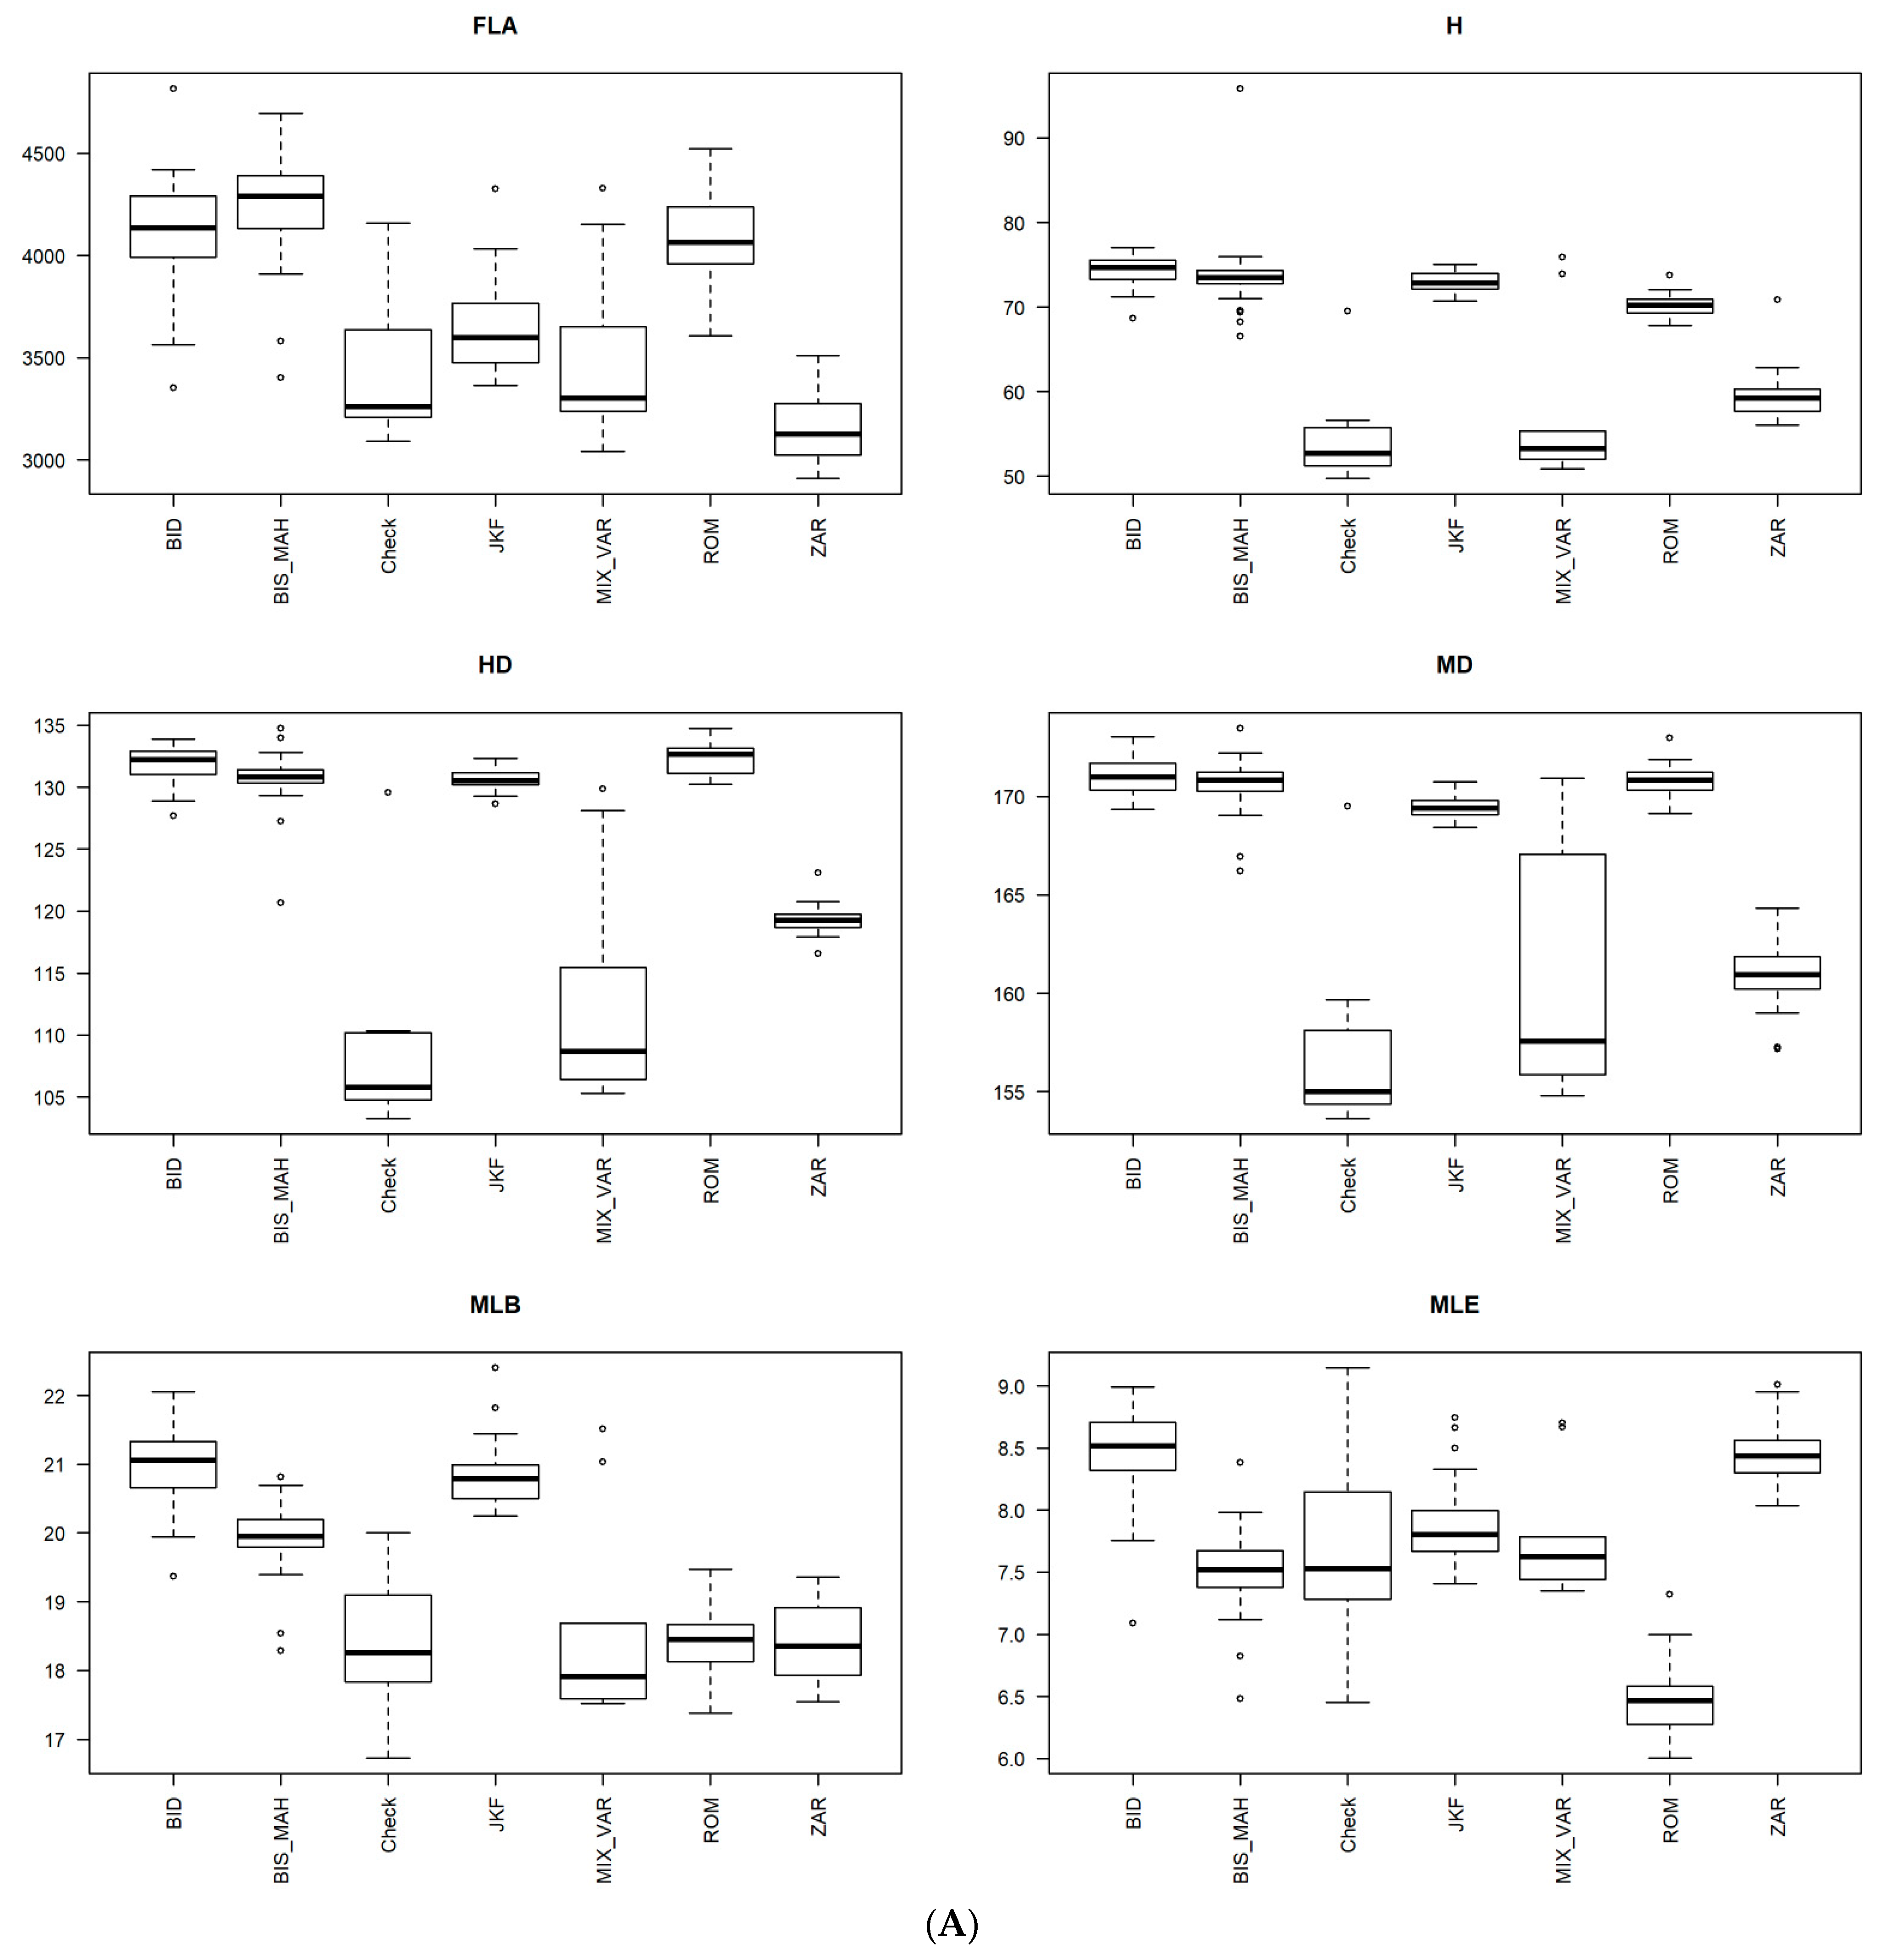
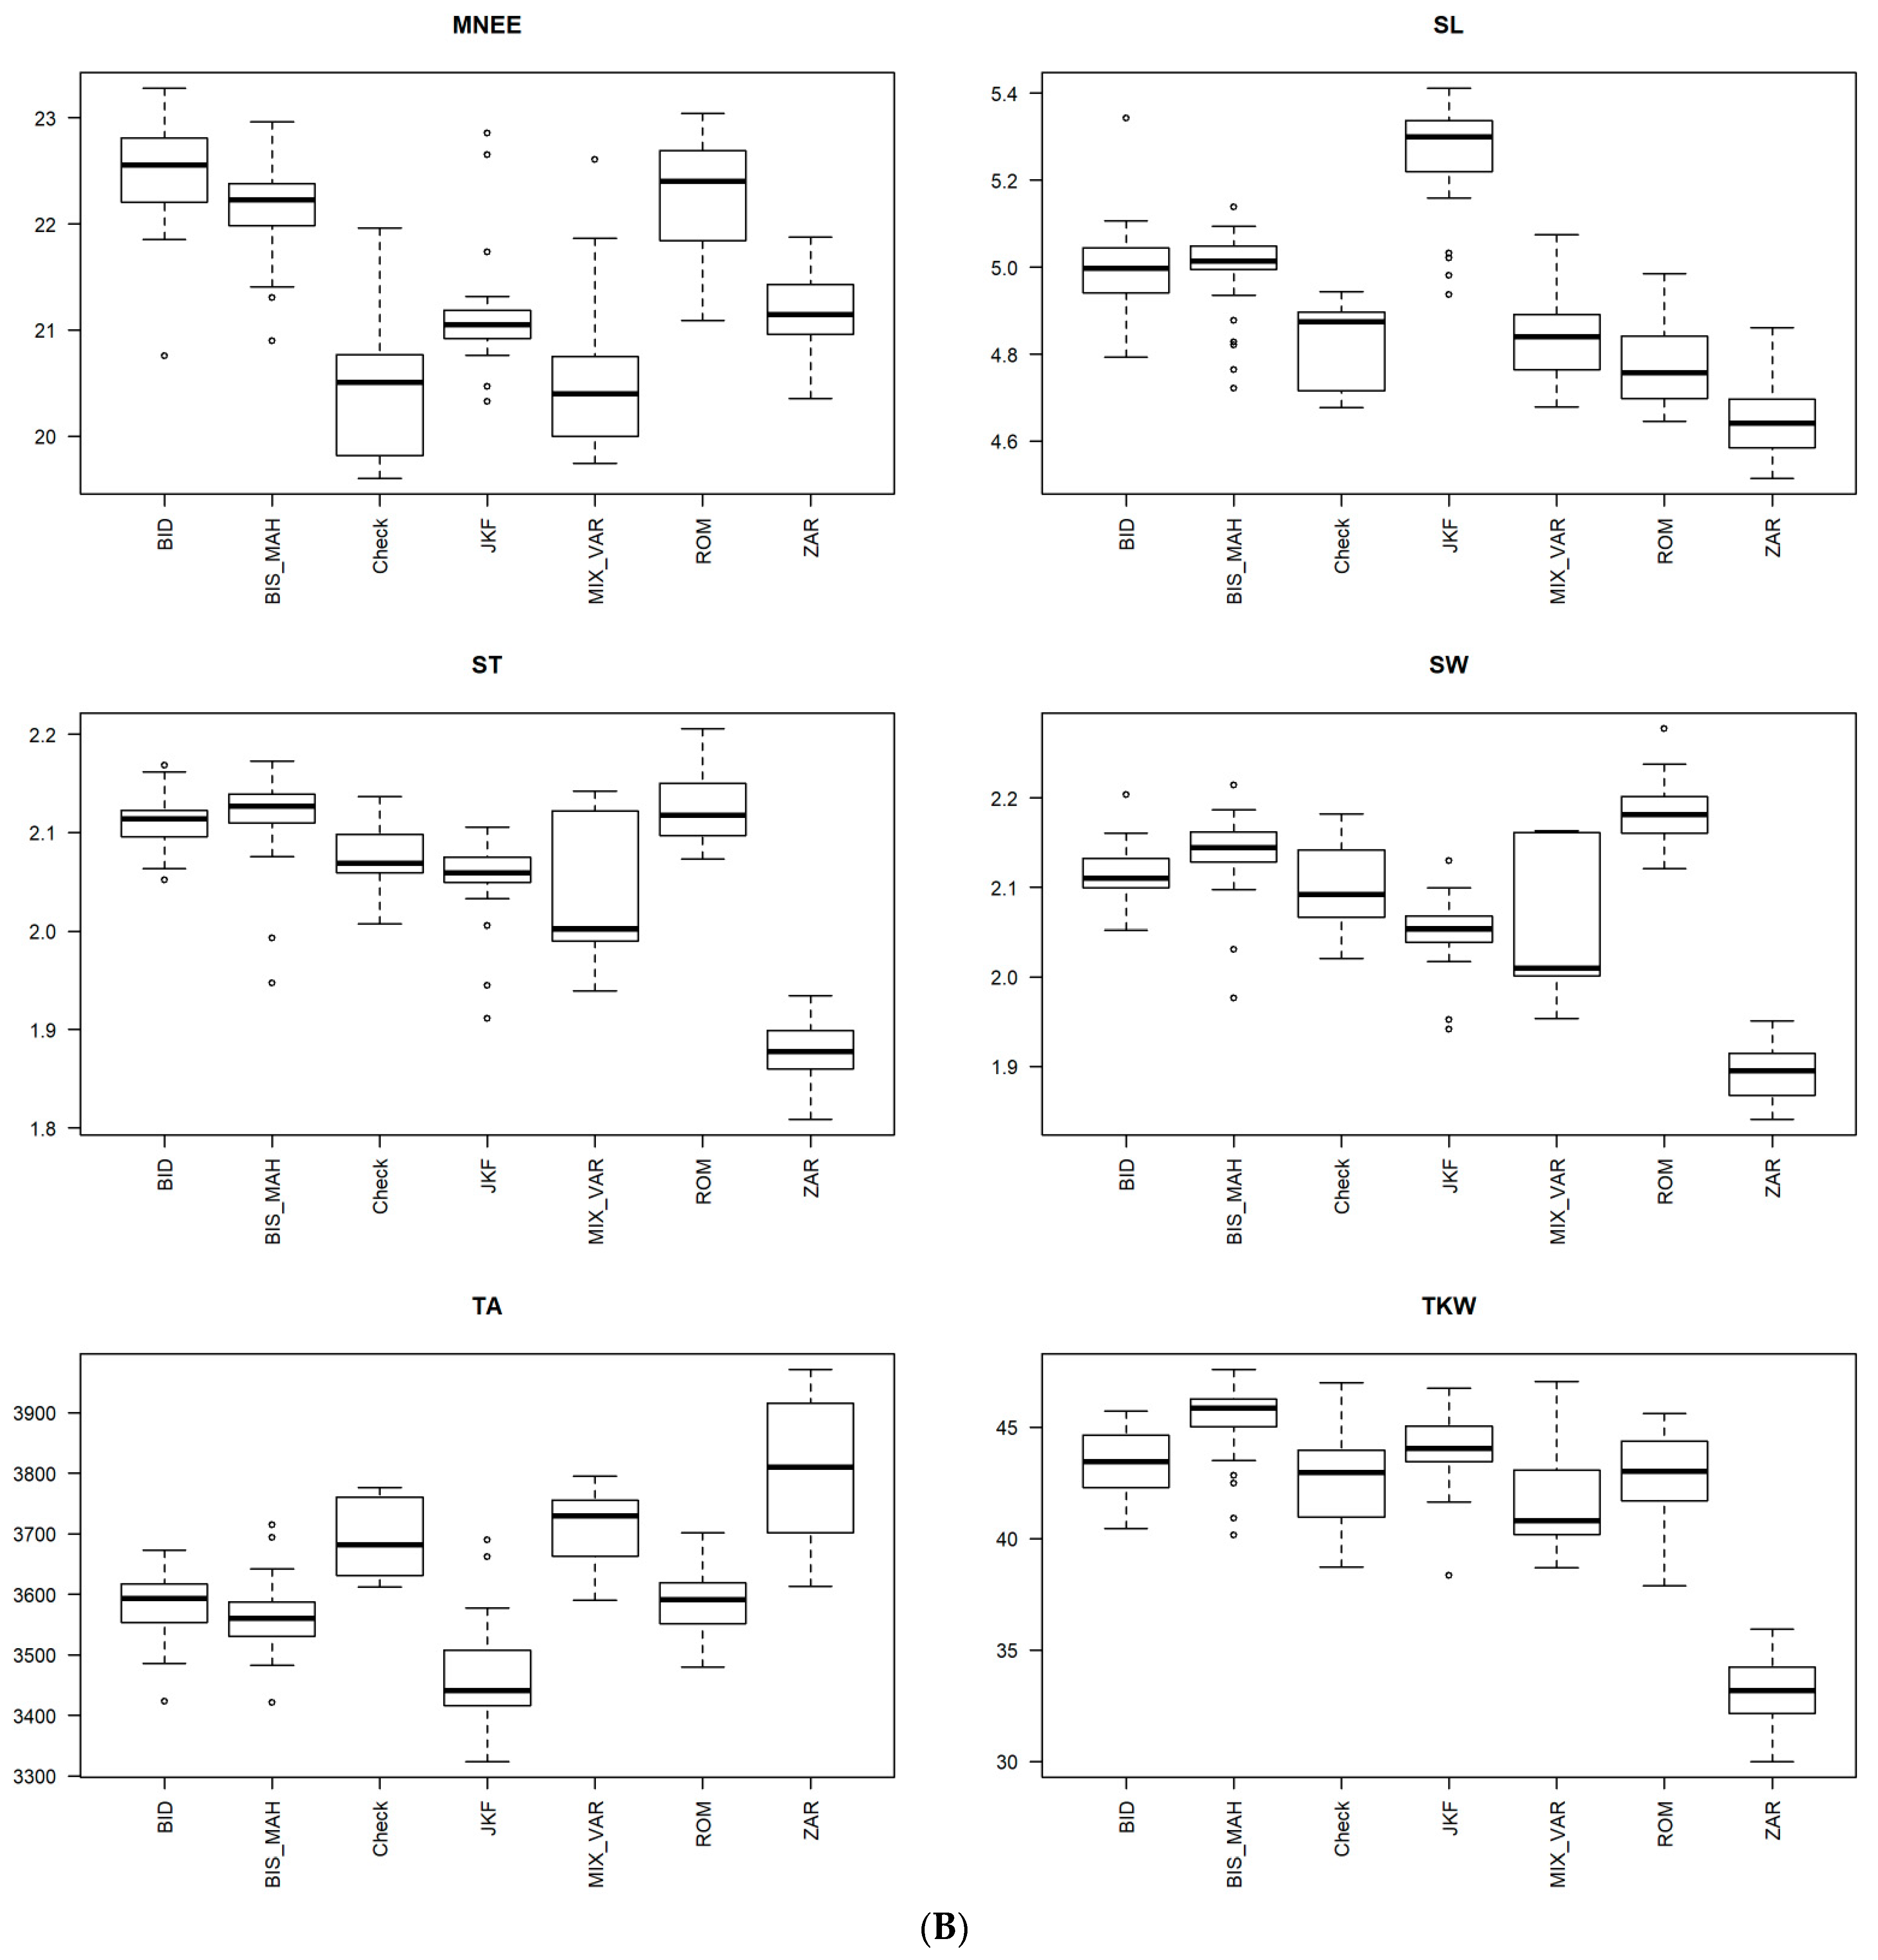
3.3. Phenotypic Characterization Based on the Genetic Structure Using the Optimal Number of Sub-Population (K = 6)

Based on the genetic population structure using K = 6, means comparison across the six environments of all the traits between the seven sub-populations are presented in Figure 2A,B. It was confirmed that the additional group composed of mixture lines (MIX_VAR) included improved varieties, which presents the same variability and characteristics as the ICARDA elite lines, such as earliness for heading (HD) and maturity (MD) dates (around 110 and 160, respectively), short status with a plant height (H) around 100 cm, higher thousand kernel weight (TKW) with a mean around 40 g and number of spikelets/spike (MNEE) around 20. For almost all the studied traits, the boxplots analysis showed the presence of phenotypic diversity within the different landraces and improved varieties patterns. Compared to the other landraces, the sub-population Jenah Zarzoura possessed higher variability for most of the traits and distinctive characteristics. This landrace exhibited lower HD and MD than the five other landraces, but these traits were slightly higher than the mixture lines grouping (MIX_VAR) and the checks (Check) (Figure 2A). Jenah Zarzoura was shorter than the other landraces and taller than the mixture lines grouping (MIX_VAR) and the checks (Check) (Figure 2A). According to the morphometric traits related to the seed size, Jenah Zarzoura sub-population showed the lowest seed length (SL), seed thickness (ST), and seed width (SW) (Figure 2B). Furthermore, this landrace showed the lowest thousand kernel weight (TKW) (Figure 2B) and the lowest flag leaf area (FLA) (Figure 2A) compared to the other sub-populations including local improved varieties and ICARDA elite lines. The landraces Bidi (BID), Biskri/Mahmoudi (BIS_MAH), Jenah Khotifa (JKF) and Rommani (ROM) showed similar patterns and variability for HD, MD and H. However, Bidi showed the highest awn length (MLB) and spike length (MLE) (Figure 2A). On the other hand, Rommani showed the lowest awn length (MLB), spike length (MLE), seed length (SL), and the highest seed width (SW). Jenah Khotifa showed the highest seed length (SL) and the lowest flag leaf area (FLA) (Figure 2A,B).

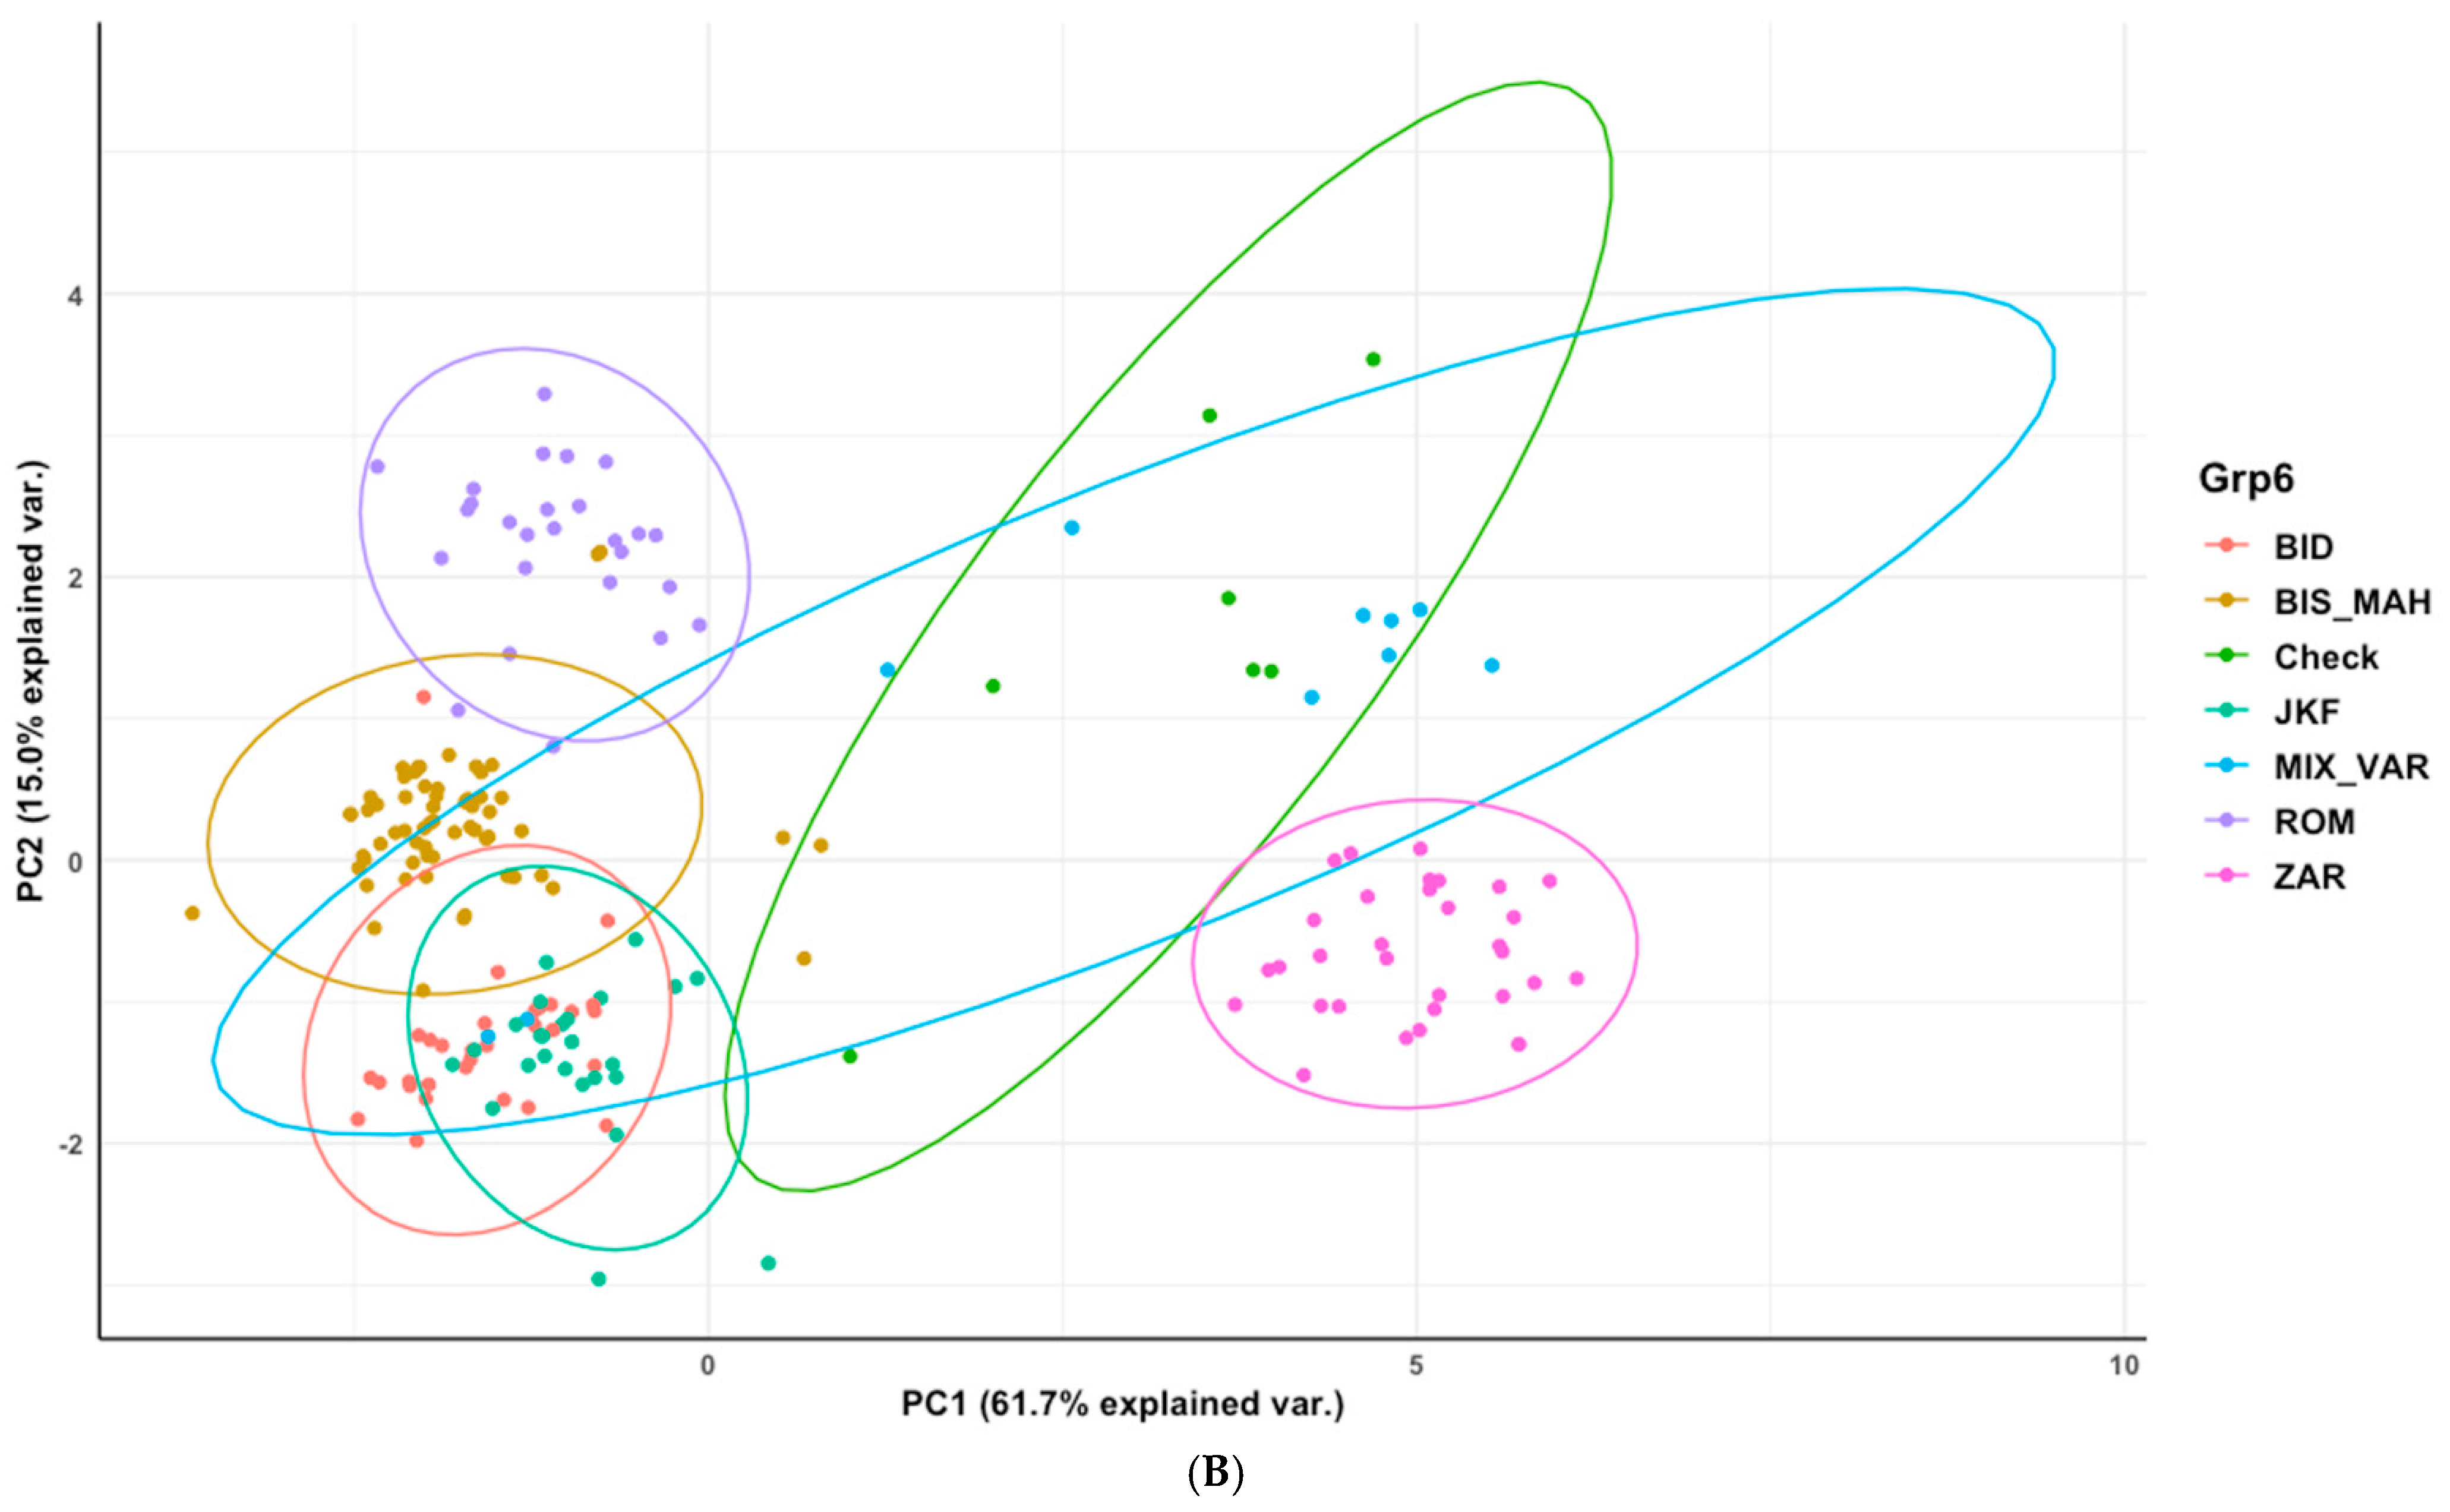
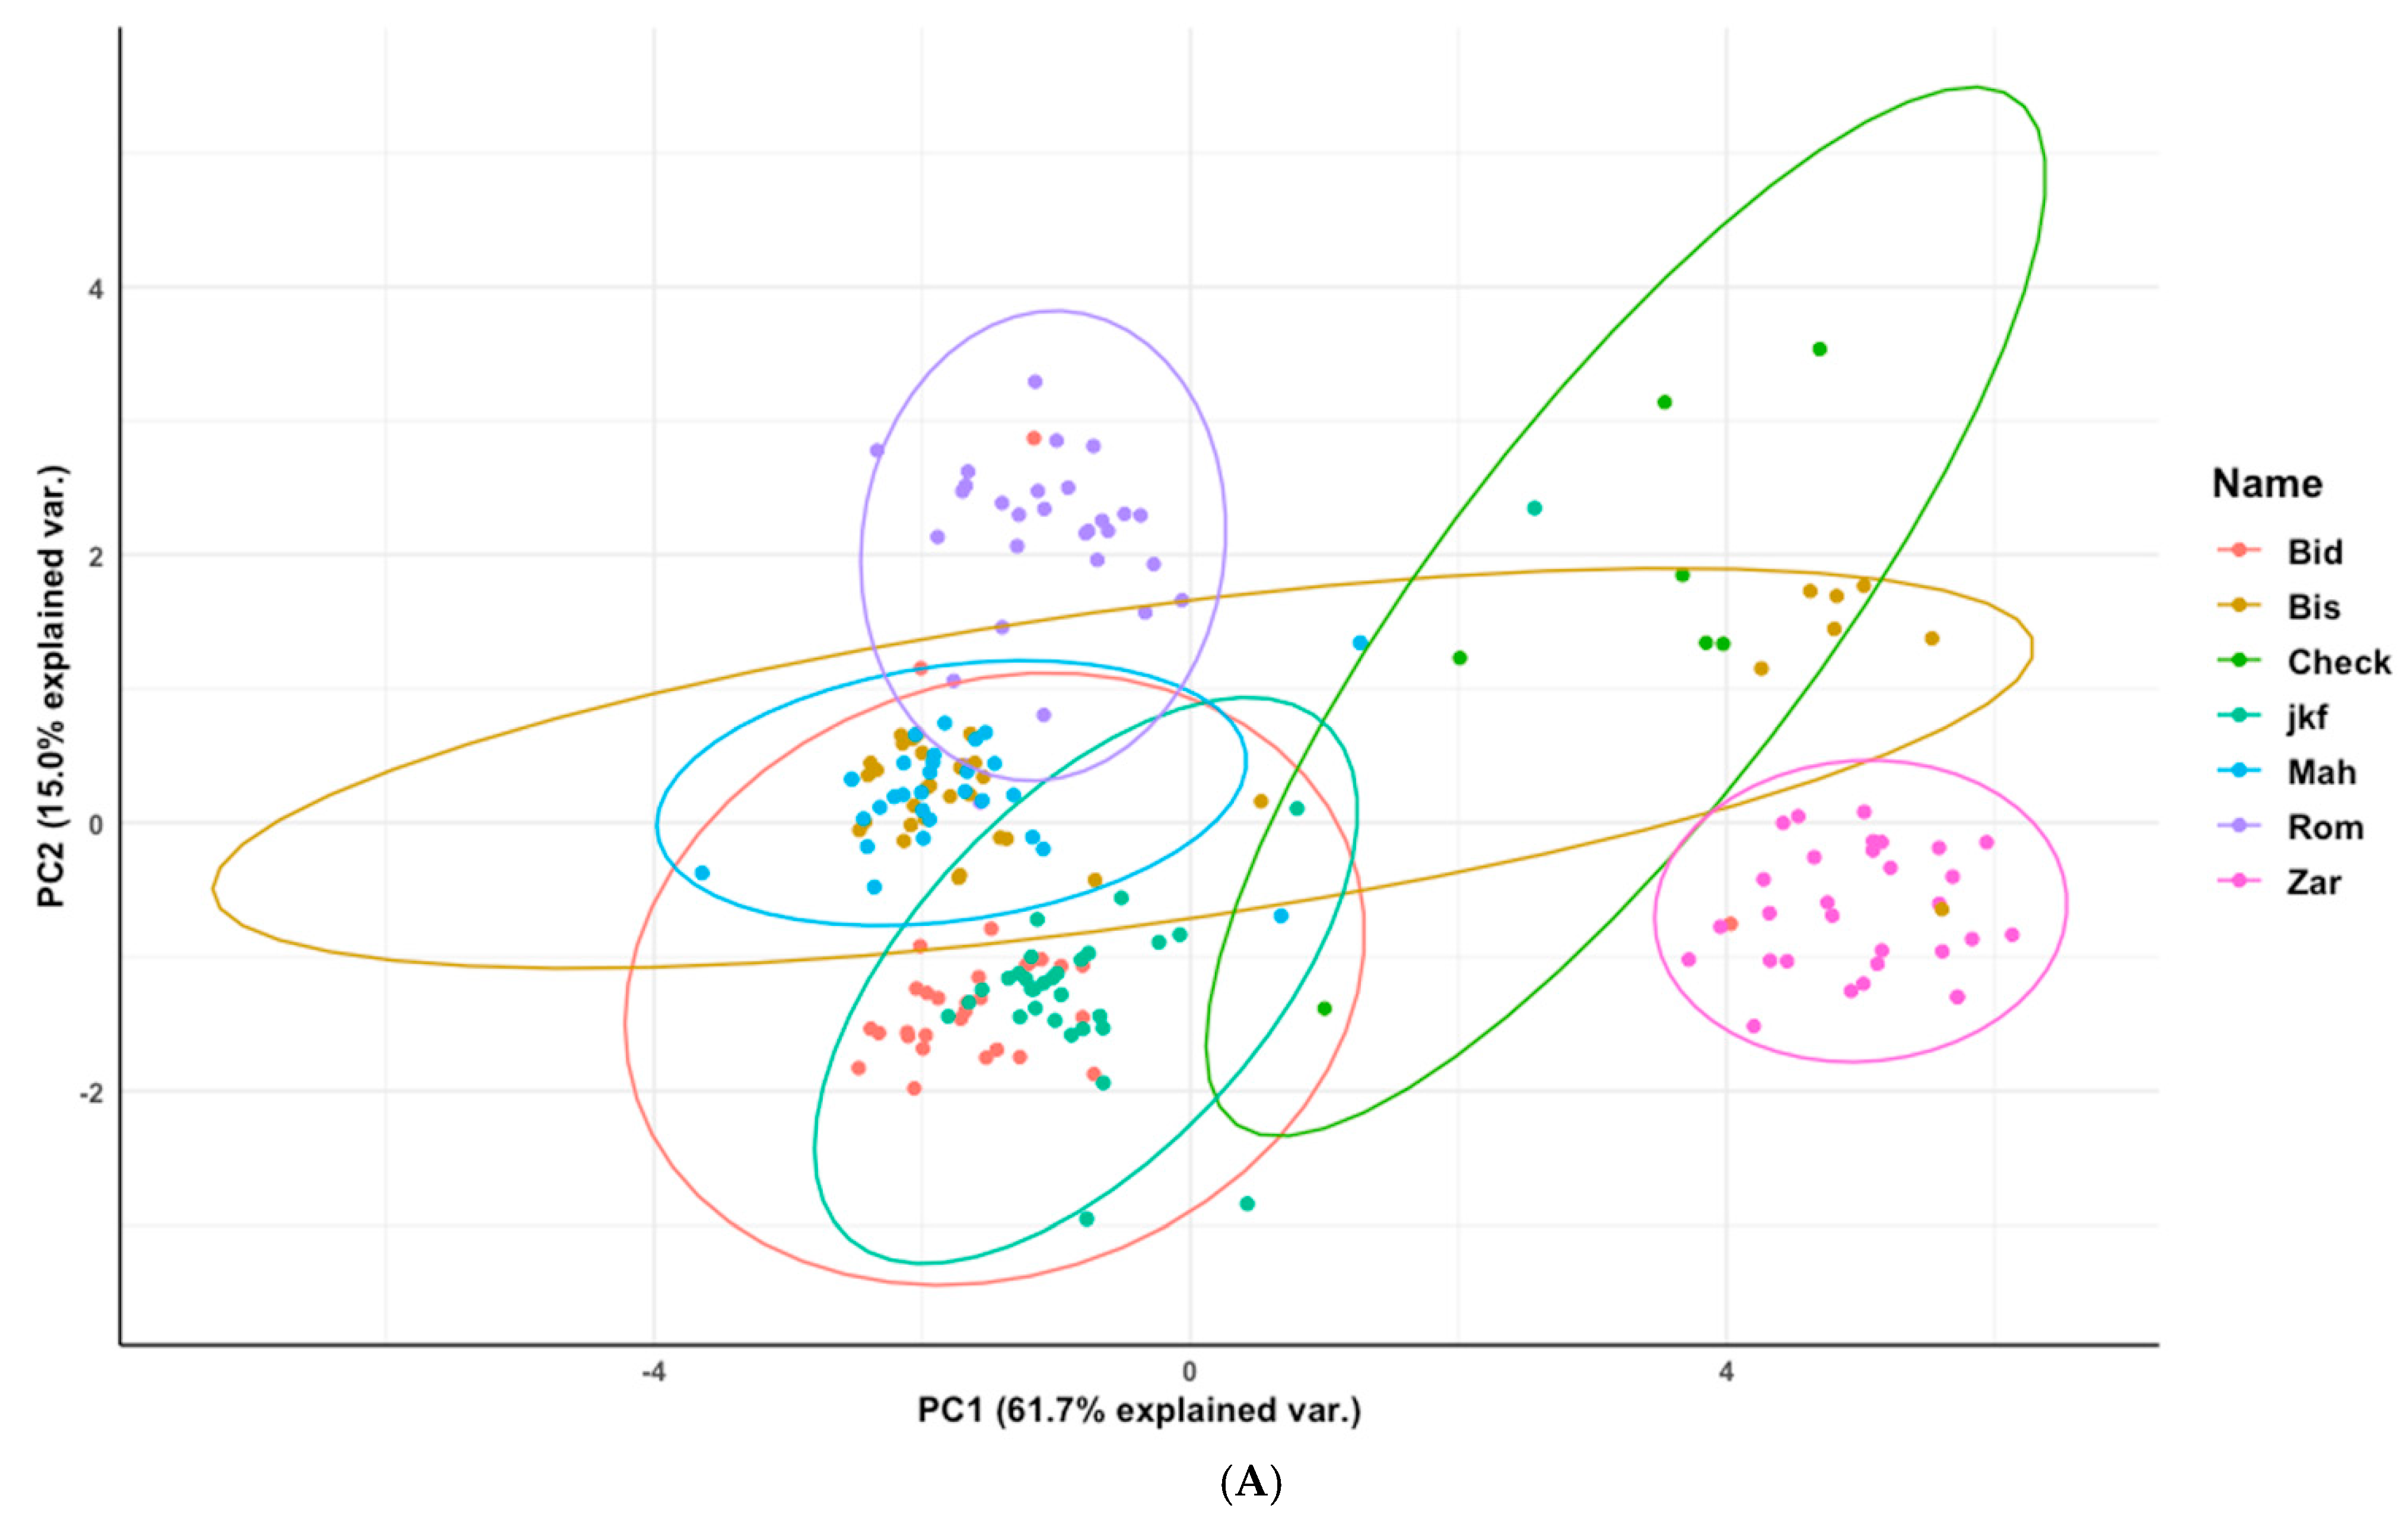
3.4. Phenotypic Structure and Relationships among the Tunisian Germplasm

Results of principal components analysis (PCA) based on mean of the ten agro-morphological and two phenological traits across six environments showed that the first five principal eigen values explained cumulative variance respectively of 61, 76, 88, 94 and 95% from the total phenotypic variance for sub-populations according to farmers name attribution and for those inferred from the genetic structure assessed with K = 6. In Figure S1, we observed that all the traits have the same contribution to PC1 except TA and MLE.
For depicting phenotypic structure and relationships among the different sub-populations, PCA analysis using principal component 1 versus principal component 2 were able to discriminate between contrasting sub-populations and showed in Figure 3A that the lines of Biskri and Mahmoudi constitute the same group, the sub-populations Bidi and Jenah Khotifa are very close, the misclassified lines of Biskri and Mahmoudi are grouped with the elite ICARDA lines and compose a mixture lines group, the misclassified lines in each group are identified and assigned to their respective landrace, and finally the sub-population Jenah Zarzoura constitutes a separate and distant group from all the other landraces and checks. Based on the sub-populations structured by Robbana et al. [31] using DAPC with K = 6, PCA biplot analysis in Figure 3B confirms previous results based on farmer’s name attribution (Figure 3A), with a clear differentiation of the sub-population Jenah Zarzoura (ZAR), which is the furthest from all the other landraces. The misclassified lines composing the mixture lines (MIX_VAR) are grouped with the ICARDA elite lines (checks) and are considered as local improved varieties. The sub-populations Bidi (BID) and Jenah Khotifa (JKF) are not well differentiated and are very close. These landraces were closer to the sub-population composed of Biskri and Mahmoudi lines (BIS_MAH) than the sub-population Rommani (ROM). This last landrace constitutes a separate group.

4. Discussion

Understanding the genetic diversity, population structure and proper characterization of the Tunisian germplasm is essential for its better management in gene bank and for efficient use of superior lines in the breeding programs. Several studies showed the efficiency of the phenotypic characterization using the descriptors to assess the genetic diversity of different durum wheat collections. Other studies found that molecular markers from RFLP to high throughput technology using SNP and DArT were powerful tools for wheat genetic diversity and population structure studies [31,40,41]. Royo et al. [42] demonstrated weak relationships between genetic structure using SSR markers in a panel of Mediterranean durum wheat accessions and phenotypic structure assessed with six agronomic traits across nine environments. In contrast, Soriano et al. [12] showed strong relationships between phenotypic and genotypic structures in a collection of Mediterranean durum wheat landraces and modern cultivars using as well agronomic traits and SSR markers. In the present study, we demonstrated that field phenotyping combined with high throughput DArTseq genotyping are important and complementary tools for an efficient assessment of the genetic diversity and population structure of a panel of 189 accessions collected from the center, south, and the oases of Tunisia and seven checks.

4.1. Strong Genetic Effect of the Agro-Morphological and Phenological Traits in the Tunisian Durum Wheat Collection

The broad sense heritability (H2) is an estimation value that reflects the proportion of the phenotypic variance that is due to genetic variation [43]. According to Johnson et al. [44] the broad sense heritability was classified as high for H2 > 60%, medium for H2 between 30–60%, and low for H2 < 30%. In our study, we showed high heritability for almost all the studied agro-morphological and phenological traits (H2 > 60%).
The highest heritability of the two phenological (HD and MD) and the plant height (H) traits were comparable to those reported in Ethiopian durum wheat farmers varieties and improved varieties evaluated in two zones in Northern Ethiopia for two years [11]. Our findings showed higher heritability of the agro-morphological traits, particularly for the thousand kernel weight (TKW) in comparison to those described using Ethiopian durum wheat landraces (H2 = 0.6) and a collection of Tunisian and Algerian durum germplasm (H2 = 0.53) [11,19]. Relatively similar heritability values to our findings were reported for the majority of the agronomic traits in a previous study using Chinese wheat landraces collected from different zones in China and evaluated for 23 agro-morphological traits in six environments [45]. However, they found lower heritability for the seed morphological traits with a range of 0.43 and 0.76 for seed width and seed length, respectively [45]. Our results allowed us to reveal using the present Tunisian germplasm collection that all the studied traits with high heritability across the six environments are highly influenced by genetic effects rather than environmental effects. According to Singh [46], high heritability values of phenotypic traits reflect small environmental factors contribution to the phenotype and will enhance eventually the selection of superior genotypes with targeted agro-morphological or phenological traits which could be used in national and/or international breeding programs.

4.2. Phenotypic Variability Inferred from Genetic Patterns and Importance of the Population Jenah Zarzoura

Tunisia is considered among the secondary centers of durum wheat diversity and includes a large collection of landraces [23], which are described by several experts as a reservoir of useful genes with high allelic richness [10,24]. Previous studies reported high genetic diversity in several collections of Tunisian germplasm using agro-morphological traits [19,26]. Belhaj et al. [27] described high and different levels of genetic diversity in 930 accessions collected from different localities in the south of Tunisia using twenty-two qualitative and three quantitative traits. A recent study using SSR markers described a genetic stratification between the North of Tunisia, with a predominance of highly productive improved varieties, and the Centre/South of the country, with the presence of old durum wheat varieties and landraces [32]. Slim et al. [32] showed the importance of the Centre and the South of Tunisia in maintaining some valuable landraces, which are well adapted to low precipitations and agricultural inputs. Nowadays, very little knowledge about Tunisian oases local populations richness is described and characterized, even though some studies showed a wide and interesting diversity of bread and durum wheat landraces in the Algerian Saharan oases [17], as well as in Libyan and Moroccan oases [47,48].
According to these previous findings, we focused on durum wheat landraces, which were collected in Tunisia from the Centre, the South and the Oases of Mareth. Our results showed high variability between genotypes (G) for almost all the traits across the six environments (percentage of variance > 50%), except for seed total area and number of spikelets per spike (percentage of variance < 40%). In comparison to other studies, our work showed higher variability than that reported for nine agro-morphologic and three phenological traits among Tunisian durum wheat genotypes with a range of 5.38% for heading date to 24.07% for thousand kernel weight [26], to that reported for four agronomical traits among Tunisian and Algerian germplasm, particularly for thousand kernel weight with a value of 9.45% [19] and to that showed for fourteen agronomic and phenological traits evaluated across six environments in a large collection of Mediterranean durum wheat landraces, with the largest variation registered for plant height (78.2%) [12]. The Percentage of variance of each trait showed that the genetic patterns based on the number of sub-populations K = 6 explained more the phenotypic variability than Farmer’s population nomenclature, and the partitioning sum of squares analysis of all the traits across the six studied environments indicated a highly significant phenotypic diversity among the present Tunisian landraces (>64.80%). These results are in agreement with our previous findings using DArTseq genotyping [31], which reported an optimal number of sub-populations K = 6, allowing an appropriate classification of the lines and a good identification of the different landraces and improved varieties. However, a high genetic diversity among these landraces was described based on the number of sub-population K = 5 based on analysis of molecular variance (AMOVA) results.
In addition, our present observed results showed high phenotypic variability for almost all the traits for the different patterns of landraces and improved varieties (MIX_VAR and Check). Interestingly, the four landraces Bidi (BD), Jenah Khotifa (JFK), Biskri/Mahmoudi (BIS_MAH) and Rommani (ROM) show the same patterns of variability for the phenological traits, which are characterized as late booting and maturing landraces, as described by Deghaïs et al. [24]. Furthermore, these landraces share similar patterns of variability for the majority of the morphologic traits, as high plant height (H), big flag leaf (FLA), and high seed size (SW and ST). Deghaïs et al. [24] reported that Jenah Khotifa and Jenah Zarzoura are the same landrace based on the black color of the spike and glumes. However, our work showed that Jenah Zarzoura (ZAR) is different and distant from all the landraces including Jenah Khotifa. This sub-population collected from the Tunisian oases is characterized by early booting and maturing dates (HD and MD, respectively), semi dwarf status (H), and low flag leaf area (FLA). These characteristics confirmed previous studies showing relationships between climatic factors at durum wheat landraces collecting sites and phenotypic variation [49], and high tolerance to drought, salinity, and heat stresses in oases landraces [17,48], which reflects oases farmers selection for particular traits to ensure the growing season until harvest and to meet their needs under inadequate climatic conditions. Recently, studies related to seed morphometric traits demonstrated that seed width and more specifically seed thickness were associated to predict the domesticated status and could be applied for archaeological identification [7]. This finding helped us to suggest the early introduction of Jenah Zarzoura comparing to the other landraces, based on the lowest values of seed width and thickness, and support our previous findings that showed similarity between this sub-population and two Jordanian landraces [31].

4.3. Phenotypic Structure and Relationships between the Tunisian Durum Wheat Landraces

In the present study, we used ten agro-morphological and two phenological traits for understanding the genetic structure and relationships between the Tunisian durum wheat populations and improved varieties. Indeed, many combinations of phenotypic markers were shown efficient in several studies using different collections of durum wheat [11,26,50]. Both PCA performed on all the studied traits based on farmer’s landraces vernacular name attribution and the sub-populations structured with DAPC using K = 6, confirmed previous findings, which reported the valuable farmer´s knowledge in distinguishing the local populations [49,51], and a clear differentiation between the improved varieties and the different local populations as described by Fiore et al. [50]. However, some misclassified lines in each population were identified as improved varieties and others were assigned to their respective population. In addition, the phenotypic structure based on farmer´s landraces vernacular name attribution showed that Biskri and Mahmoudi landraces constitute the same group. Previous findings using a collection of Tunisian germplasm identified through PCA based on morpho-agronomical and phenological traits four groups and showed that Biskri, Mahmoudi, and Jenah Khotifa landraces belonged to the same group, on the other hand, Bidi landrace constituted a distant and separate group [26], which agreed partially to our results for Biskri and Mahmoudi landraces. In a contrary we demonstrated that Jenah Khotifa and Bidi landraces are very close and could not be differentiated very well. Interestingly, the PCA results showed that the oases landrace Jenah Zarzoura is distant and different from all the other landraces, checks, and improved varieties. This sub-population constitutes a new gene pool with particular characteristics. These results agreed with our previous study using DArTseq genotyping method for assessing the genetic population structure through DAPC with K = 6 of the same set of accessions, which explained the mixture lines origin in each sub-population was due to farmer’s seed exchange and/or to the misnaming of the landraces during the collecting missions, confirmed the identification of a new gene pool represented by Jenah Zarzoura landrace and demonstrated that Biskri and Mahmoudi landraces belong to the same group [31].

5. Conclusions

Farmers’ vernacular landraces name attribution, their seed maintenance, and their traditional agricultural practices are valuable information for gene bank management, conservation, and genetic diversity analysis studies [21,47]. Despite the overuse of homogenous, semi dwarf, and high yielding varieties, and the loss of durum wheat genetic diversity, nowadays looking for a new source of genetic variability from the existing collection of landraces became urgent to face the climate change and to moderate the high agricultural input systems.
In the present study, we demonstrated that phenotypic markers and DArTseq genotyping were efficient and complementary to assess the population structure and genetic diversity of the Tunisian durum wheat collection. Both methods showed similar population structure, high genetic diversity among the landraces, and allowed the differentiation of different genepools. Further, our work highlighted the importance of the Tunisian oases by including a new gene pool represented by Jenah Zarzoura landrace, which showed particular phenotypic characteristics of adaptation to erratic environmental conditions. This population could be a valuable source of climate change-associated adaptive genes to be used in breeding programs for developing new high yielding varieties for dry areas. Our findings support the need to extend collecting more landraces mainly those from the oasis of Tunisia.
Phenotypic and molecular characterization in this study and our previous study confirmed the need for a clearer strategy when making plans of genotyping Genebank collections and using outcomes in linking phenotype to genotype. Genotyping and phenotyping one seed per a Genebank accession, most of the time not the same seed, do not allow a tight relationship between traits and alleles considering the levels of phenotypic and genetic diversity within an accession. Genotyping and phenotyping several lines per accession are resource-consuming processes and have a direct implication on conservation strategies within a Genebank.

Supplementary Materials

The following are available online at https://www.mdpi.com/article/10.3390/agronomy11040634/s1, Figure S1: Projection of the ten agro-morphological and two phenological traits on the PCA plot axes. Bid: Bidi; Bis: Biskri; jkf: Jenah Khotifa; Mah: Mahmoudi; Rom: Rommani; Zar: Jenah Zarzoura; Check: ICARDA elite lines used as Checks. var.: Variance. Bid: Bidi; Bis: Biskri; jkf: Jenah Khotifa; Mah: Mahmoudi; Rom: Rommani; Zar: Jenah Zarzoura; Check: ICARDA elite lines used as Checks. var.: Variance, Table S1: Summary statistics of twelve traits of 189 lines of durum wheat landraces and seven checks.

Author Contributions

Conceptualization, C.R., Z.K. and A.A.; Methodology, C.R., Z.K. and A.A.; Software, Z.K.; Validation, Z.K. and A.A.; Formal Analysis, Z.K.; Investigation, C.R., Z.K. and A.A.; Resources, M.B.N.; Data Curation, C.R. and C.G.; Writing—Original Draft Preparation, C.R. and Z.K..; Writing—Review & Editing, A.A., K.A., M.B.N. and C.G.; Visualization, A.A., Z.K., K.A. and C.G.; Supervision, Z.K. and A.A.; Project Administration, Z.K. and A.A.; Funding Acquisition, A.A., Z.K. and K.A. All authors have read and agreed to the published version of the manuscript.

Funding

This research was funded by the Genebank Platform and the Global Wheat Program, ICARDA and by the Durum Wheat Breeding Program, CIMMYT.

Institutional Review Board Statement

Not applicable.

Informed Consent Statement

Not applicable.

Data Availability Statement

Data is contained within the article and supplementary file.

Acknowledgments

We would like to thank the National Tunisian Genebank for its logistic support. Thanks to the head of the “Institut Nationale des Grandes Cultures” (INGC) station of Kairouan, Rabeh. Kalboussi and the head of the “Institut Nationale des Recherches Agronomiques de Tunis” (INRAT) station of Mornag, Hmida. Ben Hamda for field management. We wish to thank Athanathios Tsivelikas from ICARDA for field assistance and Hector González Santoyo from CIMMYT for laboratory quality analysis assistance.

Conflicts of Interest

The authors declare no conflict of interest.

References

  1. Feldman, M.; Levy, A. Allopolyploidy—A shaping force in the evolution of wheat genomes. Cytogenet. Genome Res. 2005, 109, 250–258. [Google Scholar] [CrossRef]
  2. Zohary, D.; Hopf, M. Domestication of Plants in the Old World: The Origin and Spread of Cultivated Plants in West Asia, Europe, and the Nile Valley, 3rd ed.; Oxford University Press: Oxford, UK, 2000; ISBN 9780198503576. [Google Scholar]
  3. Tanno, K.-I. How Fast Was Wild Wheat Domesticated? Science 2006, 311, 1886. [Google Scholar] [CrossRef] [Green Version]
  4. Dvorak, J.; Akhunov, E.D. Tempos of Gene Locus Deletions and Duplications and Their Relationship to Recombination Rate During Diploid and Polyploid Evolution in the Aegilops-Triticum Alliance. Genetics 2005, 171, 323–332. [Google Scholar] [CrossRef] [Green Version]
  5. Peng, J.H.; Sun, D.; Nevo, E. Domestication evolution, genetics and genomics in wheat. Mol. Breed. 2011, 28, 281–301. [Google Scholar] [CrossRef]
  6. Avni, R.; Nave, M.; Barad, O.; Baruch, K.; Twardziok, S.O.; Gundlach, H.; Hale, I.; Mascher, M.; Spannagl, M.; Wiebe, K.; et al. Wild emmer genome architecture and diversity elucidate wheat evolution and domestication. Science 2017, 357, 93–97. [Google Scholar] [CrossRef] [Green Version]
  7. Hughes, N.; Oliveira, H.R.; Fradgley, N.; Corke, F.M.K.; Cockram, J.; Doonan, J.H.; Nibau, C. µ CT trait analysis reveals morphometric differences between domesticated temperate small grain cereals and their wild relatives. Plant J. 2019, 99, 98–111. [Google Scholar] [CrossRef] [PubMed] [Green Version]
  8. Bonjean, A.P.; Angus, W.J.; Van Ginkel, M. The World Wheat Book: A History of Wheat Breeding; Lavoisier: Paris, France, 2016; Volume 3, ISBN 9782743020910. [Google Scholar]
  9. Feldman, M. Origin of Cultivated Wheat. In The World Wheat Book: A History of Wheat Breeding, 1st ed.; Bonjean, A.P., Angus, W.J., Van Ginkel, M., Eds.; Lavoisier Publishing: Paris, France, 2001; Volume 1, pp. 1–56. [Google Scholar]
  10. Lopes, M.S.; El-Basyoni, I.; Baenziger, P.S.; Singh, S.; Royo, C.; Ozbek, K.; Aktas, H.; Ozer, E.; Ozdemir, F.; Manickavelu, A.; et al. Exploiting genetic diversity from landraces in wheat breeding for adaptation to climate change. J. Exp. Bot. 2015, 66, 3477–3486. [Google Scholar] [CrossRef]
  11. Mengistu, D.K.; Kidane, Y.G.; Fadda, C.; Pè, M.E. Genetic diversity in Ethiopian Durum Wheat (Triticum turgidum var. durum) inferred from phenotypic variations. Plant. Genet. Resour. 2016, 16, 39–49. [Google Scholar] [CrossRef] [Green Version]
  12. Soriano, J.M.; Villegas, L.; Aranzana, M.J.; Del Moral, L.F.G.; Royo, C. Genetic Structure of Modern Durum Wheat Cultivars and Mediterranean Landraces Matches with Their Agronomic Performance. PLoS ONE 2016, 11, e0160983. [Google Scholar] [CrossRef] [Green Version]
  13. Mangini, G.; Margiotta, B.; Marcotuli, I.; Signorile, M.A.; Gadaleta, A.; Blanco, A. Genetic diversity and phenetic analysis in wheat (Triticum turgidum subsp. durum and Triticum aestivum subsp. aestivum) landraces based on SNP markers. Genet. Resour. Crop. Evol. 2016, 64, 1269–1280. [Google Scholar] [CrossRef]
  14. Moragues, M.; Zarco-Hernández, J.; Moralejo, M.A.; Royo, C. Genetic Diversity of Glutenin Protein Subunits Composition in Durum Wheat Landraces [Triticum turgidum ssp. turgidum Convar. durum (Desf.) MacKey] from the Mediterranean Basin. Genet. Resour. Crop. Evol. 2005, 53, 993–1002. [Google Scholar] [CrossRef]
  15. Nazco, R.; Villegas, D.; Ammar, K.; Peña, R.J.; Moragues, M.; Royo, C. Can Mediterranean durum wheat landraces contribute to improved grain quality attributes in modern cultivars? Euphytica 2011, 185, 1–17. [Google Scholar] [CrossRef]
  16. Roselló, M.; Royo, C.; Sanchez-Garcia, M.; Soriano, J.M. Genetic Dissection of the Seminal Root System Architecture in Mediterranean Durum Wheat Landraces by Genome-Wide Association Study. Agronomy 2019, 9, 364. [Google Scholar] [CrossRef] [Green Version]
  17. Oumata, S.; David, J.; Mekliche-Hanifi, L.; Kharsi, M.; Zaharieva, M.; Monneveux, P. Oasis wheats of the South of Algeria: Landraces, cultural practices and utilization. Genet. Resour. Crop. Evol. 2020, 67, 325–337. [Google Scholar] [CrossRef]
  18. Ouaja, M.; Aouini, L.; Bahri, B.; Ferjaoui, S.; Medini, M.; Marcel, T.C.; Hamza, S. Identification of valuable sources of resistance to Zymoseptoria tritici in the Tunisian durum wheat landraces. Eur. J. Plant. Pathol. 2020, 156, 647–661. [Google Scholar] [CrossRef]
  19. Yacoubi, I.; Nigro, D.; Sayar, R.; Masmoudi, K.; Seo, Y.W.; Brini, F.; Giove, S.L.; Mangini, G.; Giancaspro, A.; Marcotuli, I.; et al. New insight into the North-African durum wheat biodiversity: Phenotypic variations for adaptive and agronomic traits. Genet. Resour. Crop. Evol. 2019, 67, 445–455. [Google Scholar] [CrossRef]
  20. Daaloul, A.; Harrabi, M.; Amara, H. Evaluation de la Collection Nationale de Blé Dur. In Revure de l’INAT; numéro spécial; INAT: Tunis, Tunisia, 1998; pp. 337–358. (In French) [Google Scholar]
  21. Jaradat, A.A.; Shahid, M. How diverse a farmer-managed wheat landrace can be? Emir. J. Food Agric. 2014, 26, 93–118. [Google Scholar] [CrossRef] [Green Version]
  22. Pingali, P. The Green Revolution and Crop Diversity (Chapter 12). In Handbook of Agricultural Biodiversity; Hunter, D., Guarino, L., Spillane, C., McKeown, P., Eds.; Routledge: New York, NY, USA, 2017; pp. 213–223. [Google Scholar]
  23. Boeuf, F. Le blé en Tunisie: La Plante. Le Milieu Physico-Chimique; Société Anonyme de L’Imprimerie Rapide de Tunis: Tunis, Tunisia, 1932; Volume 1. (In French) [Google Scholar]
  24. Deghaïs, M.; Kouki, M.M.; Gharbi, M.M.; El Felah, M. Les Variétés de Céréales Cultivées en Tunisie (blé dur, blé Tendre, orge et Triticale; INRAT: Tunis, Tunisia, 2007. (In French) [Google Scholar]
  25. Vavilov, N.I. The Origin, Variation, Immunity and Breeding of Cultivated Plants. Soil Sci. 1951, 72, 482. [Google Scholar] [CrossRef]
  26. Sourour, A.; Chahine, K.; Youssef, T.; Olfa, S.; Hajer, S. Phenotypic diversity of Tunisian durum wheat landraces. Afr. Crop. Sci. J. 2010, 18, 18. [Google Scholar] [CrossRef] [Green Version]
  27. Belhadj, H.; Medini, M.; Bouhaouel, I.; Amara, H. Analyse de la diversitéphénotypique de quelques accessions autochtones de blé dur (Triticum turgidum ssp. durum Desf.) du sud tunisien. J. New Sci. Agric. Biotechnol. 2015, 24, 1115–1125. [Google Scholar]
  28. Baloch, F.S.; Alsaleh, A.; Shahid, M.Q.; Çiftçi, V.; De Miera, L.E.S.; Aasim, M.; Nadeem, M.A.; Aktaş, H.; Özkan, H.; Hatipoğlu, R. A Whole Genome DArTseq and SNP Analysis for Genetic Diversity Assessment in Durum Wheat from Central Fertile Crescent. PLoS ONE 2017, 12, e0167821. [Google Scholar] [CrossRef] [Green Version]
  29. Soriano, J.M.; Villegas, D.; Sorrells, M.E.; Royo, C. Durum Wheat Landraces from East and West Regions of the Mediterranean Basin Are Genetically Distinct for Yield Components and Phenology. Front. Plant. Sci. 2018, 9, 80. [Google Scholar] [CrossRef] [Green Version]
  30. Kabbaj, H.; Sall, A.T.; Al-Abdallat, A.; Geleta, M.; Amri, A.; Filali-Maltouf, A.; Belkadi, B.; Ortiz, R.; Bassi, F.M. Genetic Diversity within a Global Panel of Durum Wheat (Triticum durum) Landraces and Modern Germplasm Reveals the History of Alleles Exchange. Front. Plant. Sci. 2017, 8, 1277. [Google Scholar] [CrossRef] [Green Version]
  31. Robbana, C.; Kehel, Z.; Ben Naceur, M.; Sansaloni, C.; Bassi, F.; Amri, A. Genome-Wide Genetic Diversity and Population Structure of Tunisian Durum Wheat Landraces Based on DArTseq Technology. Int. J. Mol. Sci. 2019, 20, 1352. [Google Scholar] [CrossRef] [Green Version]
  32. Slim, A.; Piarulli, L.; Kourda, H.C.; Rouaissi, M.; Robbana, C.; Chaabane, R.; Pignone, D.; Montemurro, C.; Mangini, G. Genetic Structure Analysis of a Collection of Tunisian Durum Wheat Germplasm. Int. J. Mol. Sci. 2019, 20, 3362. [Google Scholar] [CrossRef] [PubMed] [Green Version]
  33. Kehel, Z.; Garcia-Ferrer, A.; Nachit, M.M. Using Bayesian and Eigen approaches to study spatial genetic structure of Moroccan and Syrian durum wheat landraces. Am. J. Mol. Biol. 2013, 3, 17–31. [Google Scholar] [CrossRef] [Green Version]
  34. Falconer, D.S. Introduction to Quantitative Genetics; Longmans, Green & Co publishers: Harlow, UK, 1989; pp. 65–71. [Google Scholar]
  35. Butler, D.G.; Cullis, B.R.; Gilmour, A.R.; Gogel, B.G.; Thompson, R. ASReml-R Reference Manual Version 4; VSN International Ltd.: Hemel Hempstead, UK, 2017; Available online: https://asreml.kb.vsni.co.uk/wp-content/uploads/sites/3/2018/02/ASReml-R-Reference-Manual-4.pdf (accessed on 2 February 2018).
  36. R Core Team. R: A Language and Environment for Statistical Computing; R Foundation for Statistical Computing: Vienna, Austria, 2018; Available online: https://www.R-project.org (accessed on 3 November 2018).
  37. Stacklies, W.; Redestig, H.; Scholz, M.; Walther, D.; Selbig, J. pcaMethods a bioconductor package providing PCA methods for incomplete data. Bioinformatics 2007, 23, 1164–1167. [Google Scholar] [CrossRef] [PubMed]
  38. Anderson, M.J. A new method for non-parametric multivariate analysis of variance. Austral. Ecol. 2001, 26, 32–46. [Google Scholar] [CrossRef]
  39. Oksanen, J.; Blanchet, F.G.; Friendly, M.; Kindt, R.; Legendre, P.; McGlinn, D.; Wagner, H. Vegan: Community Ecology Package. 2019. Available online: https://CRAN.R-project.org/package=vegan (accessed on 28 November 2020).
  40. Khan, M.K.; Pandey, A.; Choudhary, S.; Hakki, E.E.; Akkaya, M.S.; Thomas, G. From RFLP to DArT: Molecular tools for wheat (Triticum spp.) diversity analysis. Genet. Resour. Crop. Evol. 2014, 61, 1001–1032. [Google Scholar] [CrossRef]
  41. Taranto, F.; D’Agostino, N.; Rodriguez, M.; Pavan, S.; Minervini, A.P.; Pecchioni, N.; Papa, R.; De Vita, P. Whole Genome Scan Reveals Molecular Signatures of Divergence and Selection Related to Important Traits in Durum Wheat Germplasm. Front. Genet. 2020, 11, 217. [Google Scholar] [CrossRef] [Green Version]
  42. Royo, C.; Maccaferri, M.; Álvaro, F.; Moragues, M.; Sanguineti, M.C.; Tuberosa, R.; Maalouf, F.; Del Moral, L.F.G.; Demontis, A.; Rhouma, S.; et al. Understanding the relationships between genetic and phenotypic structures of a collection of elite durum wheat accessions. Field Crop. Res. 2010, 119, 91–105. [Google Scholar] [CrossRef]
  43. Allard, R.W. Principles of Plant Breeding. Soil Sci. 1961, 91, 414. [Google Scholar] [CrossRef]
  44. Johnson, H.W.; Robinson, H.F.; Comstock, R.E. Estimates of Genetic and Environmental Variability in Soybeans1. Agron. J. 1955, 47, 314–318. [Google Scholar] [CrossRef]
  45. Liu, Y.; Lin, Y.; Gao, S.; Li, Z.; Ma, J.; Deng, M.; Chen, G.; Wei, Y.; Zheng, Y. A genome-wide association study of 23 agronomic traits in Chinese wheat landraces. Plant. J. 2017, 91, 861–873. [Google Scholar] [CrossRef] [PubMed] [Green Version]
  46. Singh, B.D. Plant Breeding: Principles and Methods; Kalyani Publishers: New Delhi, India, 2001. [Google Scholar]
  47. Sahri, A.; Chentoufi, L.; Arbaoui, M.; Ardisson, M.; Belqadi, L.; Birouk, A.; Roumet, P.; Muller, M.-H. Towards a comprehensive characterization of durum wheat landraces in Moroccan traditional agrosystems: Analysing genetic diversity in the light of geography, farmers’ taxonomy and tetraploid wheat domestication history. BMC Evol. Biol. 2014, 14, 264. [Google Scholar] [CrossRef] [Green Version]
  48. Zaharieva, M.; Bonjean, A.; Monneveux, P. Saharan wheats: Before they disappear. Genet. Resour. Crop. Evol. 2014, 61, 1065–1084. [Google Scholar] [CrossRef]
  49. Annicchiarico, P.; Pecetti, L.; Damania, A.B. Relationships between Phenotypic Variation and Climatic Factors at Collecting Sites in Durum Wheat Landraces. Hereditas 2004, 122, 163–167. [Google Scholar] [CrossRef]
  50. Fiore, M.C.; Mercati, F.; Spina, A.; Blangiforti, S.; Venora, G.; Dell’Acqua, M.; Lupini, A.; Preiti, G.; Monti, M.; Pè, M.E.; et al. High-Throughput Genotype, Morphology, and Quality Traits Evaluation for the Assessment of Genetic Diversity of Wheat Landraces from Sicily. Plants 2019, 8, 116. [Google Scholar] [CrossRef] [Green Version]
  51. Jaradat, A.A. Wheat Landraces: A mini review. Emir. J. Food Agric. 2013, 25, 20–29. [Google Scholar] [CrossRef]
Figure 1. (A) Phenotypic variation explained by genotypes (G), farmer’s populations name (Name) and sub-populations structured by Robbana et al. (2019) based on K = 5 and on K = 6. K is the number of sub-populations. HD: Heading date (days); MD: Maturity date (days); FLA: Flag leaf area (mm3); H: Plant height (cm); MLB: Awm length (mm); MLE: Spike length (mm). (B) Phenotypic variation explained by genotypes (G), farmer’s populations name (Name) and sub-populations structured by Robbana et al. (2019) based on K = 5 and on K = 6. K is the number of sub-populations. MNEE: number of spikelets/spike; SL: Seed length (mm); SW: Seed width (mm); ST: Seed thickness (mm); TA: Total seed area (mm3); TKW: Thousand kernel weight (g).
Agronomy 11 00634 g001aAgronomy 11 00634 g001b
Figure 2. (A) Box plots and multiple average mean, maximum, minimum comparisons of four agro-morphological and two phenological traits across six environments in six sub-populations inferred from the genetic structure assessed with K = 6 and a group of checks. HD: Heading date (days); MD: Maturity date (days); FLA: Flag leaf area (mm3); H: Plant height (cm); MLB: Awm length (mm); MLE: Spike length (mm). Local landraces: BD: Bidi; BIS_MAH: Biskri/Mahmoudi; JKF: Jenah Khotifa; ROM; Rommani; ZAR: Jenah Zarzoura; Check: ICARDA elite lines, MIX_VAR: Identified Mixture lines as improved varieties. (B) Box plots and multiple average mean, maximum, minimum comparisons of six agro-morphological traits across six environments in six sub-populations inferred from the genetic structure assessed with K = 6 and a group of checks. MNEE: number of spikelets/spike; SL: Seed length (mm); SW: Seed width (mm); ST: Seed thickness (mm); TA: Total seed area (mm3); TKW: Thousand kernel weight (g). Local landraces: BD: Bidi; BIS_MAH: Biskri/Mahmoudi; JKF: Jenah Khotifa; ROM; Rommani; ZAR: Jenah Zarzoura; Check: ICARDA elite lines, MIX_VAR: Identified Mixture lines as improved varieties.
Agronomy 11 00634 g002aAgronomy 11 00634 g002b
Figure 3. (A) Principal components analysis (PCA) plot of six sub-populations according to farmers name attribution and a group of checks based on mean of ten agro-morphological and two phenological traits across six environments. Bid: Bidi; Bis: Biskri; jkf: Jenah Khotifa; Mah: Mahmoudi; Rom: Rommani; Zar: Jenah Zarzoura; Check: ICARDA elite lines used as Checks. var.: Variance. (B) Principal components analysis (PCA) plot of six sub-populations inferred from the genetic structure assessed with K = 6 and a group of checks based on mean of ten agro-morphological and two phenological traits across six environments. Bid: Bidi; BIS_MAH: Biskri and Mahmoudi lines composing the same group; jkf: Jenah Khotifa; Rom: Rommani; Zar: Jenah Zarzoura; MIX_VAR: mixture lines considered as local improved varieties; Check: ICARDA elite lines used as Checks. var.: Variance.
Agronomy 11 00634 g003aAgronomy 11 00634 g003b
Table 1. List of the Tunisian durum wheat landraces collected from central, southern and the oases of Tunisia.
LandracesLinesZonesCollecting SiteProvince
Bidi30CenteralKairouanKairouan
Jenah Khotifa128CenteralKairouanKairouan
Jenah Khotifa24SouthernEl Frid Tozeur
Biskri130SouthernDjebel ouled ouhiba Gafsa
Biskri2 *7SouthernZarzis Medenine
Mahmoudi 30SouthernSnad Gafsa
Rommani 30SouthernDjebel ouled ouhiba Gafsa
Jenah Zarzoura 30Oases Oasis of Mareth Gabes
Total189
*: Biskri2 population was identified in the previous study of Robbana et al. [31] as local improved variety.
Table 2. List of the ICARDA elite lines.
Elite Line NameProviderAccession IdentifierPedigree
-ICARDAMCHCB-102OmRabi3/T.urartu500651/ch5//980947/3/Otb4//Ossl1/Rf m6
IcaJoudyICARDAMCHCB-100Atlast1/961081//Icasyr1
NachitICARDADAWRYT-106Ameddkul1/T. dicoccoides Syrian collection//Loukos
Zeina4ICARDAMCHCB-154GdoVZ512/Cit//Ruff/Fg/3/Src3
LouizaICARDARscn39/Til1
Ammar 6ICARDAICARDAIDYT37-5 ICAMORTA0472/Ammar7
Ammar 10ICARDAMCHCB-99Lgt3/Bicrecham1
–: The name is not available.
Table 3. Broad sense heritability of ten agro-morphological and two phenological traits across six environments in a collection of 196 lines of durum wheat landraces.
SiteKAIR IRKAIR IRKAIR-STRKAIR STRMOR RFMOR RFAcross All
Environments
Year201620172016201720152016
H2H2H2H2H2H2H’2
HD0.970.980.940.980.950.940.98
MD0.900.800.930.870.960.890.95
H0.960.950.860.960.950.950.84
FLA0.770.360.620.740.620.870.60
MLB0.680.820.790.830.780.660.89
MLE0.820.800.890.850.820.80.93
SL0.910.950.950.980.800.880.96
ST0.870.870.920.950.830.650.95
SW0.910.930.940.970.880.710.97
TA0.840.88-0.890.85-0.67
NEE0.690.710.670.650.610.610.85
TKW0.860.900.930.950.870.640.95
H2: Borad sense heritability in each environment; H’2: Broad sense heritability across environments; KAIR: Kairouan locality; MOR: Mornag locality; IR: Irrigated water regime; STR: Stressed water regime; RF: Rainfed condition; -: missing data; HD: Heading date (days); MD: Maturity date (days); H: Plant height (cm); FLA: Flag leaf area (mm3); MLB: Awn length (mm); MLE: Spike length (mm); SL: Seed length; ST (mm): Seed thickness (mm); SW: Seed width (mm); TA: Total seed area (mm3); NEE: Number of spikelets/spike; and TKW: Thousand kernel weight (g).
Table 4. Partitioning of the sum of squares of the ANOVA model for different levels of genetic grouping in a set of 189 Tunisian durum wheat genotypes structured in different sub-populations by Robbana et al. [31] and seven ICARDA elite lines based on means of all the traits across six environments.
DfSumOfSqsFPr (>F)Percent Variance
Farmer’s population name60.19157.4130.00164.81
Residual1870.104 35.18
Genetic group with K = 550.19270.0410.00165.06
Residual1880.103 34.93
Genetic group with K = 660.225100.330.00176.29
Residual1870.070 23.70
K: Number of sub-populations; Df: Degree of freedom, SumOfSqs: Sum of squares, F: F statistics, Pr: Probability.
Publisher’s Note: MDPI stays neutral with regard to jurisdictional claims in published maps and institutional affiliations.

