
A Win–Win Combination to Inhibit Persistent Organic Pollutant Formation via the Co-Incineration of Polyvinyl Chloride E-Waste and Sewage Sludge

 ,
,  , ,
, , 

Abstract
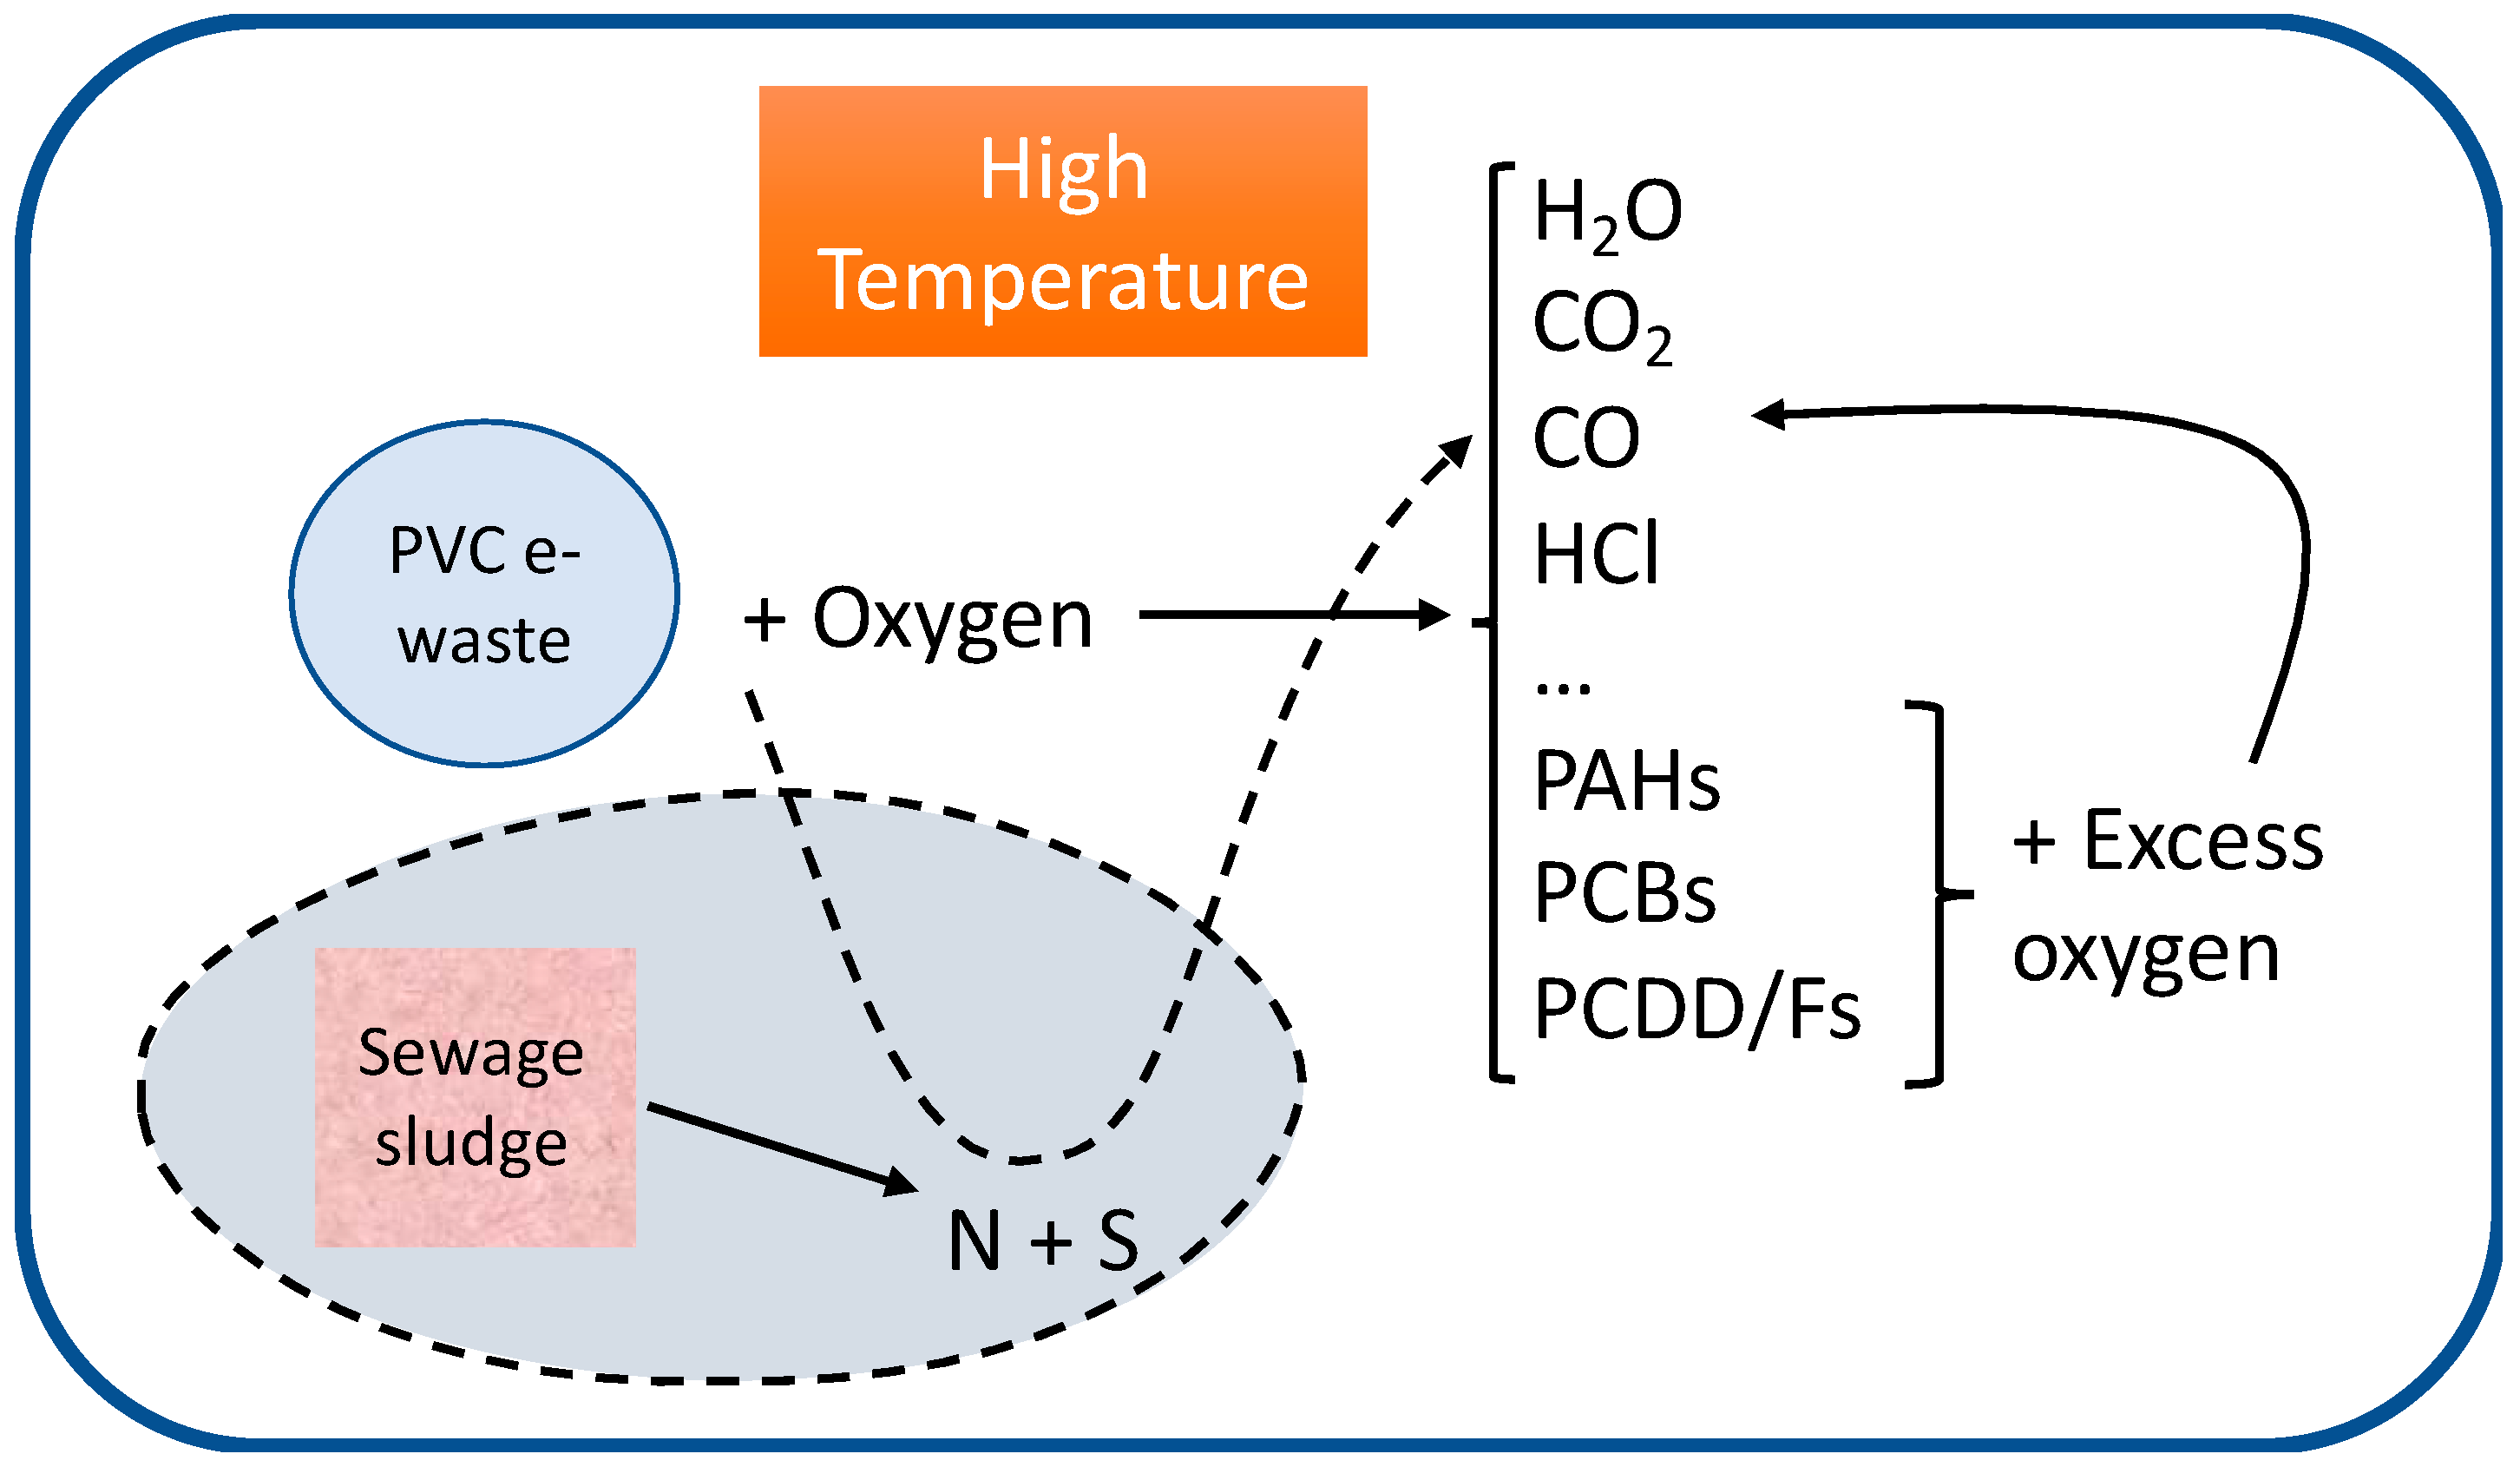
1. Introduction
2. Materials and Methods
2.1. PVC E-Waste
2.2. Sewage Sludge (SS)
2.3. Experimental System and Operating Conditions
3. Results and Discussion
3.1. PAHs
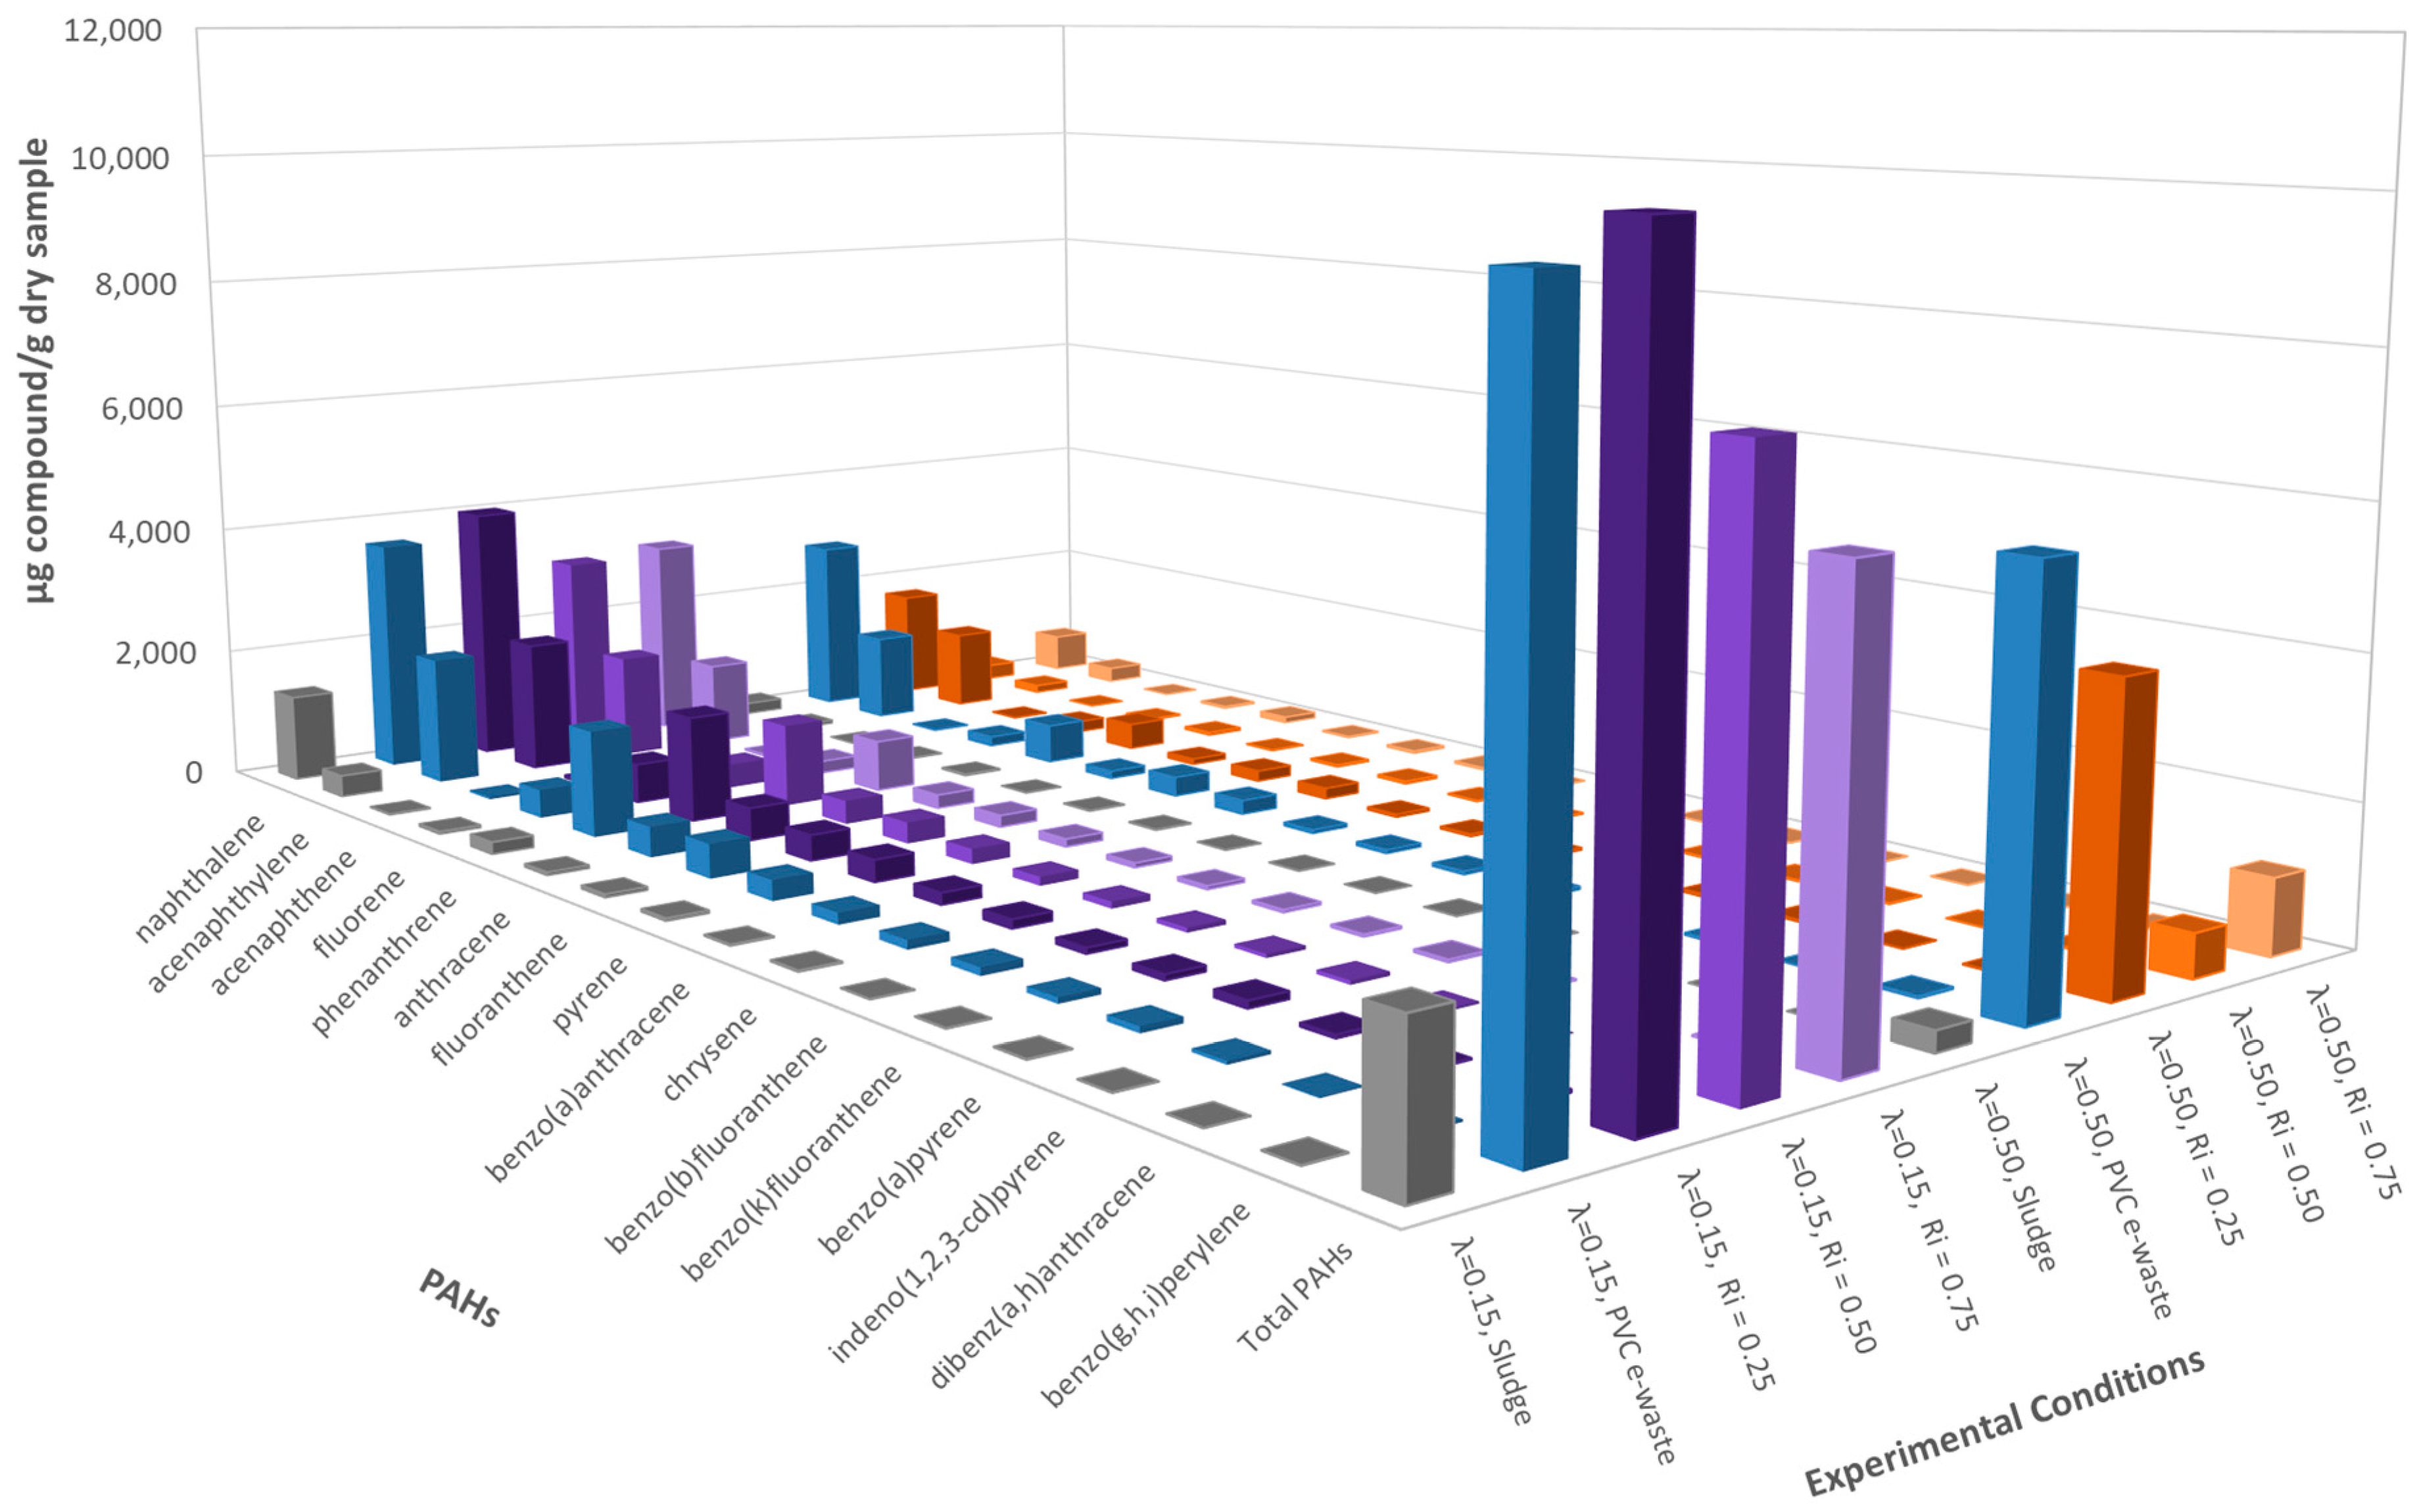
3.1.1. Emissions of PAHs
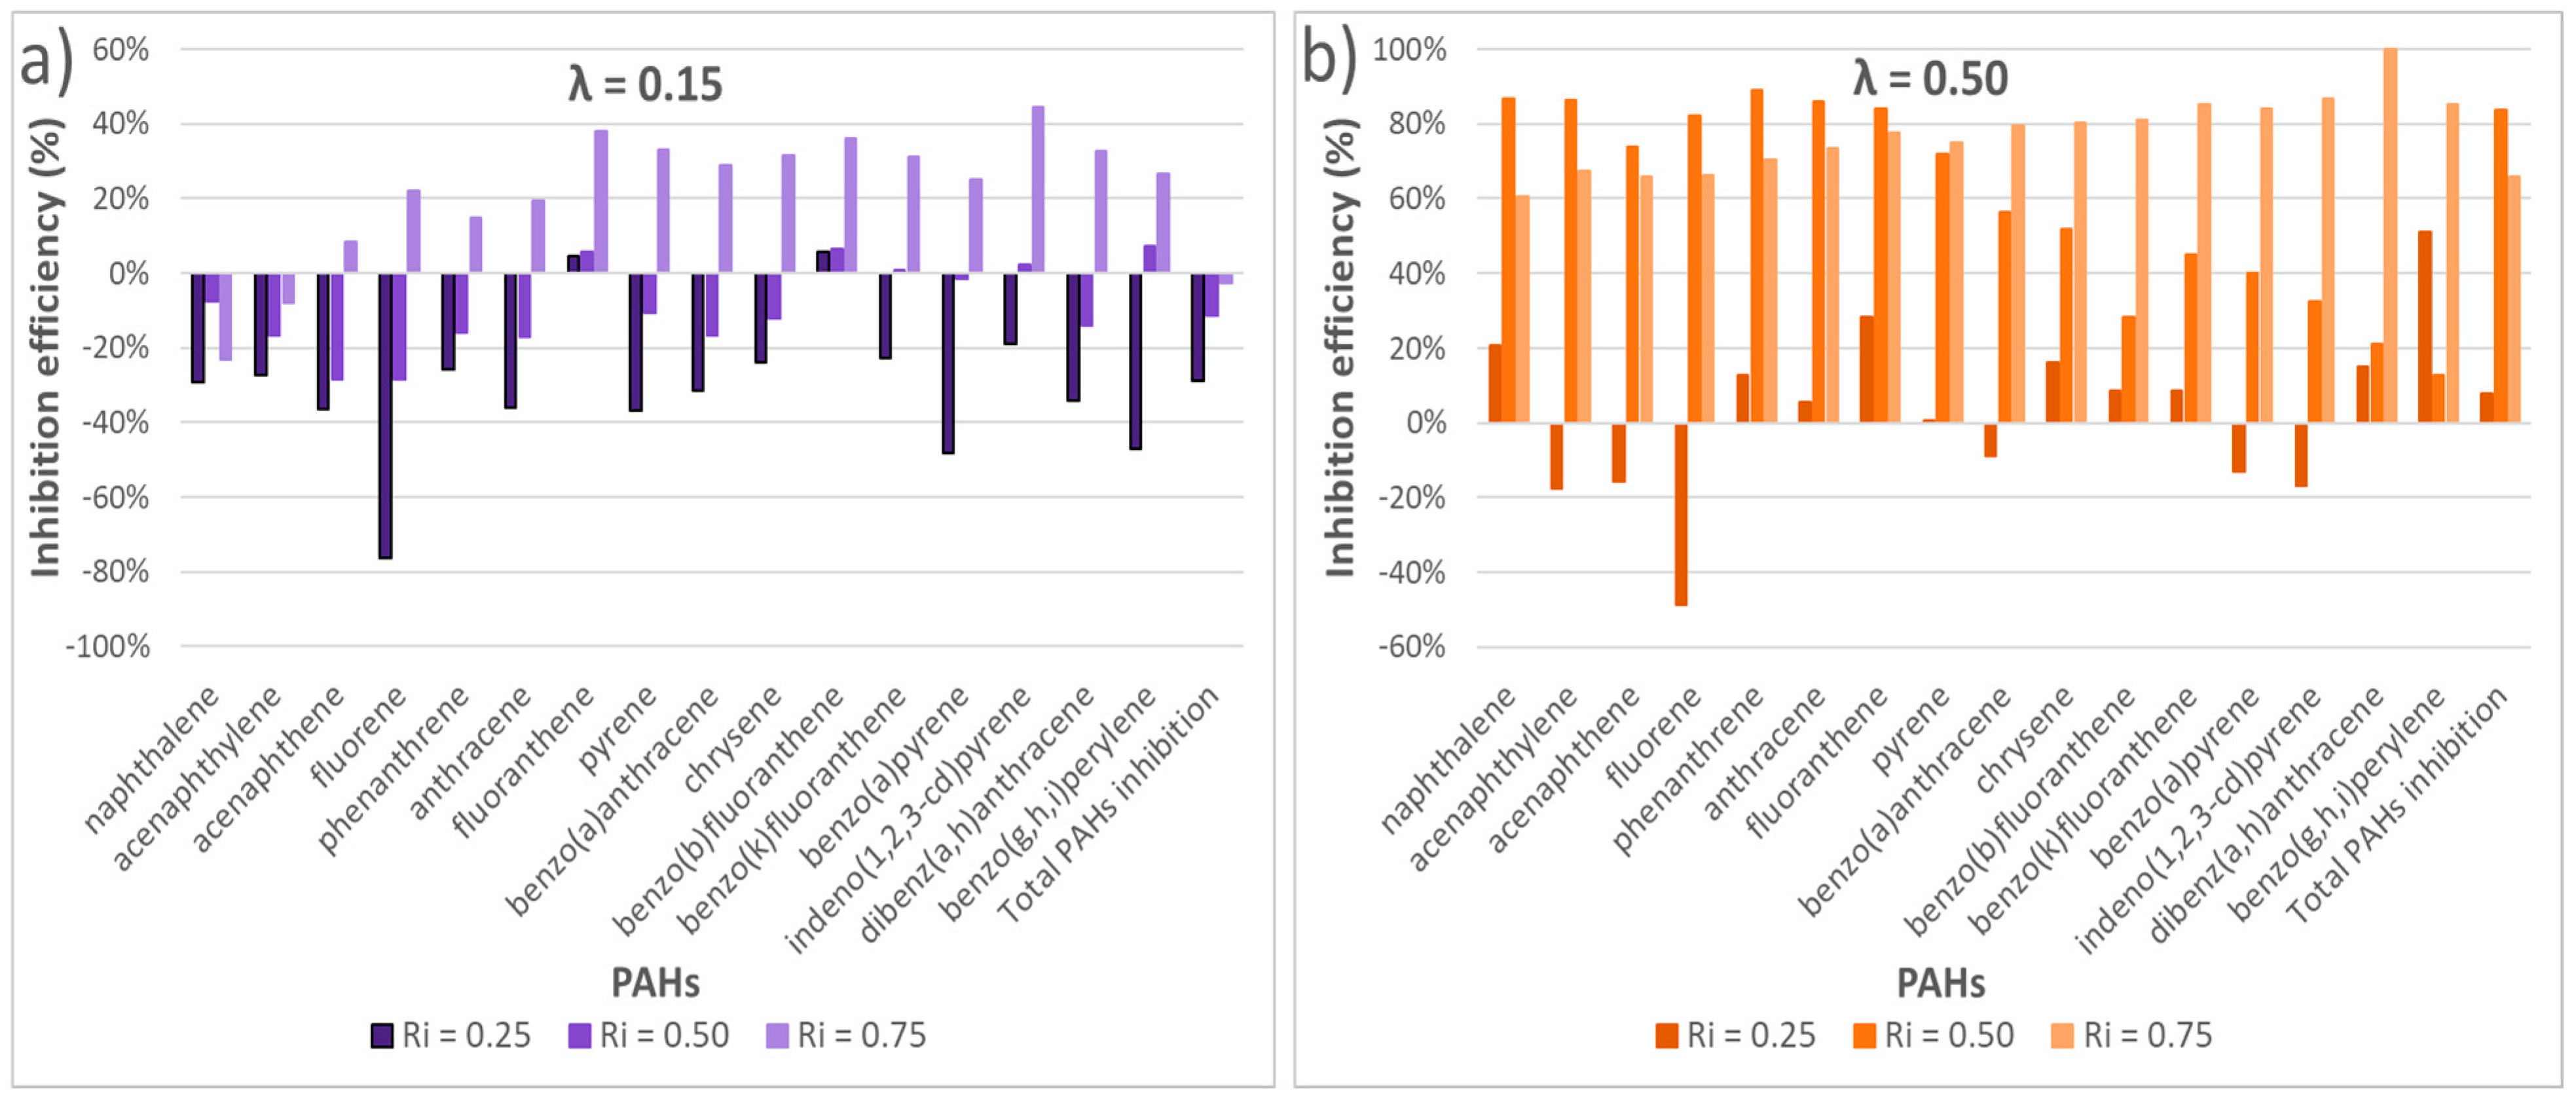
3.1.2. Inhibition of PAH Formation
3.2. ClBzs and ClPhs
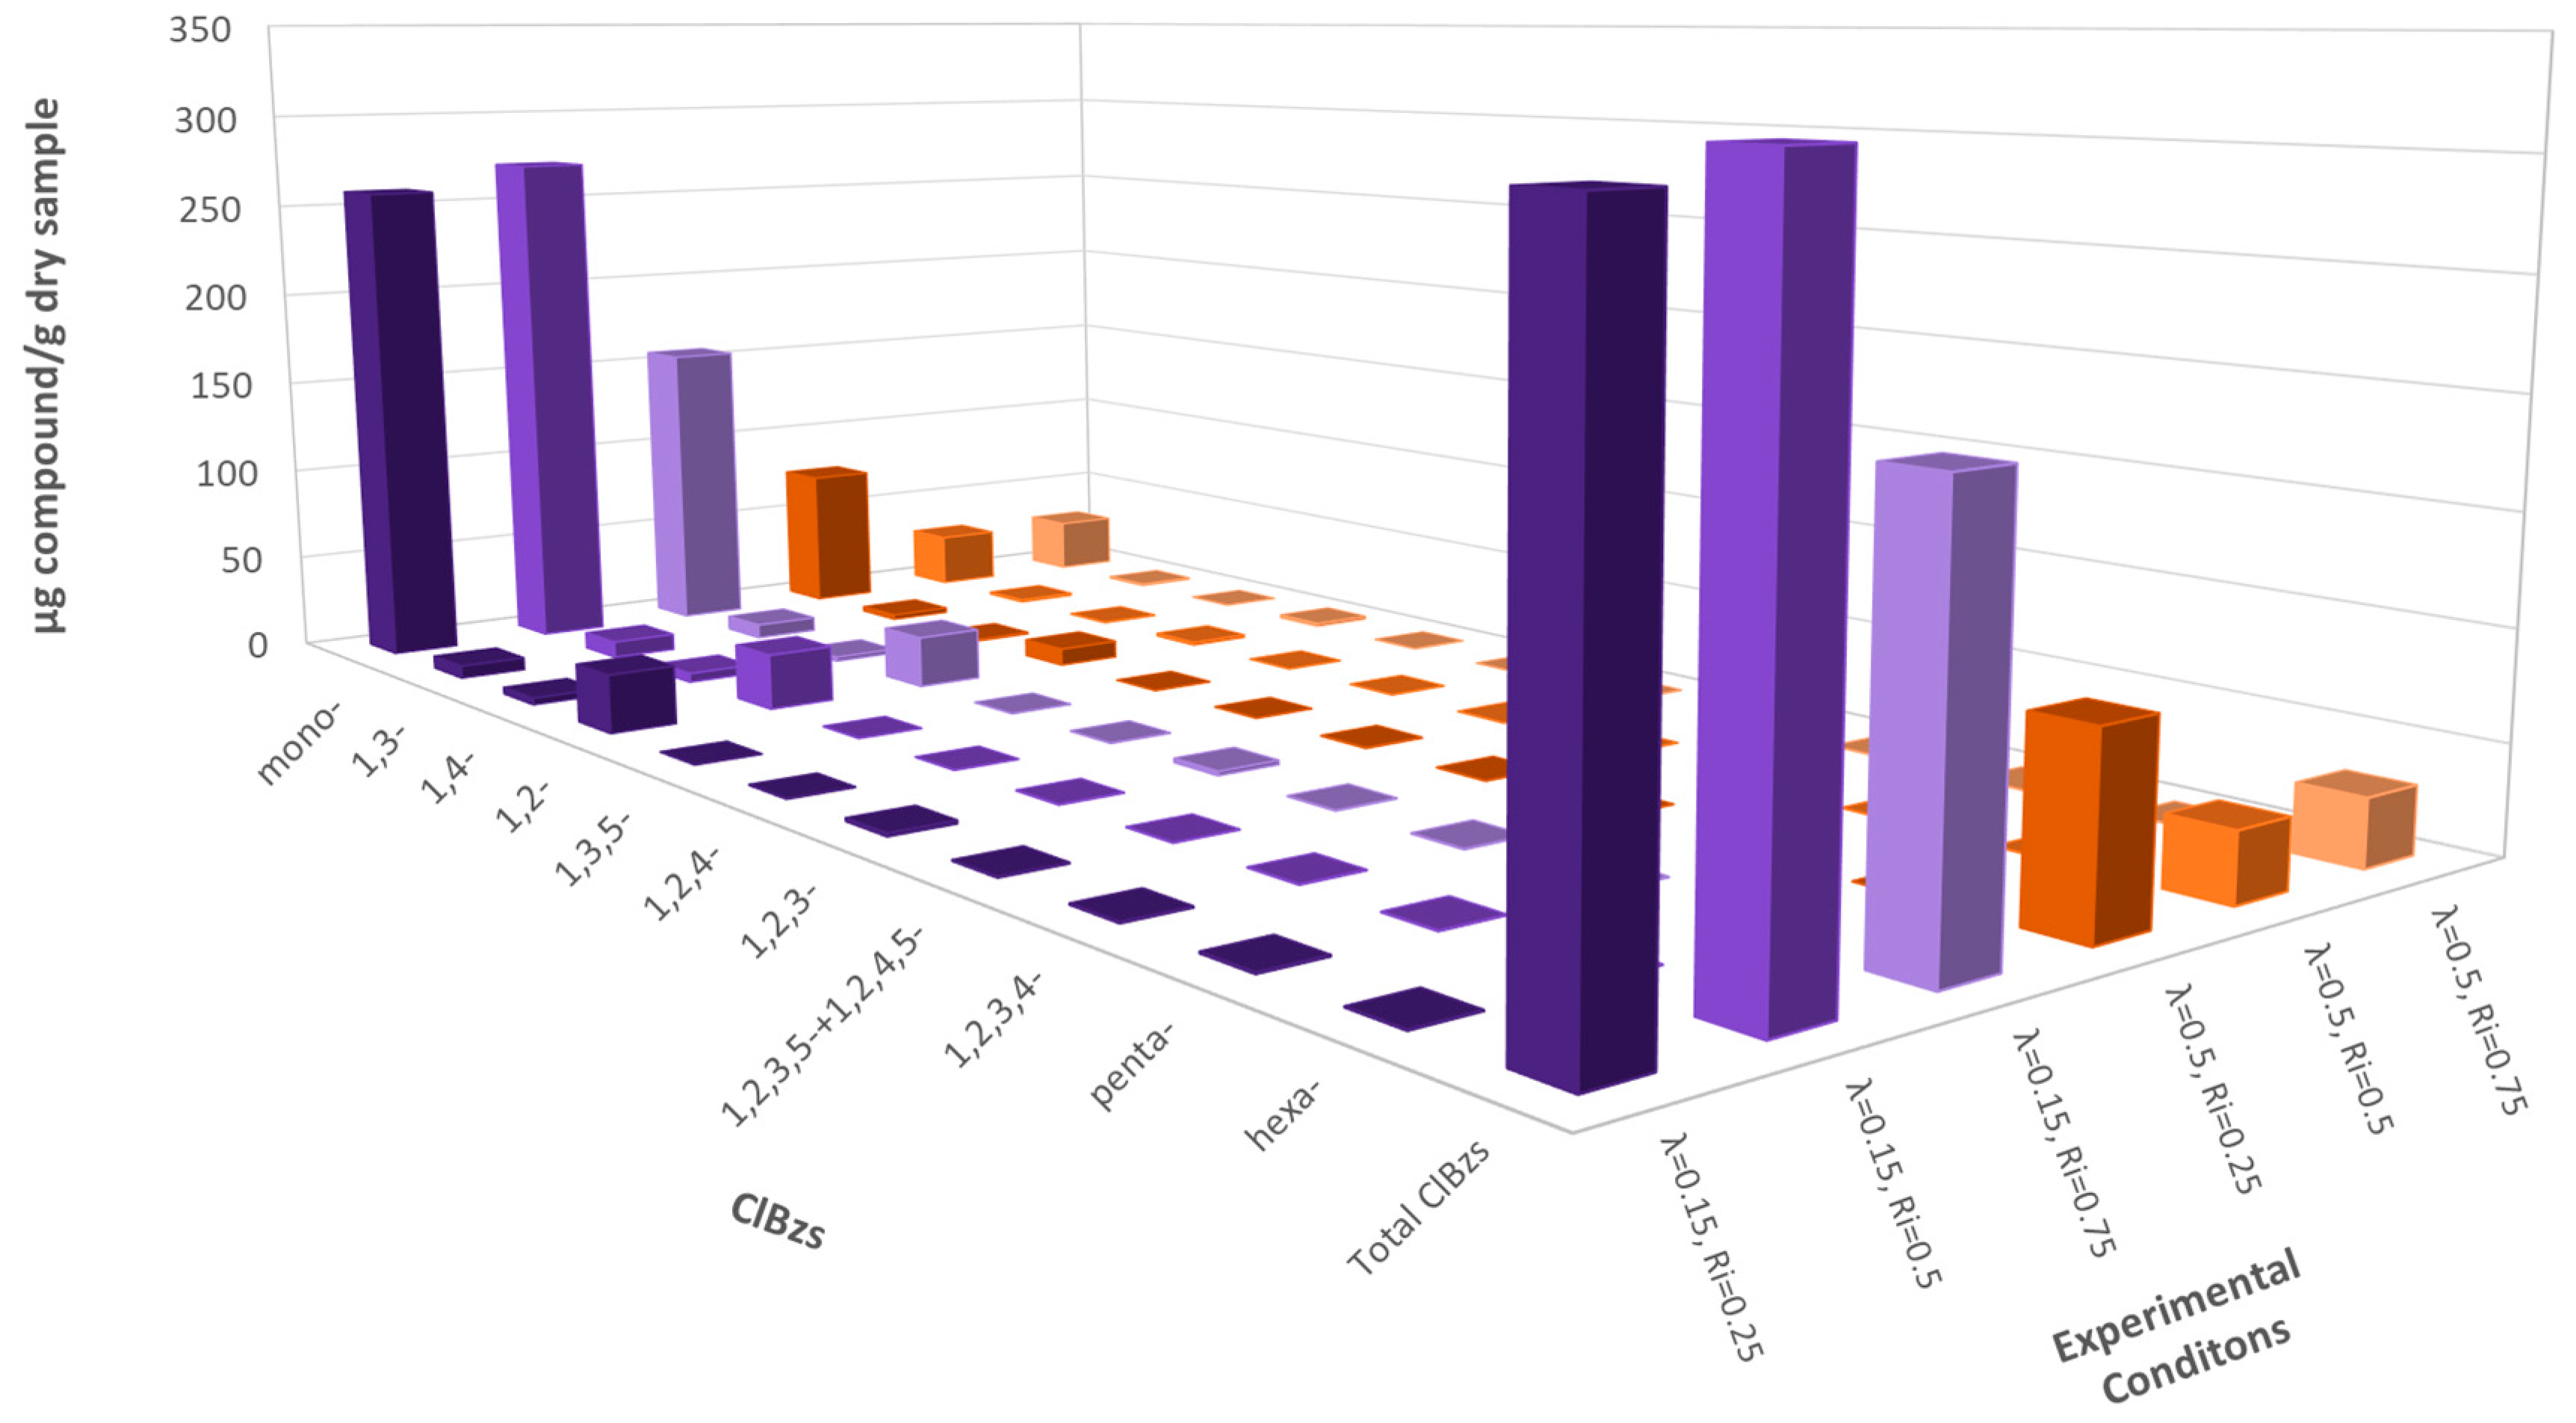
3.2.1. Emissions of ClBzs
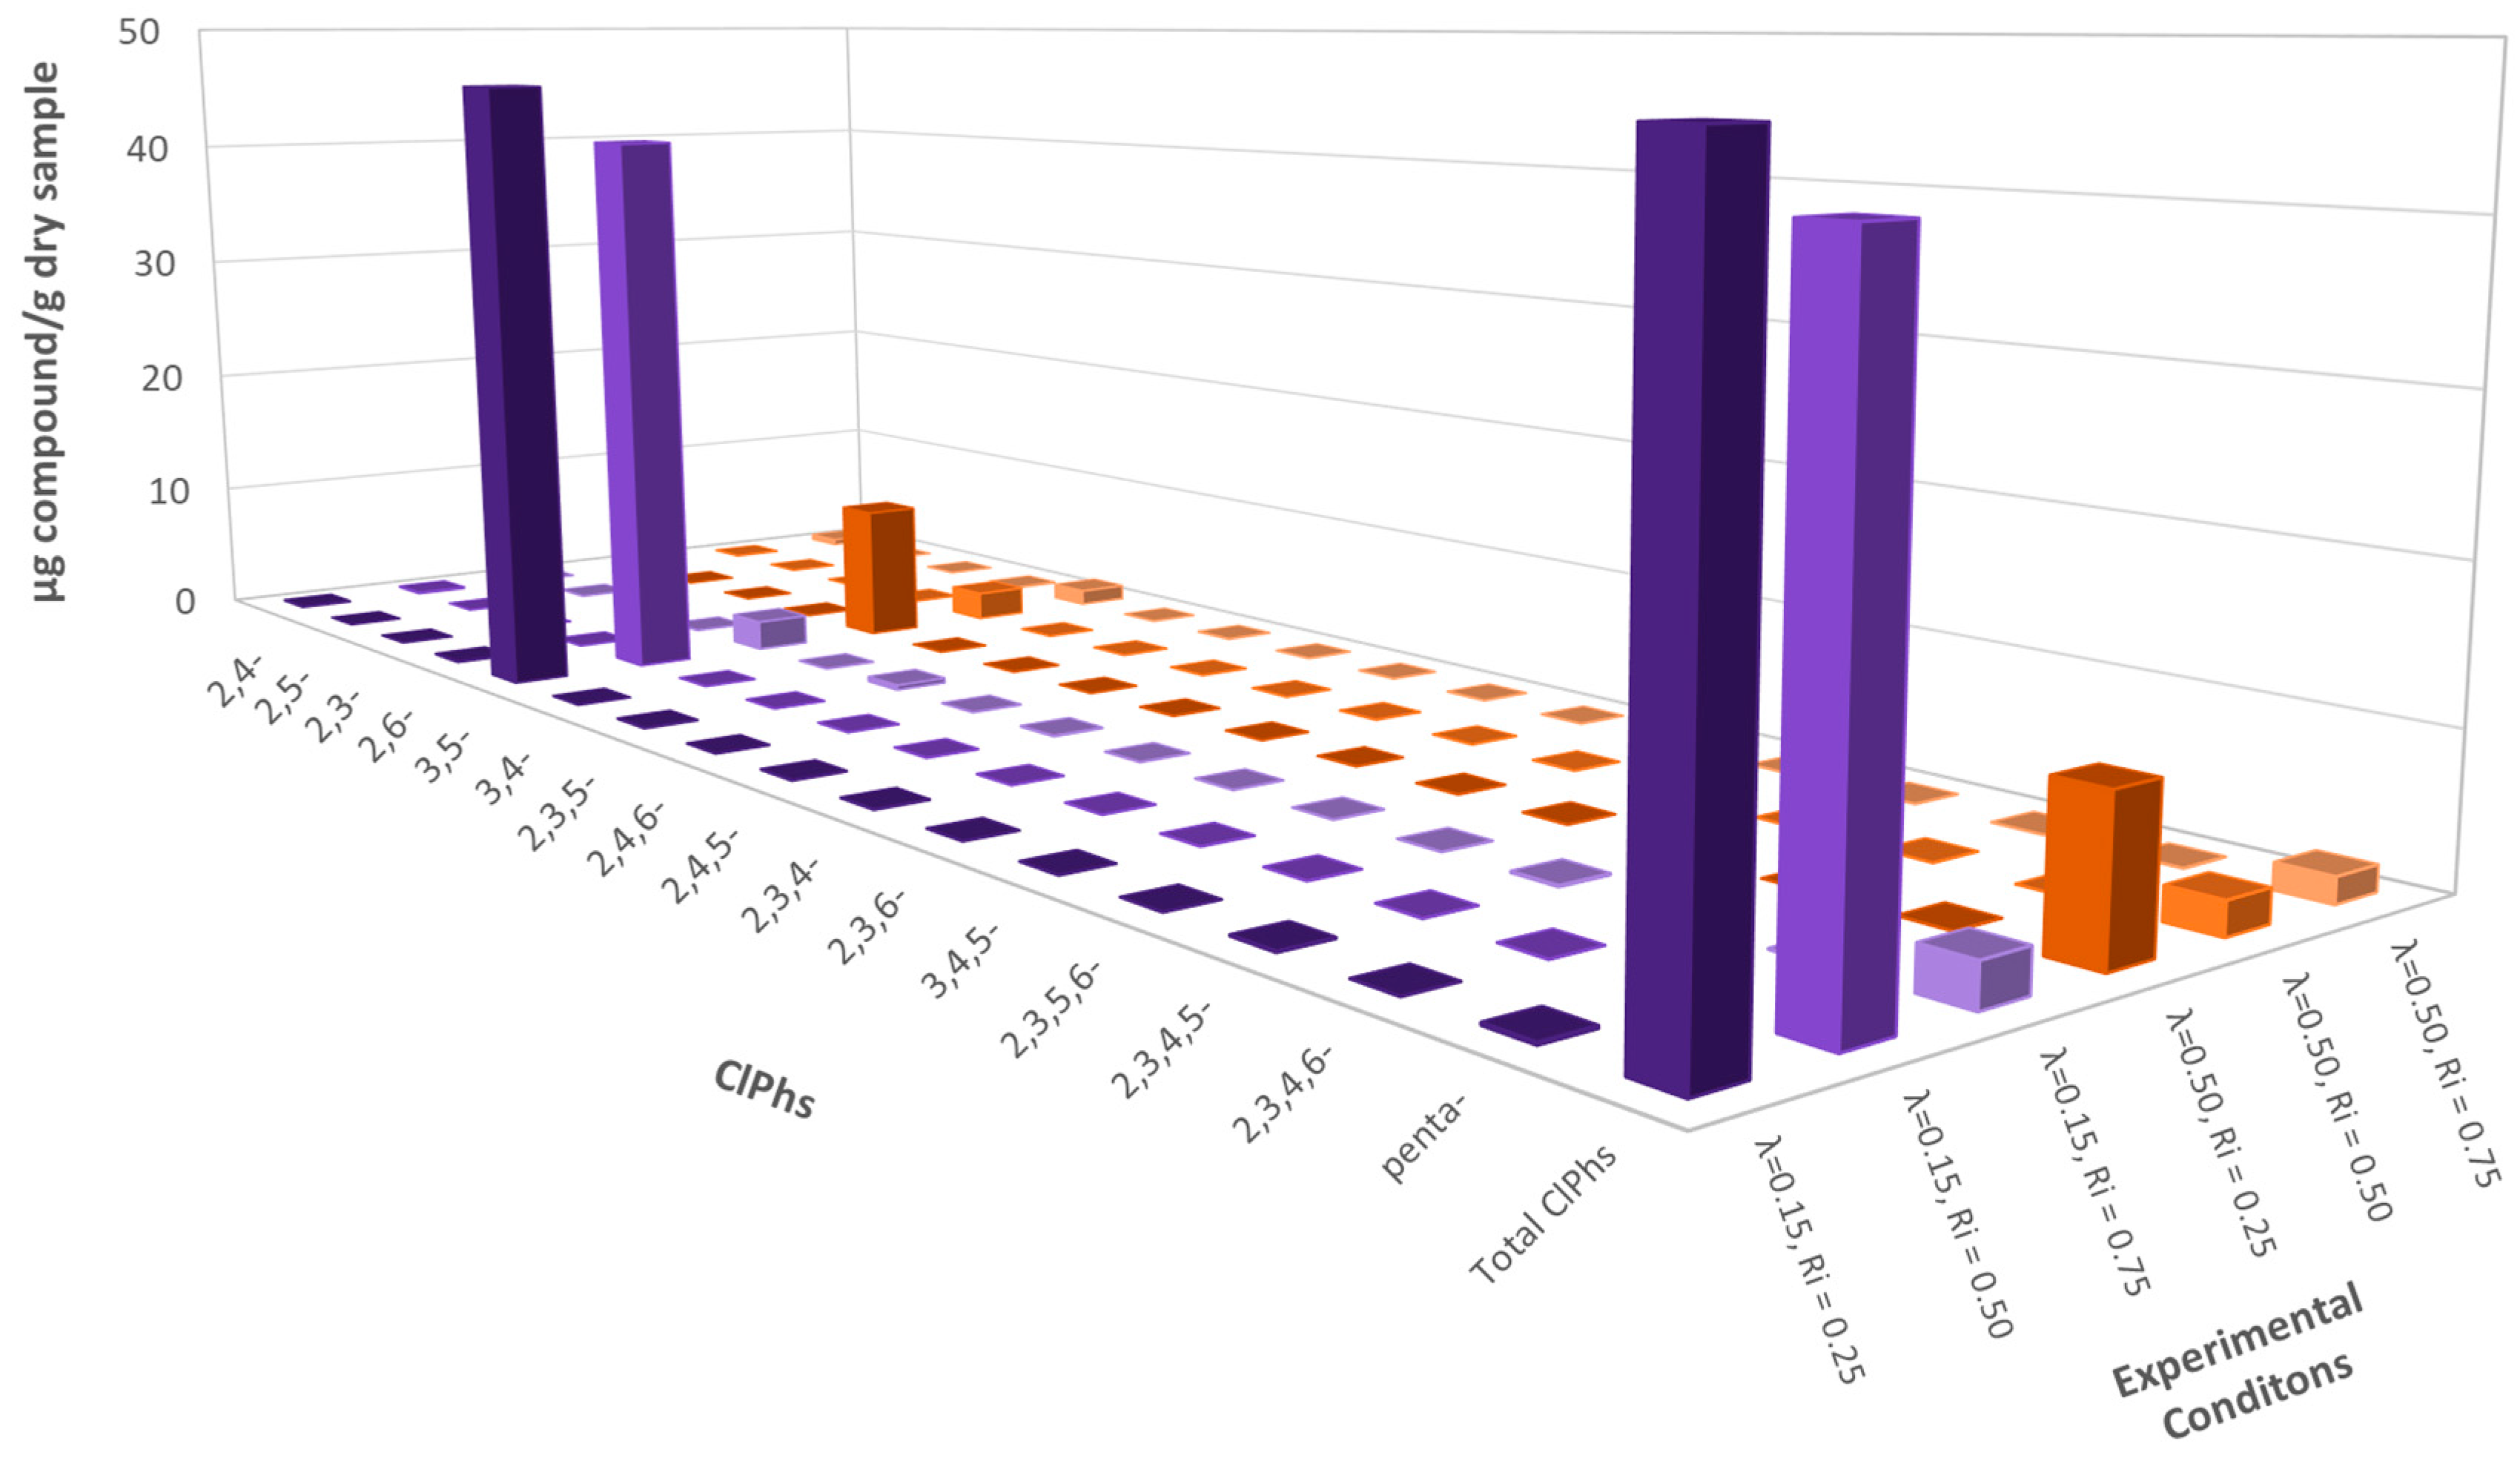
3.2.2. Emissions of ClPhs
3.3. PCDD/Fs
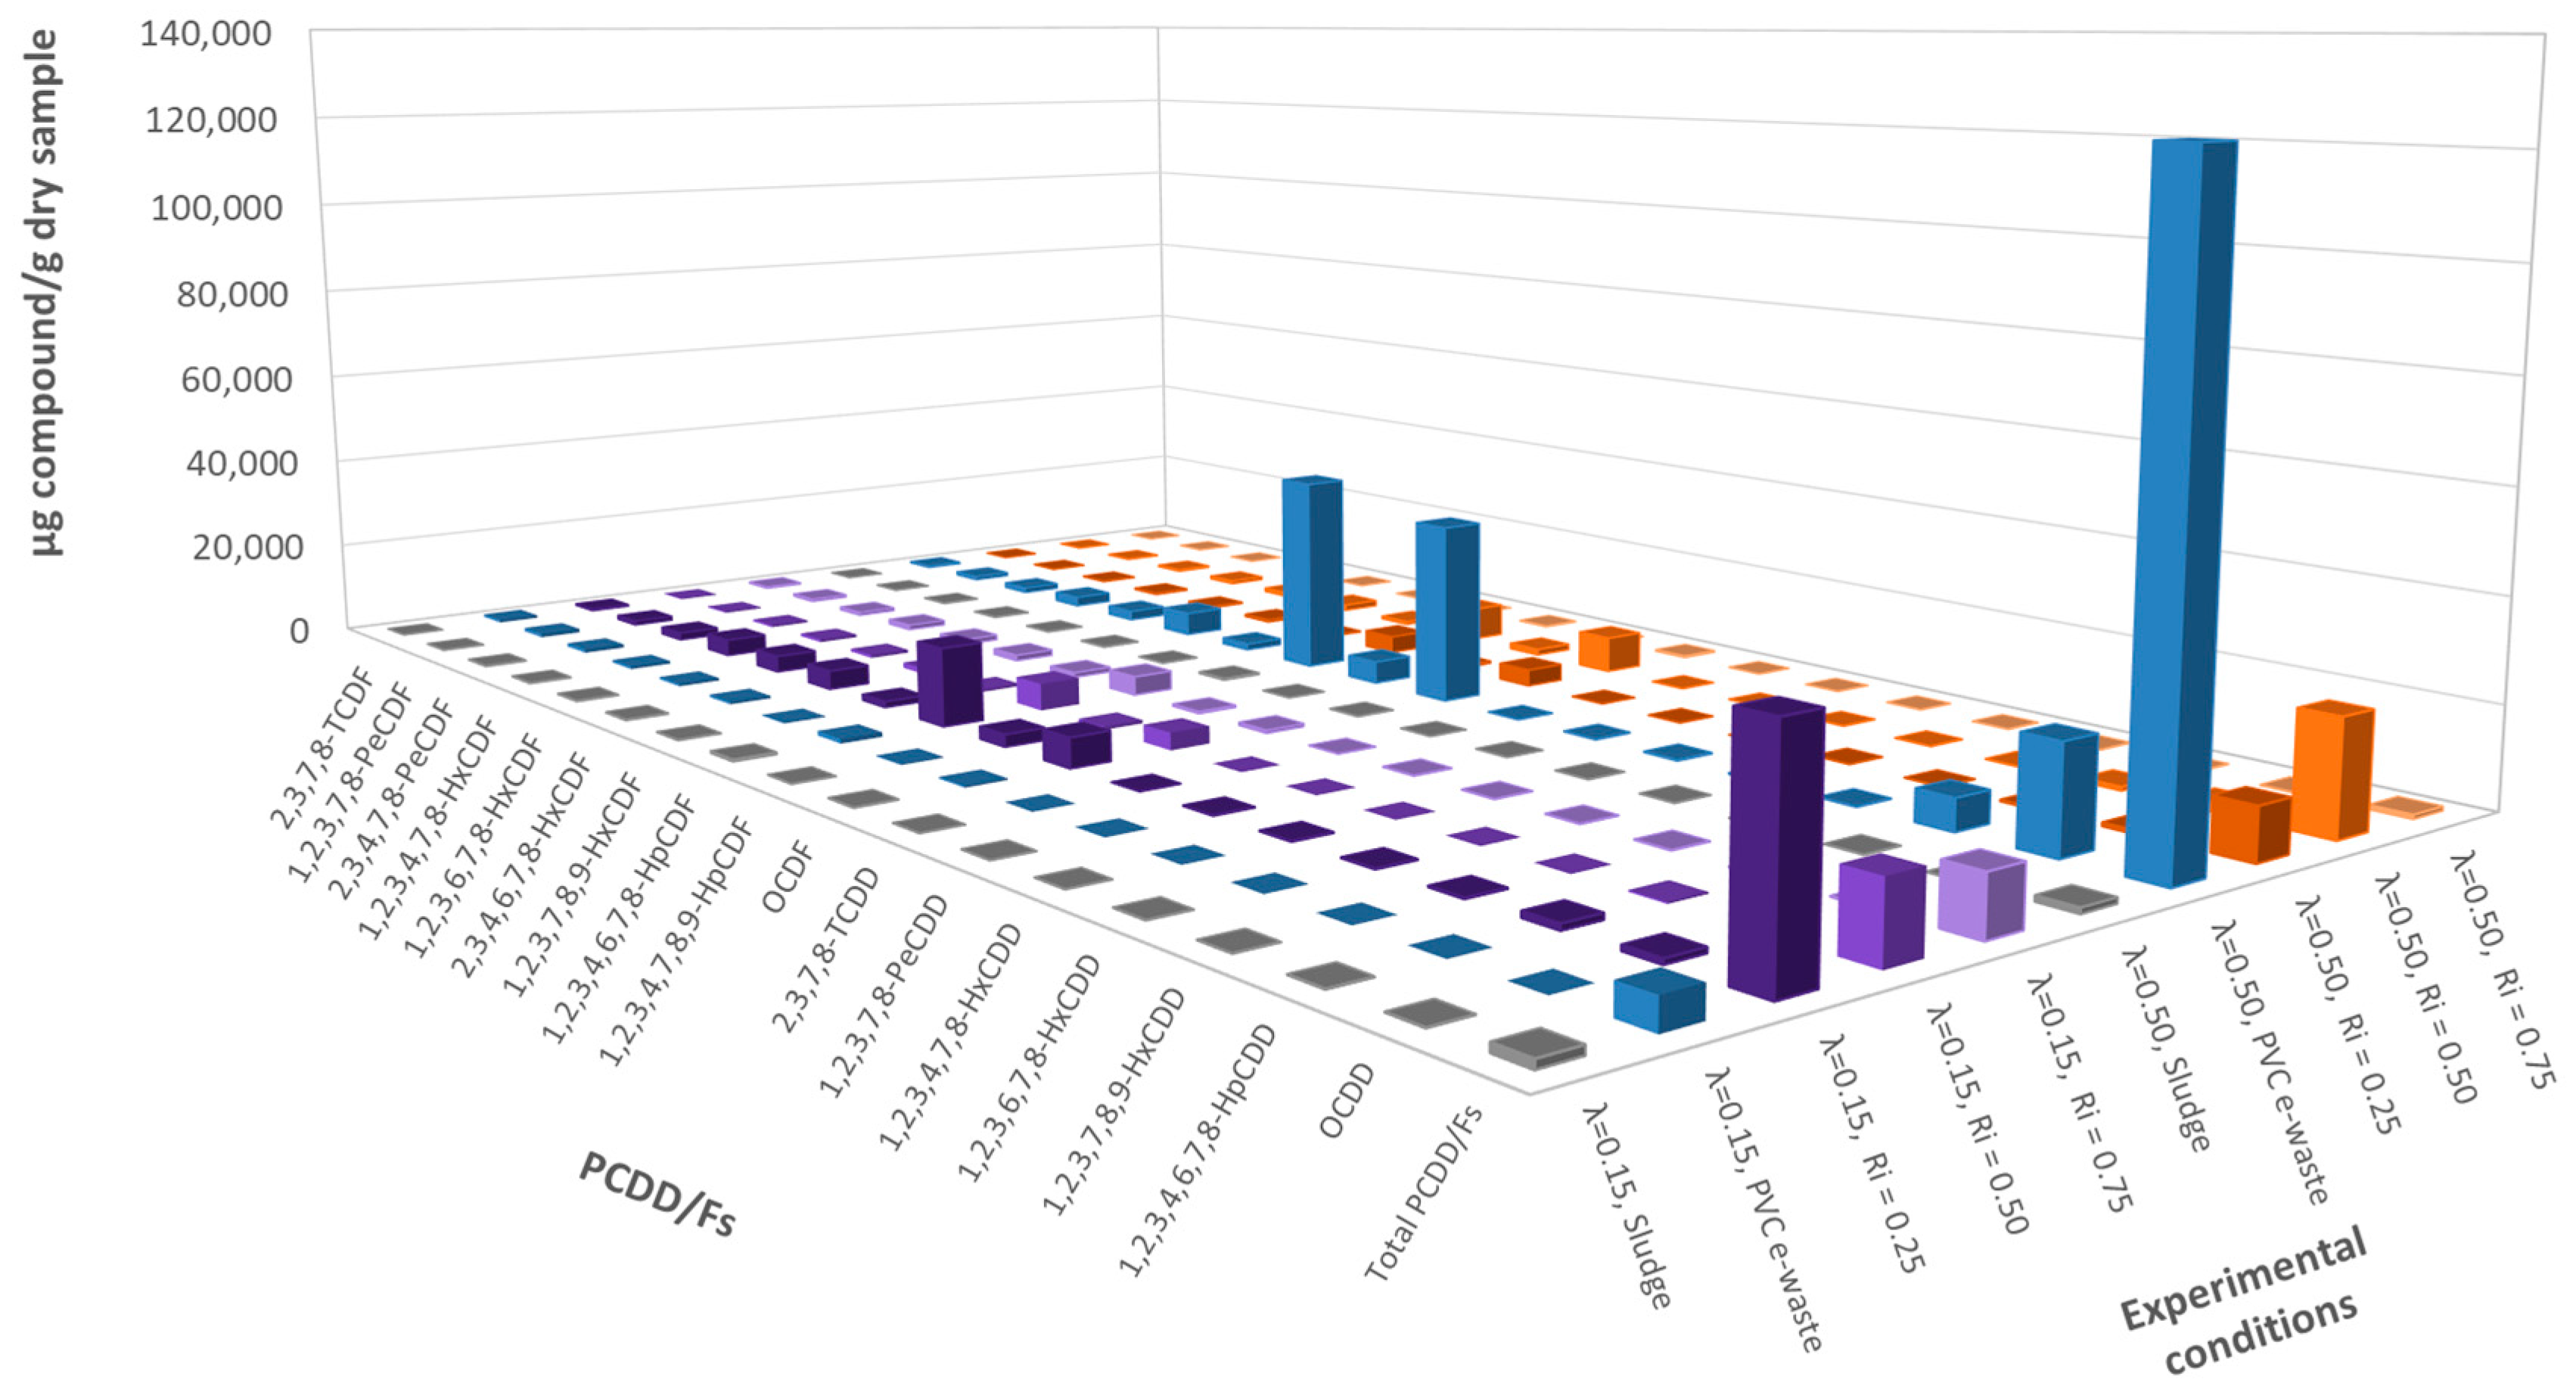
3.3.1. Emissions of PCDD/Fs
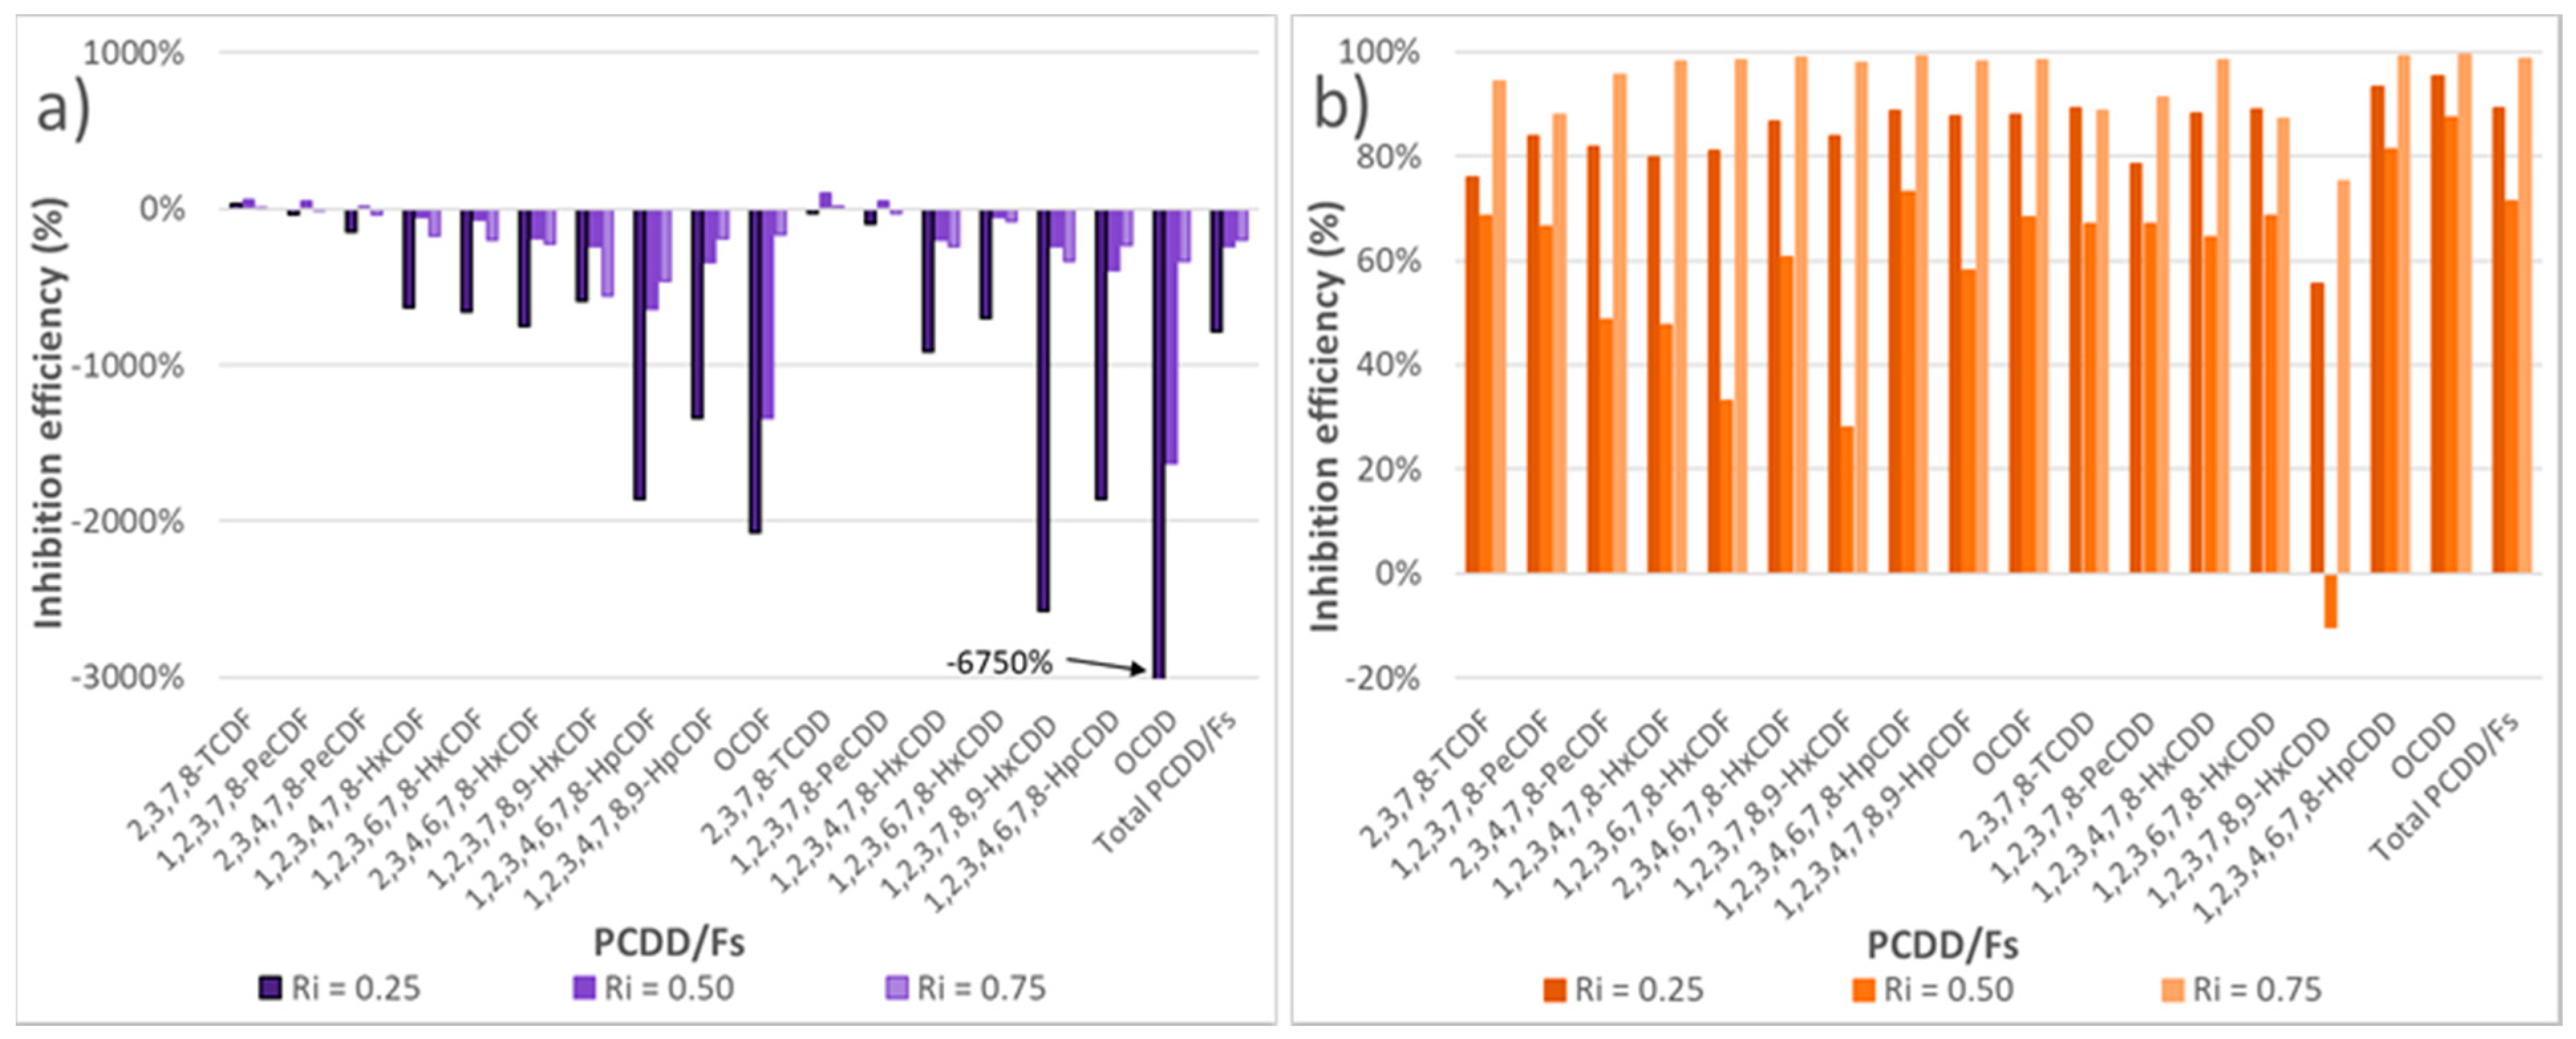
3.3.2. Inhibition of PCDD/F Formation
3.4. PCBs
3.4.1. Emissions of PCBs
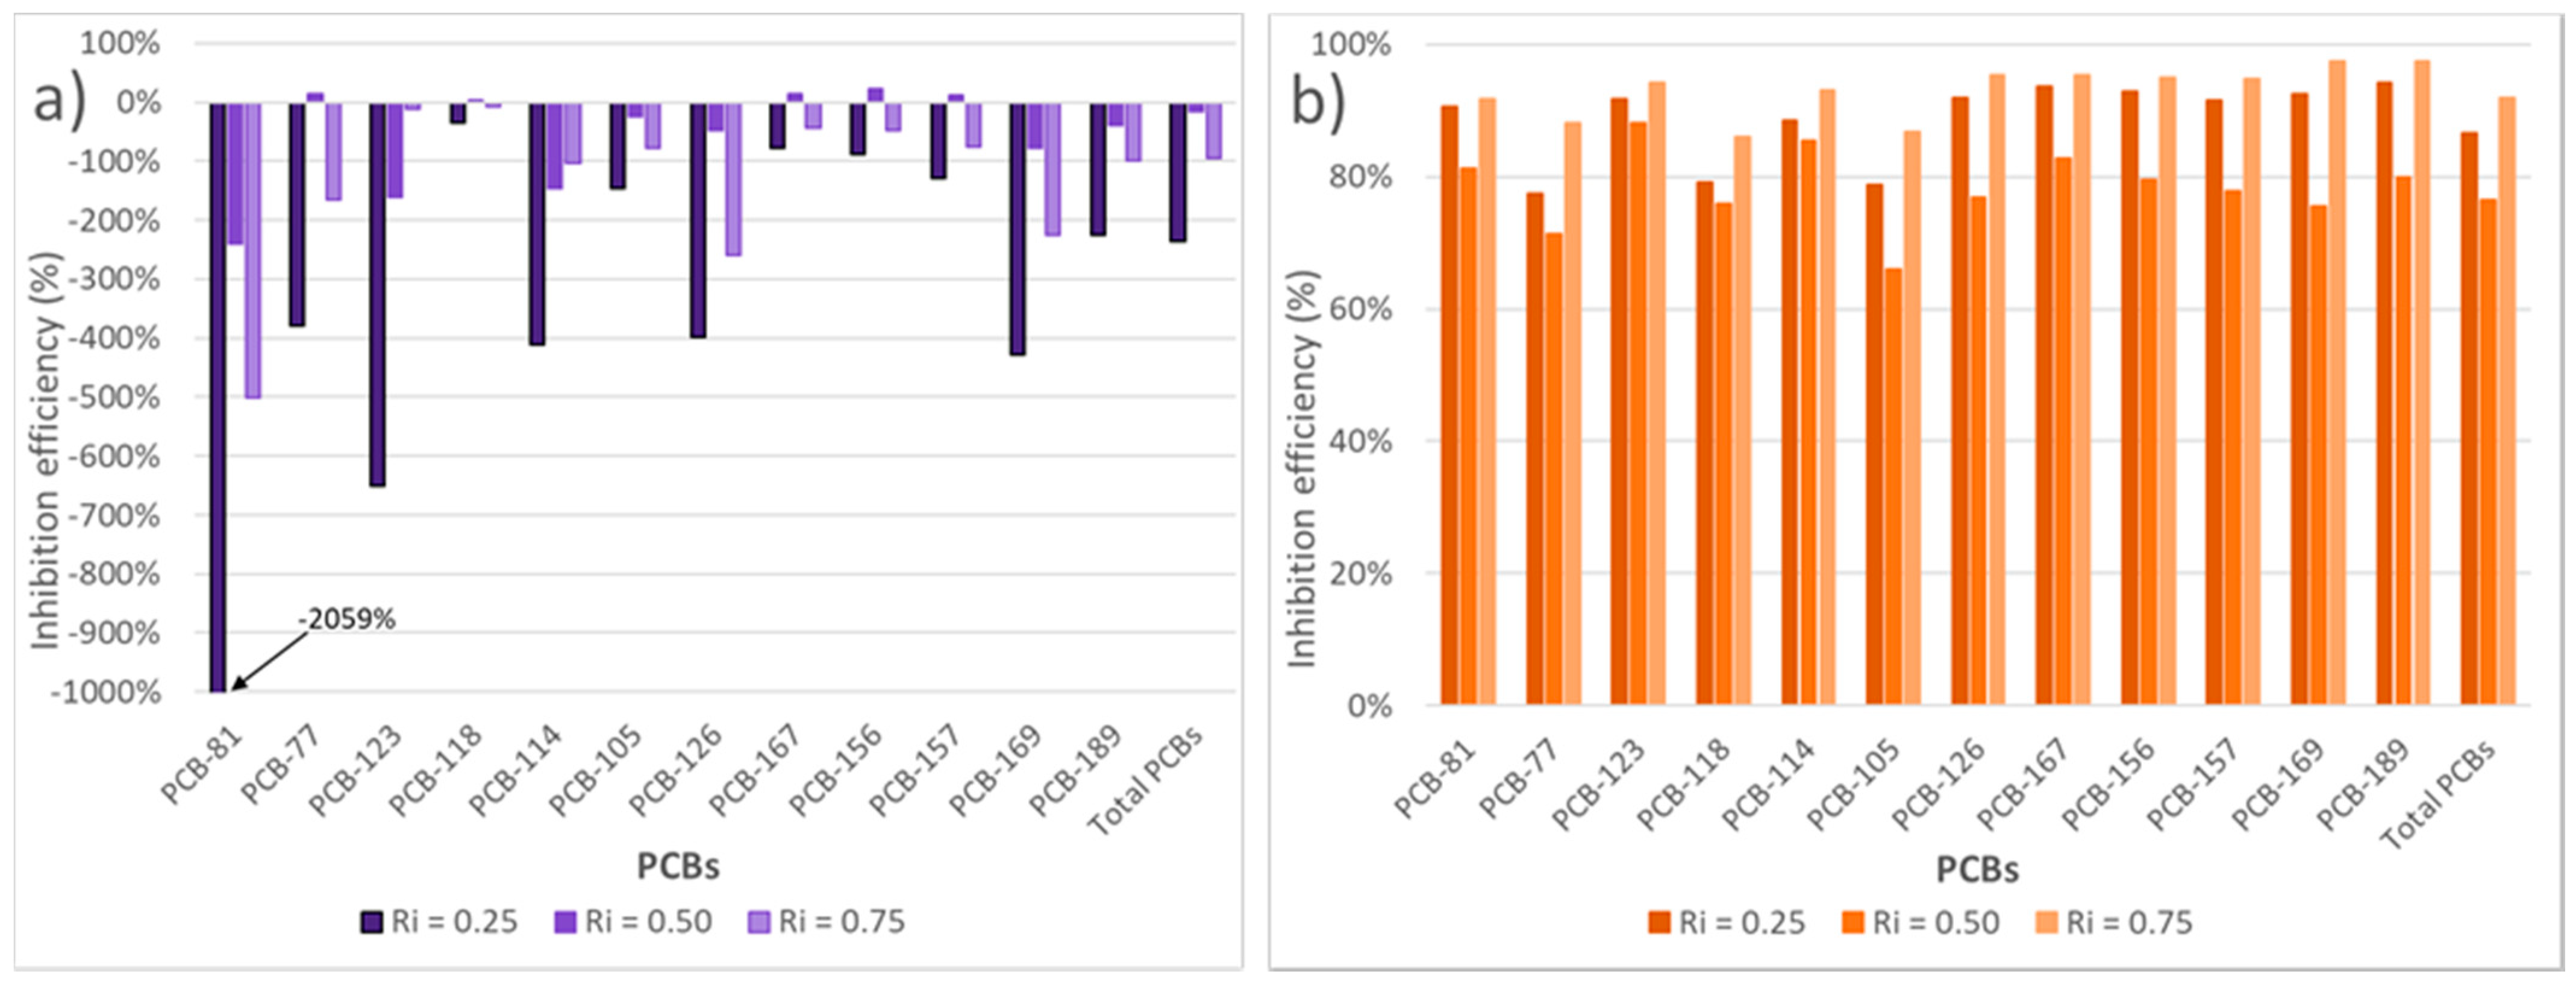
3.4.2. Inhibition of PCB Formation
4. Conclusions
- Regarding PAHs, when working in poor oxygen conditions (λ = 0.15) the best results were obtained for an inhibition ratio of 0.75, reducing some of the compounds by up to 60% with respect to the expected theoretical formation. However, the best results were obtained for λ = 0.50, where there was a significant reduction in the formation of pollutants for all inhibition ratios, being 0.75 the best inhibition ratio.
- The concentrations obtained for ClBzs and ClPhs were in many cases near zero, especially for ClPhs (except for 3,5-dichlorophenol). For these compounds, not all the factors mentioned above were analyzed due to the few values that could be obtained (most of the results being under the detection limit). However, it was enough to find a clear and visible trend. It was determined that for ClBzs in poor oxygen conditions (λ = 0.15), the best inhibition ratio was 0.50, while for higher oxygen ratios (λ = 0.50), the best inhibition ratio was 0.75. As for PAHs, the lowest ClBzs emissions were obtained when working at λ = 0.50. For ClPhs, the results obtained were similar to those obtained for ClBzs, but in this case for both oxygen ratios the best inhibition ratio was 0.75.
- Regarding the analysis of PCDD/F emissions, the best inhibition ratio was 0.75 for both oxygen ratio conditions. However, for poor oxygen conditions (λ = 0.15), all inhibition ratios caused an increase in the formation of PCDD/Fs with respect to the expected theoretical amount. On the other hand, for a higher oxygen ratio (λ = 0.50), a very significant reduction in the emission of all PCDD/Fs was observed for every mixture, being 0.75 the best inhibition ratio. In addition, the global inhibition efficiencies reached were 89.2%, 71.4%, and 98.8% for the inhibition ratios 0.25, 0.50, and 0.75, respectively.
- Finally, the results regarding dl-PCB emissions followed a similar trend to what was detected for all the previous analyzed compounds. When the emissions were produced with a λ = 0.15, the best inhibition ratio was 0.50. However, an increase in the formation of PCBs was observed for all inhibition ratios, with respect to the expected theoretical values. PCB emissions in a higher oxygen presence (λ = 0.50) offered the best results for an inhibition ratio of 0.75, too. In addition, there was a significant reduction of emissions for every inhibition ratio, between 60% and 95% of inhibition. Finally, the global inhibition efficiencies achieved were 86.7%, 76.5%, and 91.9% for the inhibition ratios 0.25, 0.50, and 0.75, respectively.
Supplementary Materials
Author Contributions
Funding
Institutional Review Board Statement
Informed Consent Statement
Data Availability Statement
Conflicts of Interest
References
- Yao, Z.; Ma, X. A new approach to transforming PVC waste into energy via combined hydrothermal carbonization and fast pyrolysis. Energy 2017, 141, 1156–1165. [Google Scholar] [CrossRef]
- Suresh, S.S.; Mohanty, S.; Nayak, S.K. Preparation and characterization of recycled blends using poly (vinylchloride) and poly(methyl methacrylate) recovered from waste electrical and electronic equipments. J. Clean. Prod. 2017, 149, 863–873. [Google Scholar] [CrossRef]
- Gullett, B.K.; Sarofim, A.F.; Smith, K.A.; Procaccini, C. The role of chlorine in dioxin formation. Process. Saf. Environ. Prot. 2000, 78, 47–52. [Google Scholar] [CrossRef]
- Thomas, S.; Wornat, M.J. The effects of oxygen on the yields of polycyclic aromatic hydrocarbons formed during the pyrolysis and fuel-rich oxidation of catechol. Fuel 2008, 87, 768–781. [Google Scholar] [CrossRef]
- Fullana, A.; Font, R.; Conesa, J.A.; Blasco, P. Evolution of products in the combustion of scrap tires in a horizontal, laboratory scale reactor. Environ. Sci. Technol. 2000, 34, 2092–2099. [Google Scholar] [CrossRef]
- Lu, S.; Wu, D.; Wang, Q.; Yan, J.; Buekens, A.G.; Cen, K. Photocatalytic decomposition on nano-TiO2: Destruction of chloroaromatic compounds. Chemosphere 2011, 82, 1215–1224. [Google Scholar] [CrossRef] [PubMed]
- Lu, S.; Wang, Q.; Buekens, A.G.; Yan, J.; Li, X.; Cen, K. Photocatalytic decomposition of gaseous 1,2-dichlorobenzene on TiO2 films: Effect of ozone addition. Chem. Eng. J. 2012, 195, 233–240. [Google Scholar] [CrossRef]
- Ji, S.S.; Li, X.D.; Ren, Y.; Chen, T.; Cen, K.F.; Ni, M.J.; Buekens, A. Ozone-enhanced oxidation of PCDD/Fs over V2O5-TiO2-based catalyst. Chemosphere 2013, 92, 265–272. [Google Scholar] [CrossRef]
- Pandelova, M.E.; Lenoir, D.; Kettrup, A.; Schramm, K.W. Primary measures for reduction of PCDD/F in co-combustion of lignite coal and waste: Effect of various inhibitors. Environ. Sci. Technol. 2005, 39, 3345–3350. [Google Scholar] [CrossRef]
- Wielgosiński, G.; Namiecińska, O.; Łechtańska, P.; Grochowalski, A. Effect of selected additions on de novo synthesis of polychlorinated dioxins and furans. Ecol. Chem. Eng. S 2016, 23, 249–257. [Google Scholar] [CrossRef]
- Wu, H.-L.; Lu, S.-Y.; Li, X.-D.; Jiang, X.-G.; Yan, J.-H.; Zhou, M.-S.; Wang, H. Inhibition of PCDD/F by adding sulphur compounds to the feed of a hazardous waste incinerator. Chemosphere 2012, 86, 361–367. [Google Scholar] [CrossRef] [PubMed]
- Fu, J.-Y.; Li, X.-D.; Chen, T.; Lin, X.-Q.; Buekens, A.; Lu, S.-Y.; Yan, J.-H.; Cen, K.-F. PCDD/Fs’ suppression by sulfur–amine/ammonium compounds. Chemosphere 2015, 123, 9–16. [Google Scholar] [CrossRef] [PubMed]
- Lin, X.; Yan, M.; Dai, A.; Zhan, M.; Fu, J.; Li, X.; Chen, T.; Lu, S.; Buekens, A.; Yan, J. Simultaneous suppression of PCDD/F and NOx during municipal solid waste incineration. Chemosphere 2015, 126, 60–66. [Google Scholar] [CrossRef] [PubMed]
- Lundin, L.; Gomez-Rico, M.F.; Forsberg, C.; Nordenskjöld, C.; Jansson, S. Reduction of PCDD, PCDF and PCB during co-combustion of biomass with waste products from pulp and paper industry. Chemosphere 2013, 91, 797–801. [Google Scholar] [CrossRef] [PubMed]
- Åmand, L.-E.; Kassman, H. Decreased PCDD/F formation when co-firing a waste fuel and biomass in a CFB boiler by addition of sulphates or municipal sewage sludge. Waste Manag. 2013, 33, 1729–1739. [Google Scholar] [CrossRef] [PubMed]
- Chen, T.; Zhan, M.-X.; Lin, X.-Q.; Li, X.-D.; Lu, S.-Y.; Yan, J.-H.; Buekens, A.; Cen, K.-F. Inhibition of the de novo synthesis of PCDD/Fs on model fly ash by sludge drying gases. Chemosphere 2014, 114, 226–232. [Google Scholar] [CrossRef] [PubMed]
- Chen, T.; Zhan, M.-X.; Lin, X.-Q.; Fu, J.-Y.; Lu, S.-Y.; Li, X.-D.; Buekens, A.; Yan, J.-H. PCDD/Fs Inhibition by Sludge Decomposition Gases: Effects of Sludge Dosage, Treatment Temperature and Oxygen Content. Aerosol. Air Qual. Res. 2015, 15, 702–711. [Google Scholar] [CrossRef]
- Zhan, M.X.; Fu, J.Y.; Chen, T.; Lin, X.Q.; Li, X.D.; Yan, J.H.; Buekens, A. Suppression of dioxins by S-N inhibitors in pilot-scale experiments. Environ. Sci. Pollut. Res. 2016, 23, 16463–16477. [Google Scholar] [CrossRef]
- Gómez-Rico, M.F. Estudio de Contaminantes Orgánicos en el Aprovechamiento de Lodos de Depuradora de aguas Residuales Urbanas; Universidad de Alicante: Alicante, Spain, 2008. [Google Scholar]
- Muñoz, M.; Gomez-Rico, M.F.; Font, R. PCDD/F and dioxin-like PCB concentrations during municipal solid waste biomethanation and subsequent composting. Chemosphere 2014, 98, 73–77. [Google Scholar] [CrossRef]
- Muñoz, M.; Garrido, M.A.; Gomez-Rico, M.F.; Font, R. PCDD/F determination in sewage sludge composting. Influence of aeration and the presence of PCP. Sci. Total Environ. 2018, 616–617, 763–773. [Google Scholar] [CrossRef]
- Org, S.U. Transforming Our World: The 2030 Agenda for Sustainable Development United Nations United Nations Transforming Our World: The 2030 Agenda for Sustainable Development. Available online: https://sdgs.un.org/2030agenda (accessed on 7 March 2021).
- Conesa, J.A.; Egea, S.; Moltó, J.; Ortuño, N.; Font, R. Decomposition of two types of electric wires considering the effect of the metal in the production of pollutants. Chemosphere 2013, 91, 118–123. [Google Scholar] [CrossRef] [PubMed]
- Gandon-Ros, G.; Soler, A.; Aracil, I.; Gómez-Rico, M.F. Dechlorination of polyvinyl chloride electric wires by hydrothermal treatment using K2CO3 in subcritical water. Waste Manag. 2020, 102, 204–211. [Google Scholar] [CrossRef] [PubMed]
- Conesa, J.A.; Soler, A. Decomposition kinetics of materials combining biomass and electronic waste. J. Anal. Calorim. 2016, 1–9. [Google Scholar] [CrossRef]
- Soler, A.; Conesa, J.A.; Iñiguez, M.E.; Ortuño, N. Pollutant formation in the pyrolysis and combustion of materials combining biomass and e-waste. Sci. Total Environ. 2018, 622–623, 1258–1264. [Google Scholar] [CrossRef] [PubMed]
- Conesa, J.A.; Moltó, J.; Font, R.; Egea, S. Polyvinyl Chloride and Halogen-free Electric Wires Thermal Decomposition. Ind. Eng. Chem. Res. 2010, 49, 11841–11847. [Google Scholar] [CrossRef]
- Soler, A.; Conesa, J.A.; Ortuño, N.; Ortuño García, N.; Ortuño, N. Application of Subcritical Water to Dechlorinate Polyvinyl Chloride Electric Wires. Energies 2018, 11, 2612. [Google Scholar] [CrossRef]
- ECS Solid Biofuels Determination of Ash Content. UNE-EN-147. 2010. Available online: https://infostore.saiglobal.com/preview/is/en/2009/i.s.en14775-2009.pdf?sku=1382258 (accessed on 7 March 2021).
- USEPA Method 5050. Bomb Preparation Method for Solid Waste. SW-846. 1994. Available online: https://19january2017snapshot.epa.gov/sites/production/files/2015-12/documents/5050.pdf (accessed on 7 March 2021).
- USEPA Method 9056A. Determination of Inorganic Anions by Ion Chromatography. SW-846. 2000. Available online: https://www.epa.gov/sites/production/files/2015-12/documents/9056a.pdf (accessed on 7 March 2021).
- Conesa, J.A.; Font, R.; Fullana, A.; Martín-Gullón, I.; Aracil, I.; Gálvez, A.; Moltó, J.; Gómez-Rico, M.F. Comparison between emissions from the pyrolysis and combustion of different wastes. J. Anal. Appl. Pyrolysis 2009, 84, 95–102. [Google Scholar] [CrossRef]
- Conesa, J.A.; Gálvez, A.; Martín-Gullón, I.; Font, R. Formation and Elimination of Pollutant during Sludge Decomposition in the Presence of Cement Raw Material and Other Catalysts. Adv. Chem. Eng. Sci. 2011, 01, 183–190. [Google Scholar] [CrossRef]
- Garrido, M.A.; Font, R.; Conesa, J.A. Pollutant emissions during the pyrolysis and combustion of flexible polyurethane foam. Waste Manag. 2016, 52, 138–146. [Google Scholar] [CrossRef]
- Moreno, A.I.; Font, R.; Gomez-Rico, M.F. Inhibition effect of polyurethane foam waste in dioxin formation. Waste Manag. 2019, 97, 19–26. [Google Scholar] [CrossRef]
- USEPA Method 1613. Tetra-Through Octa-Chlorinated Dioxins and Furans by Isotope Dilution HRGC/HRMS. SW-846. 1994. Available online: https://well-labs.com/docs/epa_method_1613b_1994.pdf (accessed on 7 March 2021).
- USEPA Method 1668 C: Chlorinated Byphenil Congeners in Water, Soil, Sediment, Biosolid and Tissue by HRGC/HRMS. 2010. Available online: https://www.epa.gov/sites/production/files/2015-09/documents/method_1668c_2010.pdf (accessed on 7 March 2021).
- Tian, M.; Liu, B.S.; Hammonds, M.; Wang, N.; Sarre, P.J.; Cheung, A.S.C. Formation of polycyclic aromatic hydrocarbons from acetylene over nanosized olivine-type silicates. Phys. Chem. Chem. Phys. 2012, 14, 6603–6610. [Google Scholar] [CrossRef] [PubMed]
- Fujimori, T.; Takaoka, M.; Takeda, N. Influence of Cu, Fe, Pb, and Zn Chlorides and Oxides on Formation of Chlorinated Aromatic Compounds in MSWI Fly Ash. Environ. Sci. Technol. 2009, 43, 8053–8059. [Google Scholar] [CrossRef] [PubMed]


| Elemental Analysis | wt% |
|---|---|
| C | 43.16 |
| H | 6.20 |
| N | nd |
| S | nd |
| Cl | 22.57 |
| Ca | 19.46 |
| Si | 0.07 |
| O | 8.15 |
| Elemental Analysis | wt% |
| C | 42.70 |
| H | 6.05 |
| N | 6.77 |
| S | 1.18 |
| O by difference | 22.74 |
| Ash content | 20.56 |
| X-ray Fluorescence Analysis | wt% |
| Na | 0.34 |
| Mg | 0.88 |
| Al | 0.54 |
| Si | 1.33 |
| P | 3.48 |
| Cl | 0.65 * |
| K | 0.61 |
| Ca | 6.73 |
| Ti | 0.27 |
| Cr | 0.01 |
| Mn | 0.02 |
| Fe | 5.14 |
| Ni | 0.01 |
| Cu | 0.08 |
| Zn | 0.17 |
| Br | 0.03 * |
| Sr | 0.17 |
| I | 0.02 |
| Ba | 0.03 |
| W | 0.03 |
| Pb | 0.02 |
| SAMPLE ID | Load | λ | Ri |
|---|---|---|---|
| 1 | Blank | - | - |
| 2 | Sludge | 0.15 | - |
| 3 | PVC e-waste | 0.15 | - |
| 4 | Sludge + PVC e-waste | 0.15 | 0.25 |
| 5 | Sludge + PVC e-waste | 0.15 | 0.50 |
| 6 | Sludge + PVC e-waste | 0.15 | 0.75 |
| 7 | Sludge | 0.50 | - |
| 8 | PVC e-waste | 0.50 | - |
| 9 | Sludge + PVC e-waste | 0.50 | 0.25 |
| 10 | Sludge + PVC e-waste | 0.50 | 0.50 |
| 11 | Sludge + PVC e-waste | 0.50 | 0.75 |
Publisher’s Note: MDPI stays neutral with regard to jurisdictional claims in published maps and institutional affiliations. |
© 2021 by the authors. Licensee MDPI, Basel, Switzerland. This article is an open access article distributed under the terms and conditions of the Creative Commons Attribution (CC BY) license (http://creativecommons.org/licenses/by/4.0/).
Share and Cite
Gandon-Ros, G.; Nuñez, S.S.; Ortuño, N.; Aracil, I.; Gómez-Rico, M.F.; Conesa, J.A. A Win–Win Combination to Inhibit Persistent Organic Pollutant Formation via the Co-Incineration of Polyvinyl Chloride E-Waste and Sewage Sludge. Polymers 2021, 13, 835. https://doi.org/10.3390/polym13050835
Gandon-Ros G, Nuñez SS, Ortuño N, Aracil I, Gómez-Rico MF, Conesa JA. A Win–Win Combination to Inhibit Persistent Organic Pollutant Formation via the Co-Incineration of Polyvinyl Chloride E-Waste and Sewage Sludge. Polymers. 2021; 13(5):835. https://doi.org/10.3390/polym13050835
Chicago/Turabian StyleGandon-Ros, Gerard, Samuel S. Nuñez, Nuria Ortuño, Ignacio Aracil, María Francisca Gómez-Rico, and Juan A. Conesa. 2021. "A Win–Win Combination to Inhibit Persistent Organic Pollutant Formation via the Co-Incineration of Polyvinyl Chloride E-Waste and Sewage Sludge" Polymers 13, no. 5: 835. https://doi.org/10.3390/polym13050835
APA StyleGandon-Ros, G., Nuñez, S. S., Ortuño, N., Aracil, I., Gómez-Rico, M. F., & Conesa, J. A. (2021). A Win–Win Combination to Inhibit Persistent Organic Pollutant Formation via the Co-Incineration of Polyvinyl Chloride E-Waste and Sewage Sludge. Polymers, 13(5), 835. https://doi.org/10.3390/polym13050835