Abstract
The adenosine A2A receptor (A2AR) represents a potential therapeutic target for neurodegenerative diseases. Aiming at the development of a positron emission tomography (PET) radiotracer to monitor changes of receptor density and/or occupancy during the A2AR-tailored therapy, we designed a library of fluorinated analogs based on a recently published lead compound (PPY). Among those, the highly affine 4-fluorobenzyl derivate (PPY1; Ki(hA2AR) = 5.3 nM) and the 2-fluorobenzyl derivate (PPY2; Ki(hA2AR) = 2.1 nM) were chosen for 18F-labeling via an alcohol-enhanced copper-mediated procedure starting from the corresponding boronic acid pinacol ester precursors. Investigations of the metabolic stability of [18F]PPY1 and [18F]PPY2 in CD-1 mice by radio-HPLC analysis revealed parent fractions of more than 76% of total activity in the brain. Specific binding of [18F]PPY2 on mice brain slices was demonstrated by in vitro autoradiography. In vivo PET/magnetic resonance imaging (MRI) studies in CD-1 mice revealed a reasonable high initial brain uptake for both radiotracers, followed by a fast clearance.
1. Introduction
Adenosine is an endogenous ubiquitous purine nucleoside formed by the hydrolysis of extracellular 5′-adenosine triphosphate (ATP) by ectonucleotidases (CD39, CD73) and degraded by phosphorylation to adenosine monophosphate or by deamination to inosine [1,2]. In addition, the extracellular levels of adenosine are regulated by equilibrative and concentrative nucleoside transporters expressed at the plasma membranes of a great variety of cells [3]. It acts as a signaling molecule, which binds to four subtypes of purinergic P1 receptors, namely A1R, A2AR, A2BR and A3R, which are coupled to different G protein-mediated intracellular pathways [4,5]. In this way, adenosine regulates energy homeostasis and affects the function of various organs and tissues such as brain, heart, brown adipose tissues and others. Targeted drug interaction with the specific receptor subtypes, metabolizing enzymes or transporters are regarded to have important therapeutic potential.
The function of adenosine in the central nervous system (CNS) has extensively been studied. It regulates the release and uptake of neurotransmitters, modulates synaptic plasticity and protects from ischemic, hypoxic and oxidative stress [6,7]. One of its major targets in the CNS, the A2AR, is highly expressed in the striatum, where it is involved in the indirect basal ganglia pathway [8]. Lower densities of the A2AR were reported in GABAergic medium spiny neurons post-synapses [9], astrocytes [10], microglia [11], oligodendrocytes [12] and endothelial cells [13]. The neuromodulatory role of the A2AR in the CNS is strongly related to its ability to interact with other receptors forming heteromers, such as dopamine D2R-A2AR [14], glutamate mGluR5R-A2AR [15], cannabinoid CB1R-A2AR [16] and adenosine A1R-A2AR [17].
A2AR ligands have been investigated in neurodegenerative diseases, such as Huntington’s disease (HD), Alzheimer’s disease (AD) and Parkinson’s disease (PD) [7,18,19,20]. HD is defined by the loss of medium spiny neurons [21] and several studies have demonstrated a marked loss of striatal A2AR [22]. In transgenic animal models of HD, A2AR agonists have shown to reverse motor deficits, whereas A2AR antagonists worsen motor performance [23,24,25]. Imaging of the A2AR with selective positron emission tomography (PET) radiotracers is regarded as a useful tool to advance our understanding of the functional role of this receptor in healthy and diseased brains [20]. The 11C-labeled PET radiotracer [11C]KF18446 has been used to demonstrate the reduced A2AR expression in an animal model of HD [26]. This study showed a significant reduced binding potential of [11C]KF18446 in the quinolinic acid-lesioned striatum. AD is a progressive disease characterized by the loss of cholinergic neurons and changes in the protein structure. Disturbances in the protein folding result in the formation and aggregation of β-amyloid (Aβ), which is resistant to the enzymatic proteolysis [27]. In AD, the A2AR is upregulated in the frontal cortex and hippocampus [28]. In vivo experiments in animal models of AD revealed that A2AR antagonists prevent the neurotoxicity and synaptotoxicity of Aβ [29] as well as enhance memory function [30]. So far, no PET imaging of the A2AR has been performed in HD and AD patients. Thus, in vivo imaging of the A2AR might increase the understanding of the disease pathogenesis and enable the development of emerging therapies.
In contrast to HD and AD, the A2AR expression has been intensively studied in PD patients. The most established therapy of PD is based on the administration of L-3,4-dihydroxyphenylalanine (L-DOPA) in combination with inhibitors to decrease the metabolism of dopamine. Although L-DOPA therapy has increased the life quality of patients with PD by reducing motoric disorders, long-term treatment with L-DOPA often leads to a decreased efficacy over time accompanied with pronounced adverse effects, such as dyskinesia, “on” phase shortening and psychotic syndromes [31]. Results from clinical II and III trials demonstrated that the adjunctive treatment with A2AR antagonists improves the mobility of PD patients as well as reduces adverse effects of long-term L-DOPA treatment [32,33]. One of the most investigated A2AR antagonists is istradefylline (former KW-6002; Nourianz®, Kyowa Kirin Inc., Bedminster, NJ, USA), which was approved by the U.S. Food and Drug Administration (FDA) in April 2019 for adjunctive treatment in patients with PD [34,35]. Several other A2AR antagonists, such as vipadenant and preladenant (Figure 1), have also been studied in clinical trials for treatment of neurodegenerative diseases, but so far, none of them has been approved by the FDA [36]. Furthermore, some findings suggest that A2AR antagonists might also be efficacious as monotherapeutic drug in PD patients at an early stage of the disease [36]. The early clinical diagnosis of PD is highly challenging which reinforces the importance of the functional imaging targeting the pathophysiology of the disease progress. PET imaging of the A2AR would be an effective technique to monitor the disease progression, to assess dose-dependent occupancy of the receptor population by therapeutic drugs and to evaluate the efficacy of the therapy.
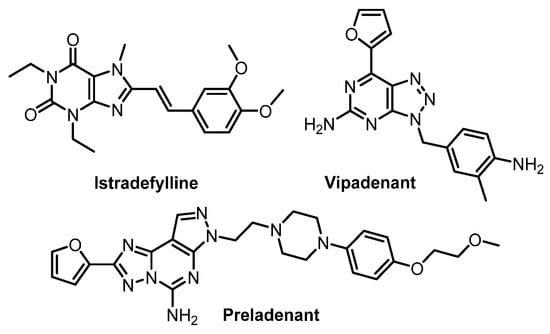
Figure 1.
Representative A2AR antagonists in clinical trials [36].
Five radiotracers for PET imaging of the A2AR, namely [11C]TMSX, [11C]preladenant, [11C]SCH442416, [11C]KW-6002 and [18F]MNI-444, have been evaluated in humans (Figure 2) [18]. Among those, [11C]SCH442416 is the only radiotracer investigated in PD patients with L-DOPA-induced dyskinesia despite suffering from high levels of background non-specific binding [37]. Furthermore, fluorine-18 is the most predominant radionuclide for PET imaging due to its attractive half-life (109.7 min) that allows multistep synthesis and distribution to various PET centers after production, and its lower positron energy (635 keV) facilitating high image resolution. Thus, an 18F-labeled radiotracer, namely [18F]MNI-444, was developed for clinical application. Although [18F]MNI-444 presents an excellent ratio of specific-to-non-specific binding in healthy subjects, the relative slow kinetics of this radiotracer may limit its routine clinical use due to too-long scan times needed [38].
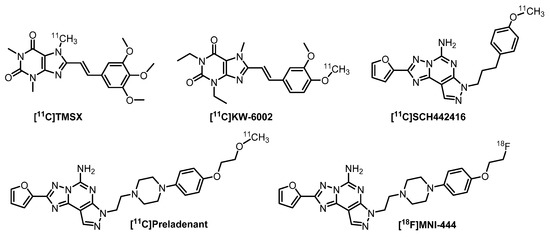
Figure 2.
A2AR PET radiotracers in clinical trials [18].
Aiming to develop a new A2AR radiotracer presenting the advantages of fluorine-18, a high specific binding and suitable pharmacokinetic for clinical use, we selected PPY (Figure 3) [39,40], an analog of the extensively studied A2AR antagonist vipadenant (Figure 1), as lead compound due to its high A2AR binding affinity of 1 nM and 260-fold selectivity over the A1R subtype. Furthermore, it possesses all favorable physicochemical and absorption, distribution, metabolism, and excretion (ADME) properties for a CNS PET radiotracer, e.g., M = 326 g/mol, cLogD7.4 = 4.01, polar surface area = 83 Å2 and H-bond donors = 2 [41]. The 4-(furan-2-yl)pyrazolo-[3,4-d]pyrimidine building block was used as starting point for further investigations. Fluorinated derivatives have been synthesized by varying the substituents at the N1 position of the pyrazole. Hence, the lead compound was modified by replacing the benzyl moiety by various substituted fluorobenzyl, fluorobenzoyl or fluoropyridyl groups and linker extensions to study the impact on the binding affinity towards the A2AR (Figure 2). Thus, a series of 20 novel A2AR ligands bearing the fluorine atom either at aromatic or aliphatic positions was developed. The ligands with the highest binding affinity and off-target selectivity were selected for the development of 18F-labeled ligands by radiofluorination of the corresponding precursors and for preliminary biological investigations of the novel potential A2AR radiotracers.
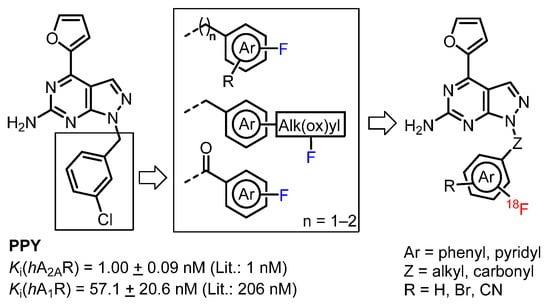
Figure 3.
Lead compound PPY and illustration of approached strategies towards novel 18F-labeled derivatives.
2. Results
2.1. Chemistry
The synthesis of the novel fluorinated derivatives has been performed as described for PPY [39,40] with minor modifications. First, commercially available pyrimidine 1 is formylated via a Vilsmeier–Haack reaction. Then, an electrophilic aromatic substitution led to an iminium ion, which was hydrolyzed during workup to the corresponding aldehyde. After cyclization with hydrazine and purification by recrystallization from N,N-dimethylformamide (DMF)/water, compound 2 was isolated with 70% yield over two steps. In the literature, the pyrazolo[3,4-d]pyrimidine 3 was obtained by protection of the amine in 2 with a tert-butoxycarbonyl (Boc) group, followed by Stille coupling with 2-(tributyl-stannyl)furan in the presence of bis(triphenylphosphine)-palladium(II) and, finally, thermal Boc-group removal using aqueous dimethylamine with an overall yield of 16% [39,40]. In our hands, the Stille coupling was optimized by using the unprotected compound 2 directly to give 3 with 82% yield. The key building block 3 was used for the development of all further derivatives described herein as shown in Scheme 1.
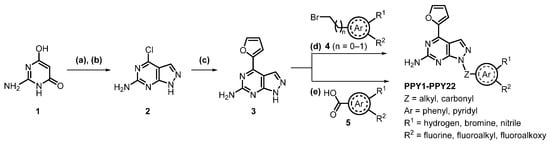
Scheme 1.
Synthesis of novel fluorinated PPY derivatives, reagents and conditions: (a) DMF, POCl3, 0–100 °C, 5 h; (b) N2H4, H2O, NEt3, RT, 3 h; (c) tributyl(furan-2-yl)stannane, PdCl2(PPh3)2, DMF, 90 °C, 18 h; (d) (bromomethyl)aryl 4 (n = 0–1), K2CO3, DMF, RT, 6 h; (e) benzoic acid 5, BOP, NEt3, CH2Cl2, RT, 18 h.
The fluorinated target products were synthesized by either a benzylation or a coupling reaction of 3 with the corresponding benzoic acids (Scheme 1). The (bromomethyl)pyridine and (bromomethyl)benzene derivatives 4, used for the synthesis of compounds PPY1-PPY19 and PPY22, were either purchased or synthesized via a Wohl-Ziegler reaction with N-bromosuccinimide (NBS) and 2,2′-azobis(2-methylpropionitrile) (AIBN) as radical initiator in carbon tetrachloride. The regioselective benzylation with the corresponding (bromomethyl)aryls was modified from literature by using potassium carbonate instead of sodium hydride [39,40]. Under these conditions, 6 h instead of 1 h were necessary for complete conversion, but fewer by-products were formed and higher yields could be achieved (82% vs. 16% [39]). The amide coupling of compound 3 with 2- or 4-fluorobenzoic acid 5 was performed in the presence of benzotriazol-1-yloxy-tris(dimethylamino)phosphonium hexafluorophosphate (BOP) as coupling reagent. Analogous to the fluorinated derivatives, the boronic acid pinacol ester precursors 6 and 7 (Scheme 2) were synthesized by a benzylation reaction of 3 with the corresponding (bromomethyl)phenyl moieties.
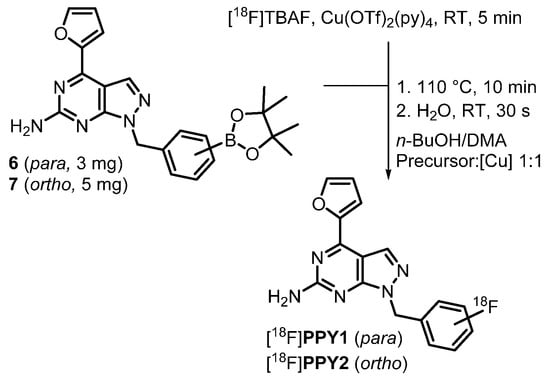
Scheme 2.
Radiosynthesis of [18F]PPY1 and [18F]PPY2 by an alcohol-enhanced copper-mediated radiofluorination of the corresponding boronic acid pinacol ester precursor 6 or 7.
2.2. Structure–Activity Relationship (SAR) Studies
Preliminary quantitative structure-activity relationship (QSAR) modelling studies were carried out to predict binding poses and intermolecular interactions responsible for determined binding affinities (Ki) by radioligand binding assays (Figure 4). The X-ray crystallographic chimeric protein structure of A2AR-BRIL in complex with the antagonist ZM241385 (PDB ID: 4EIY) was selected for QSAR modelling due to the highest resolution (1.8 Å) of all available non-thermostabilized structures [42]. The pyrazolo[3,4-d]pyrimidine unit of the herein developed compounds is located in the binding cavity and is stabilized by aromatic π-π interaction with Phe168. Furthermore, the amine forms hydrogen bonds with Glu169 and Asn253. The benzyl and pyridyl groups of the fluorinated ligands PPY1-PPY7 are additionally stabilized by π-π interaction with Tyr271. The decreased binding affinity of PPY19 can be explained by the missing interaction with Tyr271 due to the linker extension resulting in another orientation of the benzyl group in the binding pocket. The same orientation change is obtained by the introduction of a carbonyl group as linker for ligands PPY20 and PPY21. The high binding affinity of PPY17 can be explained by additional interactions of the fluorine atom with His264, Ala265, Pro266 and Leu267. Despite the promising binding properties of PPY17, this compound was not selected for development of the corresponding radiotracer due to the predicted radiometabolites resulting from enzymatic N-debenzylation and O-dealkylation [43,44,45].
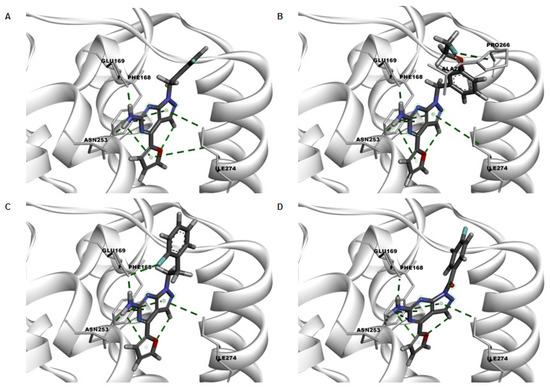
Figure 4.
Key interactions in green dotted lines of the docking poses of representative active compounds (A) PPY2, (B) PPY17, (C) PPY19 and (D) PPY21 in the binding site of crystal structure of A2AR (PDB ID: 4EIY).
The structures of the final products prepared in this study along with determined binding affinities towards the A2AR and A1R subtypes are given in Table 1. Exchanging the halogen of the lead compound from chlorine (PPY) to fluorine (PPY3) resulted in a 3-fold decreased A2AR binding affinity. Thus, it could be assumed, that chlorine is involved in halogen bonding in the binding pocket of the A2AR. In contrast to chlorine, fluorine is not able to form halogen bonding interactions due to its higher electronegativity and the lack of polarizability [46]. Further investigations were based on the impact of fluorine in ortho-, meta- and para-position of the benzyl ring on the binding potency. The fluorination in ortho-position (PPY2) led to a 2.5-fold increased A2AR binding affinity compared to the para-position (PPY1). Due to our continued interest in nucleophilic aromatic radiofluorination, the reactivity of the 18F-labeling position has to be considered. Consequently, fluorinated pyridyl groups were established in the lead compound. In general, no further electron withdrawing substituents are needed for the radiolabeling of pyridines at the 2- and 4-positions due to the considerably low electron density, which facilitate the nucleophilic attack of [18F]fluoride [47,48]. However, the incorporation of heteroatoms in 2-position to fluorine (PPY4-PPY7) led to a decrease in the A2AR binding affinity. Subsequently, the tolerability of further substituents was investigated regarding the binding potency. For that purpose, the impact of substituents at the phenyl ring was explored by introduction of bromine (PPY8-PPY11) or a nitrile group (PPY12-PPY15) in meta-position to fluorine. In comparison with the monosubstituted PPY2, the bromine in compound PPY8 led to a 2-fold increased A2AR binding affinity. Furthermore, a trend of A2AR binding potencies regarding the fluorine position in the benzyl ring can be ranked as follows: ortho (PPY2, PPY8, PPY11, PPY12, PPY15) > meta (PPY3, PPY10, PPY14) > para (PPY1, PPY9, PPY13). Based on the lead compound, elaboration of the meta-substituent by introduction of aliphatic fluorine was also investigated (PPY16-PPY18). The 3-(2-fluoroethyl)benzyl derivative PPY16 exhibited increased A2AR affinity and only slightly decreased selectivity. Replacing of the fluoroethyl group by a fluoroethoxy group (PPY17) increased the A1R selectivity. Furthermore, extension of the linker between the pyrazole and the phenyl ring with one methylene group (PPY19) was detrimental for the binding potency towards the A2AR. N-acyl substitution was also tested by exchanging the methylene group by a carbonyl group (PPY20, PPY21). However, this modification led to a reduction of the A2AR binding affinity.

Table 1.
Overview of synthesized PPY derivatives and in-house determined in vitro binding affinities towards the A2AR and A1R subtypes; mean value ± standard derivation (n ≥ 3) or mean value (n = 2, single values are shown in brackets).
Among our derivatives, the most potent A2AR ligands based on the pyrazolo[3,4-d]pyrimidine scaffold are derivatives substituted with 4-fluorobenzyl (PPY1) and 2-fluorobenzyl (PPY2). These compounds were herein selected for radiofluorination to investigate the ability of this scaffold to cross the blood-brain barrier (BBB) and to assess its in vitro and in vivo profiles.
2.3. Radiochemistry
The radiosynthesis of [18F]PPY1 and [18F]PPY2 (Scheme 2) is based on a copper-mediated procedure established by the groups of P. J. Scott and V. Gouverneur [49,50,51,52,53] and further developed by several other groups [54,55]. In the present study, an alcohol-enhanced copper-mediated radiofluorination of the boronic acid pinacol ester precursor 6 was performed for the radiosynthesis of [18F]PPY1. The reaction conditions were systematically optimized by varying the ratio of precursor-to-copper catalyst, the amount of precursor, the solvent ratio of n-butanol (n-BuOH) and N,N-dimethylacetamide (DMA), the reaction time and pre-stirring of the tetra-n-butylammonium [18F]fluoride complex ([18F]TBAF) with the copper catalyst (Figure 5).
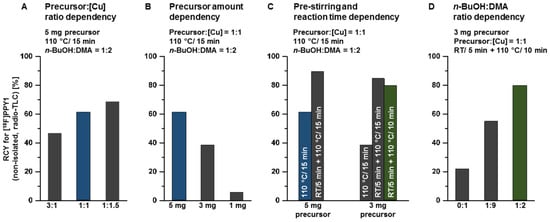
Figure 5.
Investigated reaction conditions for the radiosynthesis of [18F]PPY1: (A) ratio of precursor 6-to-copper catalyst, (B) amount of precursor 6 and (C) with/without pre-stirring of [18F]TBAF with [Cu] for 5 min at RT and reaction time dependency, (D) ratio of n-BuOH-to-DMA.
First, the dependency of the radiochemical yield on the ratio of precursor-to-tetrakis- (pyridine)copper(II) triflate (Cu(py)4(OTf)2, further on abbreviated as [Cu]) was investigated. The amount of both reactants was adjusted to simplify the purification step as well as to comply with the guidance of the International Council for Harmonisation of Technical Requirements for Pharmaceuticals for Human Use on elemental impurities (ICH Q3D). In this sense, the reaction was performed by nucleophilic substitution of the boronic acid pinacol ester 6 by [18F]fluoride using [18F]TBAF and [Cu] (5 mg vs. 3 mg vs. 1 mg, dissolved in 400 µL n-BuOH). Radio-TLC analysis from aliquots of the reaction mixture revealed radiochemical yields of 47%, 61% and 69% for precursor-to-[Cu] ratios of 3:1, 1:1 and 1:1.5, respectively. All further experiments were performed with a ratio of 1:1 of precursor-to-copper catalyst due to the toxicity of copper and to prevent overloading of the HPLC column during purification. Afterwards, the amount of precursor 6 was systematically reduced to simplify the isolation of [18F]PPY1 by semi-preparative reversed-phase HPLC (RP-HPLC). As expected, this resulted in a decrease in the achievable radiochemical yield from 61% (5 mg) to 39% (3 mg) and 6% (1 mg) of [18F]PPY1 (non-isolated, radio-TLC).
Furthermore, the effect of pre-stirring of the copper catalyst and the [18F]TBAF complex on the radiochemical yield was investigated. The proposed mechanism is based on the Chan-Evans-Lam coupling reaction (see Supporting information, Figure S1) and involves the transmetalation of a [Cu(II)(OTf)18F] complex and subsequent oxidation by air or another equivalent of Cu(II) triflate to generate the highly reactive Cu(III) species [56]. Afterwards, the high-valent Cu(III) complex is able to form facile C-F bonds by reductive elimination. The relatively mild conditions employed in the reaction also indicate that the C-F coupling has a low activation barrier. It is hypothesized that the initial formation of the [Cu(II)(OTf)18F)] complex might be capable of facilitating the following transmetalation step [57]. This hypothesis was investigated by pre-stirring of the [18F]TBAF complex as fluoride source and [Cu] as catalyst at room temperature (RT) for 5 min followed by addition of either 5 mg or 3 mg of the precursor 6 and then, thermal heating of the reaction mixture at 110 °C for 15 min. This approach resulted in a significant increase in the radiochemical yield of non-isolated [18F]PPY1 to 90% (5 mg, radio-TLC) and 85% (3 mg, radio-TLC). All further experiments were performed with 3 mg of precursor 6 due to the high radiochemical yield of [18F]PPY1 and the advantages for purification of the radiotracer by semi-preparative RP-HPLC as mentioned above. In addition, the reaction time of the 18F-labeling step could be reduced from 15 to 10 min without significant impact on the radiochemical yield (85% vs. 79%, radio-TLC).
The previous experiments for the optimization of the reaction conditions have been performed in a solvent mixture of n-BuOH/DMA (1:2, v/v). The efficient application of alcohols, especially n-BuOH as co-solvent for copper-mediated radiofluorination, was adapted from literature [55]. The use of only DMA or a mixture of n-BuOH/DMA (1:9, v/v) as solvent resulted in a reduction of the radiochemical yield to either 22% or 55% of [18F]PPY1 (non-isolated, radio-TLC), respectively.
The optimized procedure for the radiosynthesis of [18F]PPY1 is summarized in Scheme 2. In brief, [Cu] in DMA is added to the anhydrous [18F]TBAF complex in n-BuOH and the mixture is stirred at RT for 5 min. Afterwards, precursor 6 in DMA is added and the reaction mixture is stirred at 110 °C for 10 min. The reaction was quenched by the addition of 1 mL water to obtain [18F]PPY1 with a radiochemical yield of 78 ± 7% (non-isolated, n = 6, radio-TLC). [18F]PPY1 was isolated via semi-preparative RP-HPLC (Figure 6A) with a retention time of about 36 min, which was required to separate the radiotracer from the highly A2AR affine by-product PPY22 (Table 1) produced by protodeboronation of the precursor 6 and identified by HPLC analysis of the reaction mixture co-eluted with PPY22. The final purification and concentration proceeded smoothly by loading the isolated fractions on a pre-conditioned RP-SPE cartridge and subsequent elution of [18F]PPY1 with absolute ethanol. For biological investigation, the ethanolic solution containing [18F]PPY1 was reduced under a gentle argon stream at 70 °C, DMSO was added for better solubility and [18F]PPY1 was finally formulated in isotonic saline containing < 10% of both EtOH and DMSO (v/v), respectively. Starting with activities ranging from 1–3 GBq, [18F]PPY1 was successfully obtained with a radiochemical yield of 52 ± 7% (n = 5, end of bombardment = EOB), a high radiochemical purity (≥99%) and molar activities in the range of 90–227 GBq/µmol (end of synthesis = EOS) in a total synthesis time of about 148 ± 8 min. Radio-HPLC analysis of the final product under co-elution with the corresponding reference compound PPY1 confirmed the identity of the radiotracer (Figure 6B).
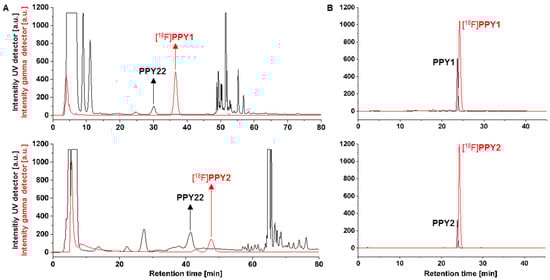
Figure 6.
(A) Representative radio- and UV-chromatograms obtained for isolation of [18F]PPY1 [ReproSil-GOLD 120 C18 column (250 × 10 mm), 34% MeCN/H2O, flow rate: 4 mL/min] and [18F]PPY2 [ReproSil-Pur 120 C18-AQ column (250 × 10 mm), 30% MeCN/H2O, flow rate: 5 mL/min] by semi-preparative RP-HPLC (PPY22 = by-product); (B) radio- and UV-chromatograms of formulated [18F]PPY1 and [18F]PPY2 co-injected with the corresponding reference compound PPY1 or PPY2 [ReproSil-GOLD 120 C18 column (250 × 4.6 mm), 10–90–10% MeCN/H2O, flow rate: 1 mL/min].
The radiosynthesis of [18F]PPY2 was performed by an alcohol-enhanced copper-mediated radiofluorination of boronic acid pinacol ester 7 as optimized for the radiosynthesis of [18F]PPY1 with minor modifications (Scheme 2). The amount of precursor and the reaction time had to be increased due to the low radiochemical yield of [18F]PPY2, which is likely to be caused by the steric hinderance at the ortho-position (3 mg/10 min: 8%, 5 mg/ 15 min: 12%, radio-TLC). Furthermore, the amount of n-BuOH was decreased to a n-BuOH-to-DMA ratio of 1:4 to prevent distortion of the peak shape during isolation of the radiotracer by semi-preparative RP-HPLC (Figure 6A). Starting with activities ranging from 2–4 GBq, [18F]PPY2 was successfully obtained with a radiochemical yield of 12 ± 4% (n = 3, EOB), a high radiochemical purity (≥ 99%) and molar activities in the range of 50–80 GBq/µmol (EOS) in a total synthesis time of about 147 ± 17 min. Further attempts to increase the yield were not performed since [18F]PPY2 was obtained in sufficiently high activity for biological investigation. Radio-HPLC analysis of the final product under co-elution with the corresponding reference compound PPY2 confirmed the identity of the radiotracer (Figure 6B).
Stability of [18F]PPY1 and [18F]PPY2 was proven in all tested media (saline, PBS and n-octanol) at 37 °C up to 60 min. The distribution coefficient (LogD7.4) in the n-octanol-PBS system was experimentally determined by the shake-flask method. Observing LogD7.4 values of 1.59 ± 0.15 (n = 3) and 2.01 ± 0.16 (n = 3) for [18F]PPY1 and [18F]PPY2, respectively, we assume that a significant passive diffusion through the BBB can be expected for both radiotracers [41,58,59].
2.4. Metabolite Analysis
Radiometabolite analysis of [18F]PPY1 and [18F]PPY2 was performed for plasma and brain at 30 min after radiotracer injection into CD-1 mice (n = 2, respectively). Recovery efficiencies of extracted activity were 82–93% and 95–98%, for plasma and brain homogenates, respectively. A high amount of radiometabolites was detected in plasma with only 13% and 21% of total activity corresponding to intact [18F]PPY1 and [18F]PPY2 (Figure 7B). In brain samples, 76% and 83% of total activity represented intact [18F]PPY1 and [18F]PPY2 (Figure 7A). One major hydrophilic metabolite ([18F]M1, tR = 3 min) was detected in brain, which might be a result of N-debenzylation as previously reported in an in vivo study of vipadenant [43]. The possible pathway could be explained by the metabolic degradation of the 18F-bearing benzyl group and formation of [18F]fluorobenzaldehyde [18F]8, that is converted to [18F]fluorobenzoic acid [18F]9, which is then metabolized to [18F]fluorobenzoyl-CoA [18F]10 and [18F]fluorobenzoglycine [18F]11 (Scheme 3). It is known that [18F]9 and [18F]10 are able to cross the BBB and might limit the applicability of [18F]PPY1 and [18F]PPY2 for PET imaging and quantification of the A2AR in the brain.
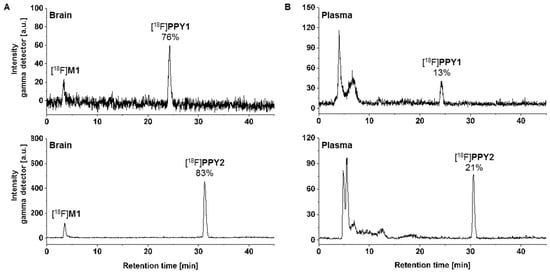
Figure 7.
In vivo metabolism study in CD-1 mice: Representative radio-chromatograms of extracted (A) brain and (B) plasma samples at 30 min p.i. of [18F]PPY1 [ReproSil-GOLD 120 C18 column (250 × 4.6 mm, 5 µm), 10-90-10% MeCN/H2O, flow rate: 1 mL/min] and [18F]PPY2 [ReproSil-Pur 120 C18-AQ column (250 × 4.6 mm, 5 µm) 10–90–10% MeCN/H2O, flow rate: 1 mL/min].
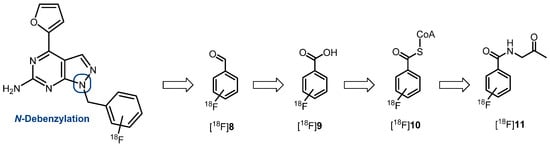
Scheme 3.
Possible radiometabolites of [18F]PPY1 and [18F]PPY2 and suggested metabolic pathway from [18F]fluorobenzaldehyde [18F]8 to [18F]fluorobenzoglycine [18F]11 [43,58].
2.5. Autoradiography Study
The in vitro autoradiography studies were performed to determine the distribution of [18F]PPY1 and [18F]PPY2 in mouse brain (Figure 8). For [18F]PPY1, displaceable binding was detected in various brain regions. The radiotracer binds to the striatum, an A2AR-rich region, as well as to A2AR-poor regions, such as cerebellum, periaqueductal gray, thalamus and cerebral cortex. In contrast to [18F]PPY1, the highest binding of [18F]PPY2 was observed in the striatum. Competition experiments with the selected A2AR antagonist ZM241385 revealed that 42% and 62% of total binding of [18F]PPY1 and [18F]PPY2, respectively, could be displaced in striatum. A maximum receptor density (Bmax) value of 430 fmol/mg wet weight in mouse striatum was described by using [3H]ZM241385 [59]. As a general rule, the Kd value of a PET radiotracer should be 5–10 times lower than the Bmax value and, thus, the affinity of [18F]PPY1 and [18F]PPY2 might probably be sufficient to clearly visualize the A2AR in the brain [60]. The non-specific binding of [18F]PPY1 as well as [18F]PPY2 is presumably not related to significant binding to the A1R (Table 1), but to other off-targets.
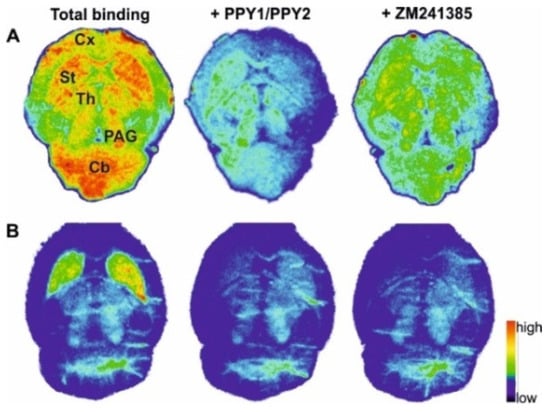
Figure 8.
Representative autoradiographic images of the transversal plane of mouse brain slices representing total binding of (A) [18F]PPY1 and (B) [18F]PPY2. Non-specific binding is depicted in the presence of either 1 µM PPY1, PPY2 or ZM241385. Abbreviations: Cb—cerebellum; Cx—cortex; PAG—periaqueductal gray; St—striatum; Th—thalamus.
2.6. PET Studies
The initial brain uptake of [18F]PPY1 and [18F]PPY2 in CD1-mice was rather high with a standardized uptake value (SUV) of 1.2–1.4 between 2 and 3 min, respectively, indicating a significant BBB permeability of the radiotracers. The striatum (A2AR-rich region) and the cerebellum (A2AR-poor region) shared similar kinetics i.e., an initial uptake of ~1.3 SUV followed by a fast washout (Figure 9A) for both radiotracers, presuming a lack of specific binding. The maximum SUV ratio of striatum-to-cerebellum of 1.5 and 1.3 was achieved after only 4 min for [18F]PPY1 and [18F]PPY2, respectively, indicative of their lack of selectivity. Although this result is not surprising for [18F]PPY1 given its lack of specific binding already in vitro, [18F]PPY2 shows the same characteristic in vivo, despite its better in vitro qualities and compliance with the Lipinski’s rule of five [61] (Figure 9B). Several factors in vivo may be responsible for this discrepancy, such as the presence of radiometabolites contributing to a lower specific-to-non-specific binding ratio in vivo compared to in vitro findings, an insufficient free fraction due to plasma protein binding, or a potential efflux by the permeability-glycoprotein (P-gp). Although the initial uptake value is in favor of a first passage of the BBB, the fast washout may reflect a P-gp transportation, which is likely to happen also in higher species [62,63]. Furthermore, the insufficient selective binding of [18F]PPY1 could be related to a higher Kd value in mice compared to human not in compliance with the above-mentioned rule (Bmax/Kd > 10). Organ distribution analysis displayed a low radiotracer uptake in the heart, spleen, stomach and, to a lesser extent, in the liver (initial SUV < 3), while an accumulation occurred in the small intestine (SUV60 min 21.9 and 6.7 for [18F]PPY1 and [18F]PPY2, respectively) and the bladder (SUV60 min 8.2 and 18.5 for [18F]PPY1 and [18F]PPY2, respectively) indicating excretion via the hepatobiliary and the urinary pathways (Figure 9C).
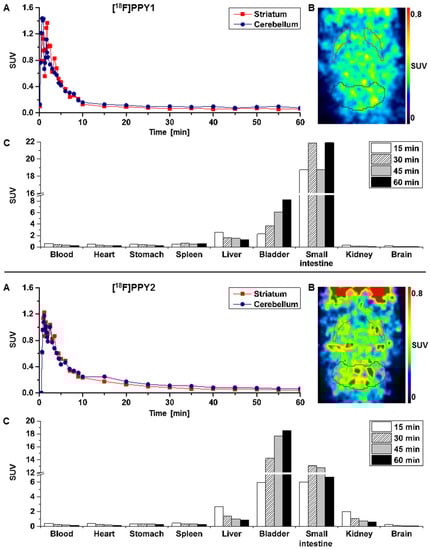
Figure 9.
(A) Time–activity curves with SUVs for striatum and cerebellum; (B) Representative horizontal PET images (0–10 min) after injection of [18F]PPY1 and [18F]PPY2 in CD-1 mice (n = 2, respectively). (C) Biodistribution of [18F]PPY1 and [18F]PPY2 at different time points based on PET imaging (n = 1 and n = 2, respectively).
3. Materials and Methods
3.1. General Information
All chemicals and reagents were purchased from commercially available sources and used without further purification. Moisture-sensitive reactions were conducted under dry argon with oven-dried glassware and anhydrous solvents. Reaction progress was monitored by thin-layer chromatography (TLC) using Alugram® SIL G/UV254 pre-coated plates (Macherey-Nagel, Düren, Germany). The spots were identified by using an UV lamp or by dipping the plates into a potassium permanganate solution (3 g KMnO4, 20 g K2CO3, 0.25 mL glacial acid, 300 mL water). For purification of products flash column chromatography was used with silica gel 40–63 μm from VWR International Chemicals (Darmstadt, Germany). The purity of all the tested compounds was ≥95% as determined by an LC-MS system including a DAD detector [Dionex Ultimate 3000 system incorporating a LPG-3400SD pump, a WPS-3000 TSL autosampler, a TCC-3000SD column compartment, a DAD 3000 diode array detector and a MSQ Plus low resolution mass spectrometer (Thermo Fisher Scientific Inc., Waltham, MA, USA), column: Reprosil-Pur Basic HD (150 × 3 mm; 3 µm; Dr. Maisch GmbH, Ammerbuch, Germany), gradient: 10–90–10% MeCN/ 20 mM NH4OAcaq. (v/v), run time: 15 min, flow rate: 0.6 mL/min, UV-detection: 254 nm]. 1H-, 13C- and 19F-NMR spectra were recorded on VARIAN Mercury plus (300 MHz for 1H-NMR, 75 MHz for 13C-NMR, 282 MHz for 19F-NMR; Agilent Technologies, Palo Alto, CA, USA) and BRUKER DRX-400 (400 MHz for 1H-NMR, 100 MHz for 13C-NMR, 377 MHz for 19F-NMR; Bruker, Billerica, MA, USA); chemical shifts (δ) in parts per million (ppm) are related to internal tetramethylsilane and coupling constants (J) are given with 0.1 Hz (see Supporting information, Figure S2–S45). High resolution mass spectra (HRFT-MS) were recorded on a FT-ICR APEX II spectrometer (Bruker Daltonics, Bruker Corporation, Billerica, MA, USA) using electrospray ionization (ESI).
3.2. Chemical Synthesis
3.2.1. Synthesis of 4-(furan-2-yl)-1H-pyrazolo[3,4-d]pyrimidin-6-amine (3)
The synthesis was performed as described by Gillespie et al. [39,40] with minor modifications: Phosphoryl chloride (8 eq) was cooled to 0 °C and then, absolute DMF (2.5 eq) was added dropwise over a 20 min period. Afterwards, 2-amino-6-hydroxy-pyrimidin-4(3H)-one 1 (1 eq) was added over 20 min at RT. The reaction mixture was stirred at 90 °C for 3 h. The solution was cooled to RT and poured into 500 mL ice water. The mixture was refrigerated overnight and the precipitate was filtered and dried to provide 2-amino-4-chloro-6-oxo-1,6-dihydropyrimidine-5-carbaldehyde 1 as colorless solid, which was used directly in the next step. A solution of the aldehyde 1 (1 eq) in THF was treated with triethylamine (1.05 eq) and anhydrous hydrazine (1 eq) was added dropwise over 25 min. The reaction mixture was stirred at RT for 1 h. After the addition of water, the precipitate was filtered and the filtrate was evaporated to remove about 80% of THF under reduced pressure. Water was additionally added to the mixture and the resulting precipitate was filtered and dried under vacuum. The solid was then dissolved in a minimum of hot DMF and precipitated by the addition of water to provide 4-chloro-1H-pyrazolo[3,4-d]pyrimidin-6-amine 2 as colorless solid which was used directly in the next step. To a solution of 2 (1 eq) in DMF were added 2-(tributylstannyl)-furan (1 eq) and bis(triphenylphos-phine)palladium(II) dichloride (PdCl2(PPh3)2, 0.05 eq) under argon. The resulting mixture was stirred at 90 °C overnight and, then, the solvent was removed by rotatory evaporation. The remaining residue was dissolved in ethyl acetate (EA) and filtered over celite, which was washed with a mixture of EA and water (1:1, v/v). The aqueous solution was extracted with EA and the combined organic phases were washed with brine, dried over anhydrous Na2SO4, filtered and evaporated to dryness. The crude product was purified by flash chromatography (silica, gradient CH2Cl2/MeOH 1:0 → 98:2 → 96:4 → 94:6 → 92:8 → 9:1) to give 3 (57% over 3 steps) as yellow solid. TLC (EA/petrolether (PE), 1:1): Rf = 0.1; 1H-NMR (400 MHz, CDCl3): δ = 13.02 (s, 1H, NH), 8.22 (d, J = 1.3 Hz, 1H, 1), 8.04 (dd, J = 0.8, 1.8 Hz, 1H, 4), 7.41 (dd, J = 0.8, 3.5 Hz, 1H, 2), 6.76 (dd, J = 1.8, 3.5 Hz, 1H, 3), 6.74 (s, NH2); 13C-NMR (101 MHz, CDCl3): δ = 162.50, 158.24, 152.13, 150.48, 146.94, 134.31, 114.06, 113.12, 102.29.
3.2.2. General Procedure A
To a solution of the corresponding (hetero)arene bromide (1 eq, 0.25 mmol) in 1 mL DMF were added compound 3 (50 mg, 1 eq, 0.25 mmol) and potassium carbonate (3 eq, 0.75 mmol). The reaction mixture was stirred overnight at RT. After the addition of 20 mL water, the aqueous phase was extracted with EA (3 × 20 mL) and the combined organic phases were washed with brine (20 mL), dried over anhydrous MgSO4, filtered and evaporated to dryness. The crude product was purified by flash chromatography (silica, gradient EA/PE 1:2 → 1.5:2 → 1:1) to afford the corresponding fluorinated derivative as yellow solid.
1-(4-Fluorobenzyl)-4-(furan-2-yl)-1H-pyrazolo[3,4-d]pyrimidin-6-amine (PPY1): yield: 60%; TLC (EA/PE, 1:1): Rf = 0.23; LC-MS: tR = 9.9 min, >99%; 1H-NMR (400 MHz, CDCl3): δ = 8.30 (s, 1H), 7.85–7.61 (m, 2H), 7.32 (dd, J = 5.4, 8.5 Hz, 2H), 7.00 (t, J = 8.7 Hz, 2H), 6.69-6.63 (m, 1H), 5.68 (s, NH2), 5.43 (s, 2H); 19F-NMR (377 MHz, CDCl3): δ = −114,32; 13C-NMR (101 MHz, CDCl3): δ = 162.59 (d, J = 246.4 Hz), 159.95, 155.79, 147.18, 147.03, 146.89, 135.54, 132.26 (d, J = 3.0 Hz), 129.92 (d, J = 8.2 Hz, 2C), 116.79, 115.76 (d, J = 21.6 Hz, 2C), 113.25, 103.75, 49.66; HRFT-MS (ESI+): m/z = 309.1022 (calcd. 309.1026 for [M]+).
1-(2-Fluorobenzyl)-4-(furan-2-yl)-1H-pyrazolo[3,4-d]pyrimidin-6-amine (PPY2): yield: 51%; TLC (EA/PE, 1:1): Rf = 0.33; LC-MS: tR = 9.9 min, >99%; 1H-NMR (400 MHz, CDCl3): δ = 8.32 (s, 1H), 7.86-7.59 (m, 2H), 7.32–7.21 (m, 2H), 7.18–7.02 (m, 3H), 6.70–6.62 (m, 1H), 5.79–5.33 (m, 4H); 19F-NMR (377 MHz, CDCl3): δ = −118,23; 13C-NMR (101 MHz, CDCl3): δ = 160.62 (d, J = 247.6 Hz), 160.16, 156.17, 150.65, 147.61, 147.11, 135.60, 129.91 (d, J = 8.5 Hz), 129.85 (d, J = 13.0 Hz), 124.45 (d, J = 3.5 Hz), 123.65 (d, J = 15.6 Hz), 115.66 (d, J = 21.2 Hz), 117.79, 113.19, 103.70, 43.90; HRFT-MS (ESI+): m/z = 309.1026 (calcd. 309.1026 for [M]+).
1-(3-Fluorobenzyl)-4-(furan-2-yl)-1H-pyrazolo[3,4-d]pyrimidin-6-amine (PPY3): yield: 38%; TLC (EA/PE, 1:1): Rf = 0.27; LC-MS: tR = 9.9 min, >99%; 1H-NMR (400 MHz, CDCl3): δ = 8.29 (s, 1H), 7.74 (d, J = 1.7 Hz, 1H), 7.56 (s, 1H), 7.31–7.22 (m, 1H), 7.08 (d, J = 1.2, 7.7 Hz, 1H), 7.02–6.90 (m, 2H), 6.64 (dd, J = 1.7, 3.6 Hz, 1H), 5.67–5.31 (m, 4H); 19F-NMR (377 MHz, CDCl3): δ = −112.56; 13C-NMR (101 MHz, CDCl3): δ = 163.04 (d, J = 246.6 Hz), 160.91, 156.16, 146.65, 143.02, 139.14 (d, J = 7.3 Hz), 135.29, 130.36 (d, J = 8.2 Hz), 123.49 (d, J = 2.8 Hz), 115.57, 115.03 (d, J = 2.7 Hz), 114.81 (d, J = 1.0 Hz), 112.95, 103.90, 77.48, 49.67; HRFT-MS (ESI+): m/z = 309.1024 (calcd. 309.1026 for [M]+).
1-((2-Fluoropyridin-3-yl)methyl)-4-(furan-2-yl)-1H-pyrazolo[3,4-d]pyrimidin-6-amine (PPY4): yield: 62%; TLC (EA/PE, 1:1): Rf = 0.21; LC-MS: tR = 8.8 min, >99%;1H-NMR (400 MHz, CDCl3): δ = 8.32 (s, 1H), 8.14 (dt, J = 5.0, 1.4 Hz, 1H), 7.83–7.71 (m, 1H), 7.56 (s, 1H), 7.47 (ddd, J = 9.5, 7.4, 1.9 Hz, 1H), 7.11 (ddd, J = 7.1, 4.9, 1.7 Hz, 1H), 6.66 (dd, J = 3.6, 1.7 Hz, 1H), 5.60–5.20 (m, 4H); 19F-NMR (377 MHz, CDCl3): δ = −71.66; 13C-NMR (101 MHz, CDCl3): δ = 161.12 (d, J = 239.6 Hz), 156.49, 154.42, 147.12 (d, J = 14.4 Hz), 146.74, 140.19 (d, J = 4.7 Hz), 138.74, 135.71, 131.00, 121.79 (d, J = 4.4 Hz), 119.00 (d, J = 29.2 Hz), 115.83, 113.05, 103.84, 43.62; HRFT-MS (ESI+): m/z = 311.1053 (calcd. 311.1057 for [M+H]+).
1-((6-Fluoropyridin-3-yl)methyl)-4-(furan-2-yl)-1H-pyrazolo[3,4-d]pyrimidin-6-amine (PPY5): yield: 73%; LC-MS: tR = 8.7 min, >99%; 1H-NMR (400 MHz, CDCl3): δ = 8.37–8.20 (m, 2H), 7.87–7.59 (m, 3H), 6.88 (dd, J = 8.5, 2.9 Hz, 1H), 6.67 (dd, J = 3.7, 1.7 Hz, 1H), 5.46 (s, 2H); 19F-NMR (377 MHz, CDCl3): δ = −68.63; 13C-NMR (101 MHz, CDCl3): δ = 160.92 (d, J = 247.2 Hz), 155.77, 153.58, 147.46 (d, J = 15.1 Hz), 147.12, 143.38, 141.23 (d, J = 8.0 Hz), 137.30, 135.69, 129.74 (d, J = 5.4 Hz), 113.95, 113.12, 109.67 (d, J = 37.6 Hz), 103.63, 46.91; HRFT-MS (ESI+): m/z = 311.1053 (calcd. 311.1057 for [M+H]+).
1-((6-Fluoropyridin-2-yl)methyl)-4-(furan-2-yl)-1H-pyrazolo[3,4-d]pyrimidin-6-amine (PPY6): yield: 54%; TLC (EA/PE, 1:1): Rf = 0.27; LC-MS: tR = 8.8 min, >97%; 1H-NMR (400 MHz, CDCl3): δ = 8.35 (s, 1H), 7.76 (s, 1H), 7.69 (q, J = 7.9 Hz, 1H), 7.57 (s, 1H), 6.81 (td, J = 6.9, 5.6, 2.4 Hz, 2H), 6.66 (dd, J = 3.6, 1.7 Hz, 1H), 5.65–5.26 (m, 4H); 19F-NMR (377 MHz, CDCl3): δ = −66.81; 13C-NMR (101 MHz, CDCl3): δ = 163.30 (d, J = 241.0 Hz), 161.08, 156.63, 155.61 (d, J = 13.7 Hz), 150.61, 146.77, 146.71, 141.98 (d, J = 7.7 Hz), 135.68, 118.70 (d, J = 4.0 Hz), 115.66, 113.03, 108.55 (d, J = 36.7 Hz), 103.87, 50.97; HRFT-MS (ESI+): m/z = 311.1054 (calcd. 311.1057 for [M+H]+).
1-((2-Fluoropyridin-4-yl)methyl)-4-(furan-2-yl)-1H-pyrazolo[3,4-d]pyrimidin-6-amine (PPY7): yield: 53%; TLC (EA/PE, 1:1): Rf = 0.18; LC-MS: tR = 8.8 min, >99; 1H-NMR (400 MHz, CDCl3): δ = 8.36 (s, 1H), 8.16 (d, J = 5.2 Hz, 1H), 7.90–7.59 (m, 2H), 7.06 (d, J = 5.1 Hz, 1H), 6.76 (s, 1H), 6.69 (s, 1H), 5.92–5.28 (m, 4H); 19F-NMR (377 MHz, CDCl3): δ = −67.20; 13C-NMR (101 MHz, CDCl3): δ = 164.24 (d, J = 239.5 Hz), 160.27, 160.09, 156.32, 151.17 (d, J = 10.6 Hz), 148.24 (d, J = 15.2 Hz), 147.39, 140.95, 136.21, 120.22 (d, J = 4.1 Hz), 117.00, 113.37, 108.41 (d, J = 38.3 Hz), 103.63, 48.73; HRFT-MS (ESI+): m/z = 311.1054 (calcd. 311.1057 for [M+H]+).
1-(4-Bromo-2-fluorobenzyl)-4-(furan-2-yl)-1H-pyrazolo[3,4-d]pyrimidin-6-amine (PPY8): yield: 44%; LC-MS: tR = 10.7 min, >99%; 1H-NMR (400 MHz, CDCl3): δ = 8.28 (s, 1H), 7.73 (d, J = 1.8 Hz, 1H), 7.44 (d, J = 3.5 Hz, 1H), 7.31-7.22 (m, 1H), 7.19 (dd, J = 8.3, 1.9 Hz, 1H), 6.98 (t, J = 8.1 Hz, 1H), 6.63 (dd, J = 3.6, 1.8 Hz, 1H), 5.48 (s, 2H), 5.38 (s, NH2); 19F-NMR (377 MHz, CDCl3): δ = −115.35; 13C-NMR (101 MHz, CDCl3): δ = 161.56, 160.30 (d, J = 252.1 Hz), 156.43, 151.91, 151.16, 146.32, 135.25, 131.02 (d, J = 4.4 Hz), 127.77 (d, J = 3.7 Hz), 123.21 (d, J = 14.8 Hz), 122.09 (d, J = 9.4 Hz), 119.30 (d, J = 24.5 Hz), 114.82, 112.78, 103.96, 43.34; HRFT-MS (ESI+): m/z = 388.0202 (calcd. 388.0209 for [M+H]+).
1-(2-Bromo-4-fluorobenzyl)-4-(furan-2-yl)-1H-pyrazolo[3,4-d]pyrimidin-6-amine (PPY9): yield: 54%; TLC (EA/PE, 1:1): Rf = 0.52; LC-MS: tR = 10.7 min, >99%; 1H-NMR (500 MHz, CDCl3): δ = 8.33 (s, 1H), 7.76 (d, J = 1.7 Hz, 1H), 7.55 (s, 1H), 7.34 (dd, J = 2.6, 8.1 Hz, 1H), 6.93 (td, J = 2.6, 8.3 Hz, 1H), 6.84 (dd, J = 5.9, 8.7 Hz, 1H), 6.66 (dd, J = 1.7, 3.6 Hz, 1H), 5.54 (s, 2H), 5.40 (s, NH2); 19F-NMR (282 MHz, CDCl3): δ = −112.80; 13C-NMR (101 MHz, CDCl3): δ = 161.74 (d, J = 250.6 Hz), 161.35, 156.47, 151.77, 151.02, 146.18, 135.20, 131.97 (d, J = 3.5 Hz), 129.85 (d, J = 8.6 Hz), 122.63 (d, J = 9.6 Hz), 120.06 (d, J = 24.6 Hz), 114.75 (d, J = 21.1 Hz), 114.68, 112.65, 103.77, 49.32; HRFT-MS (ESI+): m/z = 388.0200 (calcd. 388.0209 for [M+H]+).
1-(3-Bromo-5-fluorobenzyl)-4-(furan-2-yl)-1H-pyrazolo[3,4-d]pyrimidin-6-amine (PPY10): yield: 56%; TLC (EA/PE, 1:1): Rf = 0.52; LC-MS: tR = 10.8 min, >99%; 1H-NMR (400 MHz, CDCl3): δ = 8.31 (s, 1H), 7.84–7.69 (m, 1H), 7.57 (s, 1H), 7.25 (s, 1H), 7.15 (dt, J = 2.1, 8.1 Hz, 1H), 6.94 (dt, J = 1.8, 9.0 Hz, 1H), 6.66 (dd, J = 1.7, 3.6 Hz, 1H), 5.49-5.12 (m, 4H); 19F-NMR (282 MHz, CDCl3): δ = −110.10; 13C-NMR (101 MHz, CDCl3): δ = 162.81 (d, J = 251.5 Hz), 158.35, 156.24, 146.67, 142.30, 140.57, 135.58 (d, J = 2.4 Hz), 128.20, 126.82 (d, J = 3.0 Hz), 122.97 (d, J = 9.8 Hz), 118.74 (d, J = 24.5 Hz), 114.02 (d, J = 22.1 Hz), 113.01, 111.81, 103.92, 49.14; HRFT-MS (ESI+): m/z = 388.0199 (calcd. 388.0209 for [M+H]+).
1-(2-Bromo-6-fluorobenzyl)-4-(furan-2-yl)-1H-pyrazolo[3,4-d]pyrimidin-6-amine (PPY11): yield: 51%; LC-MS: tR = 10.3 min, >95%; 1H-NMR (400 MHz, CDCl3): δ = 8.22 (s, 1H), 7.71 (dd, J = 1.7, 0.8 Hz, 1H), 7.48 (s, 1H), 7.41 (dt, J = 8.0, 1.1 Hz, 1H), 7.20 (td, J = 8.2, 5.9 Hz, 1H), 7.08 (t, J = 9.4, 8.3, 1.2 Hz, 1H), 6.62 (dd, J = 3.6, 1.7 Hz, 1H), 5.61 (s, 2H), 5.45 (s, 2H); 19F-NMR (282 MHz, CDCl3): δ = −111.58; 13C-NMR (101 MHz, CDCl3): δ = 162.16 (d, J = 252.7 Hz), 160.91, 156.29, 151.68, 150.73, 146.35, 135.12, 130.85 (d, J = 9.4 Hz), 128.99 (d, J = 3.4 Hz), 125.93 (d, J = 4.0 Hz), 123.59 (d, J = 16.4 Hz), 115.10 (d, J = 22.6 Hz), 115.05, 112.78, 103.78, 43.71; HRFT-MS (ESI+): m/z = 388.0202 (calcd. 388.0209 for [M+H]+).
2-((6-Amino-4-(furan-2-yl)-1H-pyrazolo[3,4-d]pyrimidin-1-yl)methyl)-5-fluoro-benzonitrile (PPY12): yield: 65%; TLC (EA/PE, 1:1): Rf = 0.38; LC-MS: tR = 9.8 min, >98%; 1H-NMR (400 MHz, CDCl3): δ = 8.30 (s, 1H), 7.73 (d, J = 1.7 Hz, 1H), 7.39 (d, J = 3.2 Hz, 1H), 7.37 (d, J = 2.8 Hz, 1H), 7.23–7.09 (m, 2H,), 6.63 (dd, J = 1.8, 3.5 Hz, 1H), 5.67 (s, 2H), 5.29 (s, NH2); 19F-NMR (377 MHz, CDCl3): δ = −111.834; 13C-NMR (101 MHz, CDCl3): δ = 161.40 (d, J = 250.4 Hz), 161.78, 156.61, 152.10, 151.54, 146.07, 136.52 (d, J = 3.6 Hz), 135.38, 130.67 (d, J = 8.5 Hz), 120.76 (d, J = 21.3 Hz), 119.66 (d, J = 24.8 Hz), 116.06, 116.04, 114.34, 113.02, 112.97 (d, J = 9.4 Hz), 103.87, 47.25; HRFT-MS (ESI+): m/z = 335.1051 (calcd. 335.1057 for [M+H]+).
4-((6-Amino-4-(furan-2-yl)-1H-pyrazolo[3,4-d]pyrimidin-1-yl)methyl)-3-fluoro-benzonitrile (PPY13): yield: 77%; TLC (EA/PE, 1:1): Rf = 0.38; LC-MS: tR = 9.7 min, >98%; 1H-NMR (400 MHz, CDCl3): δ = 8.32 (s, 1H), 7.76 (d, J = 1.7 Hz, 1H), 7.69-7.49 (m, 1H), 7.39 (dd, J = 7.9, 2.6 Hz, 1H), 7.25-7.11 (m, 2H), 6.66 (dd, J 3.6, 1.7 Hz, 1H), 5.67 (s, 2H), 5.38 (s, NH2); 19F-NMR (377 MHz, CDCl3): δ = −111.64; 13C-NMR (101 MHz, CDCl3): δ = 161.59 (d, J = 250.6 Hz), 161.11, 156.54, 146.73, 146.71, 136.40 (d, J = 3.1 Hz), 135.85, 131.82, 130.89 (d, J = 8.3 Hz), 120.92 (d, J = 21.4 Hz), 119.85 (d, J = 24.9 Hz), 116.15 (d, J = 2.8 Hz), 115.65, 113.79, 113.21 (d, J = 9.2 Hz), 113.01, 103.84, 77.48, 77.16, 76.84, 47.48; HRFT-MS (ESI+): m/z = 335.1047 (calcd. 335.1057 for [M+H]+).
3-((6-Amino-4-(furan-2-yl)-1H-pyrazolo[3,4-d]pyrimidin-1-yl)methyl)-5-fluoro-benzonitrile (PPY14): yield: 85%; TLC (EA/PE, 1:1): Rf = 0.38; LC-MS: tR = 9.7 min, >99%; 1H-NMR (500 MHz, CDCl3): δ = 8.31 (s, 1H), 7.75 (s, 1H), 7.49 (s, 1H), 7.39 (t, J = 1.4 Hz, 1H), 7.28 (d, J = 1.5 Hz, 1H), 7.26-7.23 (m, 1H), 6.65 (dd, J = 1.8, 3.6 Hz, 1H), 5.48 (s, 1H), 5.32 (s, NH2); 19F-NMR (282 MHz, CDCl3): δ = −109.05 (t, J = 8.4 Hz); 13C-NMR (101 MHz, CDCl3): δ = 162.46 (d, J = 251.3 Hz), 161.51, 156.42, 146.55, 141.19 (d, J = 6.5 Hz), 139.68, 135.69, 127.49 (d, J = 3.3 Hz), 125.68 (d, J = 21.9 Hz), 118.65 (d, J = 24.7 Hz), 117.43 (d, J = 3.1 Hz), 115.31, 114.32 (d, J = 9.8 Hz), 112.91, 103.99, 77.48, 48.91; HRFT-MS (ESI+): m/z = 335.1049 (calcd. 335.1057 for [M+H]+).
2-((6-Amino-4-(furan-2-yl)-1H-pyrazolo[3,4-d]pyrimidin-1-yl)methyl)-3-fluoro-benzonitrile (PPY15): yield: 59%; TLC (EA/PE, 1:1): Rf = 0.38; LC-MS: tR = 9.4 min, >99%; 1H-NMR (300 MHz, CDCl3): δ = 8.24 (s, 1H), 7.72 (d, J = 1.7 Hz, 1H), 7.58-7.27 (m, 4H), 6.63 (dd, J = 3.6, 1.8 Hz, 1H), 5.68 (s, 2H), 5.41 (s, NH2); 19F-NMR (282 MHz, CDCl3): δ = −112.33 (dd, J = 9.3, 5.1 Hz); 13C-NMR (75 MHz, CDCl3): δ = 161.40 (d, J = 252.4 Hz), 161.24, 156.56, 151.72, 150.78, 146.36, 135.45, 130.81 (d, J = 9.0 Hz), 129.41 (d, J = 3.7 Hz), 126.82 (d, J = 17.5 Hz), 120.79 (d, J = 22.0 Hz), 116.43 (d, J = 4.0 Hz), 115.54 (d, J = 5.4 Hz), 114.98, 112.80, 103.82, 42.43; HRFT-MS (ESI+): m/z = 335.1049 (calcd. 335.1057 for [M+H]+).
1-(3-(2-Fluoroethyl)benzyl)-4-(furan-2-yl)-1H-yrazolo[3,4-d]pyrimidin-6-amine (PPY16): yield: 51%; LC-MS: tR = 10.0 min, >99%; 1H-NMR (400 MHz, CDCl3): δ = 8.27 (s, 1H), 7.77-7.65 (m, 1H), 7.43 (d, J = 3.5 Hz, 2H), 7.34-7.11 (m, 4H), 6.63 (dd, J = 3.5, 1.7 Hz, 1H), 5.46 (s, 2H), 5.33 (s, NH2), 4.59 (dt, J = 47.1, 6.6 Hz, 2H), 2.97 (dt, J = 23.0, 6.6 Hz, 2H); 19F-NMR (282 MHz, CDCl3): δ = −114.63; 13C-NMR (75 MHz, CDCl3): δ = 146.42, 145.93, 137.69 (d, J = 6.3 Hz), 137.06, 134.99, 129.82 (d, J = 8.1 Hz), 129.46, 129.04, 128.75, 128.58, 127.60 (d, J = 13.3 Hz), 126.37, 115.83, 112.84, 104.01, 84.07 (d, J = 169.0 Hz), 50.14, 36.93 (d, J = 20.4 Hz) HRFT-MS (ESI+): m/z = 338.1412 (calcd. 338.1417 for [M+H]+).
1-(3-(2-Fluoroethoxy)benzyl)-4-(furan-2-yl)-1H-pyrazolo[3,4-d]pyrimidin-6-amine (PPY17): yield: 54%; LC-MS: tR = 9.8 min, >99%; 1H-NMR (400 MHz, CDCl3): δ = 8.27 (s, 1H), 7.73 (dd, J = 1.7, 0.8 Hz, 1H), 7.48 (s, 1H), 7.23 (t, J = 7.9 Hz, 1H), 6.97-6.78 (m, 3H), 6.64 (dd, J = 3.6, 1.8 Hz, 1H), 5.64-5.14 (m, 4H), 4.84-4.57 (m, 2H), 4.27-4.05 (m, 2H); 19F-NMR (377 MHz, CDCl3): δ = −223.92; 13C-NMR (101 MHz, CDCl3): δ = 161.27, 158.78, 156.17, 151.79, 150.85, 146.36, 138.48, 134.96, 129.94, 120.82, 115.01, 114.30, 113.99, 112.81, 104.03, 81.98 (d, J = 170.8 Hz), 67.17 (d, J = 20.6 Hz), 50.08; HRFT-MS (ESI+): m/z = 354.1316 (calcd. 354.1366 for [M+H]+).
1-(3-(3-Fluoropropoxy)benzyl)-4-(furan-2-yl)-1H-pyrazolo[3,4-d]pyrimidin-6-amine (PPY18): yield: 61%; LC-MS: tR = 11.0 min, >95%; 1H-NMR (400 MHz, CDCl3): δ = 8.36 (s, 1H), 7.81-7.74 (m, 1H), 7.46 (d, J = 8.8 Hz, 1H), 7.38 (dd, J = 8.6, 5.4 Hz, 2H), 6.98 (t, J = 8.7 Hz, 1H), 6.70 (d, J = 3.0 Hz, 1H), 6.37 (d, J = 3.0 Hz, 1H), 5.53 (s, 2H), 4.65-4.46 (m, 4H), 3.93 (t, J = 6.1 Hz, 2H), 2.06 (dt, J = 26.1, 5.9 Hz, 2H); 19F-NMR (377 MHz, CDCl3): δ = −114.61; 13C-NMR (101 MHz, CDCl3): δ = 163.75, 161.30, 159.14, 156.07, 151.66, 146.43, 135.03, 132.57 (d, J = 3.1 Hz), 129.83 (d, J = 8.2 Hz), 120.41, 115.69 (d, J = 21.6 Hz), 115.09, 114.03 (d, J = 33.8 Hz), 112.84, 104.03, 80.86 (d, J = 164.4 Hz), 63.57 (d, J = 5.1 Hz), 49.52, 30.12 (d, J = 57.4 Hz); LRFT-MS (ESI+): m/z = 406.29 (calcd. 406.11 for [M+K]+).
1-(2-Fluorophenethyl)-4-(furan-2-yl)-1H-pyrazolo[3,4-d]pyrimidin-6-amine (PPY19): yield: 45%; TLC (EA/PE, 1:1): Rf = 0.46; LC-MS: tR = 10.1 min, >99%; 1H-NMR (400 MHz, CDCl3): δ = 8.24 (s, 1H), 7.73 (dd, J = 0.8, 1.7 Hz, 1H), 7.54 (s, 1H), 7.20-7.13 (m, 1H), 7.10-6.87 (m, 3H), 6.63 (dd, J = 1.7, 3.5 Hz, 1H), 5.28 (s, NH2), 4.61-4.48 (m, 2H), 3.25 (t, J = 7.4 Hz, 2H); 19F-NMR (377 MHz, CDCl3): δ = −118.28; 13C-NMR (101 MHz, CDCl3): δ = 161.52 (d, J = 245.5 Hz), 161.02, 156.02, 151.83, 150.65, 146.23, 134.40, 131.18 (d, J = 5.1 Hz), 128.57 (d, J = 8.1 Hz), 125.22 (d, J = 15.9 Hz), 124.12 (d, J = 3.5 Hz), 115.39 (d, J = 21.9 Hz), 114.78, 112.76, 103.97, 46.51, 29.42; HRFT-MS (ESI+): m/z = 324.1281 (calcd. 324.1261 for [M+H]+).
1-Benzyl-4-(furan-2-yl)-1H-pyrazolo[3,4-d]pyrimidin-6-amine (PPY22): yield: 79%; TLC (EA/PE, 1:1): Rf = 0.47; LC-MS: tR = 9.8 min, >97%; 1H-NMR (400 MHz, CDCl3): δ = 8.23 (s, 1H), 7.68 (d, J = 1.7 Hz, 1H), 7.43-7.14 (m, 6H), 6.58 (dd, J = 1.8, 3.6 Hz, 1H), 5.44 (s, 2H), 5.36 (s, NH2); 13C-NMR (101 MHz, CDCl3): δ = 161.60, 156.23, 152.11, 151.17, 146.12, 136.89, 134.76, 128.78 (2C), 127.92 (2C), 127.86, 114.50, 112.67, 104.10, 50.18; HRFT-MS (ESI+): m/z = 292.1189 (calcd. 292.1198 for [M+H]+).
3.2.3. General Procedure B
The corresponding fluoro benzoic acid (1.1 eq, 0.28 mmol), (benzotriazol-1-yloxy)tris- (dimethylamino)phosphonium hexafluorophosphate (BOP, 1.3 eq, 0.33 mmol) and triethylamine (3 eq, 0.75 mmol) were dissolved in CH2Cl2 (3 mL) and stirred at RT for 30 min. After the addition of compound 3 (50 mg, 1 eq, 0.25 mmol), the reaction mixture was stirred overnight at RT. The solvent was removed by rotatory evaporation and the remaining residue was dissolved in EA (10 mL). After addition of 50 mL saturated NaHCO3 solution, the aqueous phase was extracted with EA (3x20 mL) and the combined organic phases were washed with brine (20 mL), dried over anhydrous MgSO4, filtered and evaporated to dryness. The crude product was purified by flash chromatography (silica, gradient EA/PE 1:2 → 1:1) to afford the corresponding fluorinated derivative as yellow solid.
(6-Amino-4-(furan-2-yl)-1H-pyrazolo[3,4-d]pyrimidin-1-yl)(2-fluorophenyl)-methanone (PPY20): yield: 82%; TLC (EA/PE, 1:1): Rf = 0.54; LC-MS: tR = 9.4 min, >99%; 1H-NMR (400 MHz, DMF-d7): δ = 8.55 (s, 1H), 8.12 (d, J = 1.7 Hz, 1H), 7.83 (td, J = 1.8, 7.2 Hz, 1H), 7.73 (tdd, J = 1.8, 5.4, 7.5 Hz, 1H), 7.60 (s, NH2), 7.52 (dd, J = 0.8, 3.5 Hz, 1H), 7.47-7.38 (m, 2H), 6.85 (dd, J = 1.7, 3.6 Hz, 1H); 19F-NMR (377 MHz, DMF-d7): δ = −71.93 (d, J = 709.3 Hz); 13C-NMR (75 MHz, DMF d7): δ = 165.28, 163.91 (d, J = 133.6 Hz), 163.35, 160.78, 152.66, 152.33, 148.33, 140.21, 135.41 (d, J = 6.3 Hz), 134.63 (d, J = 8.7 Hz), 131.62 (d, J = 2.4 Hz), 125.49 (d, J = 3.5 Hz), 116.86 (d, J = 21.3 Hz), 113.88, 105.02; HRFT-MS (ESI+): m/z = 346.0715 (calcd. 346.0716 for [M+Na]+).
(6-Amino-4-(furan-2-yl)-1H-pyrazolo[3,4-d]pyrimidin-1-yl)(2-fluorophenyl)-methanone (PPY21): yield: 59%; TLC (EA/PE, 1:1): Rf = 0.54; LC-MS: tR = 9.8 min, >99%; 1H-NMR (300 MHz, DMF-d7): δ = 8.58 (s, 1H), 8.20-8.11 (m, 3H), 7.62-7.37 (m, 5H), 6.86 (dd, J = 1.7, 3.5 Hz, 1H); 19F-NMR (282 MHz, DMF-d7): δ = −71.79 (d, J = 709.4 Hz); 13C-NMR (101 MHz, DMF d7): δ = 166.68, 165.00 (d, J = 164.0 Hz), 164.44, 160.53, 152.08, 151.57, 147.52, 138.68, 134.21 (d, J = 9.4 Hz, 2C), 130.32 (d, J = 2.3 Hz), 115.42 (d, J = 22.3 Hz, 2C), 114.68, 113.13, 104.14; HRFT-MS (ESI+): m/z = 324,0892 (calcd. 324.0897 for [M+Na]+).
3.2.4. General Procedure C
To a solution of the corresponding bromomethyl-phenylboronic acid pinacol ester (1 eq, 0.5 mmol) in 1 mL DMF were added compound 3 (100 mg, 1 eq, 0.5 mmol) and potassium carbonate (3 eq, 1.5 mmol). The reaction mixture was then stirred overnight at RT. After evaporation to dryness, the crude product was purified by flash chromatography (silica, gradient EA/PE 1:2 → 1.5:2 → 1:1) to afford the corresponding precursor as tan solid.
4-(Furan-2-yl)-1-(4-(4,4,5,5-tetramethyl-1,3,2-dioxaborolan-2-yl)benzyl)-1H-pyrazolo[3,4-d]pyrimidin-6-amine (6): yield: 38%; TLC (EA/PE, 1:1): Rf = 0.62; 1H-NMR (400 MHz, CDCl3): δ = 8.25 (s, 1H), 7.79-7.65 (m, 3H), 7.38 (d, J = 3.5 Hz, 1H), 7.29 (d, J = 7.7 Hz, 2H), 6.62 (dd, J = 1.8, 3.6 Hz, 1H), 5.49 (s, 2H), 5.19 (s, NH2), 1.31 (s, 12H); 13C-NMR (101 MHz, CDCl3): δ = 161.73, 156.30, 152.33, 151.43, 149.32, 146.01, 139.93, 135.27 (2C), 134.69, 127.24 (2C), 114.22, 112.63, 104.18, 83.90, 77.48, 77.16, 76.84, 50.26 (2C), 24.97 (4C).
4-(Furan-2-yl)-1-(2-(4,4,5,5-tetramethyl-1,3,2-dioxaborolan-2-yl)benzyl)-1H-pyrazolo[3,4-d]pyrimidin-6-amine (7): yield: 60%; TLC (EA/PE, 1:1): Rf = 0.62; 1H-NMR (400 MHz, CDCl3): δ = 8.31 (s, 1H), 7.87 (dd, J = 1.6, 7.3 Hz, 1H), 7.73 (dd, J = 0.8, 1.8 Hz, 1H), 7.45 (d, J = 3.4 Hz, 1H), 7.33-7.18 (m, 3H), 6.69-6.61 (m, 2H), 5.86 (s, 2H), 5.44 (s, NH2), 1.36 (s, 12H); 13C-NMR (101 MHz, CDCl3): δ = 161.44, 156.50, 152.08, 150.97, 146.14, 143.21, 136.34, 136.22, 134.63, 131.45, 126.67, 126.33, 114.57, 112.71, 104.02, 83.97 (2C), 49.90, 25.06 (4C).
3.3. Docking Stimulation
Molecular docking studies were carried out using GOLD (Genetic Optimization for Ligand Docking) 5.5 program from Cambridge Crystallographic Data Center (CCDC, Cambridge, UK). GOLD uses a genetic algorithm for docking ligands into protein binding sites to explore the full range of ligand conformational flexibility with partial flexibility of the active site of the protein. The X-ray crystallographic chimeric protein structure of A2AR-BRIL in complex with the antagonist ZM241385 (PDB ID: 4EIY) was considered for the purpose of docking stimulation. Among the several other crystal structures in the Protein Data Bank (PDB), this structure was particularly selected due to the highest resolution of all available non-thermostabilized structures. The A2AR protein was prepared by using the protein preparation wizard tool implemented in the GOLD software that removes all water molecules and adds hydrogen atoms to the protein structure. After the definition of the active site with a 4 Å radius around the ligand ZM241385 present in the orthosteric binding site of the A2AR, ZM241385 was removed from the protein structure. The ligand preparation was carried out in CambridgeSoft Chem3D 17.0 program (PerkinElmer, Waltham, MA, USA). The energy of each compound was minimized by using the MM2 force field method. A total of ten docking runs were performed per structure and the early termination step was activated if the first three poses have a root-mean-square deviation (RMSD) value of less than 1.5 Å. Other parameters were set as default. After docking, the individual binding poses of each compound were observed and their molecular interactions within the active site were evaluated. The program Discovery Studio 2017 from BIOVIA® (San Diego, CA, USA) was used to visualize the key aspects of the docking results from GOLD.3.4. Radiosynthesis.
3.4. Radiosynthesis
3.4.1. Preparation [18F]TBAF Complex
No carrier added (n.c.a.) [18F]fluoride was produced via the [18O(p,n)18F] nuclear reaction by irradiation of an [18O]H2O target (Hyox 18 enriched water, Rotem Industries Ltd., Mishor Yamin, Israel) on a Cyclone 18/9 (iba RadioPharma Solutions, Louvain-la-Neuve, Belgium) with fixed energy proton beam using Nirta [18F]fluoride XL target. N.c.a. [18F]fluoride in 1.0 mL of water was trapped on a Sep-Pak Accell Plus QMA Carbonate Plus light cartridge (Waters GmbH, Eschborn, Germany). Then, the activity was eluted with a mixture of 300 µL water and 10 μL of an aqueous tetrabutylammonium hydrogen carbonate solution (TBAHCO3, 0.075 M) in a conical 4 mL vial with 1 mL MeCN. The aqueous [18F]fluoride was azeotropically dried under vacuum and nitrogen flow within 7–10 min using a CEM Discover PETwave Microwave (75 W, at 50–60 °C, power cycling mode, CEM GmbH, Kamp-Lintfort, Germany). Two aliquots of anhydrous MeCN (2 × 1 mL) were added during the drying procedure.
3.4.2. Radiosynthesis of [18F]PPY1
The [18F]TBAF complex was dissolved in 200 µL n-BuOH. Cu(OTf)2(py)4 (4.9 mg in 100 µL DMA) was added and the mixture was stirred at RT for 5 min. Afterwards, the boronic acid pinacol ester precursor 6 (3 mg) in 300 µL DMA was added and the reaction mixture was heated at 110 °C for 10 min. The reaction was cooled to RT, quenched by the addition of 1 mL water and injected onto a semi-preparative RP-HPLC system (ReproSil-GOLD 120 C18 column (250 × 10 mm, particles size 10 µm), 34% MeCN/H2O, flow rate: 4 mL/min). The fractions containing [18F]PPY1 were collected and diluted with water to a total volume of 40 mL. Thereafter, the solution was passed through a preconditioned Sep Pak® C18 Plus cartridge (5 mL EtOH, 60 mL H2O, Waters GmbH, Eschborn, Germany), washed with 2 mL water and 2 mL 10% EtOH/H2O (v/v), and [18F]PPY1 was subsequently eluted with 1.5 mL absolute ethanol. After addition of 30 µL DMSO, the solvent was reduced under a stream of nitrogen at 70 °C (up to approx. 50 μL) and [18F]PPY1 was formulated in sterile isotonic saline up to a final concentration of <10% of both EtOH and DMSO (v/v), respectively. Radiochemical and chemical purities were assessed by radio-TLC and analytical HPLC. Molar activities were determined based on aliquots taken from the formulated radiotracer solution, the mass determination for the corresponding reference standard was performed via a calibration curve obtained under the same analytical HPLC conditions (see quality control section).
3.4.3. Radiosynthesis of [18F]PPY2
The [18F]TBAF complex was dissolved in 140 µL n-BuOH and 60 µL DMA. Cu(OTf)2(py)4 (8.1 mg in 100 µL DMA) was added and the mixture was stirred at RT for 5 min. Afterwards, the boronic acid pinacol ester precursor 7 (5 mg) in 400 µL DMA was added and the reaction mixture was heated at 110 °C for 15 min. The reaction was cooled to RT, quenched by the addition of 1 mL water and injected onto a semi-preparative RP-HPLC [ReproSil-Pur 120 C18-AQ column (250 × 10 mm, particle size: 5 µm; Dr. Maisch HPLC GmbH, Ammerbuch-Entringen, Germany), 30% MeCN/H2O, flow rate: 5 mL/min]. The fractions containing [18F]PPY2 were collected and diluted with water to a total volume of 40 mL. Thereafter, the solution was passed through a preconditioned Sep Pak® C18 Plus cartridge (5 mL EtOH, 60 mL H2O, Waters GmbH, Eschborn, Germany), washed with 2 mL water and 2 mL 10% EtOH/H2O (v/v), and [18F]PPY2 was subsequently eluted with 1.5 mL absolute ethanol. After the addition of 30 µL DMSO, the solvent was reduced under a stream of nitrogen at 70 °C (approx. 50 μL), and [18F]PPY2 was formulated in sterile isotonic saline up to a final concentration of <10% of both EtOH and DMSO (v/v), respectively. Radiochemical and chemical purities were assessed by radio-TLC and analytical HPLC. Molar activities were determined based on aliquots taken from the formulated radiotracer solution, and the mass determination for the corresponding reference standard was performed via a calibration curve obtained under the same analytical HPLC conditions (see quality control section).
3.5. Quality Control
Radio-TLC was performed on silica gel (Polygram® SIL G/UV254, Roth, Germany) pre-coated plates with a mixture of EA/PE 1/4 (v/v) as eluent. The plates were exposed to storage phosphor screens (BAS-IP MS 2025; FUJIFILM Co., Saitama, Japan) and recorded using the Amersham Typhoon RGB Biomolecular Imager (GE Healthcare Life Sciences). Images were quantified with the ImageQuant TL8.1 software (GE Healthcare Life Sciences, Solingen, Germany). HPLC analysis were performed on a JASCO LC-2000 system (Jasco Deutschland GmbH, Pfungstadt, Germany), incorporating a PU-2080Plus pump (Jasco Deutschland GmbH, Pfungstadt, Germany), AS-2055Plus auto injector (100 μL sample loop, Jasco Deutschland GmbH, Pfungstadt, Germany), and a UV-2070Plus detector coupled with a gamma radioactivity HPLC detector (Gabi Star, raytest Isotopenmessgeräte GmbH, Staubenhardt, Germany) and RP-HPLC columns (Dr. Maisch HPLC GmbH, Ammerbruch, Germany). Data analysis was performed with the Galaxie chromatography software (Agilent Technologies, Palo Alto, CA, USA). [18F]PPY1: ReproSil-GOLD 120 C18 column (250 × 4.6 mm, particle size 5 µm), eluent: MeCN/H2O, gradient mode (0–5′ 10% MeCN, 5–30′ up to 90% MeCN, 30–35′ 90% MeCN, 35–40′ up to 10% MeCN, 40–45 min 10% MeCN), flow rate: 1 mL/min, UV-detection: 254 nm. [18F]PPY2: Reprosil-Pur 120 C18-AQ column (250 × 4.6 mm; particle size: 5 µm), further conditions as for [18F]PPY1. The molar activities were determined on the basis of a calibration curve carried out under isocratic HPLC conditions (0.04–20 µg PPY1 or PPY2, 34% MeCN/H2O, analytical ReproSil-GOLD 120 C18 column) using chromatograms obtained at 240 nm as the maximum of UV absorbance.
3.6. In Vitro Stability and Lipophilicity (LogD7.4)
The chemical stability of [18F]PPY1 and [18F]PPY2 was investigated in isotonic saline, phosphate-buffered saline (PBS, pH 7.4) and n-octanol by incubation at 37 °C. Samples were taken at 15, 30 and 60 min of incubation time and analyzed by radio-TLC and radio-HPLC. LogD7.4 values of [18F]PPY1 and of [18F]PPY2 were experimentally determined in n-octanol/PBS at RT by the shake-flask method [64]. The measurements were performed in triplicate.
3.7. Biological Evaluation
All experimental work including the use of animals has been conducted in accordance with the national legislation on the use of animals for research (Tierschutzgesetz (TierSchG), Tierschutz-Versuchstierverordnung (TierSchVersV)) and were approved by the Animal Care and Use Committee of Saxony (TVV 18/18 Landesdirektion Sachsen; DE24.1-5131/446/19; 20 June 2018). All animal experiments were performed with female CD-1 mice (10–12 weeks, 26–38 g) obtained from the Medizinisch-Experimentelles Zentrum (MEZ) at Universität Leipzig (Leipzig; Germany).
3.8. In Vitro Binding Assays
CHO-K1 cells stably transfected with the human A1R or A2AR, a donation from Prof. Karl-Norbert Klotz (Institute of Pharmacology and Toxicology; Universität Würzburg; Würzburg; Germany), were cultured in DMEM/F12 medium supplemented with 15 mM HEPES, 10% FCS, 1% L-Glutamine, 1% Penicillin/Streptomycin, and G418 as selective antibody at 0.2 mg/mL at 5% CO2 and 37 °C. Cells were harvested by scraping followed by centrifugation (800 rpm, 5 min), and the resulting pellet incubated in 50 mM TRIS-HCl, pH 7.4, on ice for 20 min. The crude membrane homogenate was obtained by centrifugation (15,000 rpm; 30 min, 4 °C), suspended in 50 mM TRIS-HCl, pH 7.4, and stored at −25 °C. Membrane suspension was incubated with the A2AR-specific [3H]ZM241385 (American Radiolabelled Chemicals Inc., St. Louis, MO, USA; ART0884; Am = 1.851 TBq/mmol) (Ki(hA2AR) = 0.8 nM); or the A1-specific [3H]DPCPX (PerkinElmer, Waltham, MA, USA; NET974250UC, Am = 6.068 TBq/mmol) (Ki(hA1R) = 0.45 nM); the test compound at different concentrations in buffer at RT. Non-specific binding was determined by co-incubation with 10 μM ZM241385 or 1 μM DPCPX. The IC50 values were determined by non-linear regression analysis with GraphPad Prism 4.1 (GraphPad Inc., La Jolla, CA, USA), and Ki values were estimated according to the Cheng-Prusoff equation with KD,ZM241385(hA2AR) = 0.8 nM and KD,DPCPX(hA1R) = 0.45 nM.
3.9. In Vitro Autoradiography
Brains of CD-1 mice frozen in isopentane were cut using a cryostat, thaw-mounted onto microscope slides, and after air-drying stored at −80 °C until use. Briefly, the brain sections were dried in a stream of cold air, and pre-incubated in 50 mM TRIS-HCl buffer (pH 7.4, 100 mM NaCl, 5 mM MgCl2, 1 mM EDTA) containing 1 µU/mL adenosine deaminase (ADA) for 15 min at RT. Afterwards, brain sections were incubated with 0.24 MBq/mL of [18F]PPY1 (0.2 nM) or 0.26 MBq/mL of [18F]PPY2 (5.1 nM) in buffer for 90 min at RT. Non-specific binding was determined in the presence of 10 µM ZM241385. Displacement of both radiotracers was evaluated with 10 µM PPY1 and PPY2, respectively. Subsequently, the sections were washed twice for 5 min in ice-cold TRIS-HCl buffer, and dipped for 5 s in ice-cold deionized water. The sections were rapidly dried in a stream of cold air before being exposed overnight on an imaging plate. Developed autoradiographs were analyzed in a phosphor imager (HD-CR 35, Duerr NDT GmbH, Bietigheim-Bissingen, Germany). Quantification was performed by using 2D-densitometric analysis (AIDA 2.31 software, raytest Isotopenmessgeräte GmbH, Straubenhardt, Germany). Further data analysis was performed with GraphPad Prism 4.1 (GraphPad Inc., La Jolla, CA, USA).
3.10. In Vivo Metabolism
The radiotracer was administered i.v. as bolus in awake CD-1 mice (40 MBq [18F]PPY1; 30 MBq [18F]PPY2; n = 2, respectively). At 30 min post injection (p.i.), blood samples were taken retroorbitally from the anesthetized animals. Plasma was separated by centrifugation at 8000 rpm at RT for 1 min (Centrifuge 5418, Eppendorf Vertrieb Deutschland GmbH, Wesseling-Berzdorf, Germany), and brain homogenized in 1 mL water on ice (10 strokes of a PTFE plunge at 1000 rpm in a borosilicate glass cylinder; Potter S Homogenizer; B. Braun Melsungen AG, Melsungen, Germany). For protein precipitation and extraction an ice-cold mixture of acetone/water (4/1; v/v) was used in a ratio of 4:1 (v/v) of solvent to plasma or brain homogenate, respectively. The samples were vortexed for 3 min, equilibrated on ice for 5 min, and centrifuged for 5 min at 10,000 rpm. After separating the supernatant, the precipitates were washed with 100 µL of the solvent mixture and subjected to the same procedure. The combined supernatants were concentrated at 75 °C under nitrogen flow to a final volume of approx. 100 µL and analyzed by analytical radio-HPLC (see section quality control). To determine the percentage of activity in the supernatants compared to total activity, aliquots of each step as well as the precipitates were quantified by a gamma counter (Wallac Wizard 1480; PerkinElmer, Turku, Finland).
3.11. PET Imaging
For the time of the experiments, CD-1 mice were kept in a dedicated climatic chamber with free access to water and food under a 12:12 h dark:light cycle at a constant temperature (24 °C). The animals were anaesthetized (anesthesia unit U-410; agntho’s; Lidingö; Sweden) with isoflurane (1.8%, 0.35 L/min) delivered in a 60% oxygen/40% air mixture (Gas Blender 100 Series, MCQ instruments, Rome, Italy) and maintained at 37 °C with a thermal bed system. The formulated radiotracer was injected into the tail vein ([18F]PPY1: 3.2–4.3 MBq in 150 µL isotonic saline and <1% EtOH/DMSO; Am: 150 GBq/µmol; [18F]PPY2: 4.1–4.9 MBq in 150 µL isotonic saline and <1% EtOH/DMSO; Am: 80 GBq/µmol) followed by a 60 min PET/MR scan (PET/MR 1Tesla; nanoScan®, MEDISO Medical Imaging Systems, Budapest, Hungary). Each PET image was corrected for random coincidences, dead time, scatter and attenuation (AC), based on a whole body (WB) MR scan. The list mode data was sorted into sinograms using a framing scheme of 12 × 10 s, 6 × 30 s, 5 × 300 s, 9 × 600 s. The reconstruction parameters for the list mode data were 3D-ordered subset expectation maximization (OSEM), 4 iterations, 6 subsets, energy window: 400–600 keV, coincidence mode: 1–5, ring difference: 81. The mice were positioned prone in a special mouse bed (heated up to 37 °C), with the head fixed to a mouth piece for the anesthetic gas supply with isoflurane in 40% air and 60% oxygen (anesthesia unit: U-410, agnthos, Lidingö, Sweden; Gas blender: MCQ, Rome, Italy). The PET data were collected by a continuous WB scan during the entire investigation. Following the 60 min PET scan a T1 weighted WB gradient echo sequence (TR/TE: 20/6.4 ms, NEX: 1, FA: 25, FOV: 64 × 64 mm, matrix: 128 × 128, slice thickness: 0.5 mm) was performed for AC and anatomical orientation. Image registration and evaluation of the volume of interest (VOI) was done with PMOD 3.9 (PMOD technologies LLC, Zurich, Switzerland). The respective brain regions were identified using the mouse brain atlas template Ma-Benveniste-Mirrione-FDG. Spherical VOI with diameters of 1 to 2 mm were placed at the center of the liver, stomach, and spleen. Small intestine, kidney, and bladder VOI were delineated from the PET signal. Heart wall and blood were delineated from the T1 weighted image avoiding spill over from neighboring organs. The activity data is expressed as mean SUV of the overall VOI.
4. Conclusions
A series of novel fluorinated pyrazolo[2,3-d]pyrimidine derivatives (PPY1-PPY21) was synthesized to develop an 18F-labeled PET radiotracer for A2AR imaging in the brain by modifying the structure of the recently published lead compound PPY. Among those, the highly affine 4-fluorobenzyl ligand PPY1 and the 2-fluorobenzyl ligand PPY2 were chosen for 18F-labeling. Herein, a new approach was used for the radiosynthesis of [18F]PPY1 and [18F]PPY2 via an alcohol-enhanced copper-mediated one-step radiolabeling strategy starting from the corresponding boronic acid pinacol ester precursors. The in vivo metabolism study revealed 76% and 83% of intact [18F]PPY1 and [18F]PPY2, respectively, in the mouse brain at 30 min after injection. In vitro autoradiography studies using [18F]PPY1 and [18F]PPY2 showed a specific binding in mouse striatum of 42% and 62%, respectively. In vivo PET experiments with CD-1 mice revealed rather high brain uptake of [18F]PPY1 and [18F]PPY2 and a lack of specific binding in striatum, suggesting their unfitness to image the A2AR in the brain. Based on these findings, the lead compound PPY will not consider further derivatization. Our ongoing work is focusing on other promising chemical scaffolds with enhanced in vivo stability and target selectivity to improve the A2AR imaging [65,66].
Supplementary Materials
The following are available online at https://www.mdpi.com/1422-0067/22/5/2285/s1. Figure S1: Proposed reaction mechanism based on the Chan-Evans-Lam coupling for the copper-mediated radiofluorination of an aryl boronic pinacol ester acid precursor, Figure S2-45: 1H-NMR and LC-MS of PPY1-PPY22.
Author Contributions
J.S., W.D.-C., P.B. and R.P.-M. designed the study; T.H.L. and R.-P.M. designed and performed organic syntheses; T.H.L., S.S. and R.-P.M. designed and performed radiosyntheses; T.H.L., S.S., M.T., S.D.-S., M.K., W.D.-C. and P.B. designed and performed in vitro and in vivo studies; M.T., M.K., W.D.-C. and P.B. designed and performed PET/MR studies; T.H.L., S.S., M.T., S.D.-S., M.K., F.-A.L., S.F., W.D.-C., P.B. and R.-P.M. analyzed the data. All authors have read and agreed to the published version of the manuscript.
Funding
This work (Project No. 100226753) was funded by the European Regional Development Fund (ERDF) and Sächsische Aufbaubank (SAB).
Institutional Review Board Statement
The study was conducted according to the national legisla-tion on the use of animals for research (Tierschutzgesetz (TierSchG), Tierschutz-Versuchstierverordnung(TierSchVersV)), and approved by the Animal Care and Use Committee of Saxony (TVV 18/18 Landesdirektion Sachsen; DE24.1-5131/446/19; 20 June 2018).).
Informed Consent Statement
Not applicable.
Data Availability Statement
The data that support the findings of this study are available from the corresponding author upon reasonable request.
Acknowledgments
We thank the staff of the Institute of Analytical Chemistry, Department of Chemistry and Mineralogy of Universität Leipzig (Leipzig; Germany), for NMR and HRFT-MS measurements; Karsten Franke, Helmholtz-Zentrum Dresden-Rossendorf (HZDR) for providing [18F]fluoride; as well as Tina Spalholz, HZDR, for technical assistance.
Conflicts of Interest
A German patent application has been filed with the registration file number DE102017125533. T.H.L. and S.S. are employed by the project partner ROTOP Pharmaka Ltd.
References
- Dunwiddie, T.V.; Masino, S.A. The role and regulation of adenosine in the central nervous system. Annu. Rev. Neurosci. 2001, 24, 31–55. [Google Scholar] [CrossRef]
- Bagheri, S.; Saboury, A.A.; Haertlé, T. Adenosine deaminase inhibition. Int. J. Biol. Macromol. 2019, 141, 1246–1257. [Google Scholar] [CrossRef] [PubMed]
- Pastor-Anglada, M.; Perez-Torras, S. Emerging Roles of Nucleoside Transporters. Front. Pharmacol. 2018, 9, 606. [Google Scholar] [CrossRef] [PubMed]
- Fredholm, B.B.; AP, I.J.; Jacobson, K.A.; Linden, J.; Müller, C.E. International Union of Basic and Clinical Pharmacology. LXXXI. Nomenclature and classification of adenosine receptors—An update. Pharmacol. Rev. 2011, 63, 1–34. [Google Scholar] [CrossRef] [PubMed]
- Sheth, S.; Brito, R.; Mukherjea, D.; Rybak, L.P.; Ramkumar, V. Adenosine receptors: Expression, function and regulation. Int. J. Mol. Sci. 2014, 15, 2024–2052. [Google Scholar] [CrossRef] [PubMed]
- Cunha, R.A. How does adenosine control neuronal dysfunction and neurodegeneration? J. Neurochem. 2016, 139, 1019–1055. [Google Scholar] [CrossRef]
- Liu, Y.J.; Chen, J.; Li, X.; Zhou, X.; Hu, Y.M.; Chu, S.F.; Peng, Y.; Chen, N.H. Research progress on adenosine in central nervous system diseases. CNS Neurosci. Ther. 2019, 25, 899–910. [Google Scholar] [CrossRef]
- Rosin, D.L.; Hettinger, B.D.; Lee, A.; Linden, J. Anatomy of adenosine A2A receptors in brain: Morphological substrates for integration of striatal function. Neurology 2003, 61, S12–S18. [Google Scholar] [CrossRef] [PubMed]
- Schiffmann, S.N.; Fisone, G.; Moresco, R.; Cunha, R.A.; Ferré, S. Adenosine A2A receptors and basal ganglia physiology. Prog. Neurobiol. 2007, 83, 277–292. [Google Scholar] [CrossRef]
- Matos, M.; Augusto, E.; Santos-Rodrigues, A.D.; Schwarzschild, M.A.; Chen, J.F.; Cunha, R.A.; Agostinho, P. Adenosine A2A receptors modulate glutamate uptake in cultured astrocytes and gliosomes. Glia 2012, 60, 702–716. [Google Scholar] [CrossRef] [PubMed]
- Nishizaki, T.; Nagai, K.; Nomura, T.; Tada, H.; Kanno, T.; Tozaki, H.; Li, X.; Kondoh, T.; Kodama, N.; Takahashi, E. A new neuromodulatory pathway with a glial contribution mediated via A2A adenosine receptors. Glia 2002, 39, 133–147. [Google Scholar] [CrossRef]
- Melani, A.; Cipriani, S.; Vannucchi, M.G.; Nosi, D.; Donati, C.; Bruni, P.; Giovannini, M.G.; Pedata, F. Selective adenosine A2A receptor antagonism reduces JNK activation in oligodendrocytes after cerebral ischaemia. Brain 2009, 132, 1480–1495. [Google Scholar] [CrossRef] [PubMed]
- Mills, J.H.; Alabanza, L.; Weksler, B.B.; Couraud, P.-O.; Romero, I.A.; Bynoe, M.S. Human brain endothelial cells are responsive to adenosine receptor activation. Purinergic Signal. 2011, 7, 265–273. [Google Scholar] [CrossRef] [PubMed]
- Fuxe, K.; Ferré, S.; Canals, M.; Torvinen, M.; Terasmaa, A.; Marcellino, D.; Goldberg, S.R.; Staines, W.; Jacobsen, K.X.; Lluis, C. Adenosine A2A and dopamine D2 heteromeric receptor complexes and their function. J. Mol. Neurosci. 2005, 26, 209–220. [Google Scholar] [CrossRef]
- Ferré, S.; Karcz-Kubicha, M.; Hope, B.T.; Popoli, P.; Burgueño, J.; Gutiérrez, M.A.; Casadó, V.; Fuxe, K.; Goldberg, S.R.; Lluis, C. Synergistic interaction between adenosine A2A and glutamate mGlu5 receptors: Implications for striatal neuronal function. Proc. Natl. Acad. Sci. USA 2002, 99, 11940–11945. [Google Scholar] [CrossRef] [PubMed]
- Fuxe, K.; Marcellino, D.; Guidolin, D.; Woods, A.S.; Agnati, L. Brain receptor mosaics and their intramembrane receptor-receptor interactions: Molecular integration in transmission and novel targets for drug development. J. Acupunct. Meridian Stud. 2009, 2, 1–25. [Google Scholar] [CrossRef]
- Ferré, S.; Ciruela, F.; Borycz, J.; Solinas, M.; Quarta, D.; Antoniou, K.; Quiroz, C.; Justinova, Z.; Lluis, C.; Franco, R.; et al. Adenosine A1-A2A receptor heteromers: New targets for caffeine in the brain. Front. Biosci. 2008, 13, 2391–2399. [Google Scholar] [CrossRef]
- Vuorimaa, A.; Rissanen, E.; Airas, L. In vivo PET imaging of adenosine 2A receptors in neuroinflammatory and neurodegenerative disease. Contrast Media Mol. Imaging 2017, 6975841. [Google Scholar] [CrossRef]
- Franco, R.; Navarro, G. Adenosine A2A receptor antagonists in neurodegenerative diseases: Huge potential and huge challenges. Front. Psychiatry 2018, 9, 9. [Google Scholar] [CrossRef]
- Zarrinmayeh, H.; Territo, P.R. Purinergic receptors of the central nervous system: Biology, PET ligands, and their applications. Mol. Imaging 2020, 19, 1536012120927609. [Google Scholar] [CrossRef] [PubMed]
- Graveland, G.; Williams, R.; DiFiglia, M. Evidence for degenerative and regenerative changes in neostriatal spiny neurons in Huntington’s disease. Science 1985, 227, 770–773. [Google Scholar] [CrossRef] [PubMed]
- Glass, M.; Dragunow, M.; Faull, R. The pattern of neurodegeneration in Huntington’s disease: A comparative study of cannabinoid, dopamine, adenosine and GABAA receptor alterations in the human basal ganglia in Huntington’s disease. Neuroscience 2000, 97, 505–519. [Google Scholar] [CrossRef]
- Chou, S.Y.; Lee, Y.C.; Chen, H.M.; Chiang, M.C.; Lai, H.L.; Chang, H.H.; Wu, Y.C.; Sun, C.N.; Chien, C.L.; Lin, Y.S. CGS21680 attenuates symptoms of Huntington’s disease in a transgenic mouse model. J. Neurochem. 2005, 93, 310–320. [Google Scholar] [CrossRef] [PubMed]
- Mievis, S.; Blum, D.; Ledent, C. A2A receptor knockout worsens survival and motor behaviour in a transgenic mouse model of Huntington’s disease. Neurobiol. Dis. 2011, 41, 570–576. [Google Scholar] [CrossRef] [PubMed]
- Li, W.; Silva, H.B.; Real, J.; Wang, Y.-M.; Rial, D.; Li, P.; Payen, M.-P.; Zhou, Y.; Müller, C.E.; Tomé, A.R. Inactivation of adenosine A2A receptors reverses working memory deficits at early stages of Huntington’s disease models. Neurobiol. Dis. 2015, 79, 70–80. [Google Scholar] [CrossRef] [PubMed]
- Ishiwata, K.; Ogi, N.; Hayakawa, N.; Oda, K.; Nagaoka, T.; Toyama, H.; Suzuki, F.; Endo, K.; Tanaka, A.; Senda, M. Adenosine A2A receptor imaging with [11C]KF18446 PET in the rat brain after quinolinic acid lesion: Comparison with the dopamine receptor imaging. Ann. Nucl. Med. 2002, 16, 467–475. [Google Scholar] [CrossRef] [PubMed]
- Cieślak, M.; Wojtczak, A. Role of purinergic receptors in the Alzheimer’s disease. Purinergic Signal. 2018, 14, 331–344. [Google Scholar] [CrossRef]
- Albasanz, J.L.; Perez, S.; Barrachina, M.; Ferrer, I.; Martín, M. Up-regulation of adenosine receptors in the frontal cortex in Alzheimer’s disease. Brain Pathol. 2008, 18, 211–219. [Google Scholar] [CrossRef]
- Canas, P.M.; Porciúncula, L.O.; Cunha, G.M.; Silva, C.G.; Machado, N.J.; Oliveira, J.M.; Oliveira, C.R.; Cunha, R.A. Adenosine A2A receptor blockade prevents synaptotoxicity and memory dysfunction caused by β-amyloid peptides via p38 mitogen-activated protein kinase pathway. J. Neurosci. 2009, 29, 14741–14751. [Google Scholar] [CrossRef]
- Nagpure, B.V.; Bian, J.-S. Hydrogen sulfide inhibits A2A adenosine receptor agonist induced β-amyloid production in SH-SY5Y neuroblastoma cells via a cAMP dependent pathway. PLoS ONE 2014, 9, e88508. [Google Scholar] [CrossRef]
- Jenner, P. A2A antagonists as novel non-dopaminergic therapy for motor dysfunction in PD. Neurology 2003, 61, S32–S38. [Google Scholar] [CrossRef]
- Fuxe, K.; Marcellino, D.; Genedani, S.; Agnati, L. Adenosine A2A receptors, dopamine D2 receptors and their interactions in Parkinson’s disease. Mov. Disord. 2007, 22, 1990–2017. [Google Scholar] [CrossRef] [PubMed]
- Cieślak, M.; Komoszynski, M.; Wojtczak, A. Adenosine A2A receptors in Parkinson’s disease treatment. Purinergic Signal. 2008, 4, 305–312. [Google Scholar] [CrossRef] [PubMed]
- Kondo, T.; Mizuno, Y. A long-term study of istradefylline safety and efficacy in patients with Parkinson disease. Clin. Neuropharmacol. 2015, 38, 41–46. [Google Scholar] [CrossRef]
- Yoritaka, A.; Hattori, N. Differences between Istradefylline Responders and Non-Responders in Parkinson’s Disease. Adv. Park. Dis. 2017, 6, 45–51. [Google Scholar] [CrossRef][Green Version]
- Pinna, A. Adenosine A2A receptor antagonists in Parkinson’s disease: Progress in clinical trials from the newly approved istradefylline to drugs in early development and those already discontinued. CNS Drugs 2014, 28, 455–474. [Google Scholar] [CrossRef]
- Ramlackhansingh, A.; Bose, S.; Ahmed, I.; Turkheimer, F.; Pavese, N.; Brooks, D. Adenosine 2A receptor availability in dyskinetic and nondyskinetic patients with Parkinson disease. Neurology 2011, 76, 1811–1816. [Google Scholar] [CrossRef] [PubMed]
- Barret, O.; Hannestad, J.; Vala, C.; Alagille, D.; Tavares, A.; Laruelle, M.; Jennings, D.; Marek, K.; Russell, D.; Seibyl, J.; et al. Characterization in humans of 18F-MNI-444, a PET radiotracer for brain adenosine 2A receptors. J. Nucl. Med. 2015, 56, 586–591. [Google Scholar] [CrossRef] [PubMed]
- Gillespie, R.J.; Cliffe, I.A.; Dawson, C.E.; Dourish, C.T.; Gaur, S.; Jordan, A.M.; Knight, A.R.; Lerpiniere, J.; Misra, A.; Pratt, R.M.; et al. Antagonists of the human adenosine A2A receptor. Part 3: Design and synthesis of pyrazolo[3,4-d]pyrimidines, pyrrolo[2,3-d]pyrimidines and 6-arylpurines. Bioorg. Med. Chem. Lett. 2008, 18, 2924–2929. [Google Scholar] [CrossRef] [PubMed]
- Gillespie, R.J.; Lerpiniere, J. Pyrrolo[2,3-d]pyrimidine and Their Use as Purinergic Receptor Antagonists. WIPO (PCT) WO/2002/055084, 18 July 2002. Available online: https://patentscope2.wipo.int/search/en/detail.jsf?docId=WO2002055084 (accessed on 12 February 2021).
- Brust, P.; van den Hoff, J.; Steinbach, J. Development of 18F-labeled radiotracers for neuroreceptor imaging with positron emission tomography. Neurosci. Bull. 2014, 30, 777–811. [Google Scholar] [CrossRef] [PubMed]
- Jaakola, V.P.; Griffith, M.T.; Hanson, M.A.; Cherezov, V.; Chien, E.Y.; Lane, J.R.; Ijzerman, A.P.; Stevens, R.C. The 2.6 angstrom crystal structure of a human A2A adenosine receptor bound to an antagonist. Science 2008, 322, 1211–1217. [Google Scholar] [CrossRef]
- Shin, S.H.; Park, M.H.; Byeon, J.J.; Lee, B.I.; Park, Y.; Kim, N.; Choi, J.; Shin, Y.G. Analysis of Vipadenant and its in vitro and in vivo metabolites via liquid chromatography-quadrupole- time-of-flight mass spectrometry. Pharmaceutics 2018, 10, 260. [Google Scholar] [CrossRef] [PubMed]
- Schröder, S.; Wenzel, B.; Deuther-Conrad, W.; Teodoro, R.; Kranz, M.; Scheunemann, M.; Egerland, U.; Hofgen, N.; Briel, D.; Steinbach, J.; et al. Investigation of an 18F-labelled imidazopyridotriazine for molecular imaging of cyclic nucleotide phosphodiesterase 2A. Molecules 2018, 23, 556. [Google Scholar] [CrossRef]
- Kuchar, M.; Mamat, C. Methods to increase the metabolic stability of 18F-radiotracers. Molecules 2015, 20, 16186–16220. [Google Scholar] [CrossRef] [PubMed]
- Hardegger, L.A.; Kuhn, B.; Spinnler, B.; Anselm, L.; Ecabert, R.; Stihle, M.; Gsell, B.; Thoma, R.; Diez, J.; Benz, J. Systematic investigation of halogen bonding in protein–ligand interactions. Angew. Chem. Int. Ed. Engl. 2011, 50, 314–318. [Google Scholar] [CrossRef] [PubMed]
- Jacobson, O.; Kiesewetter, D.O.; Chen, X. Fluorine-18 radiochemistry, labeling strategies and synthetic routes. Bioconjug. Chem. 2015, 26, 1–18. [Google Scholar] [CrossRef] [PubMed]
- Joule, J.A.; Mills, K. Heterocyclic chemistry; John Wiley & Sons: Hoboken, NJ, USA, 2008. [Google Scholar]
- Ichiishi, N.; Brooks, A.F.; Topczewski, J.J.; Rodnick, M.E.; Sanford, M.S.; Scott, P.J. Copper-catalyzed [18F]fluorination of (mesityl)(aryl)iodonium salts. Org. Lett. 2014, 16, 3224–3227. [Google Scholar] [CrossRef] [PubMed]
- Tredwell, M.; Preshlock, S.M.; Taylor, N.J.; Gruber, S.; Huiban, M.; Passchier, J.; Mercier, J.; Genicot, C.; Gouverneur, V. A general copper-mediated nucleophilic 18F-fluorination of arenes. Angew. Chem. Int. Ed. Engl. 2014, 53, 7751–7755. [Google Scholar] [CrossRef]
- Mossine, A.V.; Brooks, A.F.; Makaravage, K.J.; Miller, J.M.; Ichiishi, N.; Sanford, M.S.; Scott, P.J. Synthesis of [18F]arenes via the copper-mediated [18F]fluorination of boronic acids. Org. Lett. 2015, 17, 5780–5783. [Google Scholar] [CrossRef]
- Makaravage, K.J.; Brooks, A.F.; Mossine, A.V.; Sanford, M.S.; Scott, P.J. Copper-mediated radiofluorination of arylstannanes with [18F]KF. Org. Lett. 2016. [Google Scholar] [CrossRef] [PubMed]
- Preshlock, S.; Calderwood, S.; Verhoog, S.; Tredwell, M.; Huiban, M.; Hienzsch, A.; Gruber, S.; Wilson, T.C.; Taylor, N.J.; Cailly, T.; et al. Enhanced copper-mediated 18F-fluorination of aryl boronic esters provides eight radiotracers for PET applications. Chem. Commun. 2016, 52, 8361–8364. [Google Scholar] [CrossRef]
- Zlatopolskiy, B.D.; Zischler, J.; Krapf, P.; Zarrad, F.; Urusova, E.A.; Kordys, E.; Endepols, H.; Neumaier, B. Copper-mediated aromatic radiofluorination revisited: Efficient production of PET tracers on a preparative scale. Chemistry 2015, 21, 5972–5979. [Google Scholar] [CrossRef]
- Zischler, J.; Kolks, N.; Modemann, D.; Neumaier, B.; Zlatopolskiy, B.D. Alcohol-enhanced Cu-mediated radiofluorination. Chemistry 2017, 23, 3251–3256. [Google Scholar] [CrossRef]
- Vantourout, J.C.; Miras, H.N.; Isidro-Llobet, A.; Sproules, S.; Watson, A.J. Spectroscopic studies of the Chan–Lam amination: A mechanism-inspired solution to boronic ester reactivity. J. Am. Chem. Soc. 2017, 139, 4769–4779. [Google Scholar] [CrossRef] [PubMed]
- Ye, Y.; Sanford, M.S. Mild copper-mediated fluorination of aryl stannanes and aryl trifluoroborates. J. Am. Chem. Soc. 2013, 135, 4648–4651. [Google Scholar] [CrossRef] [PubMed]
- Carson, R.E.; Wu, Y.; Lang, L.; Ma, Y.; Der, M.G.; Herscovitch, P.; Eckelman, W.C. Brain uptake of the acid metabolites of F-18-labeled WAY 100635 analogs. J. Cereb. Blood Flow Metab. 2003, 23, 249–260. [Google Scholar] [CrossRef]
- Sihver, W.; Schulze, A.; Wutz, W.; Stusgen, S.; Olsson, R.A.; Bier, D.; Holschbach, M.H. Autoradiographic comparison of in vitro binding characteristics of various tritiated adenosine A2A receptor ligands in rat, mouse and pig brain and first ex vivo results. Eur. J. Pharmacol. 2009, 616, 107–114. [Google Scholar] [CrossRef] [PubMed]
- Schröder, S.; Lai, T.H.; Toussaint, M.; Kranz, M.; Chovsepian, A.; Shang, Q.; Dukić-Stefanović, S.; Deuther-Conrad, W.; Teodoro, R.; Wenzel, B. PET imaging of the adenosine A2A receptor in the Rotenone-based mouse model of Parkinson’s disease with [18F]FESCH synthesized by a simplified two-step one-pot radiolabeling strategy. Molecules 2020, 25, 1633. [Google Scholar] [CrossRef]
- Lipinski, C.A.; Lombardo, F.; Dominy, B.W.; Feeney, P.J. Experimental and computational approaches to estimate solubility and permeability in drug discovery and development settings. Adv. Drug Deliv. Rev. 2001, 46, 3–26. [Google Scholar] [CrossRef]
- Syvanen, S.; Lindhe, O.; Palner, M.; Kornum, B.R.; Rahman, O.; Langstrom, B.; Knudsen, G.M.; Hammarlund-Udenaes, M. Species differences in blood-brain barrier transport of three positron emission tomography radioligands with emphasis on P-glycoprotein transport. Drug Metab. Dispos. 2009, 37, 635–643. [Google Scholar] [CrossRef] [PubMed]
- Auvity, S.; Caille, F.; Marie, S.; Wimberley, C.; Bauer, M.; Langer, O.; Buvat, I.; Goutal, S.; Tournier, N. P-glycoprotein (ABCB1) inhibits the influx and increases the efflux of 11C-metoclopramide across the blood-brain barrier: A PET study on nonhuman primates. J. Nucl. Med. 2018, 59, 1609–1615. [Google Scholar] [CrossRef] [PubMed]
- Waterhouse, R. Determination of lipophilicity and its use as a predictor of blood-brain barrier penetration of molecular imaging agents. Mol. Imaging Biol. 2003, 5, 376–389. [Google Scholar] [CrossRef]
- Lai, T.H.; Toussaint, M.; Teodoro, R.; Dukić-Stefanović, S.; Kranz, M.; Deuther-Conrad, W.; Moldovan, R.-P.; Brust, P. Synthesis and biological evaluation of a novel 18F-labeled radiotracer for PET imaging of the adenosine A2A receptor. Int. J. Mol. Sci. 2021, 22, 1182. [Google Scholar] [CrossRef] [PubMed]
- Lai, T.H.; Toussaint, M.; Teodoro, R.; Dukić-Stefanović, S.; Gündel, D.; Ludwig, F.-A.; Wenzel, B.; Schröder, S.; Sattler, B.; Moldovan, R.-P.; et al. Improved in vivo PET imaging of the adenosine A2A receptor in the brain using [18F]FLUDA, a deuterated radiotracer with high metabolic stability. Eur. J. Nucl. Med. Mol. Imaging 2021. [Google Scholar] [CrossRef] [PubMed]


Publisher’s Note: MDPI stays neutral with regard to jurisdictional claims in published maps and institutional affiliations. |
© 2021 by the authors. Licensee MDPI, Basel, Switzerland. This article is an open access article distributed under the terms and conditions of the Creative Commons Attribution (CC BY) license (http://creativecommons.org/licenses/by/4.0/).