1. Introduction
Due to the energy transition, participation of small decentralized generators (DGs) like photovoltaics, wind turbines, or combined heat and power (CHP) in grid stabilizing tasks in power systems—such as ancillary services—is becoming more important. One way to integrate DGs for ancillary services is energy markets. In general, ancillary service markets can be used for currently existing ancillary services, such as voltage and frequency control and congestion management, but also for emerging ancillary services dealing with harmonics, inertia, and fault contribution. A suitable market can be designed for some of these services, taking into account individual aspects such as costs, timeliness, and grid constraints [
1]. For the latter, market products containing regional information on network topology and hierarchy are becoming increasingly important [
2]. However, single DGs may not be able to participate in such markets as their installed capacity is too small. To overcome this problem, small single DGs can be combined into virtual power plants (VPPs). An aggregator or VPP operator acts as a mediator to the market and thereby offers a product (defined as active power value or energy over a specified time period) on the energy market. If a trade is conducted, the DGs of the VPP will be configured accordingly to fulfill this product. In this context, multi-agent systems (MAS) offer a robust and scalable way of handling the complex optimization of individual DG’s control schedules to achieve the target product. In this paper, each agent in the MAS represents a DG in the VPP. Besides, there is no central coordinating authority. Thus, the system is completely distributed. In the remainder of the paper, we use COHDA [
3] as an exemplary heuristic for the distributed optimization of the virtual power plant. COHDA is a heuristic for a cooperative MAS, which means that the solution-finding process for the optimal schedule is mainly determined by inter-agent message exchange, a so-called negotiation. Here, a solution is found if all agents agree on a common solution. Depending on the optimization problem and VPP configuration, finding a solution may require a large number of message exchanges. In a physically distributed MAS, the message exchange is additionally influenced by the underlying communication infrastructure, mainly in the form of end-to-end communication delays (latencies). These delays of directly exchanged messages between agents accumulate during the negotiation process and may lead to an extension of the negotiation time or a potential reduction of the solution quality. The delay may depend on the following aspects [
4]:
Their data rates characterize the transmission media (cellular radio, DSL, and fiber optics); when transmitting large amounts of data, insufficient data rates have a negative effect on the latency.
The length of the transmission path influences the delay not only via the physical signal propagation rate of the medium, but also via the processing of packets in infrastructure hardware (e.g., routers).
The environment may influence signals: Other radio signals might disturb the signal and cause re-transmission or packet loss.
Infrastructure hardware and transmission media can be congested by excessive traffic, and in the case of routers, packets must be discarded to reduce the load.
The topology of the infrastructure allows for multi-path transmission, which increases transmission rates and reduces the load on routers.
Therefore, the delay in the infrastructure over which the MAS communicates may be influenced by the communication medium and topology, but also by disturbances such as traffic or signal noise leading to a varying duration in MAS negotiations.
In this paper, we analyze the effects of two communication infrastructures on the performance of the MAS: the wireless technologies CDMA 450 and LTE Advanced. For this purpose, we constructed four different communication scenarios: one with undisturbed and three with disturbed communication infrastructures. We integrated these communication scenarios into a communication simulation and extracted the communication delays. These delays were used for the MAS-Simulation where the delay was added to each individual message exchange between agents, leading to an extended negotiation time. The MAS negotiation is used for rescheduling the VPP after a product has been traded on a regionalized ancillary service market to solve transformer congestion. This introduced use case specific requirements that needed to be taken into account, such as timeliness of the MAS, quality of the solution, and regionality. We further experimented with relaxation strategies of the MAS optimization to mitigate violations of use case requirements.
The remainder of the paper is structured as follows. First, we give an overview about related work. Subsequently, we present the underlying use case in more detail: We explain how the market for regionalized ancillary services is designed, describe the applied optimization heuristics (COHDA), and give an overview of the assumed communication infrastructure in distribution grids. This is preceded by a description of the methodology, including the evaluation criteria, the experiment design, and the simulation environment. We then present our results and conclude by discussing them.
2. Related Work
In order to do justice to the distributed character of energy supply, approaches have been proposed for distributed control in form of MAS for different purposes [
5]. In particular, MAS can represent VPP and as such fulfill technical as well as economic requirements to enable integration of DGs in energy markets [
6,
7]. One aspect of reliably providing energy products is continuous rescheduling of DGs. This approach takes into account power outages or deviations of forecasts and therefore makes up for the fluctuating character of DGs [
8]. One particular use case for VPPs is the redispatch in distribution grids. This can either be done by direct activation of the system operator [
9] or be incentivized by an appropriate market [
10]. In this paper, we combine the two approaches: we use a multi-agent solution in order to provide flexibility for regional congestion management. This is realized by rescheduling the initial schedules of the DGs within the VPP.
Using MAS for distributed coordination of DGs highly relies on the communication between the individual agents. Given the increasing connectivity with information and communication technologies (ICT), the basis will be given to enable this communication. Our approach is investigated for technologies suitable for the use case at hand (see
Section 3.3).
In the work of Singh et al. [
11], a MAS was used to control a micro-grid aiming to reduce communication latency by utilizing the distributed nature of MAS. A simulation was conducted with in total 10 agents. The communication system was modeled omitting characteristics of transmission media and infrastructure components, such as routers, switches, or base stations. The study of Frost et al. [
12] is focused on a distributed algorithm which can be used to find an optimal solution of a combinatorial power to solve a demand–supply problem to show robustness of this algorithm towards volatile communication link quality with high delays on physical communication links. The communication was modeled as a small network consisting of three access points and six agents. In Dorsch et al. [
13], a MAS was used to control power flows, handling overloads, and guaranteeing voltage stability while the communication routes were dynamically adapted by a central software-defined networking controller. The results show that the latency of MAS communication could be reduced by this approach while exploiting a better link utilization of the communication system. The framework EPOCHS [
14] introduces an agent framework which is coupled with the communication simulator NS2 and the power system simulators PSCAD/EMTDC and PSLF. Thorp et al. [
15] created an agent-based architecture for differential protection and evaluated this in a scenario of five agents with a simplified communication network.
The aforementioned works look at the MAS communication to learn about its performance and improve it given constraints by the communication system. However, they did not consider infrastructure components, and the evaluation was conducted with rather few agents. Moreover, they do not study the effects of communication disturbances.
In this article, we investigate the effects of disturbances in the communication infrastructure while performing distributed schedule optimization for a regionalized product on an intra-day market. To this end, we model a realistic communication infrastructure and its characteristics. Moreover, we examine the scalability of the MAS under a given communication infrastructure.
3. Use Case: Regional Congestion Management by VPPs
The influence of communication on the MAS has been analyzed based on the use case of delivering a product on the regionalized ancillary service market to solve congestions in the distribution grid. From that, requirements for rescheduling a virtual power plant have been derived. The rescheduling has been implemented with the distributed algorithm COHDA and relevant communication technologies from smart meter connectivity have been used as communication infrastructures. In this paper, these are CDMA 450 and LTE Advanced.
3.1. Regionalized Ancillary Services
As mentioned in
Section 1, the regional ancillary services (rASs) considered in this paper are the provision of flexibility for regional congestion management—especially to solve a transformer congestion between medium and high voltage levels. We assume that the rAS market is implemented as an intra-day spot market of the European EPEX with modifications as in [
16,
17]: The energy products can be traded for blocks of 15 min or one hour. Trading on the intra-day market starts at 3 p. m. the day before delivery and ends at gate closure, which is the following day 5 min before the product has to be delivered. The smallest unit that can typically be traded is 0.1 MW. On this regionalized market, information about the delivery area is added to the product.
The general procedure for products used for, e.g., congestion management, is as follows. The DSO predicts a line or transformer congestion in his grid based on the available information of, e.g., day-ahead market. Congestion may occur in both directions—due to overconsumption or overproduction of energy. The DSO may then place a product on the rAS-market offering (bid) or demanding (ask) energy with the information about the location of the problematic grid area. Market participants (including VPPs) that fulfill the local restriction can balance congestion and thus tender to deliver the product (ask/bid). After a successful market matching, schedules of the participating DGs are adjusted either by increasing (compensating overconsumption) or decreasing (compensating overproduction) the previously planned active power generation. In this work, the market process itself is not simulated, but provides the basis for the discussed problem: a VPP has to allocate the required service to its planned schedules after successful market participation.
3.2. COHDA: A Distributed Heuristic for the Optimized Scheduling of Virtual Power Plants
As described in the previous section, the starting point for optimization is as follows. A VPP consisting of various DGs has successfully been matched to an ask or bid of the DSO on the rAS market. Thus, several DGs have to reschedule, i. e., adjust their schedules to achieve the VPP’s target schedule to fulfill the marketed reduction or increase in energy output. The optimization problem is to find the best possible combination of feasible schedules for the DGs. In doing so, the rAS product must be fulfilled as accurately as possible, while respecting the local restrictions of the DGs.
In this paper, we use the Combinatorial Optimization Heuristic for Distributed Agents (COHDA) as presented in Hinrichs et al. [
3] for the distributed solution of this optimization problem. It was developed for the self-organized planning of distributed energy resources in virtual power plants. Thus, it can serve as an example for fully distributed optimization heuristics suitable for the use case.
Each agent is responsible for the scheduling of one DG. The local constraints and the current state of its asset are represented in a parameterized DG model, which is used for the generation of feasible schedules. A schedule is an operational option of a plant, i.e., how much power is generated at what time, in 15-min resolution. The target schedule of the optimization indicates how much power should be provided in each 15 min interval by the entire VPP. For the VPP to adjust the target schedule, COHDA is used to enable the agents to negotiate a new selection of schedules in a self-organized manner.
In the following, the optimization problem at hand is formalized, using the identifiers presented in
Table 1.
The aim of the optimization is to minimize the deviation from the target schedule for each time interval (Equation (
1) and
Table 1).
This is subject to the constraint that for each agent exactly one schedule must be chosen (Equation (
2)).
At the beginning of a negotiation, at least one agent receives the target operation schedule. The agents aim to find a candidate schedule, comprising one schedule per DG, which matches the target schedule as closely as possible. The agents represent their knowledge in their so-called working memories. These working memories include the target schedule, the currently best-known candidate schedule, and the perceived current system state, meaning the schedule choices of all agents. The agents must exchange their knowledge to improve the candidate schedule. To reduce communication overhead, not all agents communicate with each other. COHDA uses a so-called exchange topology, which implements a reduced communication graph that defines which agents are considered as neighbors and thus directly exchange messages. Here, a small world topology is used [
18] (for a more detailed discussion of different exchange topologies an their impact on COHDA, see in [
19]).
During the negotiation, each agent performs the following three steps in an iterative process:
Perceive: The agent perceivesthe current system state by assessing all newly received messages. This includes the most recent schedule selections of other agents and the best known candidate schedule.
Decide: The agent decides if it changes its own selection. For this purpose, it determines whether the selection of a different schedule in combination with the current choices of other agents leads to an improvement of the global objective function, i.e., the achievement of the target schedule. Additionally, private local objectives can be considered.
Act: The agent acts by sending update messages to its neighbors to pass on new information from its neighbors or to inform about its own changes in schedule selection.
The negotiation terminates if no agent can improve the solution candidate anymore and thus eventually the working memories of all agents are identical. In addition, COHDA has the anytime property, i.e., valid solutions are available shortly after the start of the heuristic and are incrementally improved with additional runtime.
3.3. Communication Infrastructure in Distribution Grids
The distributed scheduling optimization requires intensive information exchange as the agents in the MAS communicate their knowledge to other agents to find an optimal schedule. Thus, a communication infrastructure that provides connectivity between agents is needed. Currently, there is no universal communication infrastructure solution for DGs in distribution grids [
20,
21,
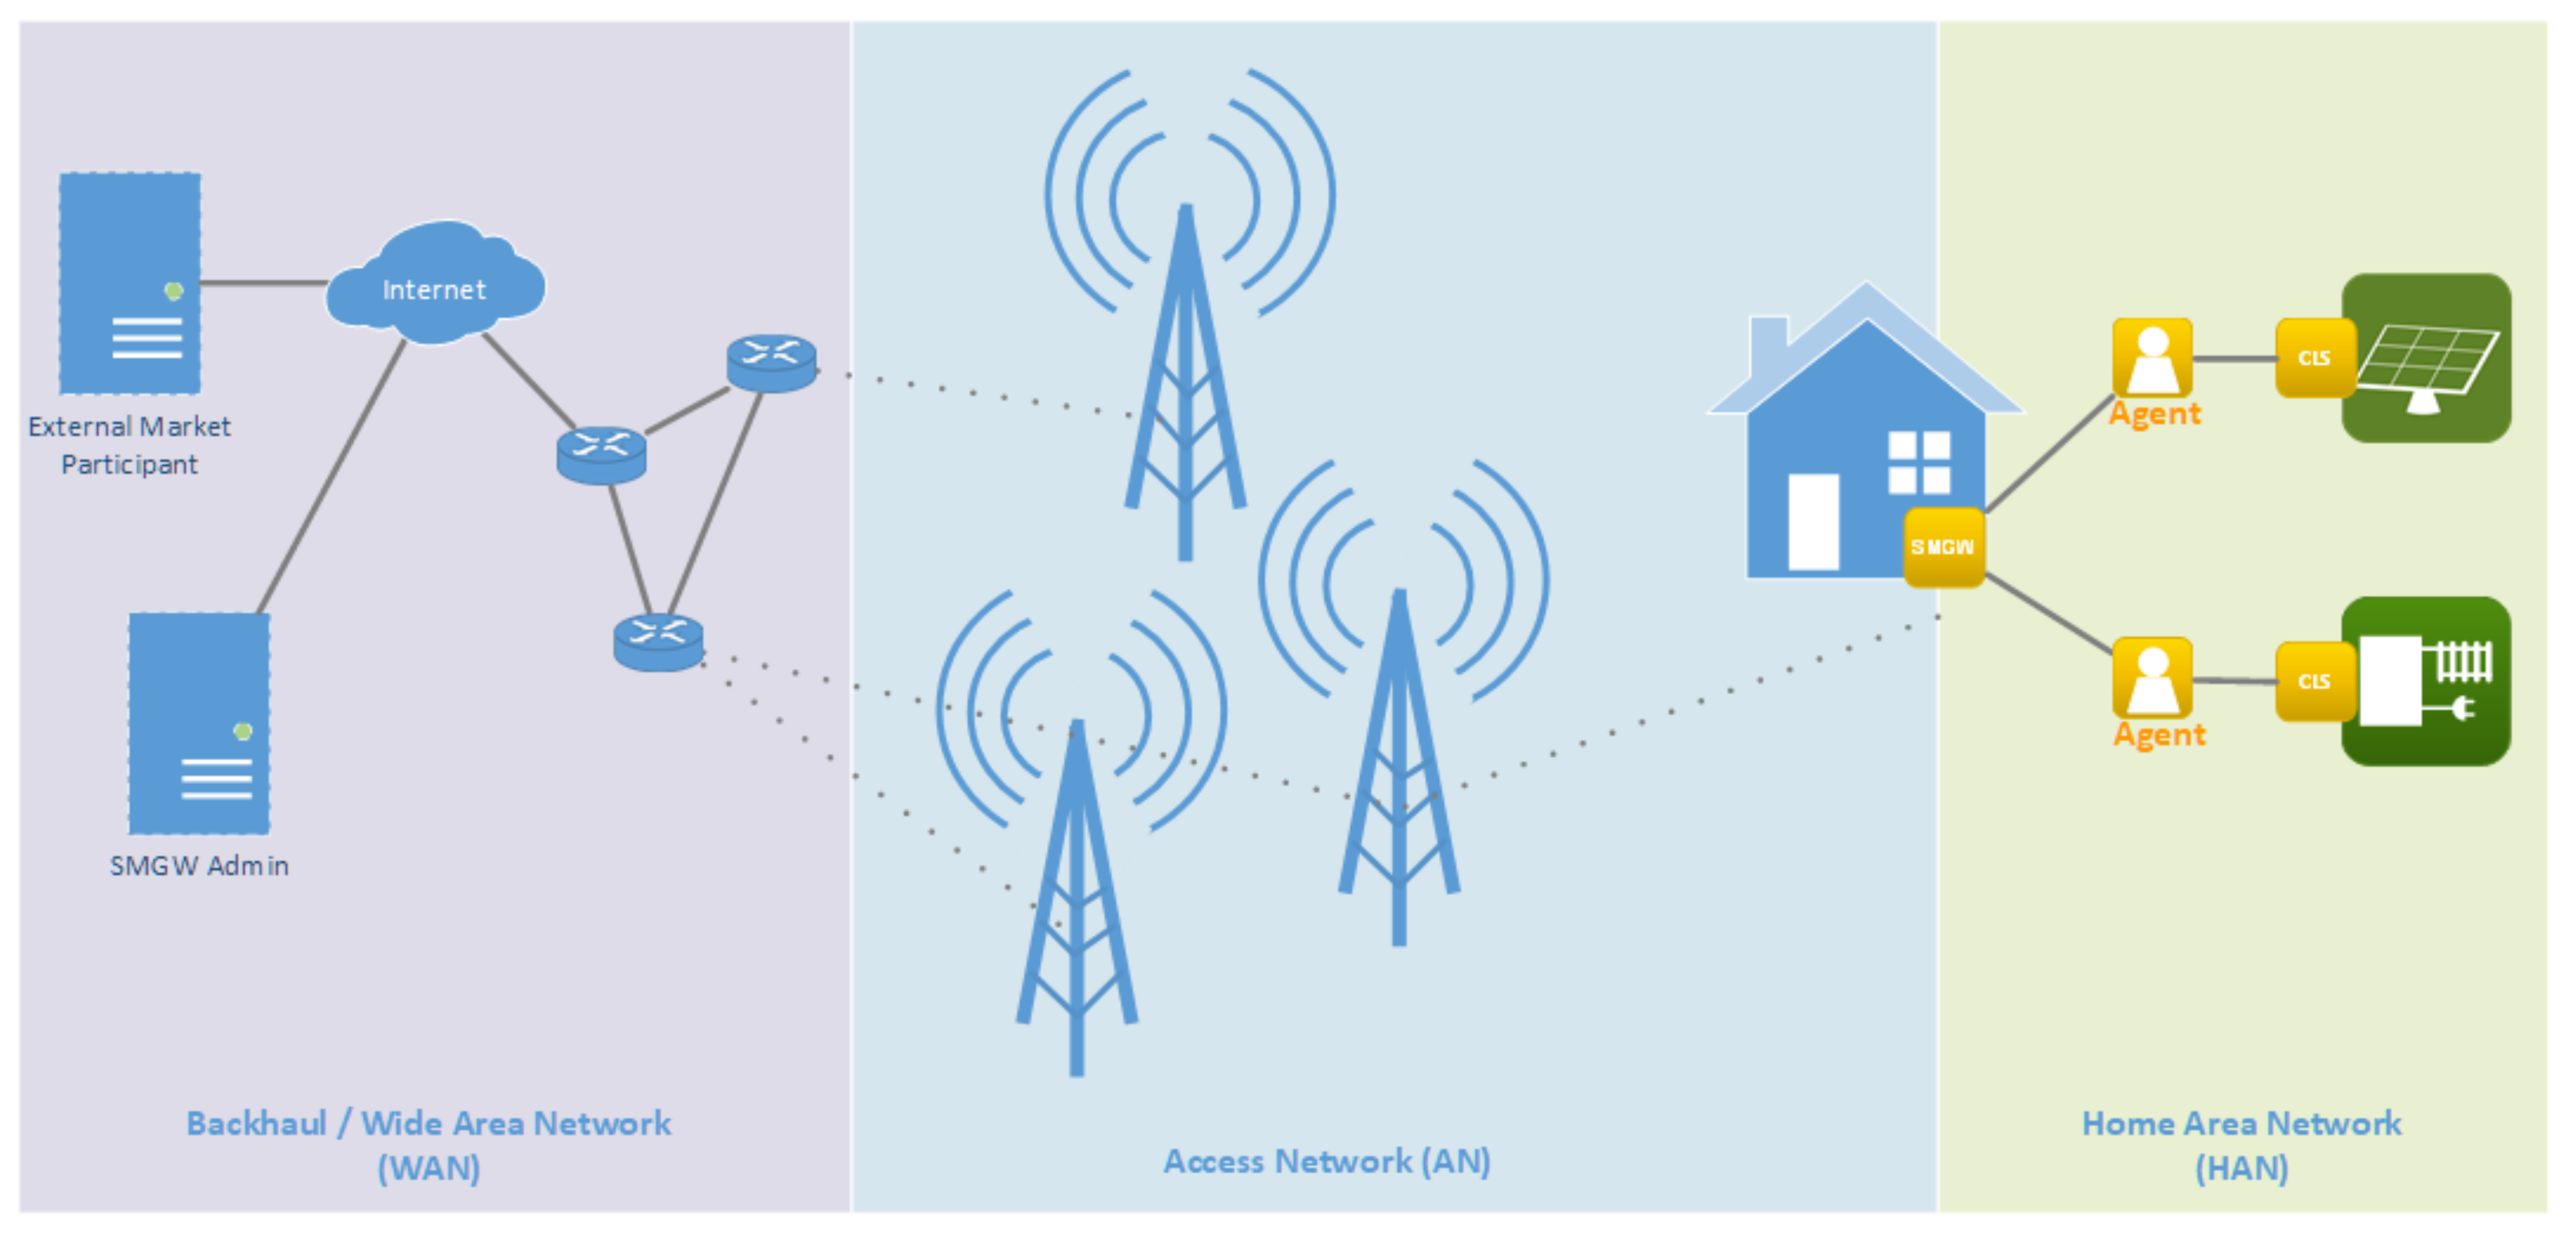
22]. However, it is assumed that DGs may be connected to the Neighborhood Area Network (NAN) or Access Network by Smart Meter Gateways (SMGWs), enabling access to the backhaul network by a secure and reliable communication connectivity for future grid-stabilizing or marked-based use cases for DG operation. Agents access the DG via a controllable local system (CLS) interface and the communication network via the SMGW (see
Figure 1).
Furthermore, it is assumed that SMGW may be located inside of buildings, especially in basements as they replace old metering devices and for convenience reasons of customers. Establishing connectivity to SMGW must be fast and cost-efficient realizable, which makes it unlikely to use wired technology as this would require third-party building intervention [
23]. Wireless technologies need the appropriate signal penetration and strength, which is heavily depending on the frequency used.
Therefore, we consider CDMA 450 and LTE Advanced as very promising transmission technologies for our use case. CDMA 450 uses code division multiplexing for channel separation (CDMA)—a technology used in 3G mobile networks [
4,
24]. It offers good obstacle penetration characteristics, sufficient throughput, and low capital expenditure due to long communication distances, and therefore fewer base stations. This transmission medium can be exclusively used for communication of the smart grid [
23]. LTE communication is provided via the public network [
23]. Therefore, capital expenditure is lower than with CDMA 450, as there is no need to build a separate backhaul network. The available throughput can be provided by the communication network operator through contractual service level agreements usually billed by transmitted data or used throughput. As a result, the operational expenditure is higher compared to CDMA 450.
4. Methodology
The evaluation of the communication technologies for our use case was carried out using a three-part procedure. In a first step, this involved determining appropriate evaluation criteria derived primarily from the use case of product delivery to the rAS market. The second step was to identify the major factors that we believe have a significant impact on the negotiation and determined suitable parameters for the experiments. The experiments with varying assignments for the factors were conducted in the third step in a simulation environment, mainly consisting of a MAS and a communication simulator.
4.1. Evaluation Criteria
The primary purpose of scheduling optimization within the VPP is to resolve a congestion. Thus, we investigate if the MAS can find a feasible solution in time. To this end, two evaluation criteria are defined: (1) accuracy of product fulfillment and (2) negotiation time.
The reasons why there may be deviations between the delivered product and the target product are in our use case twofold. One reason is modeling of flexibilities as schedules. The agents only have a predefined number of schedules at their disposal, and these schedules cannot always be combined to form the exact target product. The second reason is the heuristic characteristic of COHDA, which does not guarantee a globally optimal solution.
The scope in which deviations are acceptable is only in the range of measurement inaccuracies. These are usually 2–3% [
25]. Thus, here, a deviation of 3% will serve as a threshold for the negotiations. For this, the error metrics maximum error (
) and mean absolute error (
) are used.
Let
be the actual aggregated schedule of the MAS,
t the target schedule,
p the product, and
n the number of time intervals, i.e., the length of the schedules. The maximum error is determined by the maximum deviation of an interval in a schedule and therefore serves to evaluate whether the product can be delivered correctly. It is defined as
This error metric determines the relative maximum of the element-wise deviation of the two schedules. If , i.e., the maximum error is below the 3% limit, it is ensured that the tolerance limit is maintained for every 15-min interval.
Furthermore, the mean absolute error
was also considered in order to evaluate how the performance of all intervals is, as this metric does not penalize individual deviations as much as the maximum error
. We use both error functions to determine the solution quality.
The negotiation time is the second essential evaluation criterion and conflicts with the solution quality. COHDA scheduling terminates when all agents have agreed on a schedule and when no agent can contribute anything to the improvement. During long negotiations and due to communication delays, it is possible that the time between gate closure and product fulfillment may not be sufficient for a successfully terminated negotiation. Due to the anytime property, the current solution of the respective agents are valid operation schedules. Therefore, it is necessary to measure how long the whole negotiation takes until termination and if the negotiation does not terminate within 5 min (the time between gate closure and delivery), which solution quality could be achieved at that point in time.
4.2. Experiment Design
The experiments are designed to focus on the key objects of investigation: communication technologies, state of ICT (in terms of communication disturbances), and scaling of communication participants, which are defined by the number of agents. The scaling is done in three levels, allowing the experiments to be performed with 20, 50, and 100 agents. We have chosen these three levels so that we may identify any trends. We look at relatively large networks, as we expect the influence of delays to be more apparent there. Rescheduling is based on the premise that the original target schedule of the VPP is an unvarying schedule resulting from previous (day-ahead) planning. As the product is intended to solve a congestion, the original target schedule is reduced by the power over the duration of the product, i.e., for , where is the original day-ahead schedule.
We have scaled the VPP so that in experiments with many agents the VPP does not only consist of DGs with low nominal power. The experiments therefore scale with the same factor as the number of agents. The original target schedule was chosen to correspond to
of the aggregated nominal power of DGs in the VPP and product as
of the original target schedule. We have chosen 80% for the original schedule as we wanted to avoid an aggregation of extreme schedules, but still using the potential of the VPP. An overprovision of 20% is common planning factor in energy systems [
26]. The product size is roughly based on the power that would be required to solve a (60 MVA) medium voltage transformer overload.
Table 2 gives an overview of the resulting experiment setup. The product consists of four 15 min intervals, but the MAS negotiates an additional interval to establish the transition to the original target schedule. For example, for 20 agents with an original day-ahead schedule of constantly 4 MW, a target schedule including the product would look like (3.2 MW, 3.2 MW, 3.2 MW, 3.2 MW, 4 MW). Agents can choose from 2500 DG schedules, which are provided as their flexibility. This amount was required to achieve the desired solution quality even in small a VPP setup without negotiation restrictions.
Each VPP setup consists of three different types of CHPs (see
Table 3). They offer high flexibility and respect feed-in priority to renewable energy resources like photovoltaic or wind turbines. In the scenarios outlined in
Table 2, a third of the nominal capacity was allocated to each of the different CHP types. The efficiency of a CHP unit indicates how much of the energy used from the fuels can be converted into electricity and heat. Here, the size of DGs range from 10 to 900 kW and the three types are representing the behavior for different CHP applications: The first type (categorized as Type 1 in
Table 3) comprises plants with a maximum nominal power of 150 kW, which are modeled as highly flexible CHPs due to large storage capacity and scope for temperatures. This type could be used for residential houses, public buildings, and small businesses. The second type of plants behave like biogas plants and are less flexible as they are controllable in three discrete power stages. The nominal effective power is higher and they possess larger storage capacity than the first type. The largest plants under consideration (categorized as Type 3 [
3]) serve the industrial sector. They are the least flexible, as they are also only controllable in three discrete power stages and possess the smallest storage with little scope in allowed storage temperature. The configurations of these CHP types are used to parameterize models in the simulation. These configurations are roughly based on non-disclosed data of an existing German medium voltage grid.
Communication disturbances may occur in various types and can be analyzed in a simulation, either steady-state or dynamically. We limit our scope for communication disturbances to a steady-state view, which means that disturbances occur before and continue throughout the simulation. For both communication technologies—CMDA 450 and LTE Advanced—we choose three types of disturbances. As a result, we consider four different ICT cases:
Undisturbed Communication: The communication network does not show any failures. This serves as our baseline for comparison to disturbed communication. We expect the delay to be mainly affected by path delay and occasional packet loss due to collisions in simultaneously sent messages from end-systems with agents.
Base Station Failure: We investigate the influence of a base station failure with the condition that basic connectivity to all participating agents is maintained despite the failure.
Traffic: We analyze the effects of congestions on the communication infrastructure that occur due to hosts flooding the network with packets so that routers are overloaded. Here, we expect packet loss due to packet drops in router incoming queues.
Jammer: We examine the influence of a jammer that interferes with signal transmission. We expect that this will lead to increased packet loss and thus increased delay
The four undisturbed and disturbed ICT cases are designed for both communication technologies and the three differently scaled MAS networks (
Table 2). These combinations compose different ICT scenarios. Experiments are performed for each ICT scenario yielding 24 different experiments.
Furthermore, additional experiments with a negotiation time-out and a relaxed objective function are added if the negotiation time threshold is exceeded. Relaxation is achieved by integrating the tolerated deviation (
Table 2) into the objective function (Equation (
1)) of agents. The candidate schedule of an agent is not updated if the deviation of each interval is below this threshold. Thus, termination is reached sooner.
4.3. Simulation Environment
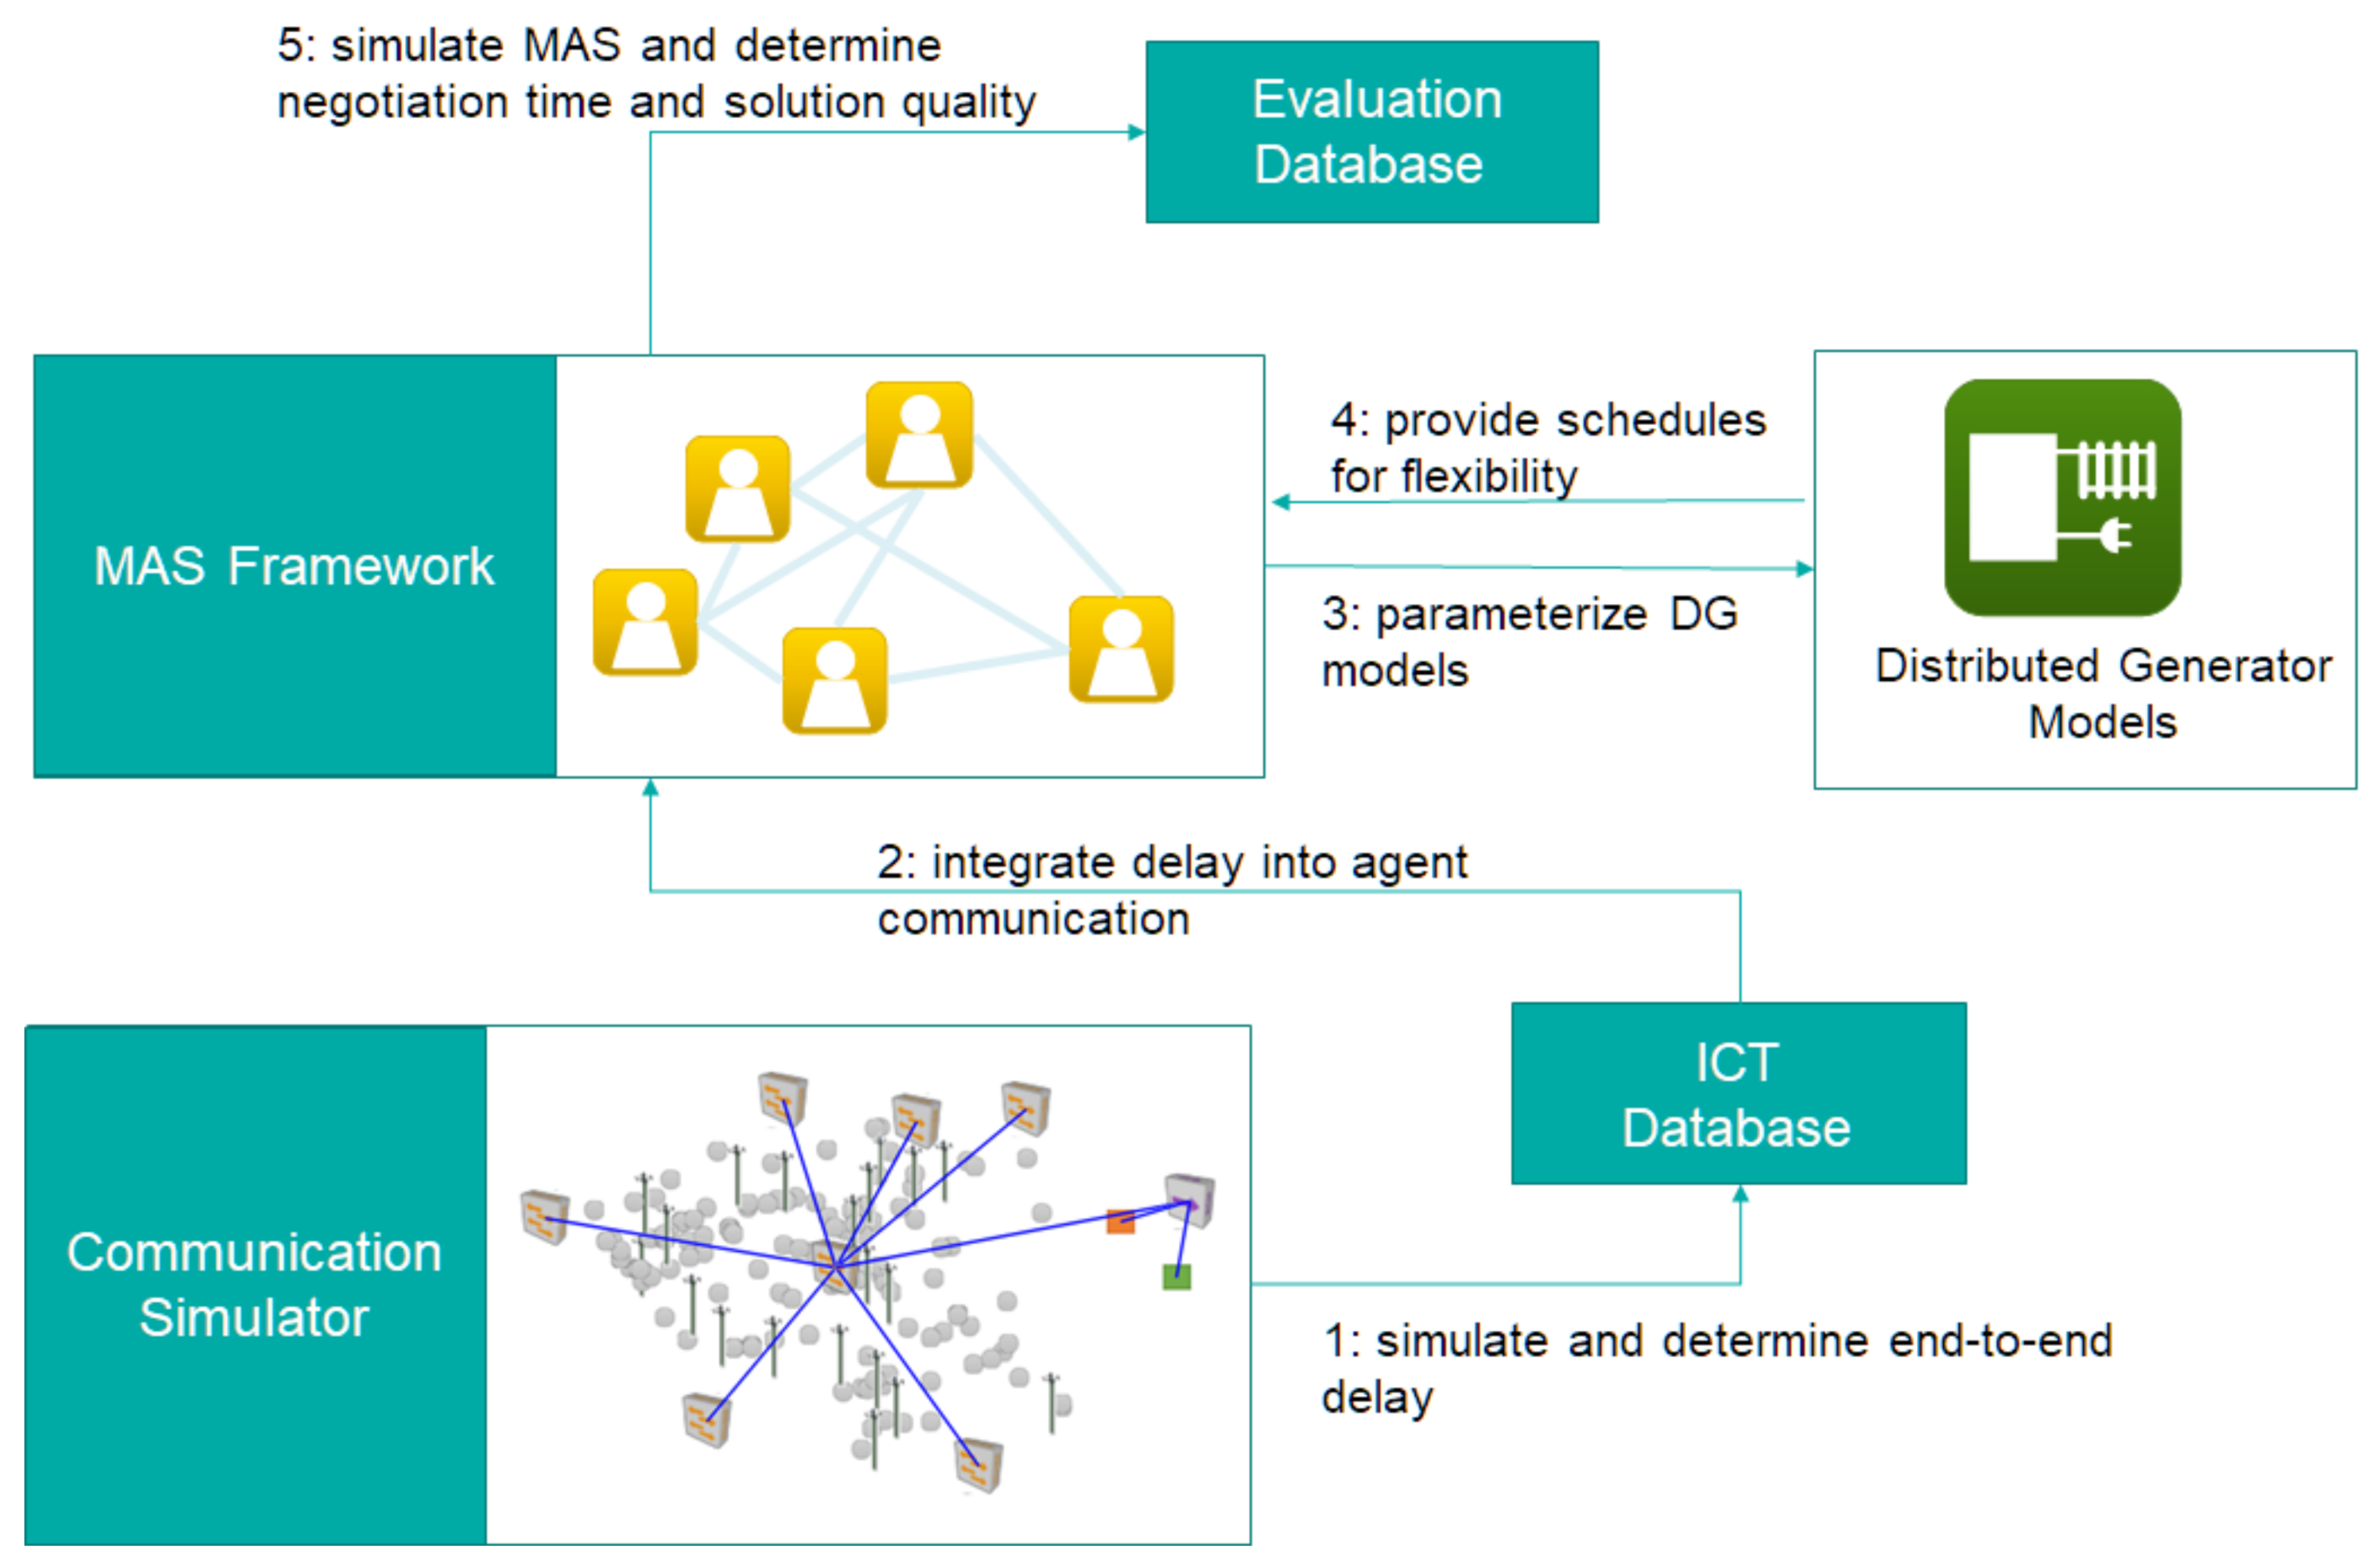
The experiments are conducted with a simulation environment whose architecture is shown in
Figure 2. It consists of 5 components: an agent framework, DG simulation models, a database, a communication simulator, and an evaluation database. For communication simulation, we choose EXata (
https://www.scalable-networks.com/products/exata-network-emulator-software (accessed on 2 December 2020). In EXata, the communication scenarios are implemented as models consisting of end systems (agents) representing DGs and the infrastructure in between (base stations, switches, etc.). The communication between agents is simulated and the end-to-end delay between a sending and a receiving agent is measured in this simulation. Delays of all end-to-end connections are stored into the ICT database.
ISAAC (
https://github.com/mtroeschel/isaac (accessed on 2 December 2020) is used as the agent framework, which implements COHDA and adds an observer and controller agent [
29]. This allows a global view of the MAS to gather the final solution or to terminate the negotiation. The ICT database is accessed by the MAS which incorporates delay information into the topology of the MAS. Therefore, each agent is aware of the average end-to-end delays to its neighbors. The sending agent waits this delay period before sending the information to a receiving agent.
Agents generate unique schedules by parametrizing DG models to follow the behavior of
Table 3. In the step, internal states of DG models are set, so that models imitate a DG already following a schedule. At the end of the simulation, results are written into the evaluation database.
4.4. Communication Network Modelling
The modeling of the communication network is based on the existing German 600 km medium voltage area with 100 DGs. Therefore, the positioning of the DGs follows an existing underlying power grid structure. The communication infrastructure is modeled across the DGs so that all DGs are reachable. Therefore, all scenarios of one communication technology are based on the same communication infrastructure. One negotiation minute is simulated to determine average end-to-end delays. The messages are sent on the transport layer via TCP and on the network layer via IPv4. In COHDA, the size of messages sent increases over time until information of all agents are integrated into each agent’ working memory. Message sizes in COHDA range from about 1600 bytes to about 2200 bytes. To simulate the increasing message sizes, we have divided the simulation in EXata into three intervals. In one minute, which is the simulation time in EXata, in COHDA an average of about 120 messages are sent by each agent. In the first interval (1–20 s), 40 messages of 1600 bytes are sent per agent. In the second interval (21–40 s), the messages have a size of 2000 bytes, and in the third interval (41–60 s), 2200 bytes.
The network topology of CDMA 450 as shown in
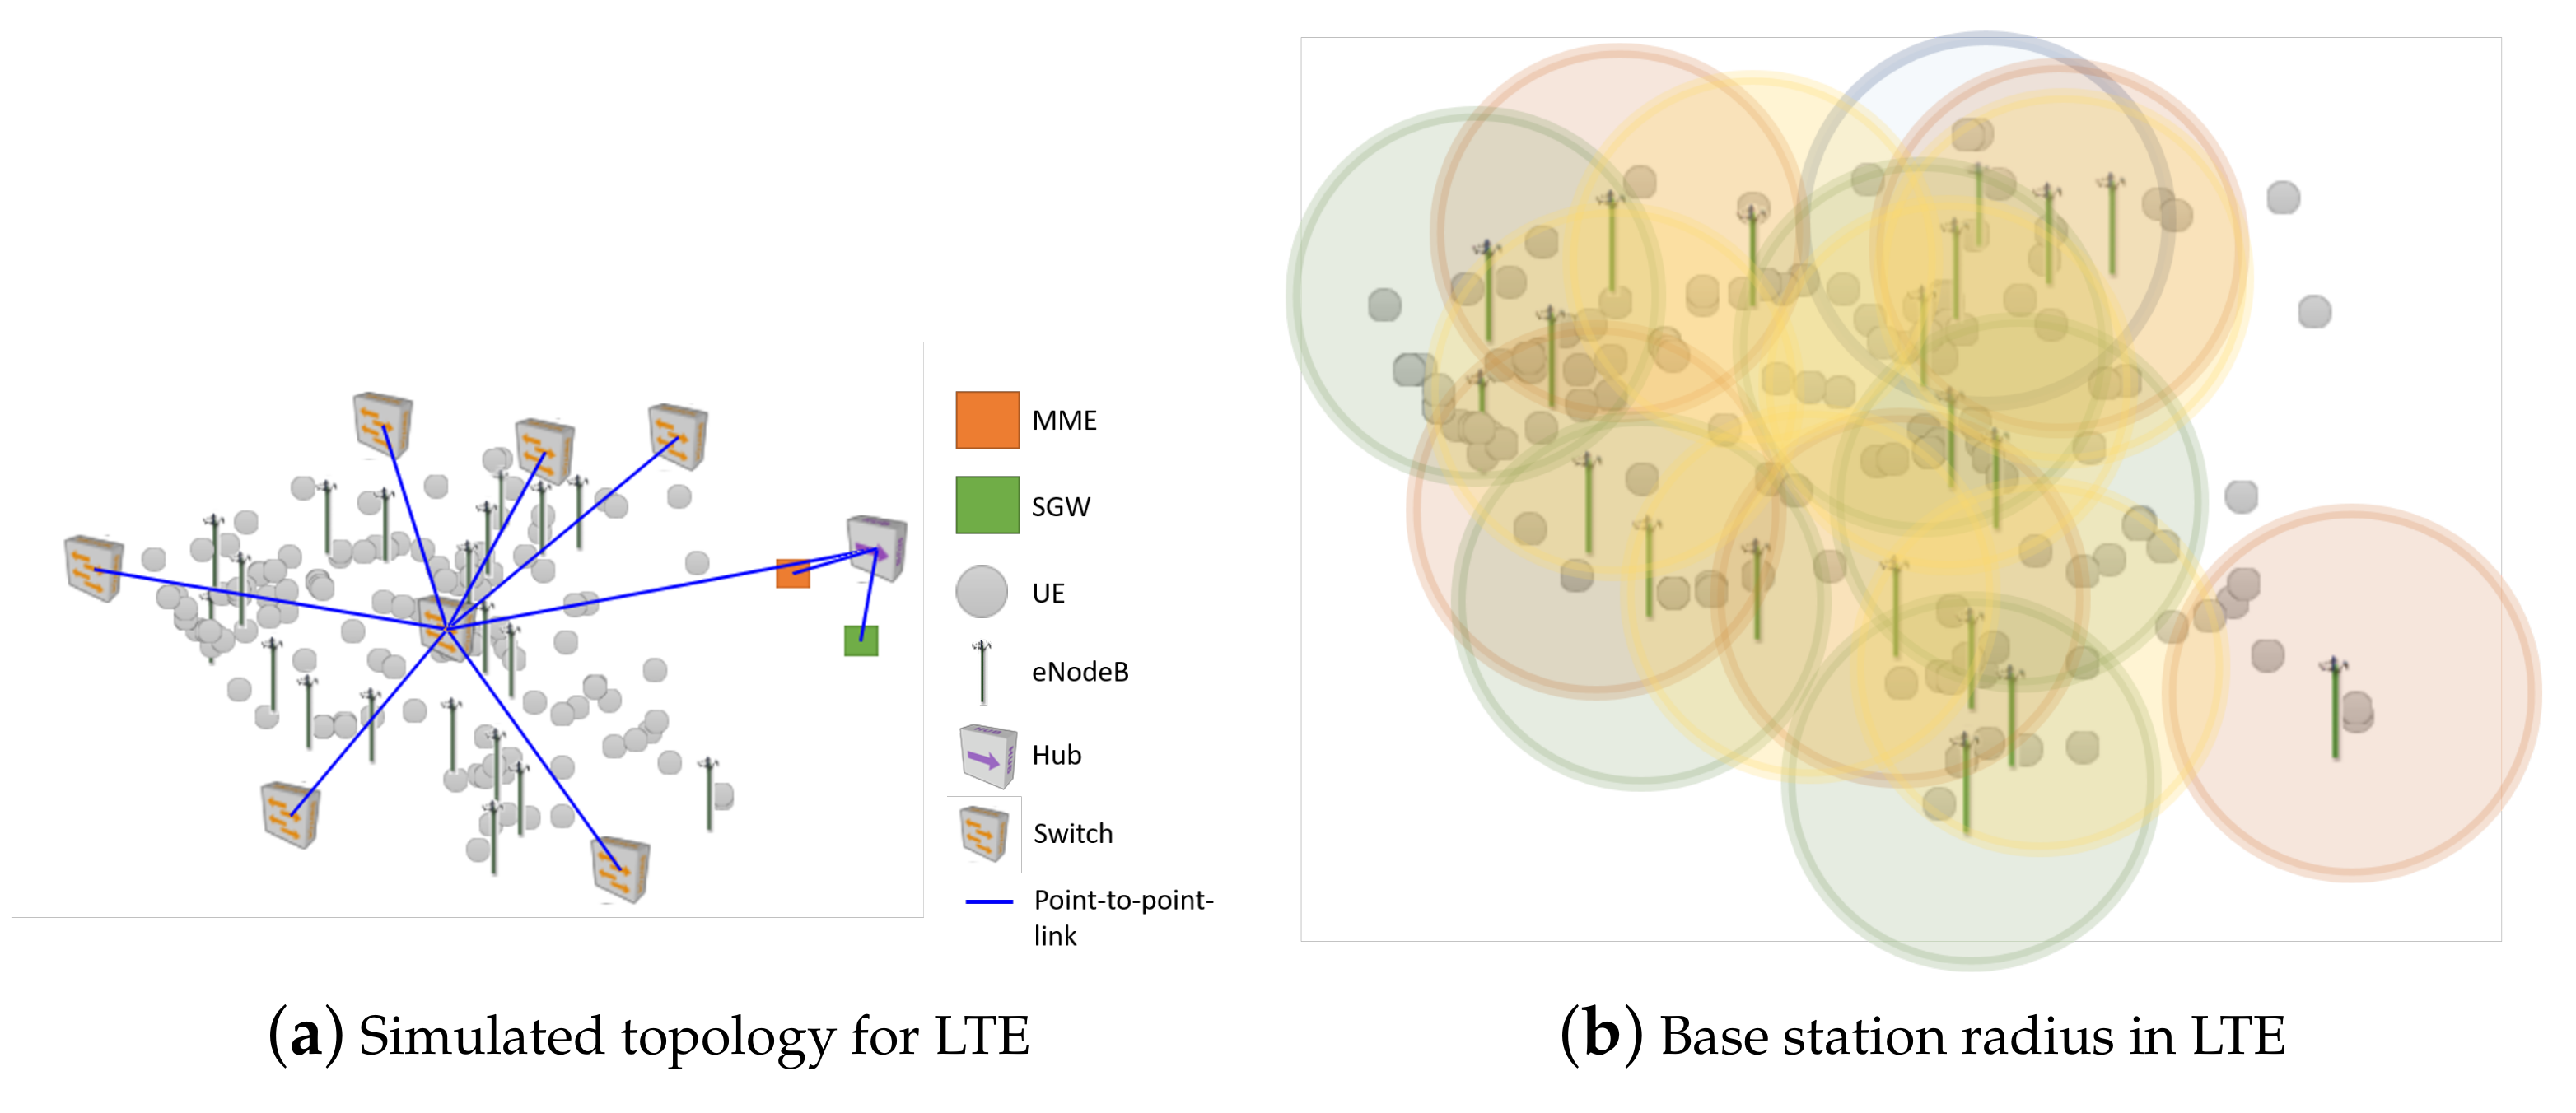
Figure 3 consists of six antennas connected via five switches. For LTE Advanced (
Figure 4) we modeled a wired network consisting of a hub, a Serving Gateway (SGW), a Mobility Management Entity (MME) and 20 base stations (eNodeB) [
30] which are connected to seven switches. This core network was connected to the User Equipment (UE) via a wireless network. The communication works on several frequency bands via carrier aggregation. Multiple-input and multiple-output (MIMO) allows parallel transmission of data with several base stations at the transmitter and receiver on the same frequency and at the same time by using several antennas in transmit and receive direction. The parametrization of base stations and UE for both technologies is shown in
Table 4. These are standard values for both technologies in EXata.
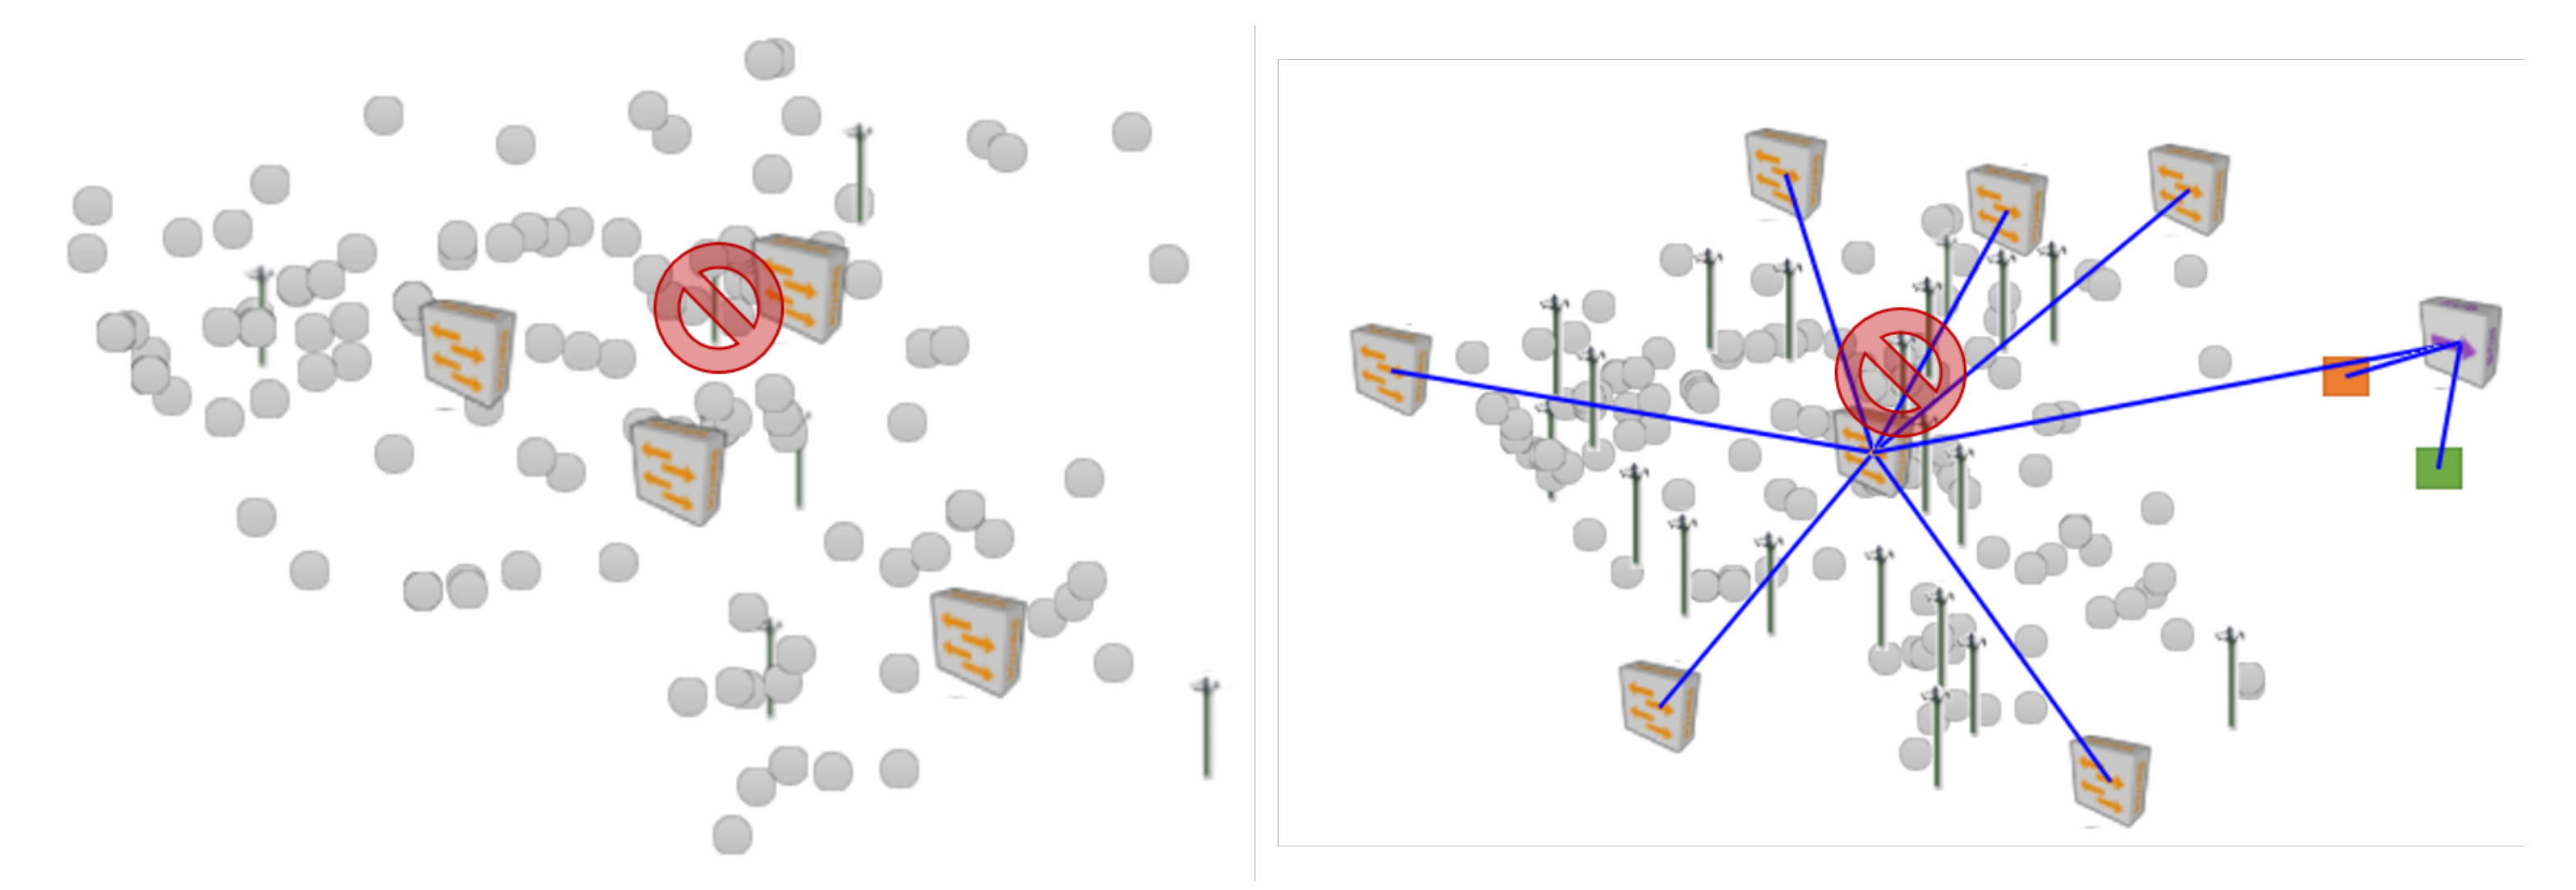
A traffic generator in EXata was then used to simulate additional message exchange in the communication network. It is implemented as an application in EXata, where a source node sends messages to a destination node. During the simulation, messages of 100,000 bytes are sent between a number of 79 randomly selected nodes per second to simulate increased network load. Disturbances within the communication networks were modeled as a failure of one of the transmitting base stations. For this purpose, we have chosen a centrally located, as shown in
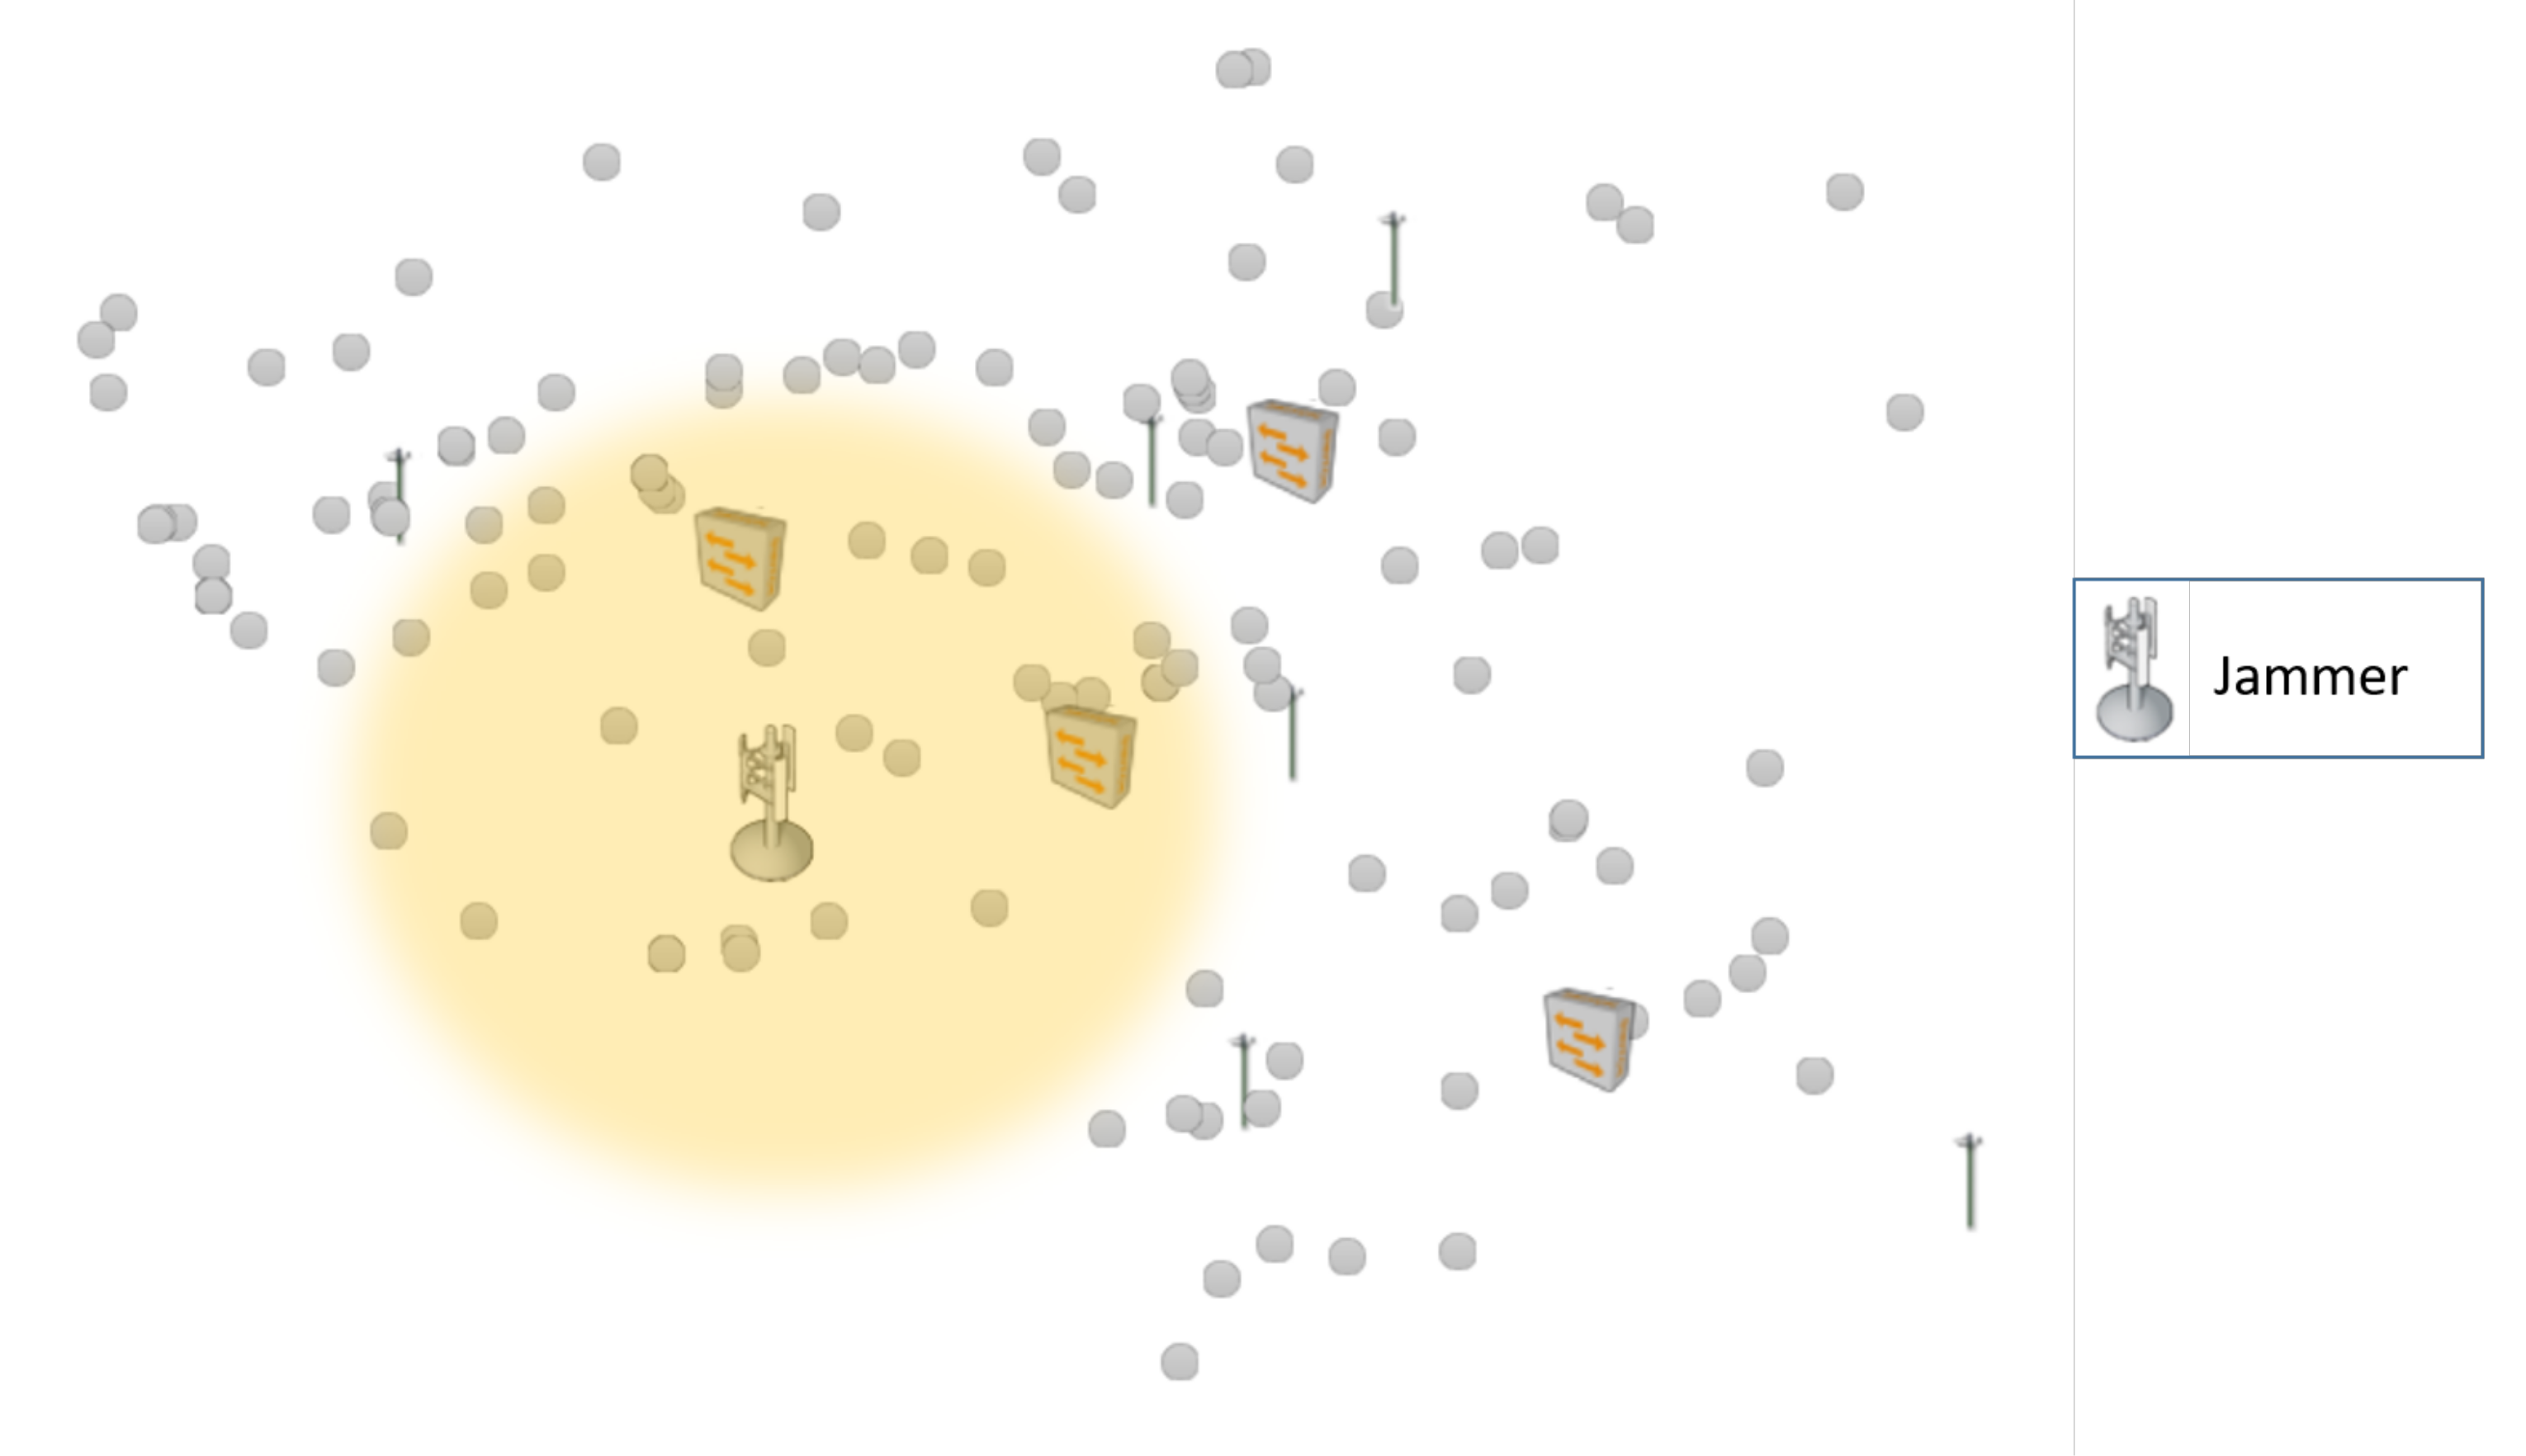
Figure 5. Due to the failure, increased throughput at the other base stations can be expected. To test the effects of interference phenomena, a centrally located jammer, as shown in
Figure 6 was modeled, which transmits on the same frequency as the surrounding antennas.
5. Results
We performed a two-part simulation and noted the results in this section. The results are discussed in
Section 6. The first part was the communication simulation in Exata which aimed at determining the end-to-end delay (this corresponds to Step 1 in
Figure 2). The second part was the MAS simulation to derive the influence that disturbed communication has on the negotiation time and solution quality (this corresponds to Step 5 in
Figure 2).
5.1. Determination of End-to-End Delays
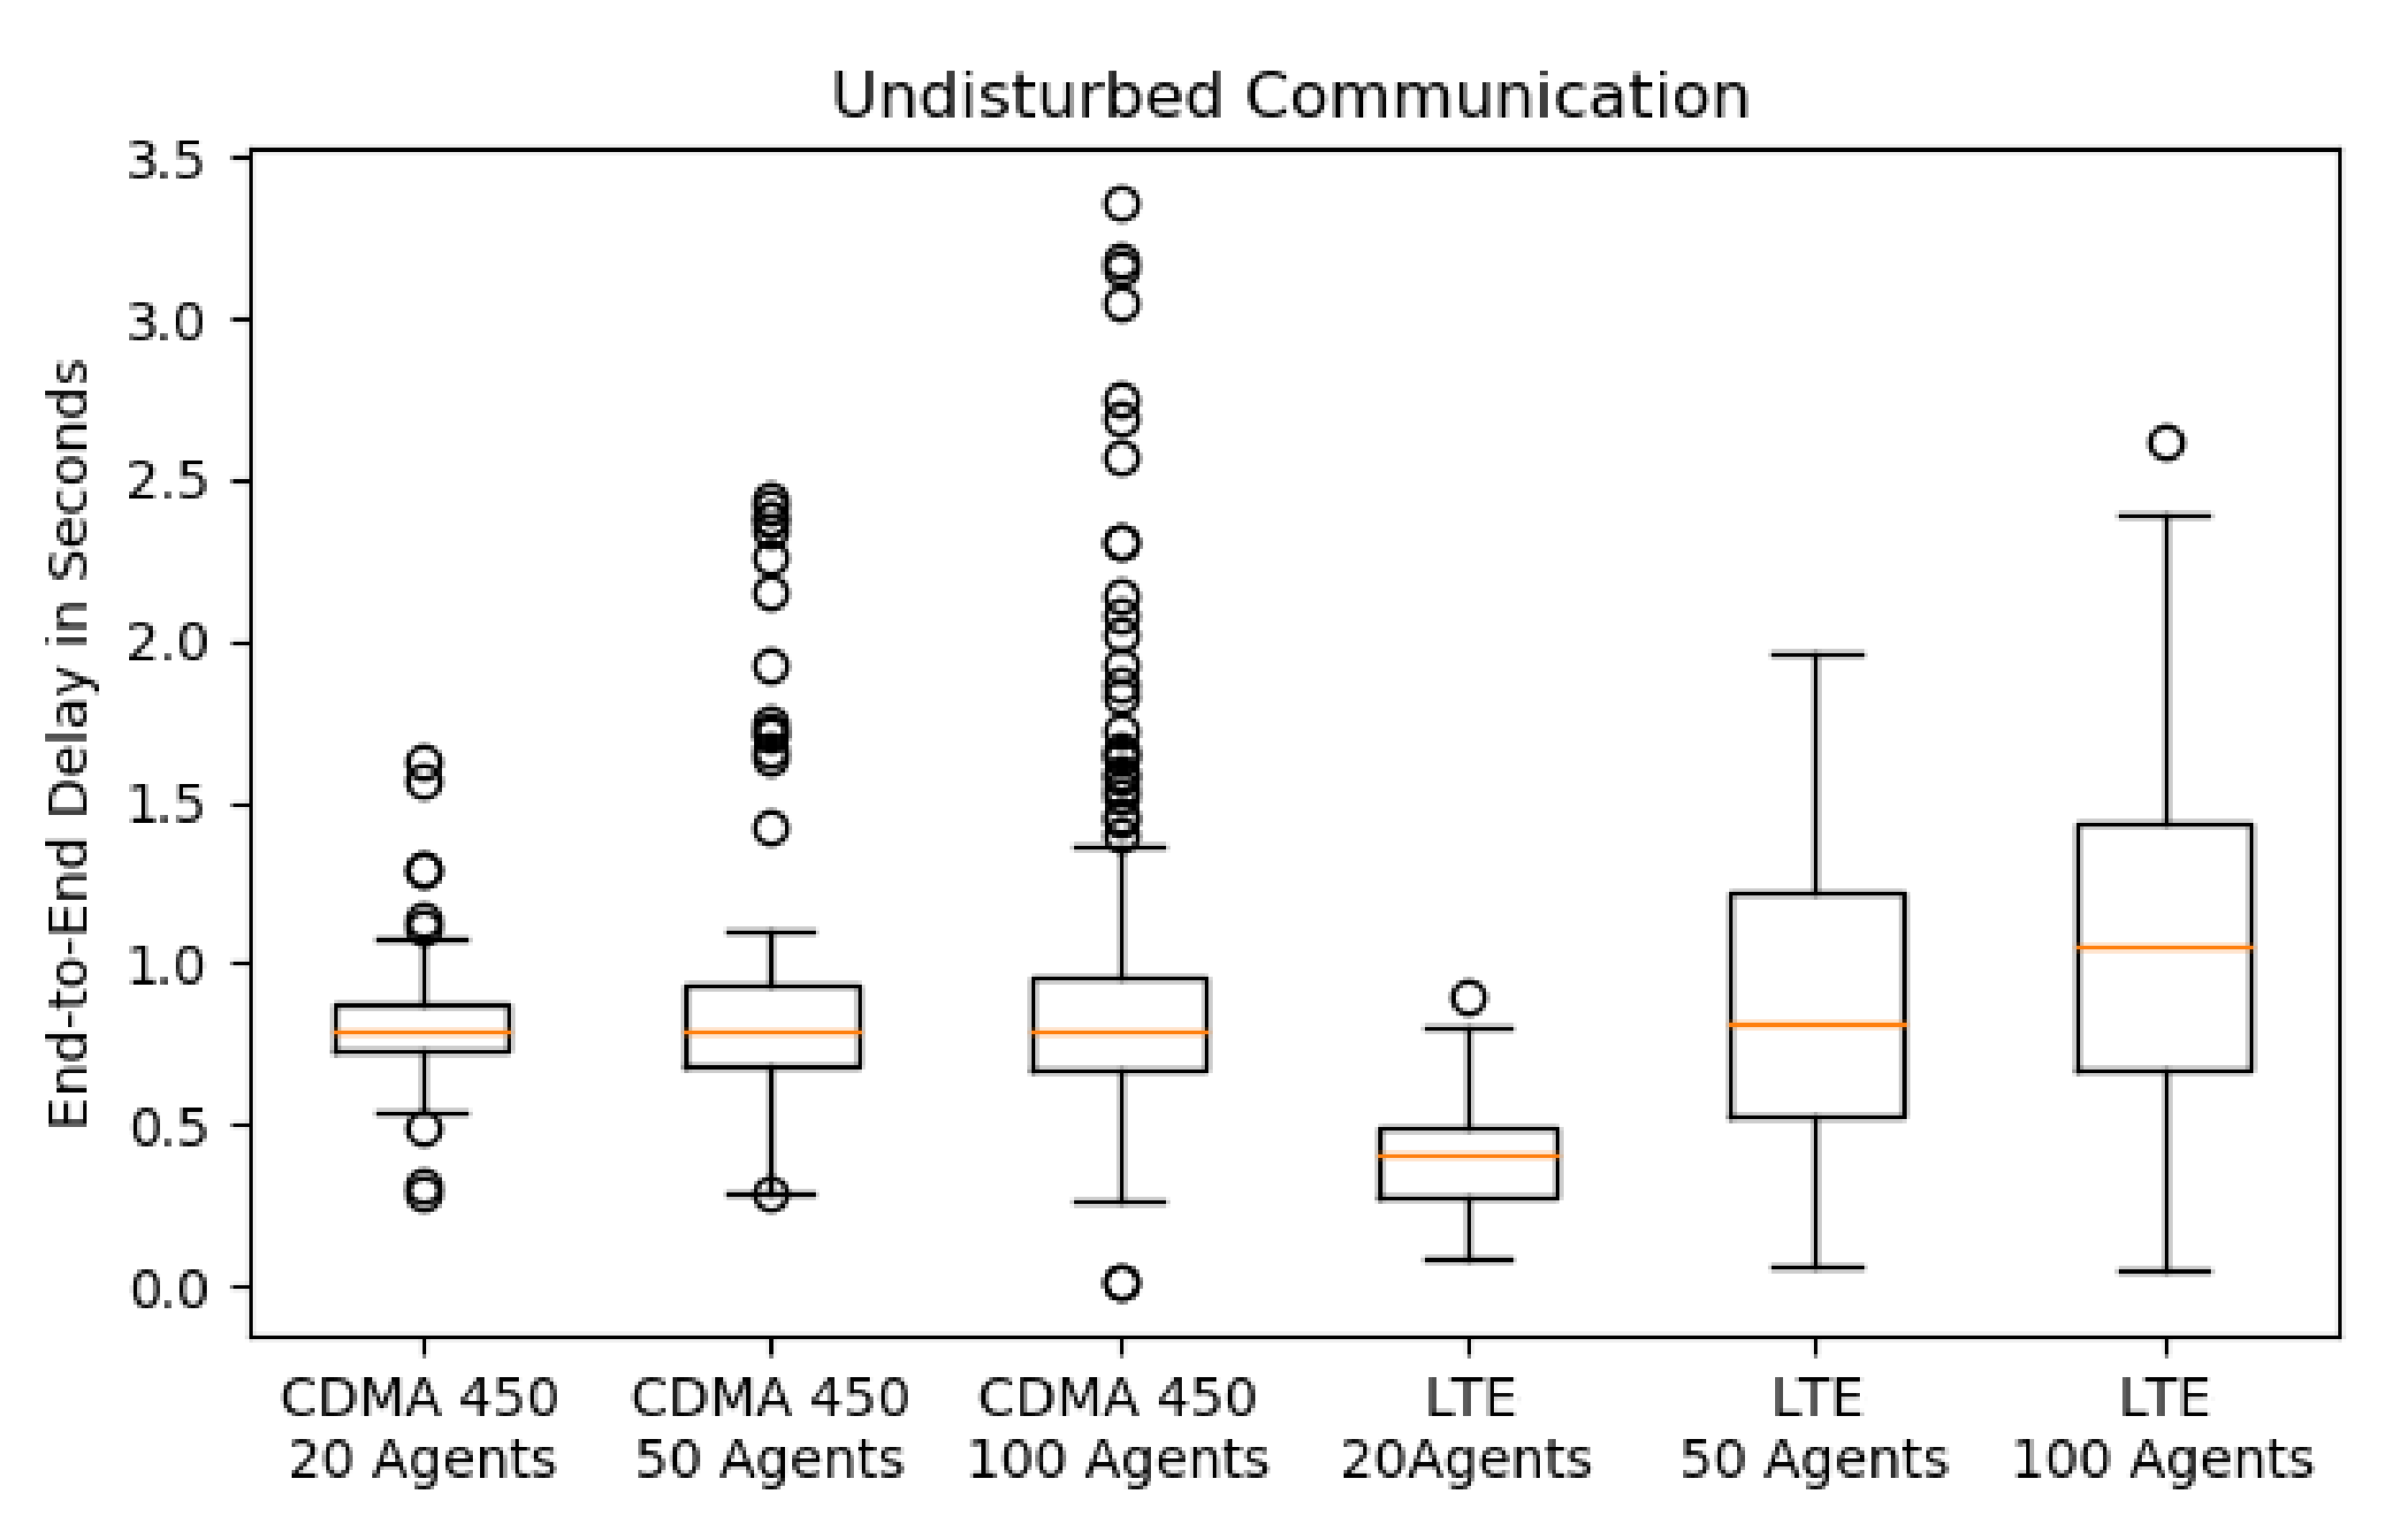
In order to determine the end-to-end delays between different agents for the different ICT-scenarios simulations were conducted. These simulations were performed in EXata. The results, i.e., the average end-to-end delays of ICT scenarios, are shown as box plots in
Figure 7.
The scenarios of undisturbed communication serve as an orientation to which the disturbed ICT scenarios are compared. For undisturbed communication, the medians of the technologies are at about 0.8 s. The delay time for LTE with 20 agents is on average 0.5 s. The delay tends to increase with the number of agents as can be seen by the increasing dispersion. In some cases, delay of up to 3.5 s occur.
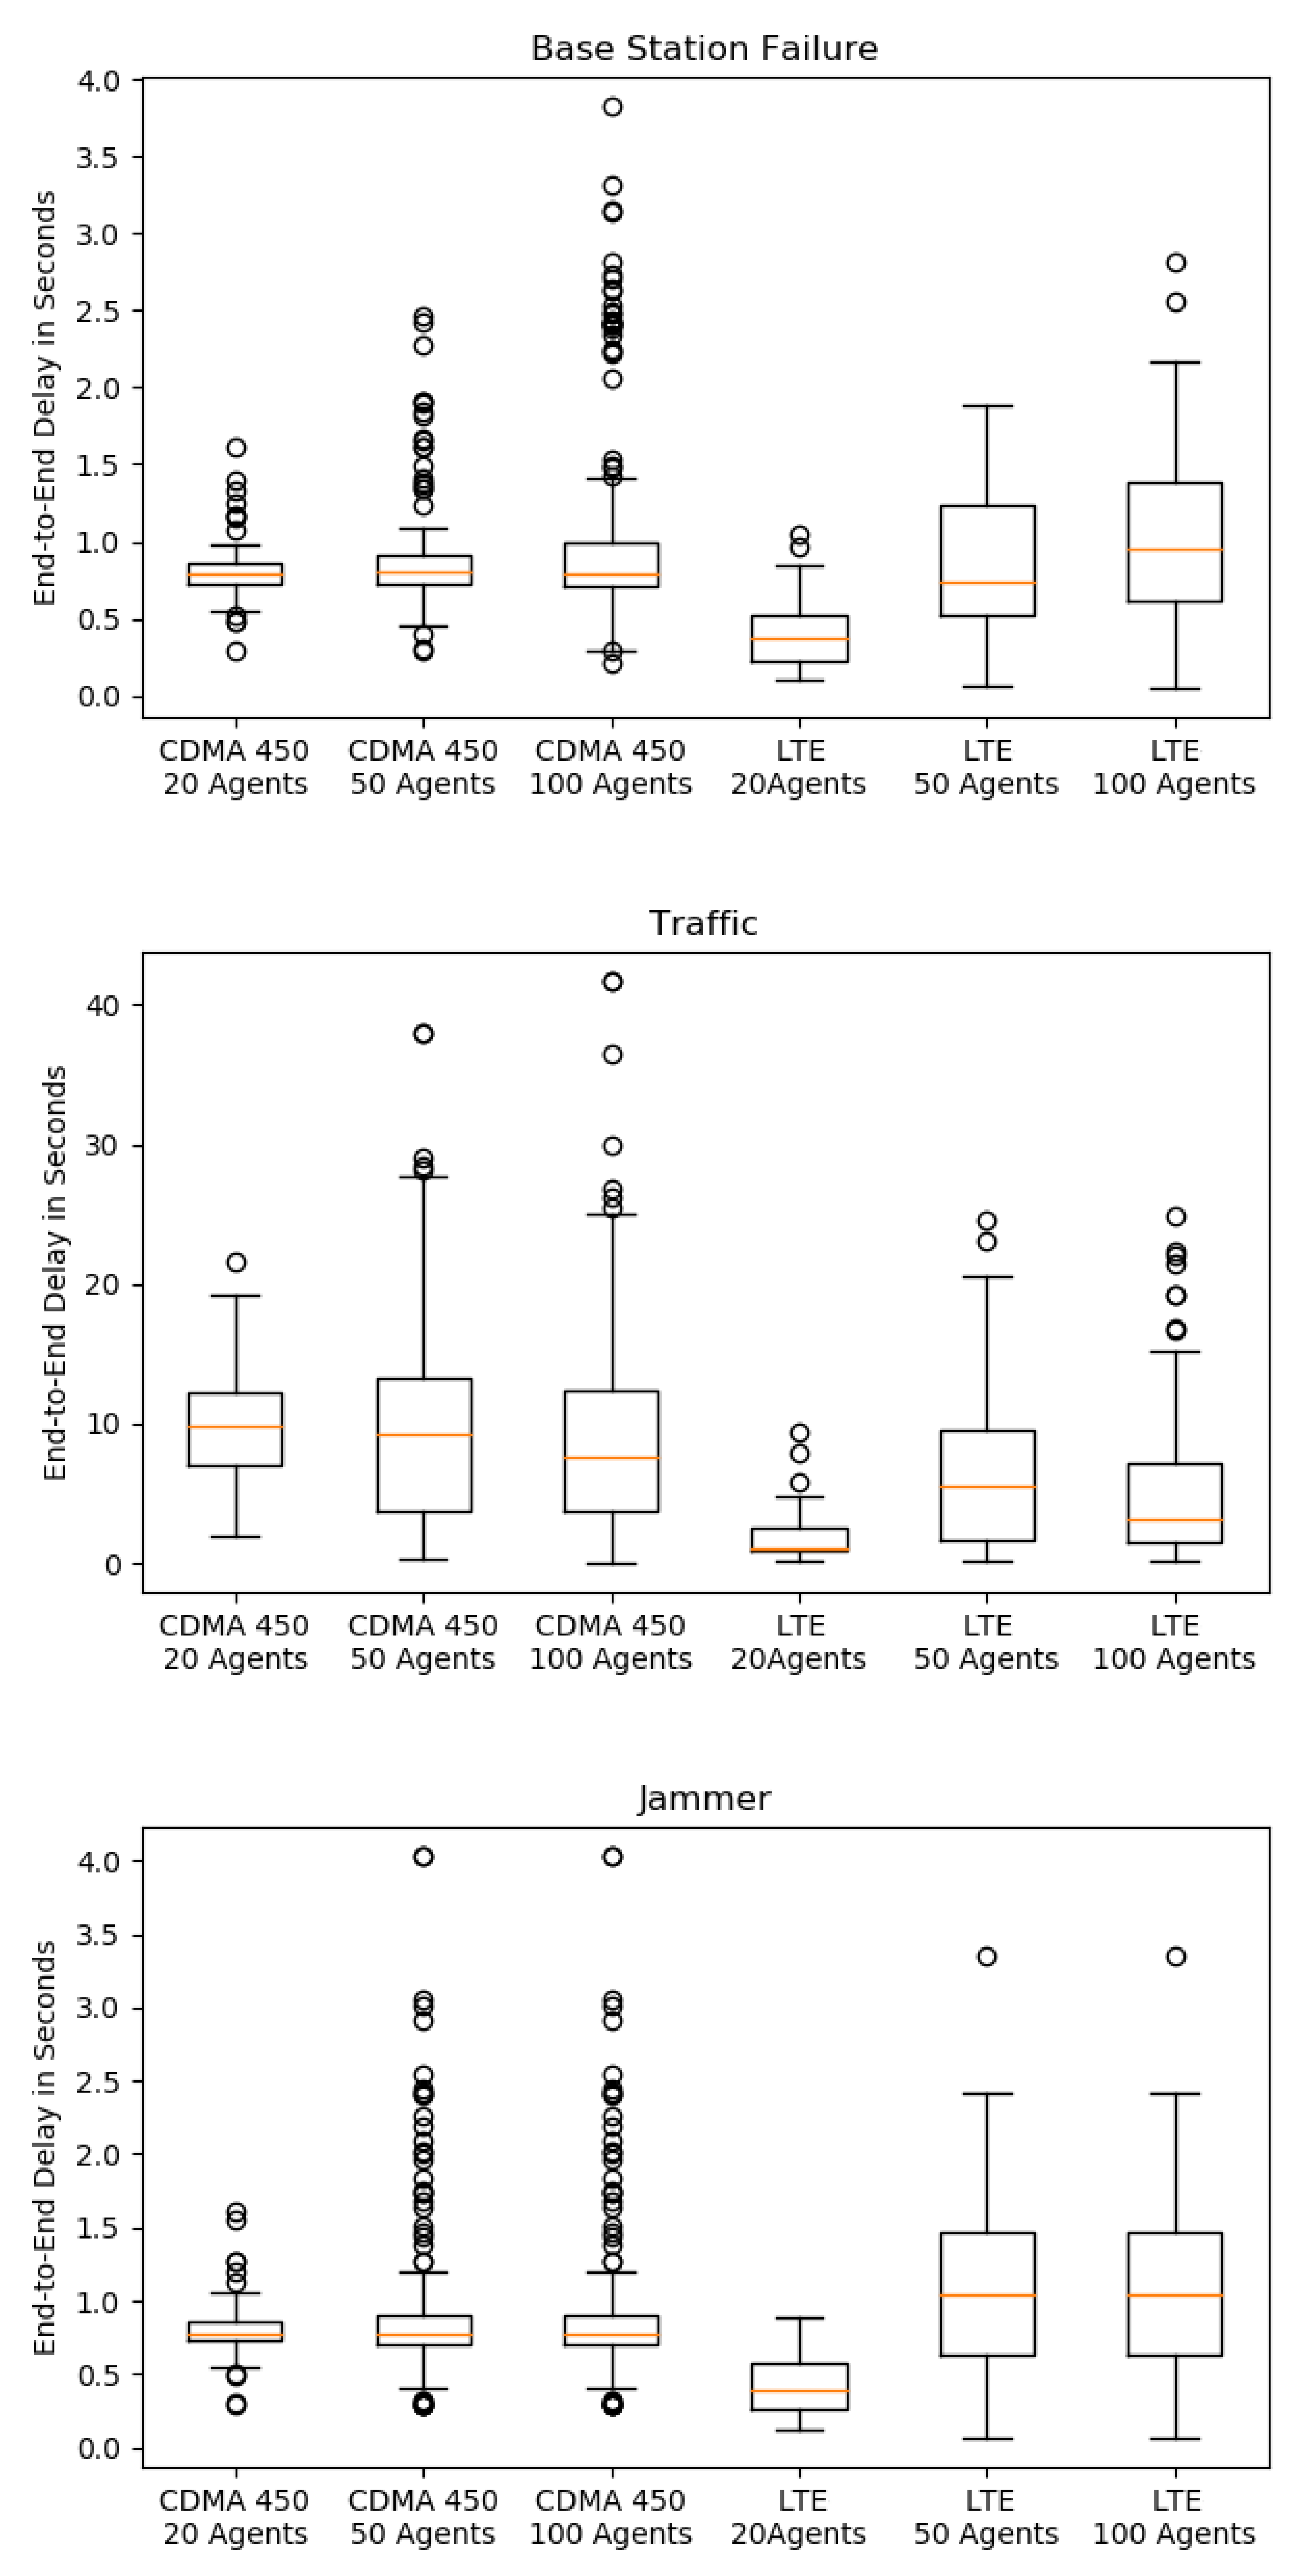
If a base station fails, the latencies of LTE and CDMA 450 hardly deteriorate compared to undisturbed communication. The delay is mostly influenced by increased data volume or traffic. This has a stronger effect on CDMA 450 than on LTE since the bandwidths are lower for CDMA 450. The median here is about 8–10 times larger than in undisturbed communication. In contrast to CDMA 450, the median for LTE is only approximately 2–5 times greater compared to undisturbed communication. Maximum latencies for both LTE and CDMA 450 are four times higher, leading to delay of up to 40 s. In case of a jammer, the latencies are slightly worse than in the undisturbed communication case.
5.2. Influence of Communication Delays on the Negotiation
To analyze the influence of communication on negotiations within the MAS, the duration of negotiations, the number of messages sent, and the quality of solutions were considered and interpreted with the knowledge from the previous section. The negotiations were conducted on an Ubuntu VM with 6.5 GB memory and Intel®Core™ i5-6200U CPU @ 2.30 GHz × 2. For each ICT scenario, 15 runs were performed from which the average value is presented in order to compensate for random factors of COHDA.
The results of the duration of negotiations are depicted in
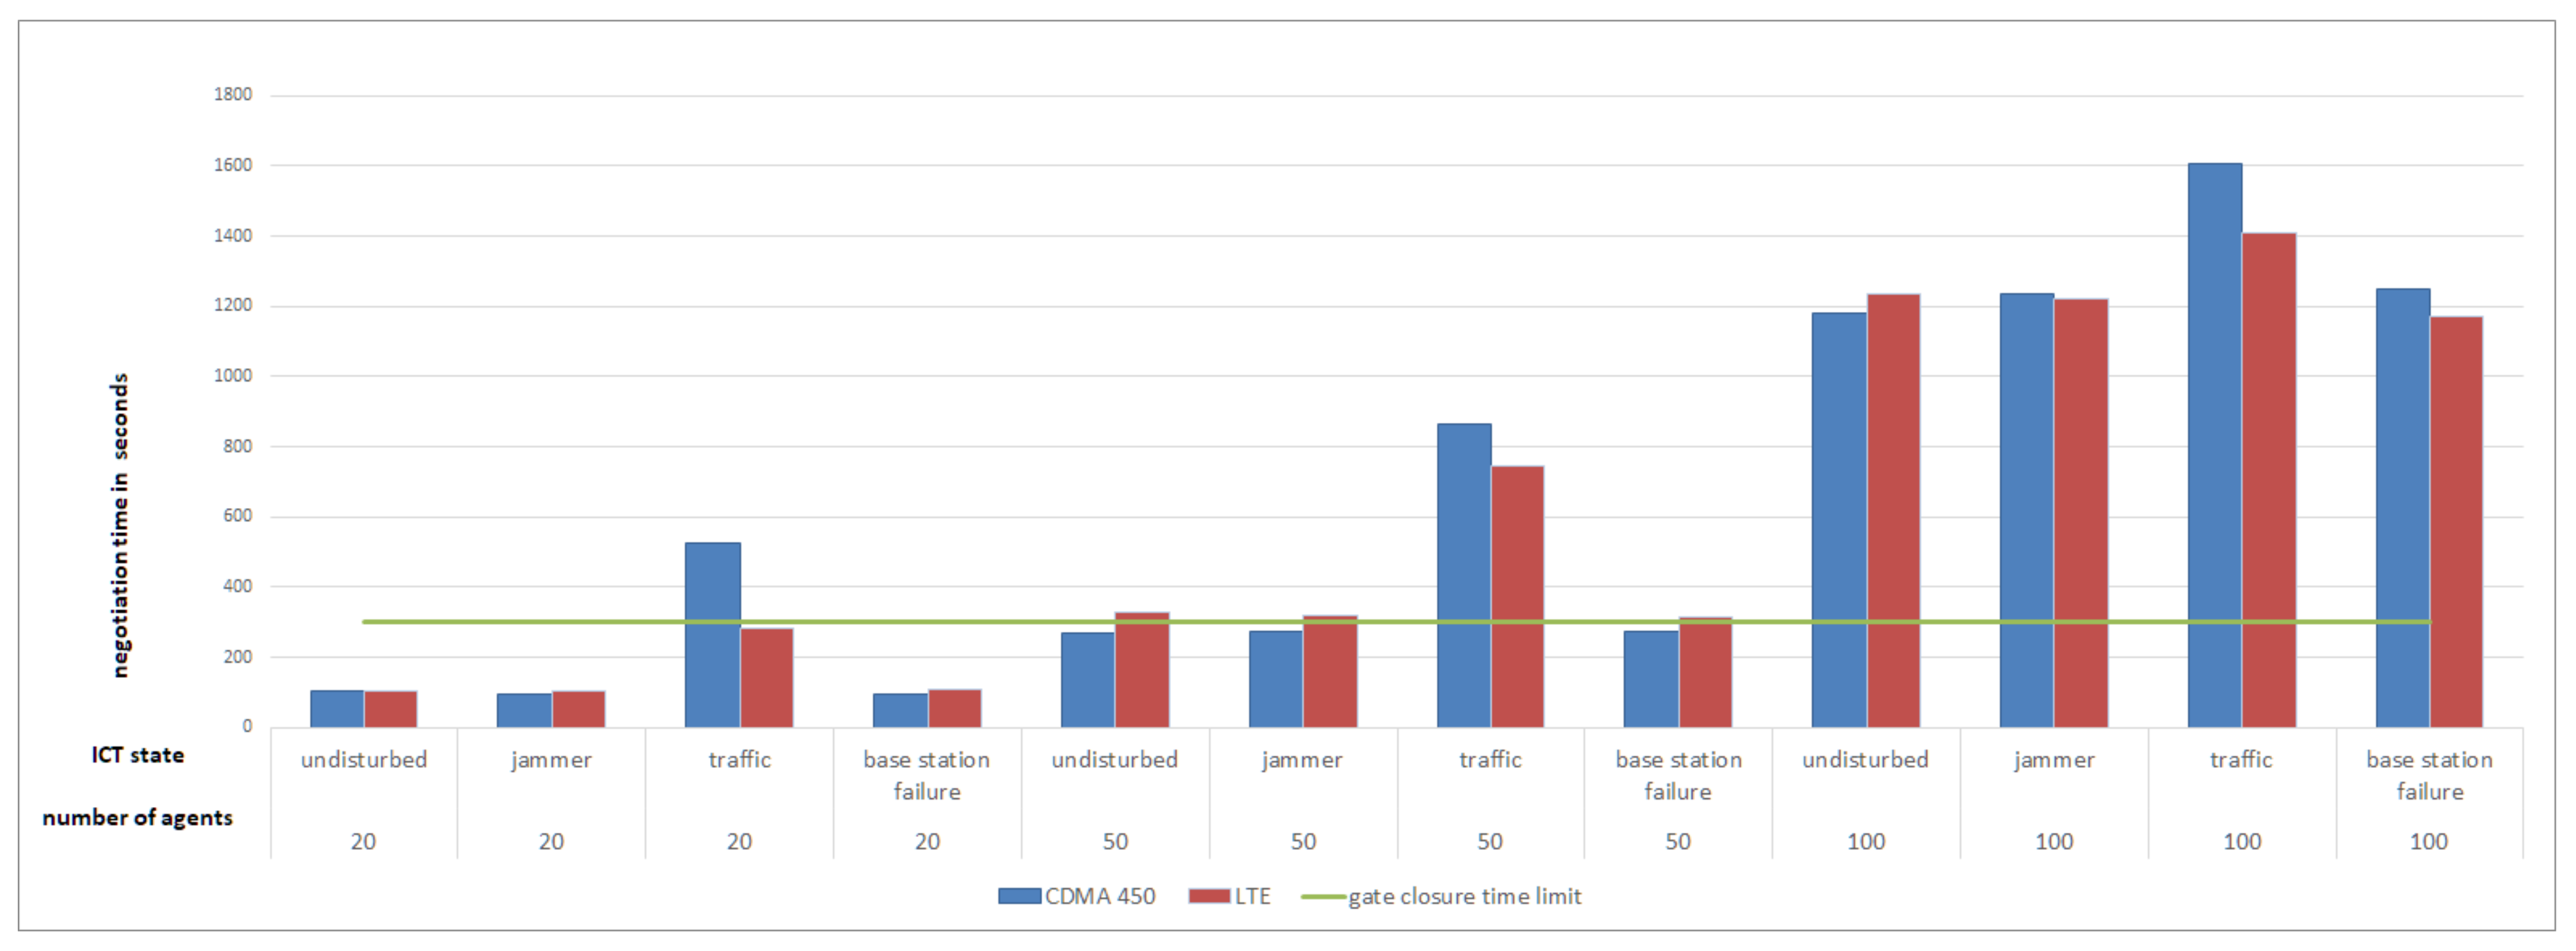
Figure 8 and show the total duration of the negotiations for the different ICT scenarios as a bar chart. The negotiation time also includes the agent-internal calculation needed to find the best schedule for the current operating schedule. Thus, ICT scenarios are rather comparable if they have the same number of agents. For a better understanding, we also conducted the negotiations without communication delay.
Figure 8 shows that the negotiation time for small VPPs (except for the traffic case) is at first concise (2–3 min) and grows with the size of the network. The time limit of 5 min (due to intra-day trading—shown as a green line) is already exceeded with 50 agents for each ICT scenario and is exceeded in most scenarios by 2–3 min and occasionally by 13 min. The negotiation time for 100 agents takes between 40 and 45 min until an optimal solution is found. As shown in
Figure 7, the effects of traffic are more pronounced in small VPPs with CDMA 450 than with LTE and the traffic in LTE and CDMA 450 is reflected in medium VPP. The disturbed ICT scenarios jammer and base station error have less effect on the negotiations than the disturbance traffic.The comparison with the no-delay shows that the latencies of the undisturbed and little disturbed scenarios (jammer and base station error) have little influence on the negotiation. In the traffic case, the difference becomes more noticeable—especially in the scenario with CDMA 450 and 20 agents where the negotiation time takes about 4–10 min longer compared to undisturbed communication. In negotiations with 100 agents, there is little difference between the scenarios with undisturbed and disturbed communication, and with negotiations without delay.
The solution quality is calculated by the distance from aggregated MAS solution to the target schedule (see evaluation criteria MAX and MAE in Equations (
3) and (
4)). It was determined for each ICT scenario. In addition, the MAS negotiations for the ICT scenarios were conducted with a time-out of 5 min, i.e., the negotiation was terminated and the best solution at that time observed. The tolerated deviation of 3% from the product size served as a threshold: if the maximum error lies below that threshold, a feasible solution was found.
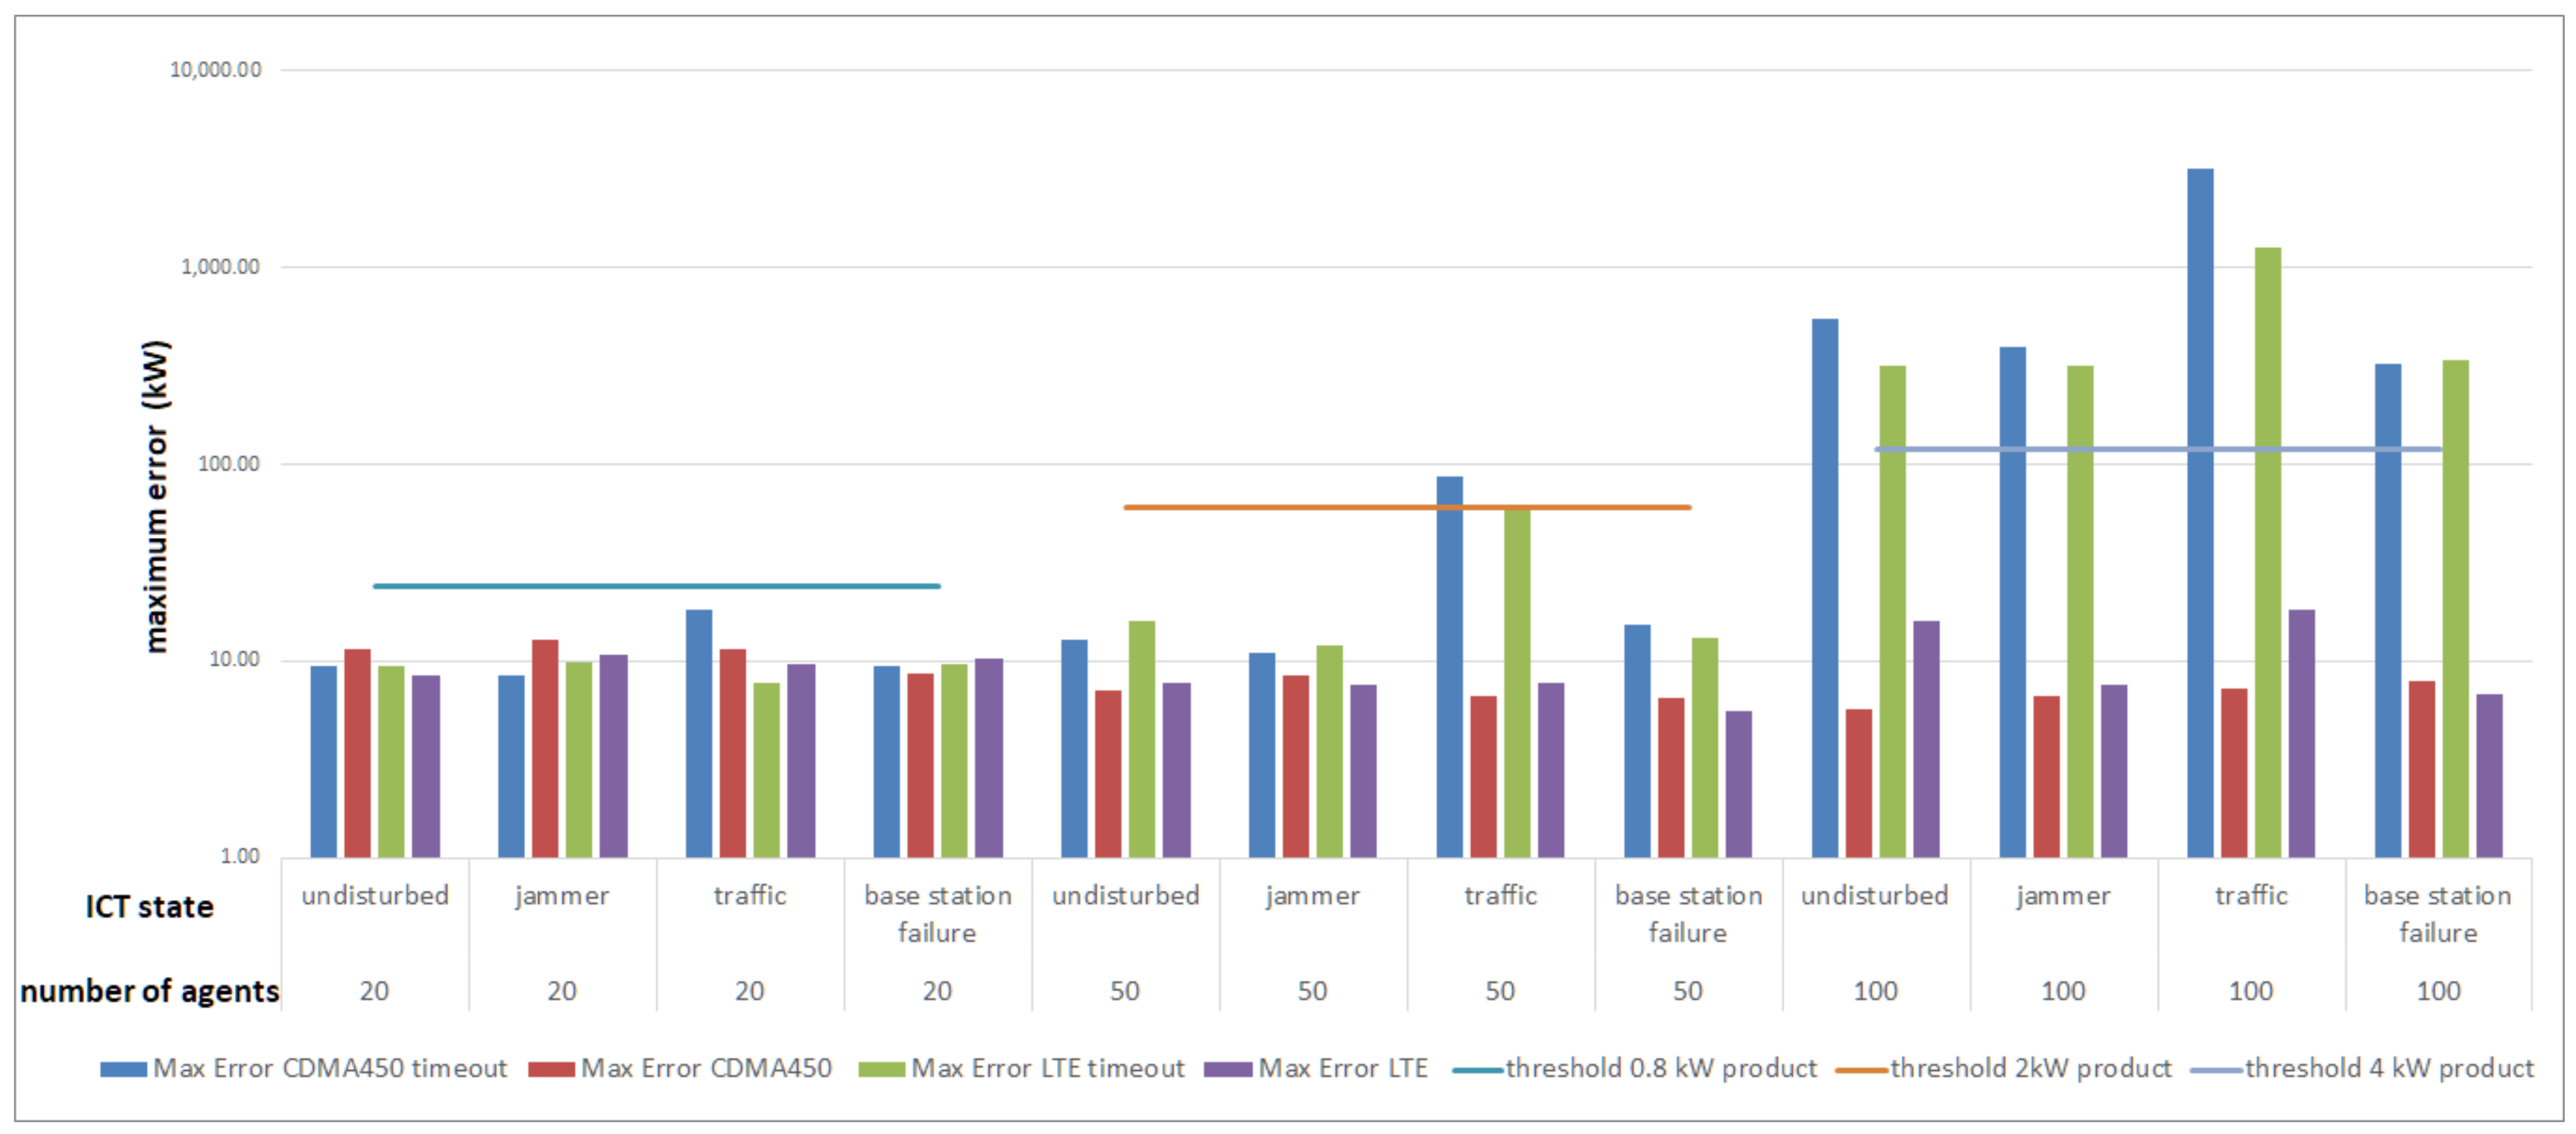
Figure 9 illustrates that due to the sufficient flexibility of the DGs, the threshold was not exceeded if the negotiations could be carried out for an unlimited period of time and thus an optimal operational schedule could be found (without time-out). If the negotiation was timely terminated (with time-out), the tolerance limit for 100 agents was far exceeded as non-optimal interim solutions were used at an early stage of the negotiation. This effect is lower if the unlimited negotiation time is closer to the time-out and therefore, the negotiation is more advanced in the process.
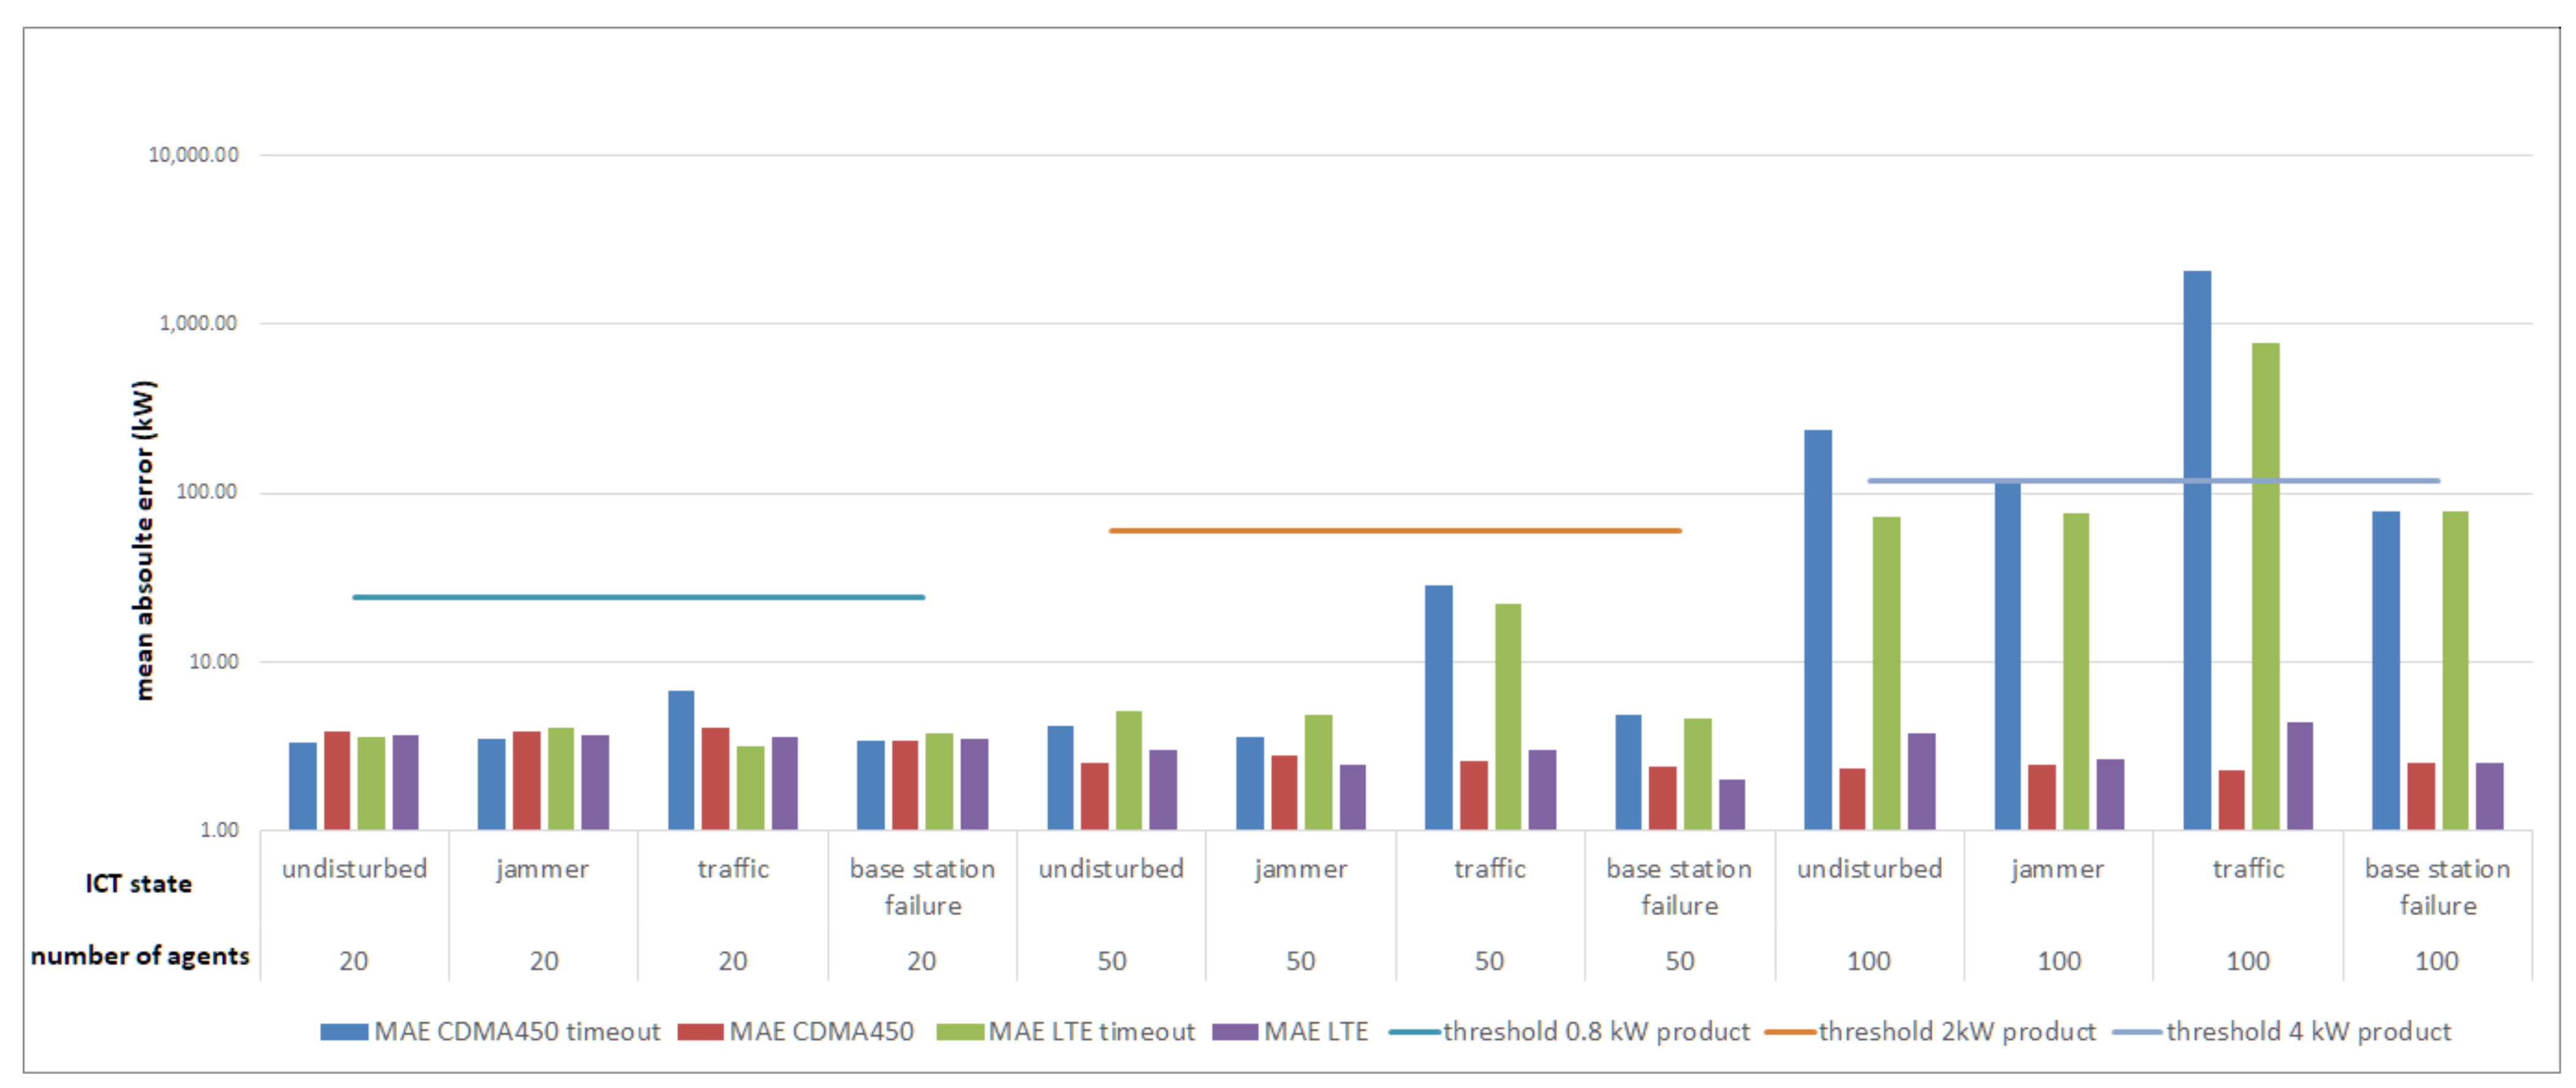
Figure 10 shows the mean error for all ICT scenarios. It is apparent that the tolerance limit in most ICT scenarios is not exceeded when taking the entire rescheduling period into account as evaluation criteria (MAE). Thus, deviations from the schedule in single intervals are more responsible for exceeding the maximum error (MAX). The MAE is exceeded in those scenarios in which the MAX already exceeds the tolerance limit by far.
As a relaxation of the negotiations, we integrated the tolerance threshold in the objective function. This reduces the negotiation time.
Figure 11 shows that the duration is reduced for undisturbed ICT, base station failure, and jammer scenarios in medium-sized networks so that the time limit is not or just slightly exceeded. The same applies to the traffic case with LTE in small agent networks. Relaxation can improve negotiation time for small networks by 15–23% in CDMA 450 scenarios and 19–32% in LTE. In the medium-sized scenarios, the negotiation time improves by 20–49%, whereby the Traffic with CDMA 450 case represents the lower spectrum and undisturbed with CDMA 450 the upper spectrum. In LTE cases, the biggest improvement occurs with jammer scenarios. The greatest improvement in negotiation time is achieved with large networks. Here, the negotiations are 43–55% faster than in the unrelaxed negotiation. However, the negotiation time still greatly exceeds the time limit by 13–21 min.
6. Discussion
We can draw different conclusions on the impact of communication failures on the agent communication and how this affects the VPP’s capability to provide rAS by means of the solution quality and the negotiation time of the MAS.
The results show that a jammer has little effect on the negotiation time, while traffic strongly affects the negotiation time for small VPPs. That occurs especially when the end hosts are remotely distributed and a communication infrastructure is used, which requires few base stations, such as CDMA 450. The broader distribution of base stations also explains the more outliers with CDMA 450. If the end-to-end delay is strongly enlarged by disturbances like traffic, this is also reflected in the simulation results of the negotiation time. With a small end-to-end delay (e.g., in undisturbed or slightly disturbed communication), a difference in communication without delay is hardly noticeable, which may be due to the fact that the effort required to find the most appropriate schedule is much higher in relation and therefore disguises the effects of the communication delay. A direct comparison of the two technologies—LTE and CDMA 450—regarding negotiation time shows a clear difference when considering scenarios with high traffic and small networks or relaxed objective function since the significantly lower delay of CDMA 450 (see
Figure 7) leads to a reduction in the negotiation time. This difference could be explained by the reduced number of installed base stations. Apart from that, the two technologies hardly differ in the chosen scenarios.
The required solution quality (i.e., the feasible deviation between aggregate schedule and target schedule to fulfill the product) could always be achieved with unlimited negotiations because the agents had a sufficient amount of schedules available. If the negotiation was prematurely terminated, the solution quality deteriorated, particularly in those scenarios that required a particularly large amount of time to find the solution in unlimited negotiations. If the unlimited negotiation time is close to the time-out, differences in the solution quality are negligible. The results also show that the deviation from the target in a single interval is more problematic as the deviation is usually much better if it is based on the entire product. Unrelaxed negotiations provide better solutions to resolve congestions than negotiations with a relaxation (tolerated deviations from the product are incorporated in the objective function) or time-out (negotiations are stopped after a certain amount of time). The used tolerance limits for the solution quality refer to the size of the virtual product, i.e., with the choice of a larger product, the tolerance limits would also increase and thus simplify the relaxed optimization.
However, the gate closure to product delivery time limit (5 min) is already far exceeded for medium-sized VPP. This means that a viable aggregated schedule of the VPP cannot be negotiated in time. A VPP operator would have to consider the negotiation time and therefore, might not be able to trade until the gate closure. Relaxation has greatly reduced the duration of negotiations, which would allow a VPP operator to trade closer to the gate closure. For these reasons, we suggest to further investigate how to improve the negotiations between the agents to decrease negotiation time and be less dependent on communication quality. In the case of longer product lengths, planning horizons for negotiations could be split up to archive quicker results for a first valid partial operational schedule. Further negotiations could also be conducted during the product delivery period. However, the disadvantage of this approach would be that unfavorable schedules could be arranged for individual DGs.
The impact of traffic shows that this can significantly increase negotiation times, especially for small VPPs. If the communication network utilization is known and the rescheduling is time-critical, a VPP operator could switch to a central optimization. In that case, the status of the DGs must be requested so that COHDA or other optimization methods such as Mixed Integer Programming (MIP) [
32] can be executed centrally. In other communication or market situations the advantages of fully distributed MAS (e.g., robustness and privacy) might be more important, so that it could be switched back to a fully distributed system.
The duration of negotiations for large VPPs is very high and is hardly influenced by communication delays. As the effects of the traffic case are unexpectedly not reflected in the negotiation duration and the improvement by relaxation is high, we assume that the execution system has problems with the parallelization of the agents and therefore causes the higher negotiation times. In future investigations, the execution setup could be made more realistic by providing each agent with its own computational resources like CPU cores. Results from this execution setup could differ significantly from our results.
Another important factor for achievable solution quality and also for the duration of negotiations is the modeling of flexibility. Here, a simple representation in the form of a set of power time series was chosen, whereby a combinatorial problem had to be solved. Other flexibility representations, see, e.g., in [
33,
34] could allow a better utilization of the actual DG flexibility. They also influence the calculation effort that individual agents have in local optimization and thus also the duration of negotiations. Considering the algorithmic aspects, there is also the possibility to positively influence the duration of negotiations, the communication effort and the quality of the solution by a careful choice or even dynamic adaptation of the exchange topology [
19].
The use of VPP for this rAS market is only determined by the condition that all DGs are located within one grid area, which enables the elimination of transformer congestions. However, it cannot be guaranteed that the determined individual DG schedules do not violate local grid restrictions or that line congestions can be resolved. Such information could be taken into account by agents in their search for schedules and thus becoming more beneficial to the power system. Moreover, we only considered a VPP consisting of CHPS. Other constellations could be investigated to evaluate the effects on solution quality. Furthermore, the usage of heuristics other than COHDA for MAS scheduling could be analyzed.
A more detailed communication analysis would be possible via an integrated simulation of the MAS with the communication infrastructure. Here, the communication simulator acts as a mediator in the message transmission between two agents. The integrated simulation would provide a more realistic simulation of the communication between agents. It would be possible to observe other communication characteristics in more detail during message transmission, such as packet loss and jitter. It also enables simulations to be conducted where communication disturbances occur in the process of negotiation.
7. Conclusions
In this study, we analyzed the impact of communication on delivering a rAS product through the distributed optimization heuristic COHDA implemented by a MAS that controls distributed DGs within a VPP. For this purpose, we modeled the communication technologies CDMA 450 and LTE and integrated different failures: base station failures, congestions by increased traffic, and interferences triggered by a jammer. We conducted communication simulations to derive end-to-end delays between different agents. These delays were integrated into the negotiations of the MAS for the scheduling of a VPP in order to fulfill a rAS product (here, to solve congestions in the distribution grid). We determined the impact of communication failures on negotiations using different VPPs and product sizes, and considered the negotiation time and solution quality as evaluation criteria as required for product delivery in the rAS market.
We see the approach of providing rAS by DGs using MAS as a promising approach as it can yield a good solution quality and utilizes the potential even of small DGs for power grid stabilization. However, the negotiation time has to be improved so that the temporal requirements of rAS can be guaranteed. Moreover, it should be possible to reliably estimate the negotiation time. The VPP operator can then evaluate which products the VPP is capable of offering on rAS markets. We assume a reduction of communication or negotiation time can be archived by, e.g., the dynamic adaption of the exchange topology and the demand-driven switching to central optimization.


