1. Introduction
Additive manufacturing (AM) is the industrial production name for 3D printing, which is a potential technology for the future. 3D printing, since it was invented, has been a revolution in the manufacturing industry. It is regarded as the next-generation manufacturing solution for a broad range of applications from individuals to industry [
1]. It is probably suitable for making products by a homogeneous material in an additive technique. We can find various applications and materials such as metal, plastic, and even concrete [
2,
3]. The advantages of 3D printing technology have emerged in areas where conventional manufacturing is limited. This technique promises for many complex structures which can still be highly light and reliable [
4]. In the early stages of AM, it has been mainly used for design validation and prototyping. However, nowadays, it is supported for an extensive range of applications, from common things, such as electronics units, to complex products, such as food, houses, and even living tissue. The contribution of 3D printing is still rapidly increasing in the industrial market year after year. It is proven in the Wohler report (2017) that the related 3D industry grew by 17.4% in 2016, compared to the worldwide revenues in 2015 [
5]. With its excellent applications, 3D printers have received significant attention in producing development as well as in the field of research [
6,
7]. Increasingly more ideas for developing and innovating 3D printing technology in an era of high technology prospects such as Fused Deposition Modeling (FDM) [
8]. FDM is becoming increasingly popular, mainly due to the lost investment cost and its ease of use. It allows producing 3D products with different geometries in a short time [
9]. For these reasons, it started as a prototyping process, but today it is mainly used to manufacture end use parts. However, it has some limitations, such as the material range and the anisotropy of the product [
10].
Along with the guarantee of quality and cost of the printed product, energy efficiency is of the utmost importance. Power consumption is a key challenge for the manufacturing cost-cutting objective. Especially, once on-demand production shifts toward portable devices, power management and optimization will attract more attention. Previous research reported that power consumption takes 32% of product expense in 3D printing as shown in [
11]. The problem of
“how to optimize the energy consumption of 3D printers?” is attracting increasingly more attention [
12].
Although the issue of energy optimization is extremely important, previous studies have not been commensurate with its importance. The limited works focus on analyzing and optimizing power consumption in the 3D printer. Recently, several instruction-level models were introduced to estimate the power consumption [
11,
13]. The energy cost during the fabrication process was analyzed by an energy profile, and the G-code instruction-level energy model was built. It was reported that the overall energy reduction of 25% could be reduced by a cross-layer energy optimization solution. Other studies were also conducted to inspire a carefully concern of energy management in 3D printer [
14,
15,
16].
Motivated by the above issues, we focus on the power and energy consumption characteristics of the 3D printing process based on the experimental result. Then, we propose a simple and compact energy model as a function of the printing time and temperature. The analysis results show that the proposed provides accurate enough result compared to the previously introduced instruction-level model without a complicated analysis of the G-codes.
The contribution of this paper can be summarized as follows:
- (1)
We investigated the power of components given by measurements on commercial 3D printers.
- (2)
A compact model was built to estimate the energy of 3D printers and proposed an energy-saving strategy, primarily focused on the heating process.
- (3)
We separated thermal plates into two independent temperature sections to cut wasted energy costs when printing specially shaped objects and small prints.
- (4)
The printing process was installed at high ambient temperatures to reduce power dissipation.
- (5)
We did experiments and results showed that our method reduces 23% of total power consumption in comparison to the current commercial device.
The rest of this paper is organized as follows. In
Section 2, we briefly summarize previous works related to the analysis of energy in additive manufacturing. The power consumption in the main components of the 3D printer is investigated in
Section 3. In
Section 4, we propose the macro model of 3D printer energy consumption that would be experimented in
Section 5. At last, we conclude the work in
Section 6.
2. Related Works
Energy efficiency is an essential factor in the manufacturing industry, and with it, energy consumption is closely related to the cost of the product. However, according to the literature survey, there is a little research focusing on energy consumption in 3D printers. Several academic studies have been worked on energy utilization in 3D printers [
13,
15,
16]. For example, J.Ajay et al. investigated the printing cost, taking into consideration the material and energy usage in the 3D printer [
11]. They stated that the electricity used in the 3D printer takes a considerable portion of the printed product cost by 32%. Later, an instruction-level model was built in [
13] to analyze and optimize the consumed energy in the 3D printing process. In this work, they described a solution to mitigate the energy consumption based on extending the compiler, firmware, and hardware. The compiler operates the stereolithography file and creates a tool path file, named G-code file. The G-code file includes a series of instructions to deliver the printing process. The firmware on the 3D printer performs the G-code file and produces corresponding control signals to the hardware. The hardware of a 3D printer operates following the control signals such as the stepper motors, the heater and the cooling fans.
The power usage of the 3D printer was estimated in [
14] which took into account the environmental impact. From the insight obtained by energy analyzing, a methodology for multi-objective optimization was given to support decision-making. The study by Tao Peng and Fei Yan [
17] concurrently investigated the power consumption and the surface quality on the FDM printers. Some impact factors were considered to assess their influence on the printing energy as well. Kim et al. [
18] studied the effects of fabrication parameters such as the distance between nozzle and substrate, inflow speed of filament material, and moving speed of heating nozzle on the FDM-fabricated line figuration. They considered the extruded line figurations such as thickness, width, and cross-sectional shapes. They also based on the experimental results to find the line fabrication’s experimental formulations for the fabrication parameters. The effect of line fabrication distance on the surface roughness was also evaluated.
A measurement of energy in additive manufacturing was implemented to identify the dominant-consumed factor [
19]. By analyzing the energy consumption of the Selective Laser Sintering (SLS) process, a variant of additive manufacturing, it is reported that the dominated energy usage depends on the operating time, particularly for cooling and heating process. R. Paul and S. Anand presented a mathematical analysis of the energy required for the selective laser sintering process [
20]. They provided the function of total energy following the total area of sintering and then proposed an optimizing model to minimize the energy required. G Strano et al. [
21] investigated a methodology for energy consumption reduction in conjunction with increasing the surface quality in SLS process. For their purpose, the models for the surface roughness prediction and the energy required are developed for multi-objective optimization.
In another related research [
22], Y He et al. provided a tool to evaluate the energy utilization of numerical control machining, a similar structure to the 3D printer. The authors made a comparison of energy consumption between the estimated value and the actual value to help redesign an energy-efficient control code.
S Walls et al. [
23] presented the evaluation of energy consumption for a lower cost 3D printer. They reported that heating efficiency contributes the greatest portion to the total energy consumption. T Kamps et al. presented an approach for analyzing the cost and energy efficiency for additive manufacturing [
24]. They suggested the integrated models of cost and life cycle assessment for gear manufacturing to determine the influenced factors on cost and energy consumption. A simple model for the estimation of the energy requirement in the manufacturing process is proposed in [
25]. Gutowski et al. suggested strategies to reduce the energy usage by redesigning the support equipment. An analysis of 3D printed product in terms of cost, sustainability, and surface roughness quality was introduced by Yalun Li et al. [
26]. The authors computed the printing cost, the environmental impact, and measured some parameters for such analyzing purpose.
A study [
27] by Dimitris Mourtris et al. proposed a method to estimate the energy consumption based on the real-time measurement for machining processes. By collecting the parameters from the sensor system, the human can modify them for the target of energy reduction in the new cases. Jun Xie et al. conducted an integrated model to predict the specific energy consumption of manufacturing processes [
28]. Their model takes into consideration the influence parameters and was experimented under various machining conditions to validate its accuracy and feasibility. X. Luan et al. presented an energy analysis of the machining process in case of non-cutting status [
29]. An energy model was established to predict the power consumption, from that the energy-saving strategies can be adopted.
S Meteyer et al. introduced a model of energy and material usage in the Binder–Jetting (BJ) process [
30]. They conducted the test printings to validate the accuracy of the model with various width, length, and height of machines. Likewise, for the BJ process, Xu et al. presented a model based on the mathematical analysis to find out the relation between energy consumption and physical part [
31].
The previous studies proved that the issue of energy optimization needs further research. In this study, we propose a compact energy model to optimize the energy based on the delivery of temperature of printing area.
3. Power Consumption of 3D Printer
This section focuses on 3D printers using the FDM printing mechanism. The FDM technology is the most popular thanks to its advantages of lower cost, fast fabrication, broad range in materials, and accessibility [
17,
32,
33,
34].
The 3D printer is formed of two main parts: cyber and physical, in which the physical part is a majority of total electricity utilization. The cyber part refers to the hardware and the software which is related to the controller. The physical part includes stepper motors, heaters heatbed, and cooling fans. The stepper motor and heating systems are the power-hungry components. Previous studies show that the energy dissipated by auxiliary components is negligible [
13,
14]. The trend of saving manufacturing energy drives us to make aware of consumed portions and overall 3D printer as well.
3.1. Motors
The printing process creates the artifact layer-by-layer by the support of nozzle movement and extruder through the system of four stepper motors. The alternate coordination of X- and Y-axes motors ensures horizontal moving, the Z-axis motor ensures vertical moving, and the extruder motor plays the role of material supply. Note that at the time, there is only one motor of the horizontal moving system is enabled to the power supply, that means X motor is turned on and Y motor is turned off and vice versa at the same time depending on the direction of nozzle movement.
Figure 1 shows the sample measurement of stepper motor power consumption. This sample is partly extracted from one stepper motor in the printing process. The current of each motor is measured by a current sensor that is used for power consuming calculation. We attempted tests with different conditions, but the results of the stepper motor power are similar. Here, 1000ms of printing sample is extracted. In this case, the sample is set with the standard condition, ambient temperature at 25 °C, and motor speed at 3000 rpm. As we can see, the average value is around 3W and no change over time.
A recent study proposed a dynamic power gating technique based on the moving angle of the nozzle [
13]. Intuitively, we can see that the power consumption of the properly designed X-Y motor setup will be not that much different as long as the speed of the nozzle is a constant. In this context, when possible, the proposed method selectively turns off the motor in each axis to reduce the power consumption in run-time. However, even if the motor in a certain axis does not move, we cannot turn off the motor because of the following reason.
The stepper motor can maintain the position until the load does not exceed the holding torque. The holding torque is the amount of torque required to move the rotor one full step with the stator energized. We can observe a small magnetic force between the permanent magnet and the stator without power in the windings, which is called the residual or detent torque. We can overcome the residual torque and line up the rotor to the stator field by applying a steady direct current (DC) signal to one stator winding. It is known that the amount of the residual torque is about 1/10 of the holding torque.
The stopped motor does not only move but also need to hold a position. Without power, the capability of the axis system to hold a position is only 1/10 of the powered holding torque. Therefore, the selective power gating of the motor may result in a vulnerable axis system to hold axis alignment with the existence of vibration as well as the inertia of the moving parts.
3.2. Heaters
The heaters in the 3D printer refer to the sub-components which undertake heating and melting functionality. They include two primal units: the heater is fixed in the nozzle to melt the extruded material, and the heatbed plays the role of object holder to avoid sudden shrinking. These represent dominating components for energy dissipation that could be potential targets for optimizing strategies.
Notice that the thermal requirement of heaters has an inverse relationship with the ambient temperature. For instance, in winter, the amount of energy for heating is much greater than in summer. This leads to a promising solution to save the 3D printer power that depends on the surrounding environment.
A heatbed is used for the purpose of print quality improving due to it prevent the warping effect by keeping product warm during the whole printing process. During the printing process, the heatbed will be set to the fixed temperature that is lower than the melting temperature of the material. The extruded material will be gradually cooled from out of the melting head that ensures the printing product is not deformed unexpectedly. In addition, the heatbed, in combination with other tools to increase adhesion, will be covered in this article to bolster the ability to fight unwanted effects and improve the printing quality.
However, the power supply of the heatbed is not stable according to the environmental impacts. A difference of temperature between day and night, or the hot day and the cold day, may substantially change the power required for the heatbed.
3.3. Fans and Auxiliary
Despite their relatively low power consumption, the electricity usage of the fans and auxiliary components should be assessed.
The fan and controller units consume significantly less energy relative to other components. Their energy consumption is considered constant throughout operation of system. In our work, we attempted to measure the power consumption of these units in various cases and acquired the result shown in
Table 1.
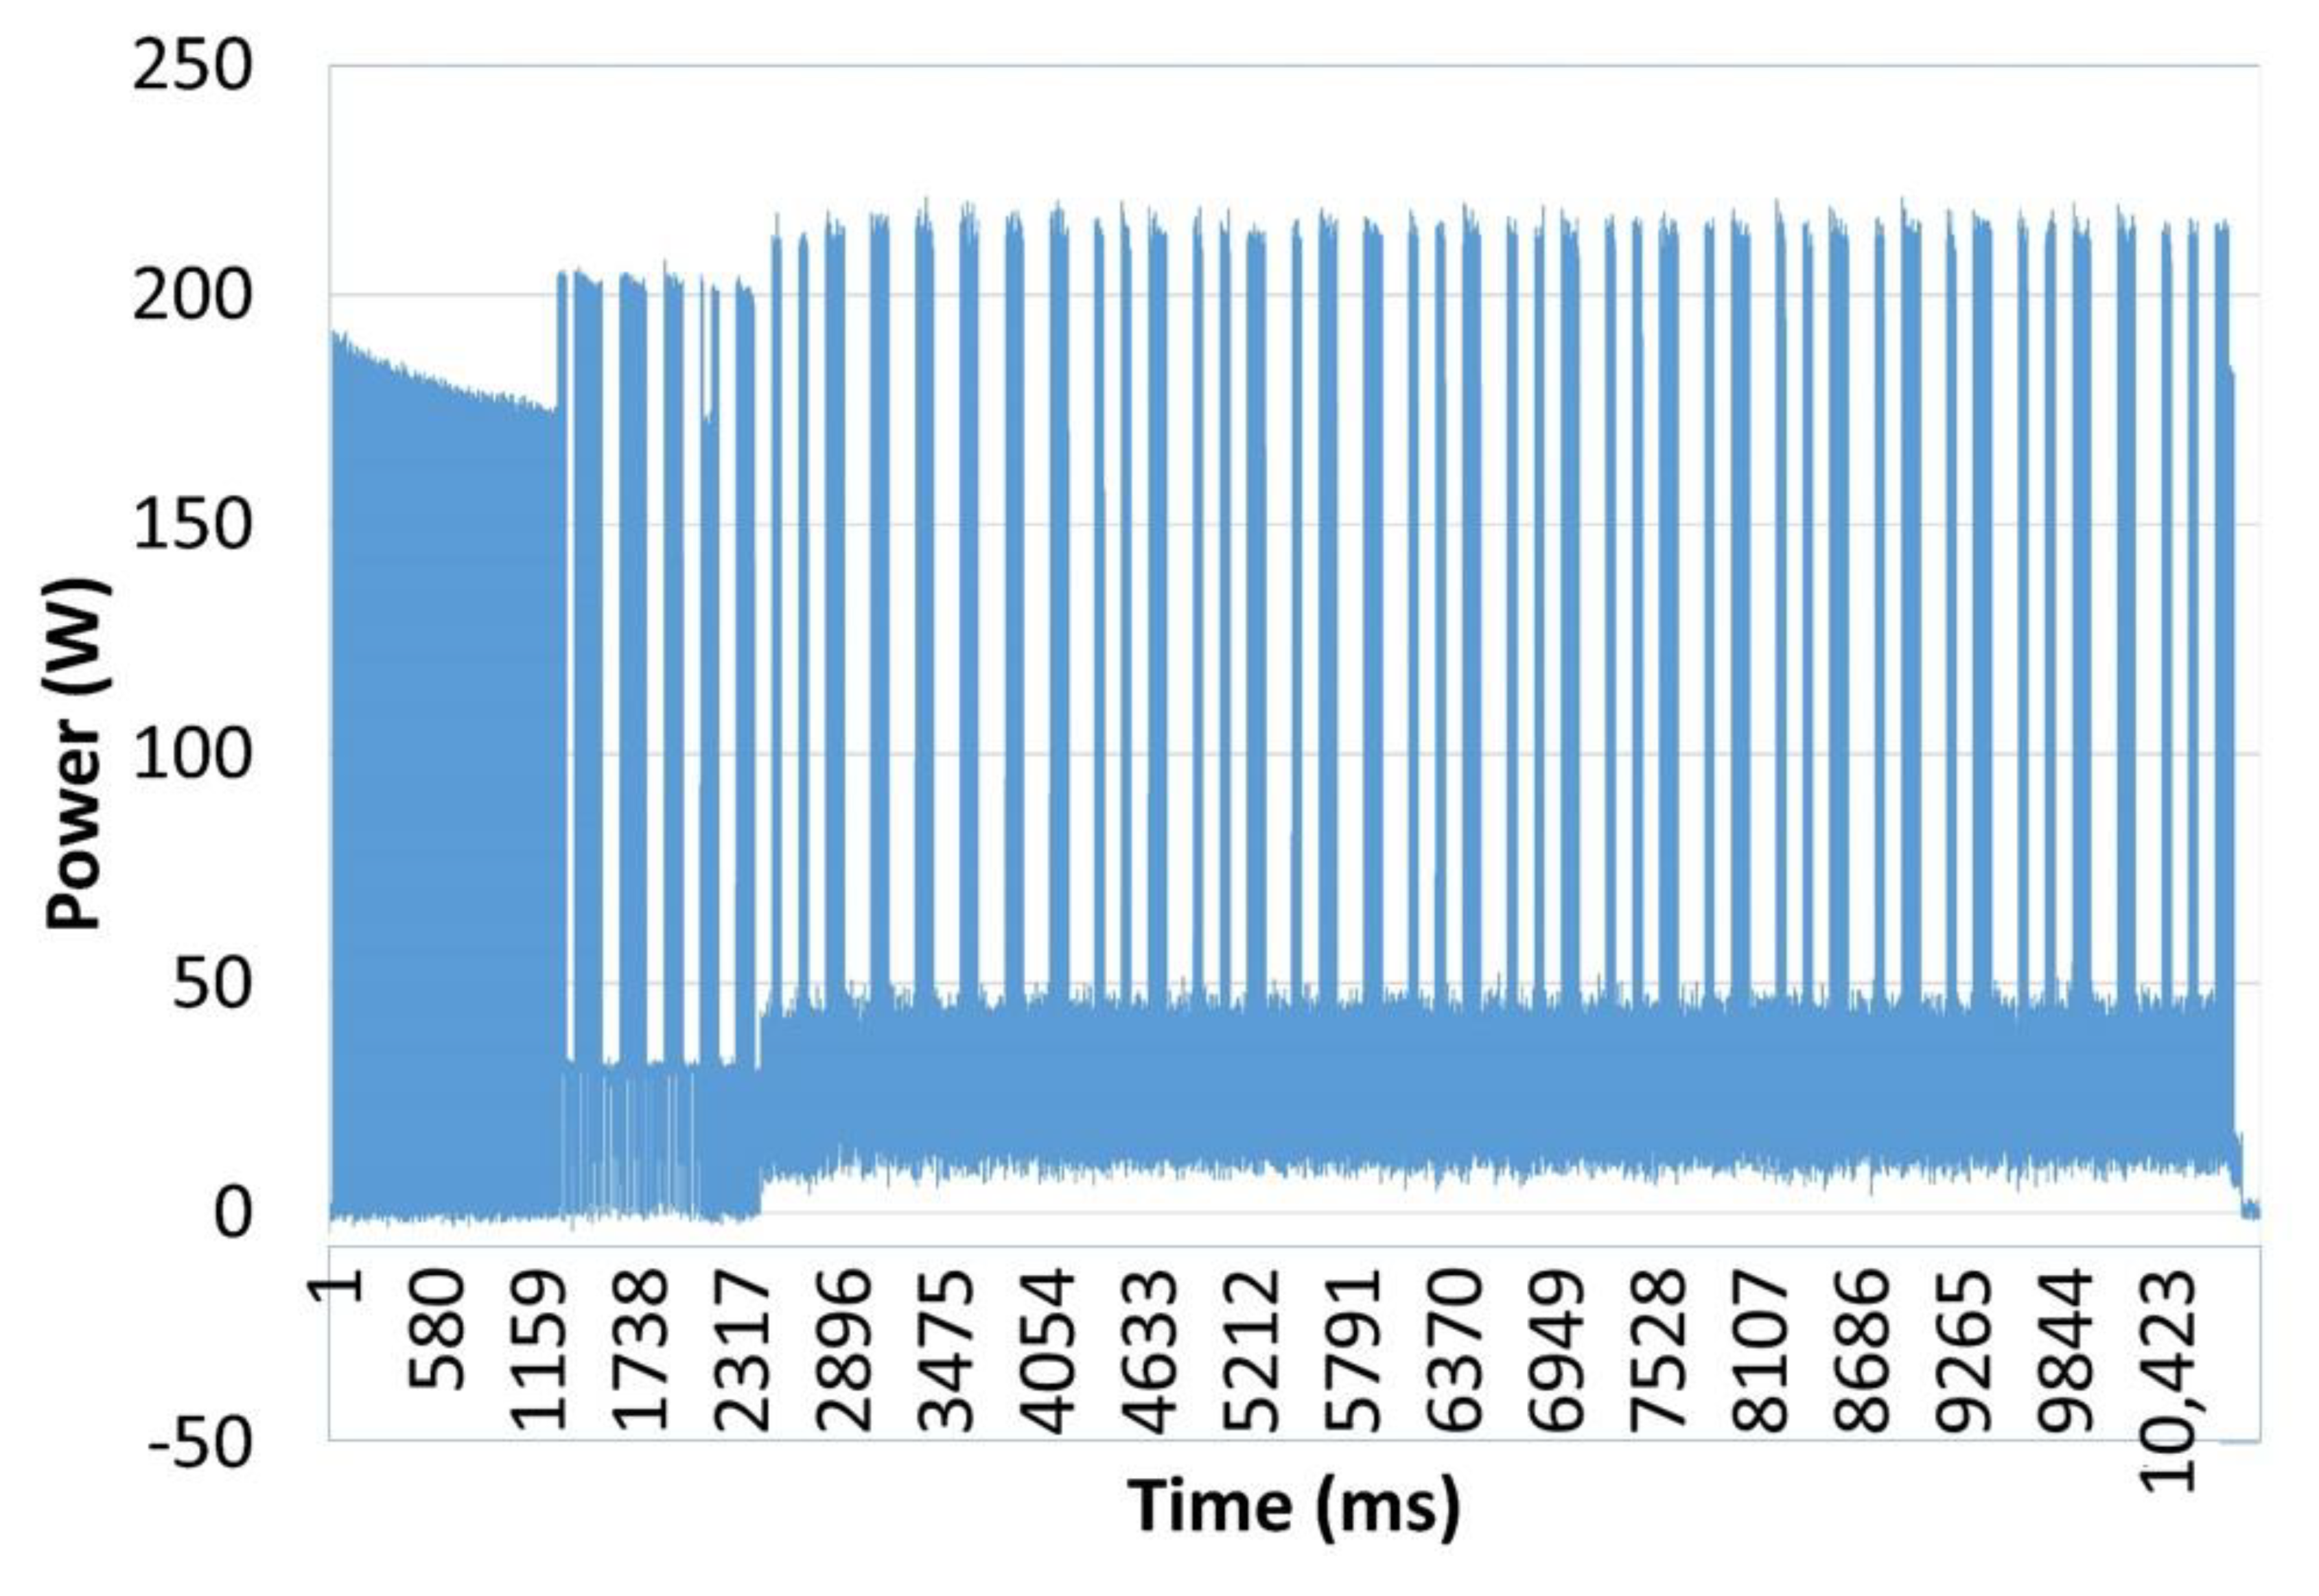
Figure 2 depicts the printing sample. This shows the total power of the printing process. It seems that there is a pulse at the start point when the power is on. However, the abnormal state will disappear when the printing is deployed.
4. Macro Model of 3D Printer Energy Consumption
The overall consumption
is given by
where
,
, and
are the power consumption of stepper motors, heaters, and auxiliary components, respectively.
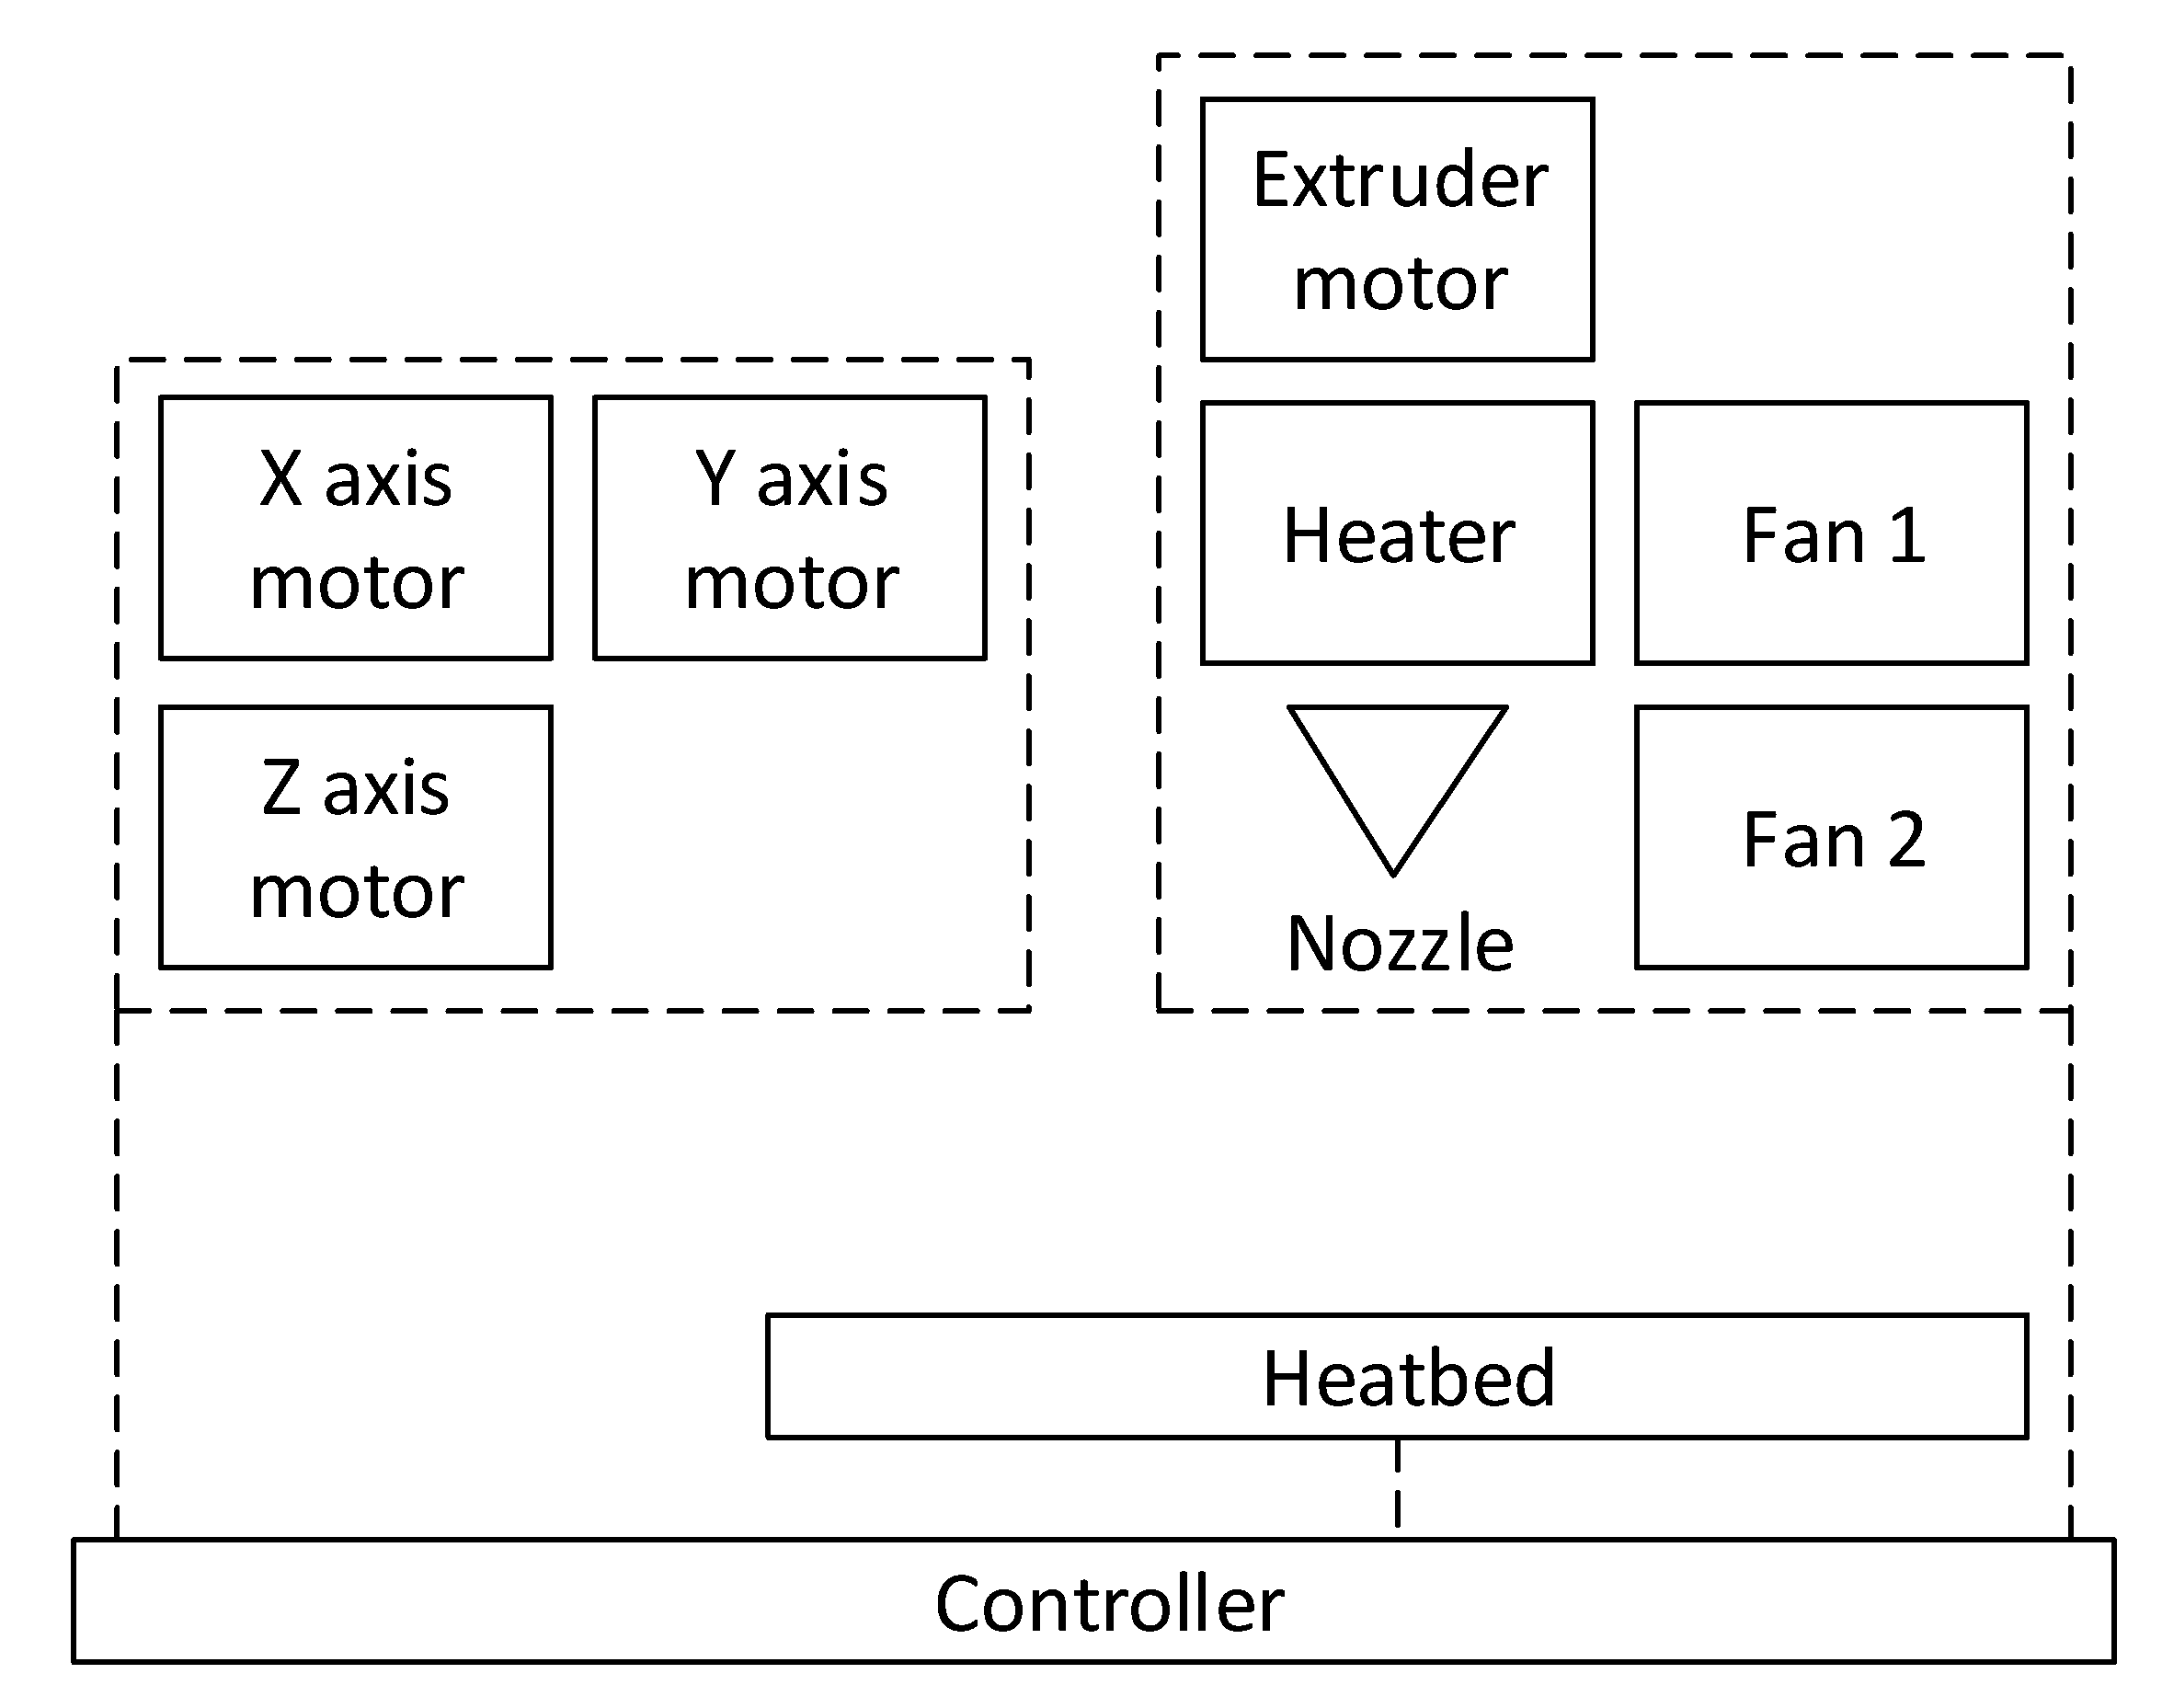
Figure 3 illustrates a structure diagram of 3D printer. The nozzle movement is carried by X-Y-Z motors. The extruder motor is a stepper motor as well, and meanwhile cooling fans 1 and 2 are DC motors which mitigate the overheating of the heater. Another part which uses a lot of energy is the heatbed. The physical parts are all controlled by the controller, the cyber part.
The energy that the stepper motors consumed is denoted as
where
,
,
, and
are the time corresponding to the axis motor X, Y, Z, and extruder motor when they are applied the impulse to active, respectively. In other words, those are the runtimes of each stepper motor.
The energy consumed by X-Y sub-component can be separately calculated as
where
t is the printing time.
is the electric power of the X–Y direction moving system that means as the power of either axis motor X or motor Y. Experimentally, only one motor of this component (motor X or motor Y) is activated given by the certain direction of nozzle movement. Additionally, the power of the X–Y sub-component is the same at any time due to our model is symmetric.
Note that the extruder motor is always activated during the printing process, so it is inferred . Besides, as aforementioned, the stepper motor still consumes a little power for holding position even when it does not move. Thus, for simplification, we assume that , but it is not significant to effect on the overall consumption.
The energy consumption of the stepper motors can be described again as
The energy of heaters is computed as
where
is the waiting time of the heaters when they are set and wait to reach the target temperature. By some printing tests, we estimated that the waiting time is unnoticeable and can be ignored (it only takes around 1–2 min). With some bigger and special 3D printers, it may take a longer time to reach the set point temperatures, but compared to the whole time of printing, it is insignificant. Moreover, commonly, the required temperature of heaters is not too high to reach.
is the power of melting head which is commonly fixed following the thermal characteristics of filament.
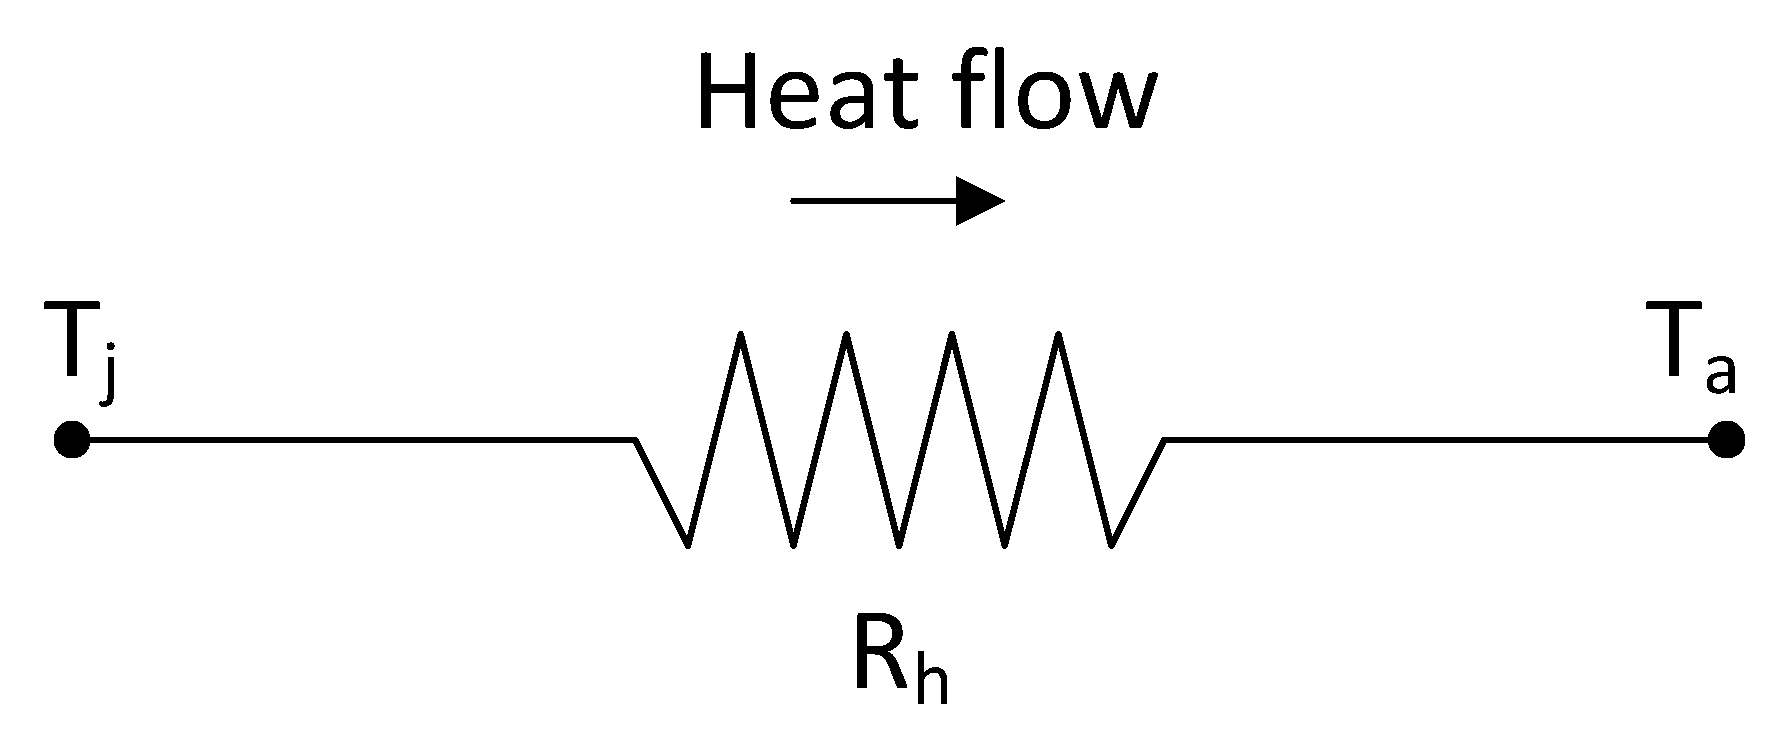
is the power of heatbed which is a variable quantity depends on the ambient temperature. In nature, the heatbed and heater are performed as the thermal resistance, as shown in
Figure 4, in which its power is derived from Fourier’s Law:
where
and
are the target temperature and ambient temperature, respectively.
and
are thermal resistances of heatbed and heater that can be computed as
where
is the length of the conductor,
is the effective cross-sectional area, and
is the thermal conductivity [W/m·K] which can be obtained from heatbed and heater datasheets.
The energy of the auxiliary is mainly formed by the fans and controller which can be calculated as
where
,
, and
are the power of cooling fans and controller circuit, respectively, which are constants, as aforementioned. The fan for the heater is always turned on during the printing process, but the fan for the extruded material is usually activated later than when the target temperature is attained.
The overall consumption can be simplified as
The printing time can be formulated as
where
and
are the time intervals for
-rapid and
Z movements, respectively.
and
are the length and the velocity of
-rapid movement, respectively. The rapid movements can be easily calculated from G-code files (instruction G00). Take into account that
is the total part height H as it is the sum of all layer thicknesses. Time intervals for Z-movements can be neglected, but they can also be easily calculated as described above (=part height/
speed) and by
Z variation (layer thickness) in G-code files.
The length of movement
L is computed as
where
,
correspond to the coordinates of the
and
statement, which is taken out of the G-code.
v is setup velocity for nozzle movement, while n is the number of moving statement in G-code. A list of parameters used in the model is given in
Table 2.
5. Experiment
In our work, we conducted an experiment on Rexbot-3D OC-120. The current signal of the motors, heater, heatbed, and other auxiliary components are separately acquired by current sensors. Then, the results are acquired using NI’s Data Acquisition (DAQ) system.
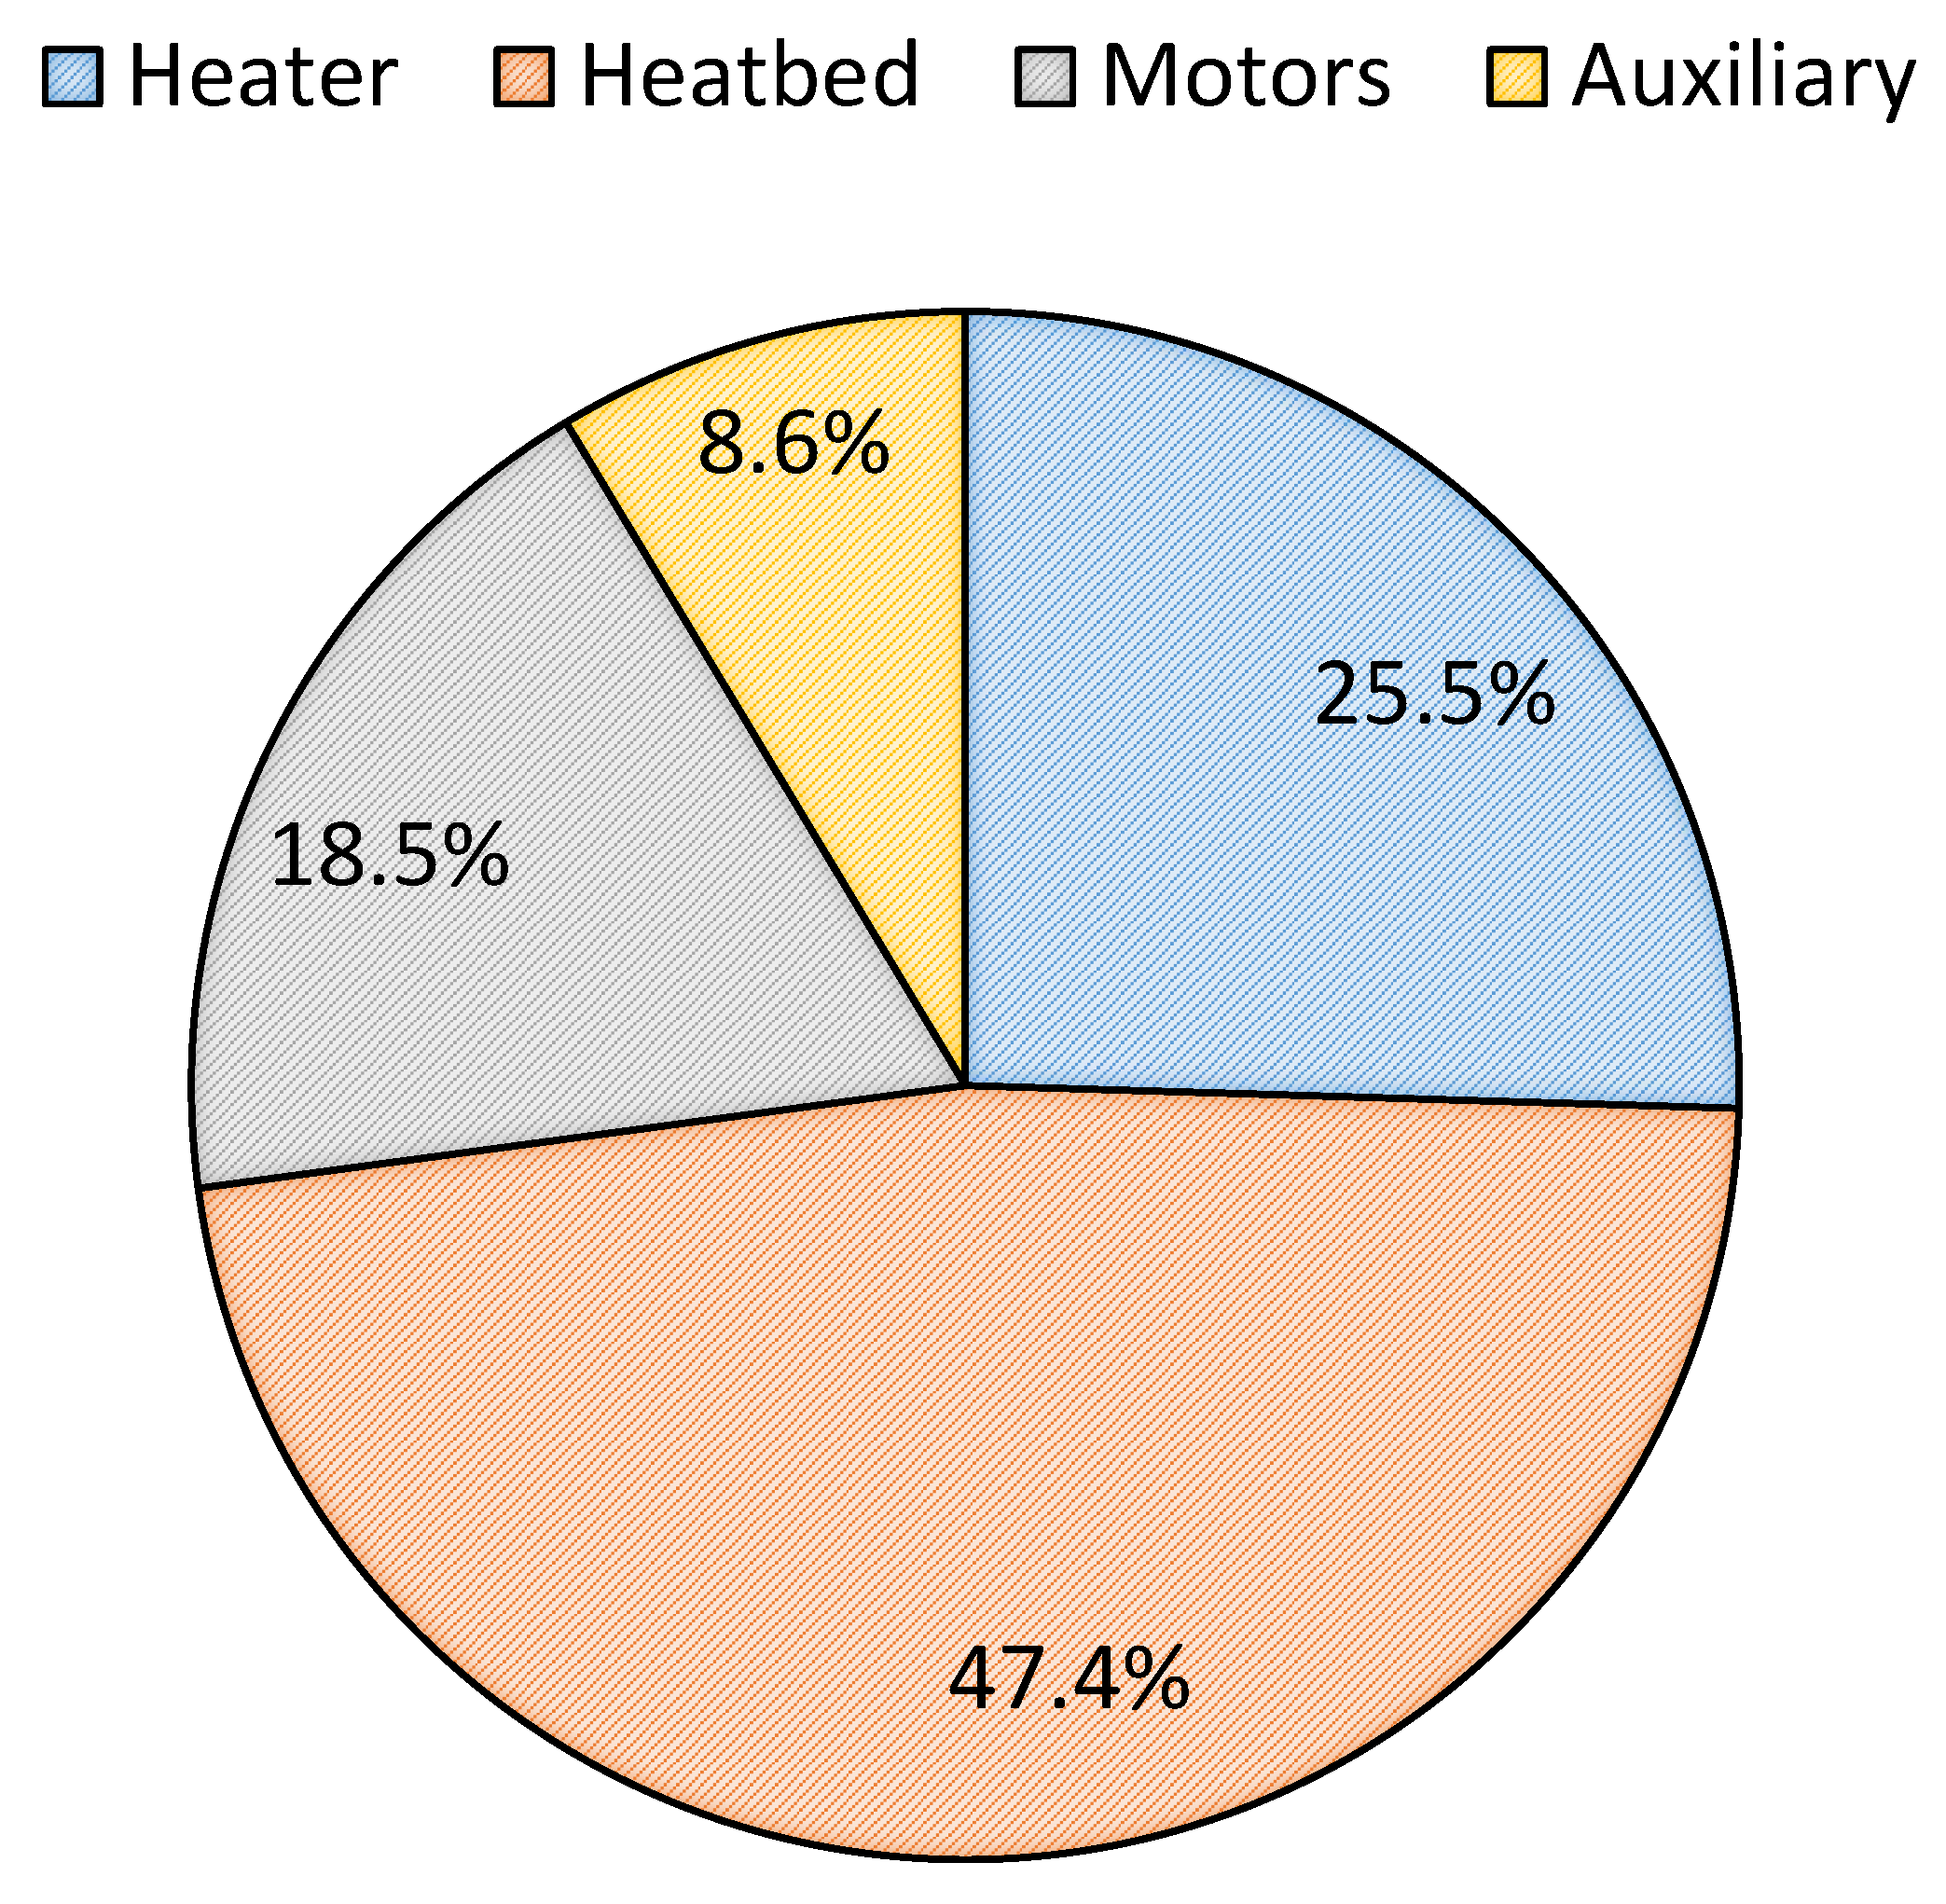
By separately measuring the power utilization in the printing process, the distribution of 3D printer power in partial as
Figure 5. As shown, most power consumption belongs to the heatbed. This indicated that our strategy, which focuses on how to reduce the power consumption of the heatbed, is clear-sighted.
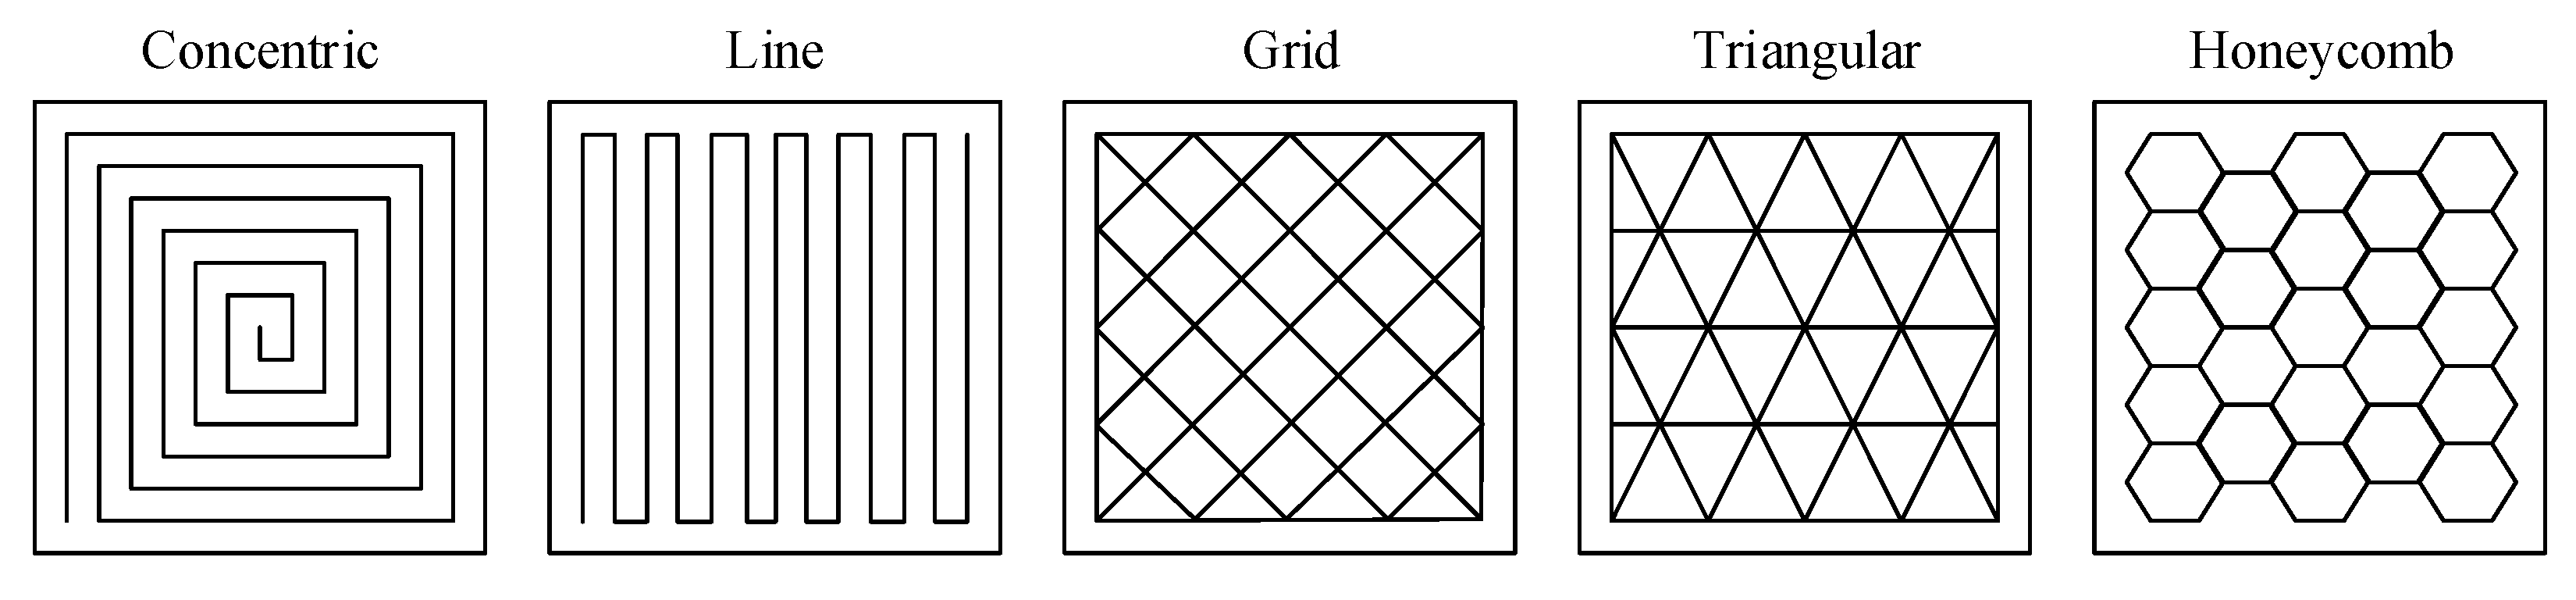
In the printing design, the in-fill pattern is used to fill a shape which directs the path of nozzle movement. There are many patterns which are chosen to produce the article in terms of mechanic strength, printing time, material cost, and even personal preference.
Figure 6 illustrates the trajectories of some typical patterns with specific advantages of each for the strength of object or cutting manufacture cost. The in-fill pattern is an important factor in 3D printer technology which affects the product quality and cost. However, in this work we focus on the energy problem; the impact of in-fill pattern design is not significant.
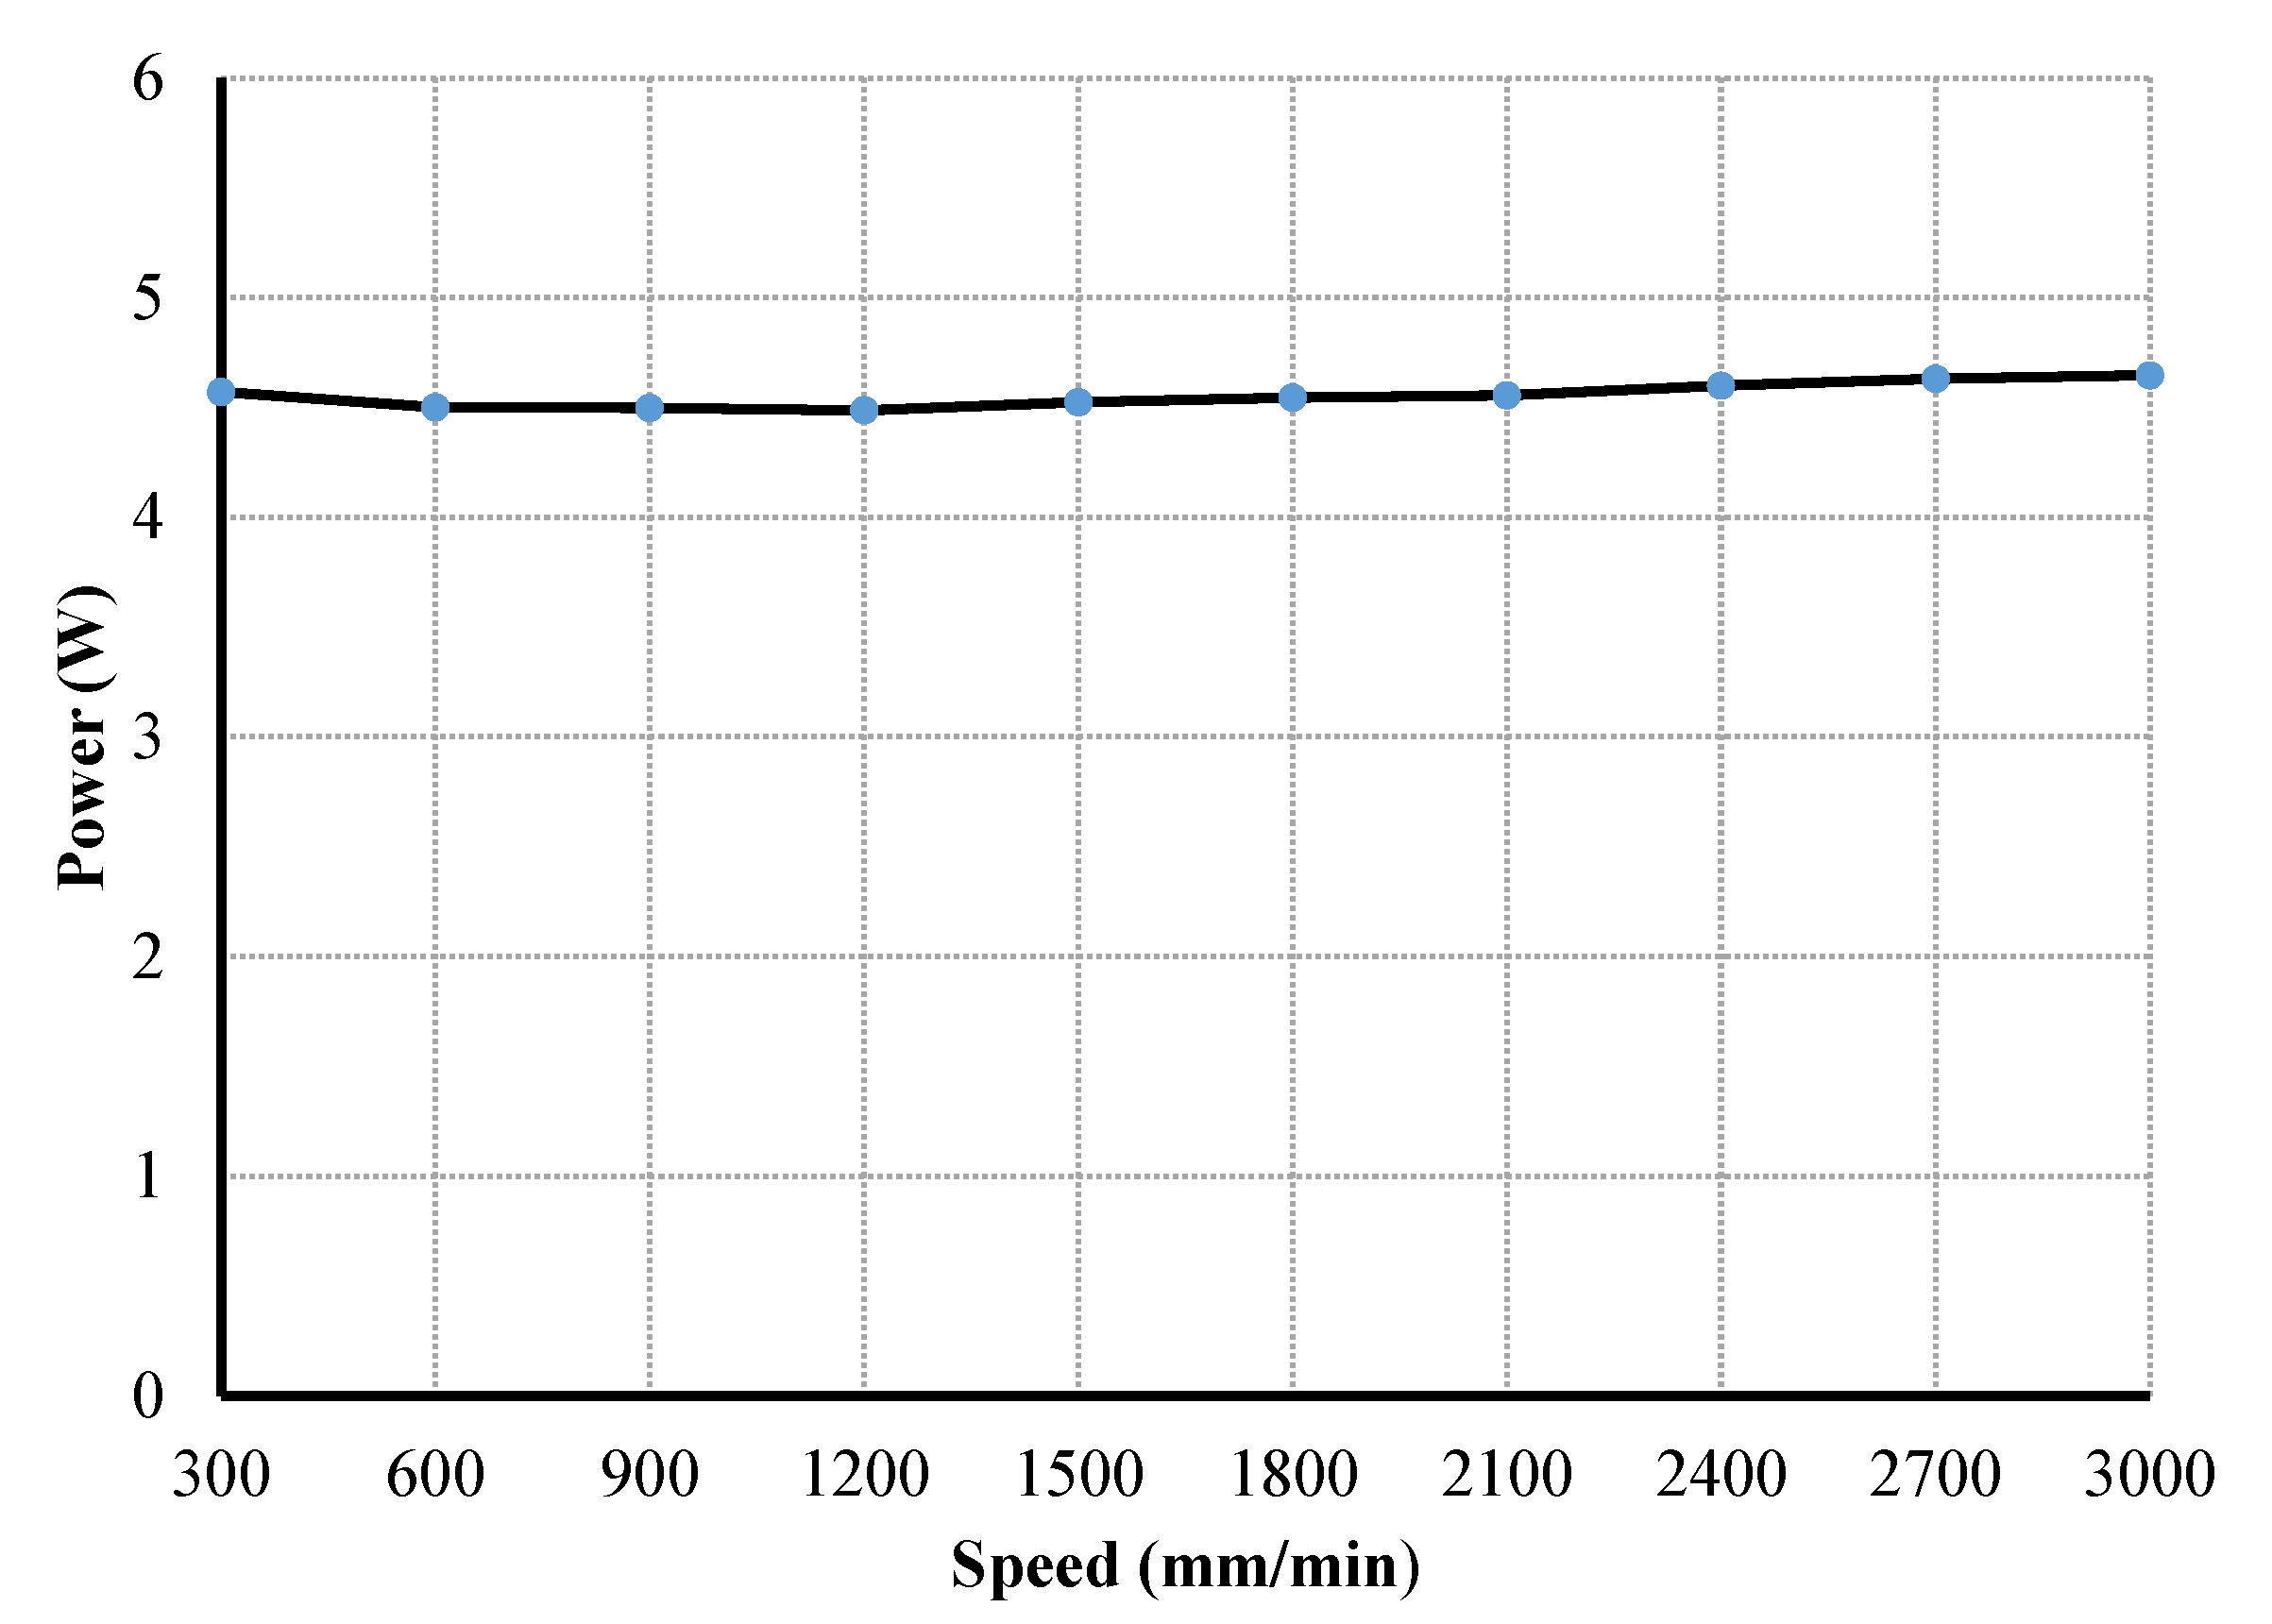
First, we execute a measurement of impact parameters of power consumption related to printing movement. The asymmetric sample is employed in some cases of different printing velocity in which the in-fill pattern use the concentric type. By keeping the object direction at 0° for that sample, we acquire the curves that indicate the variance of power according to movement speeds. As in the illustration in
Figure 7, the disparity of power in almost cases is hardly noticeable.
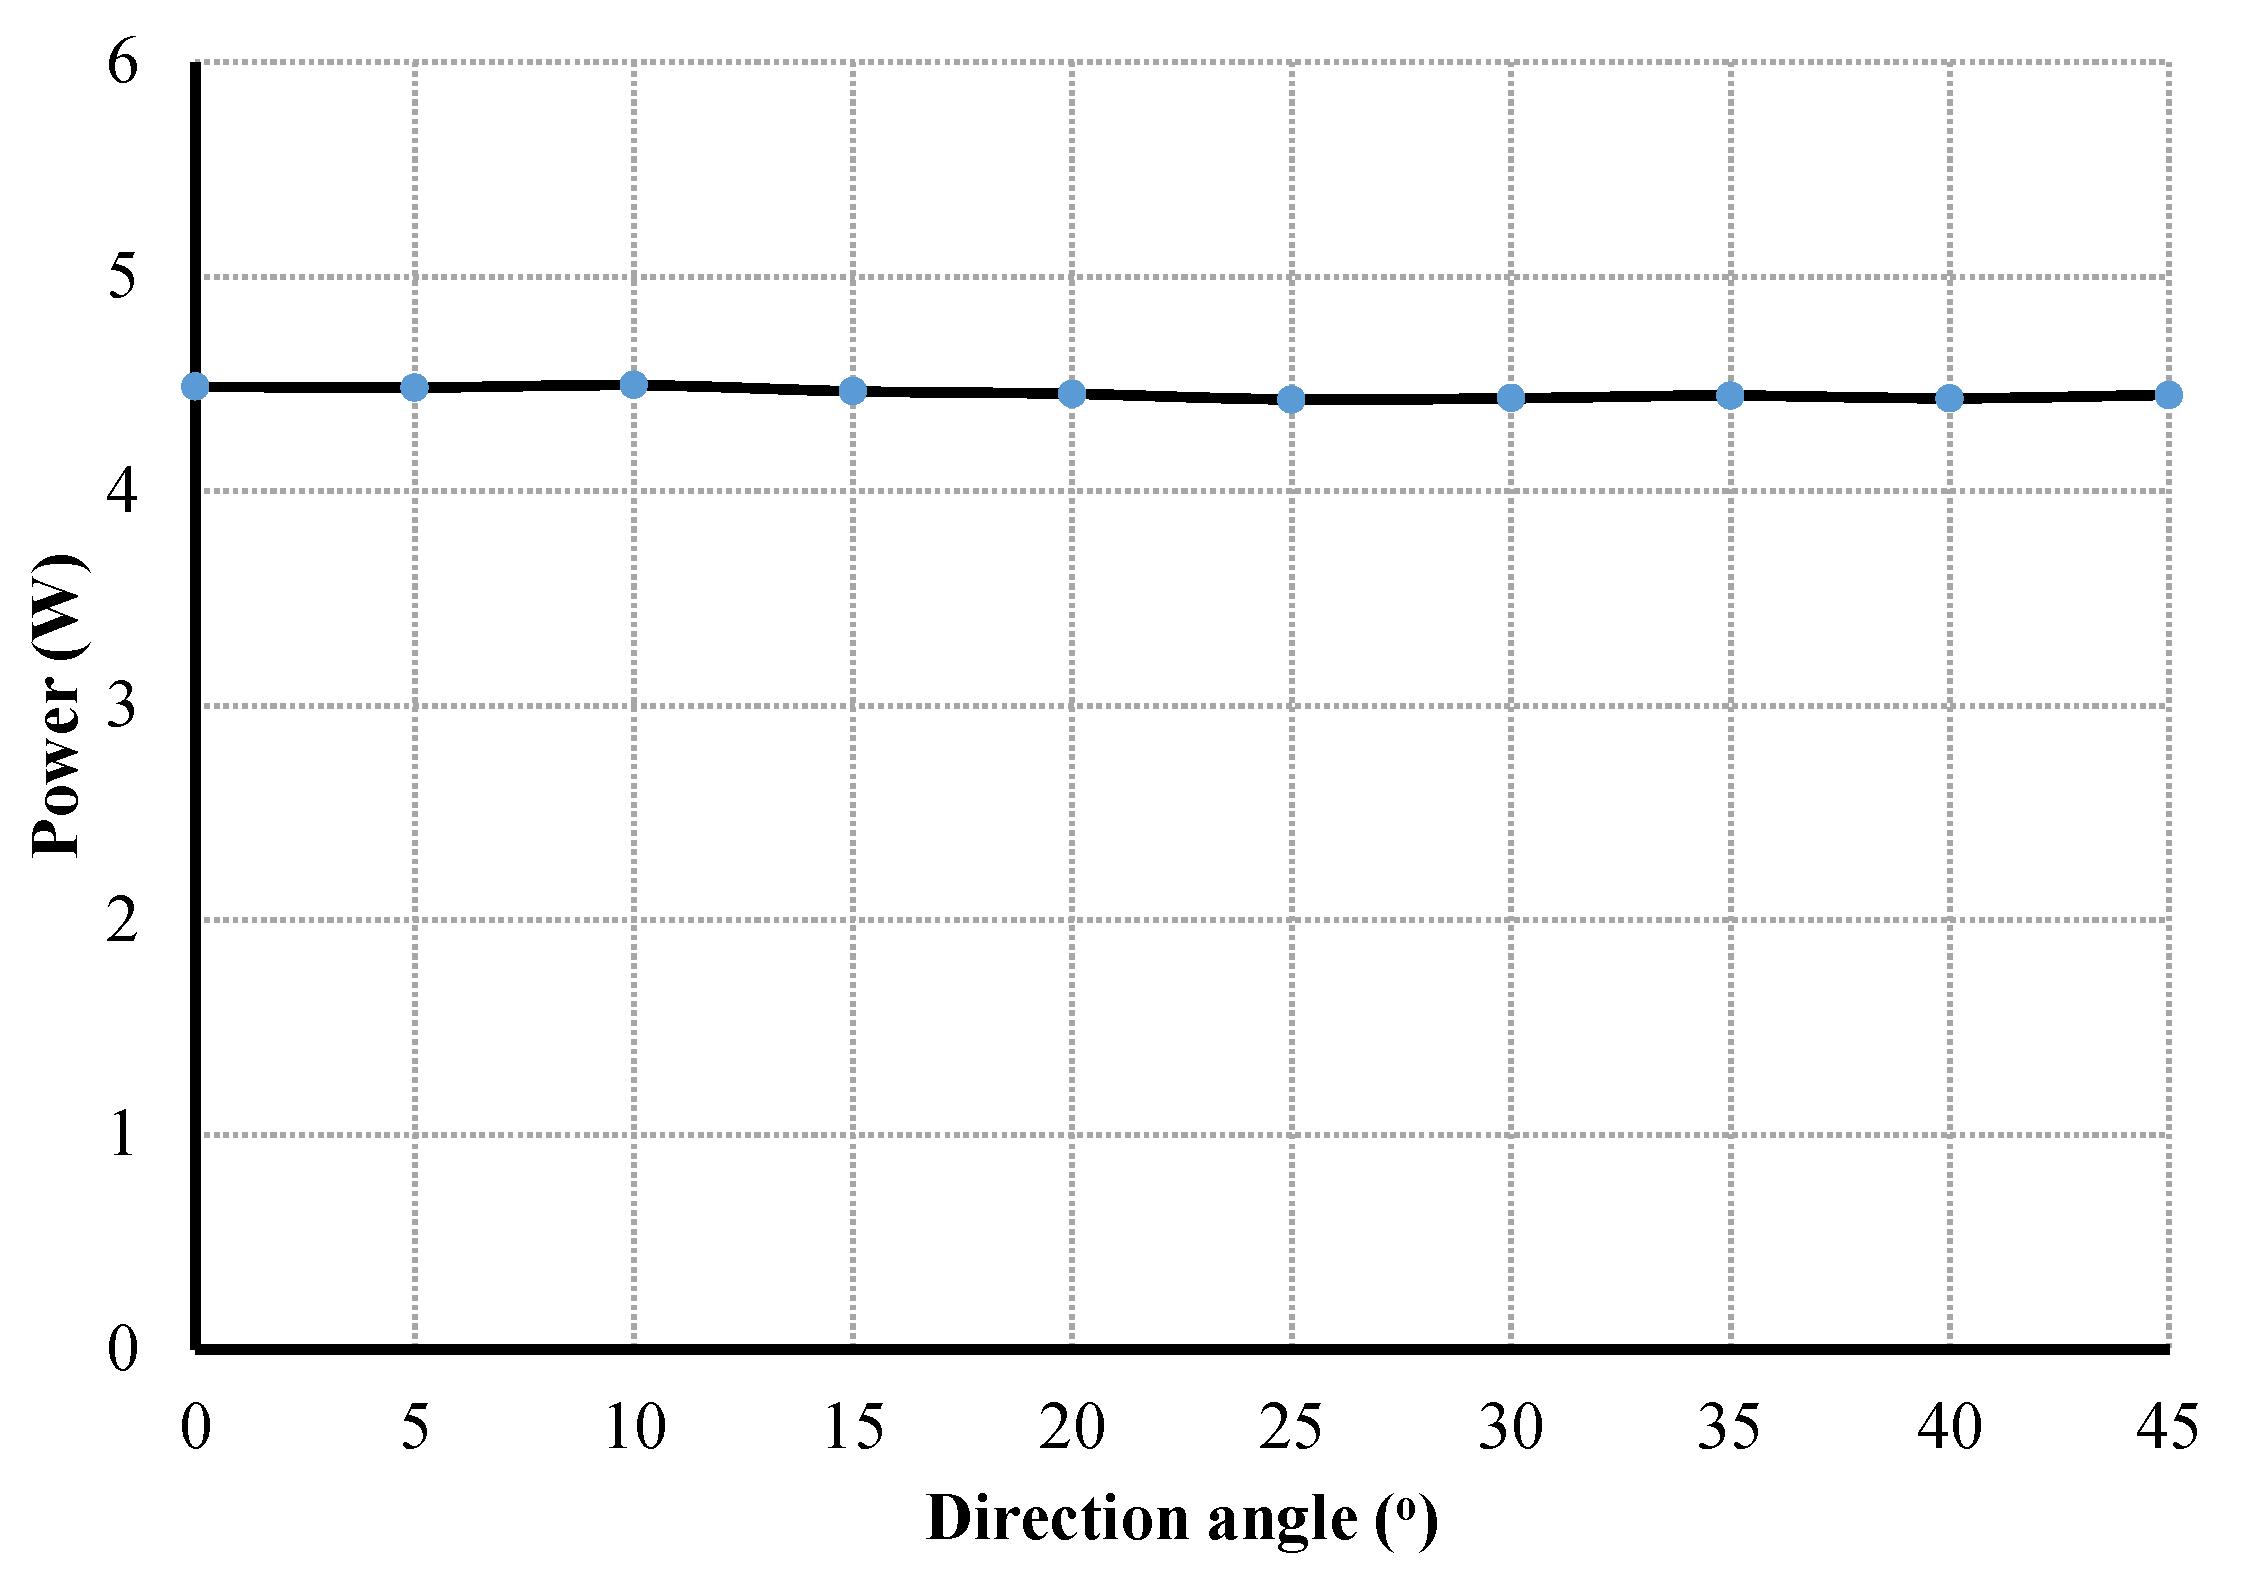
Concurrently, we attempted to rotate the designing sample for our evaluation objective. The energy consumption is observed by adjustment of direction angle (orientation) in the printing process.
Figure 8 express the variation of power for movement is even inconsiderable for all angles. This can be understood that the X-Y motor system is symmetric. Therefore, power probably does not depend on printing direction.
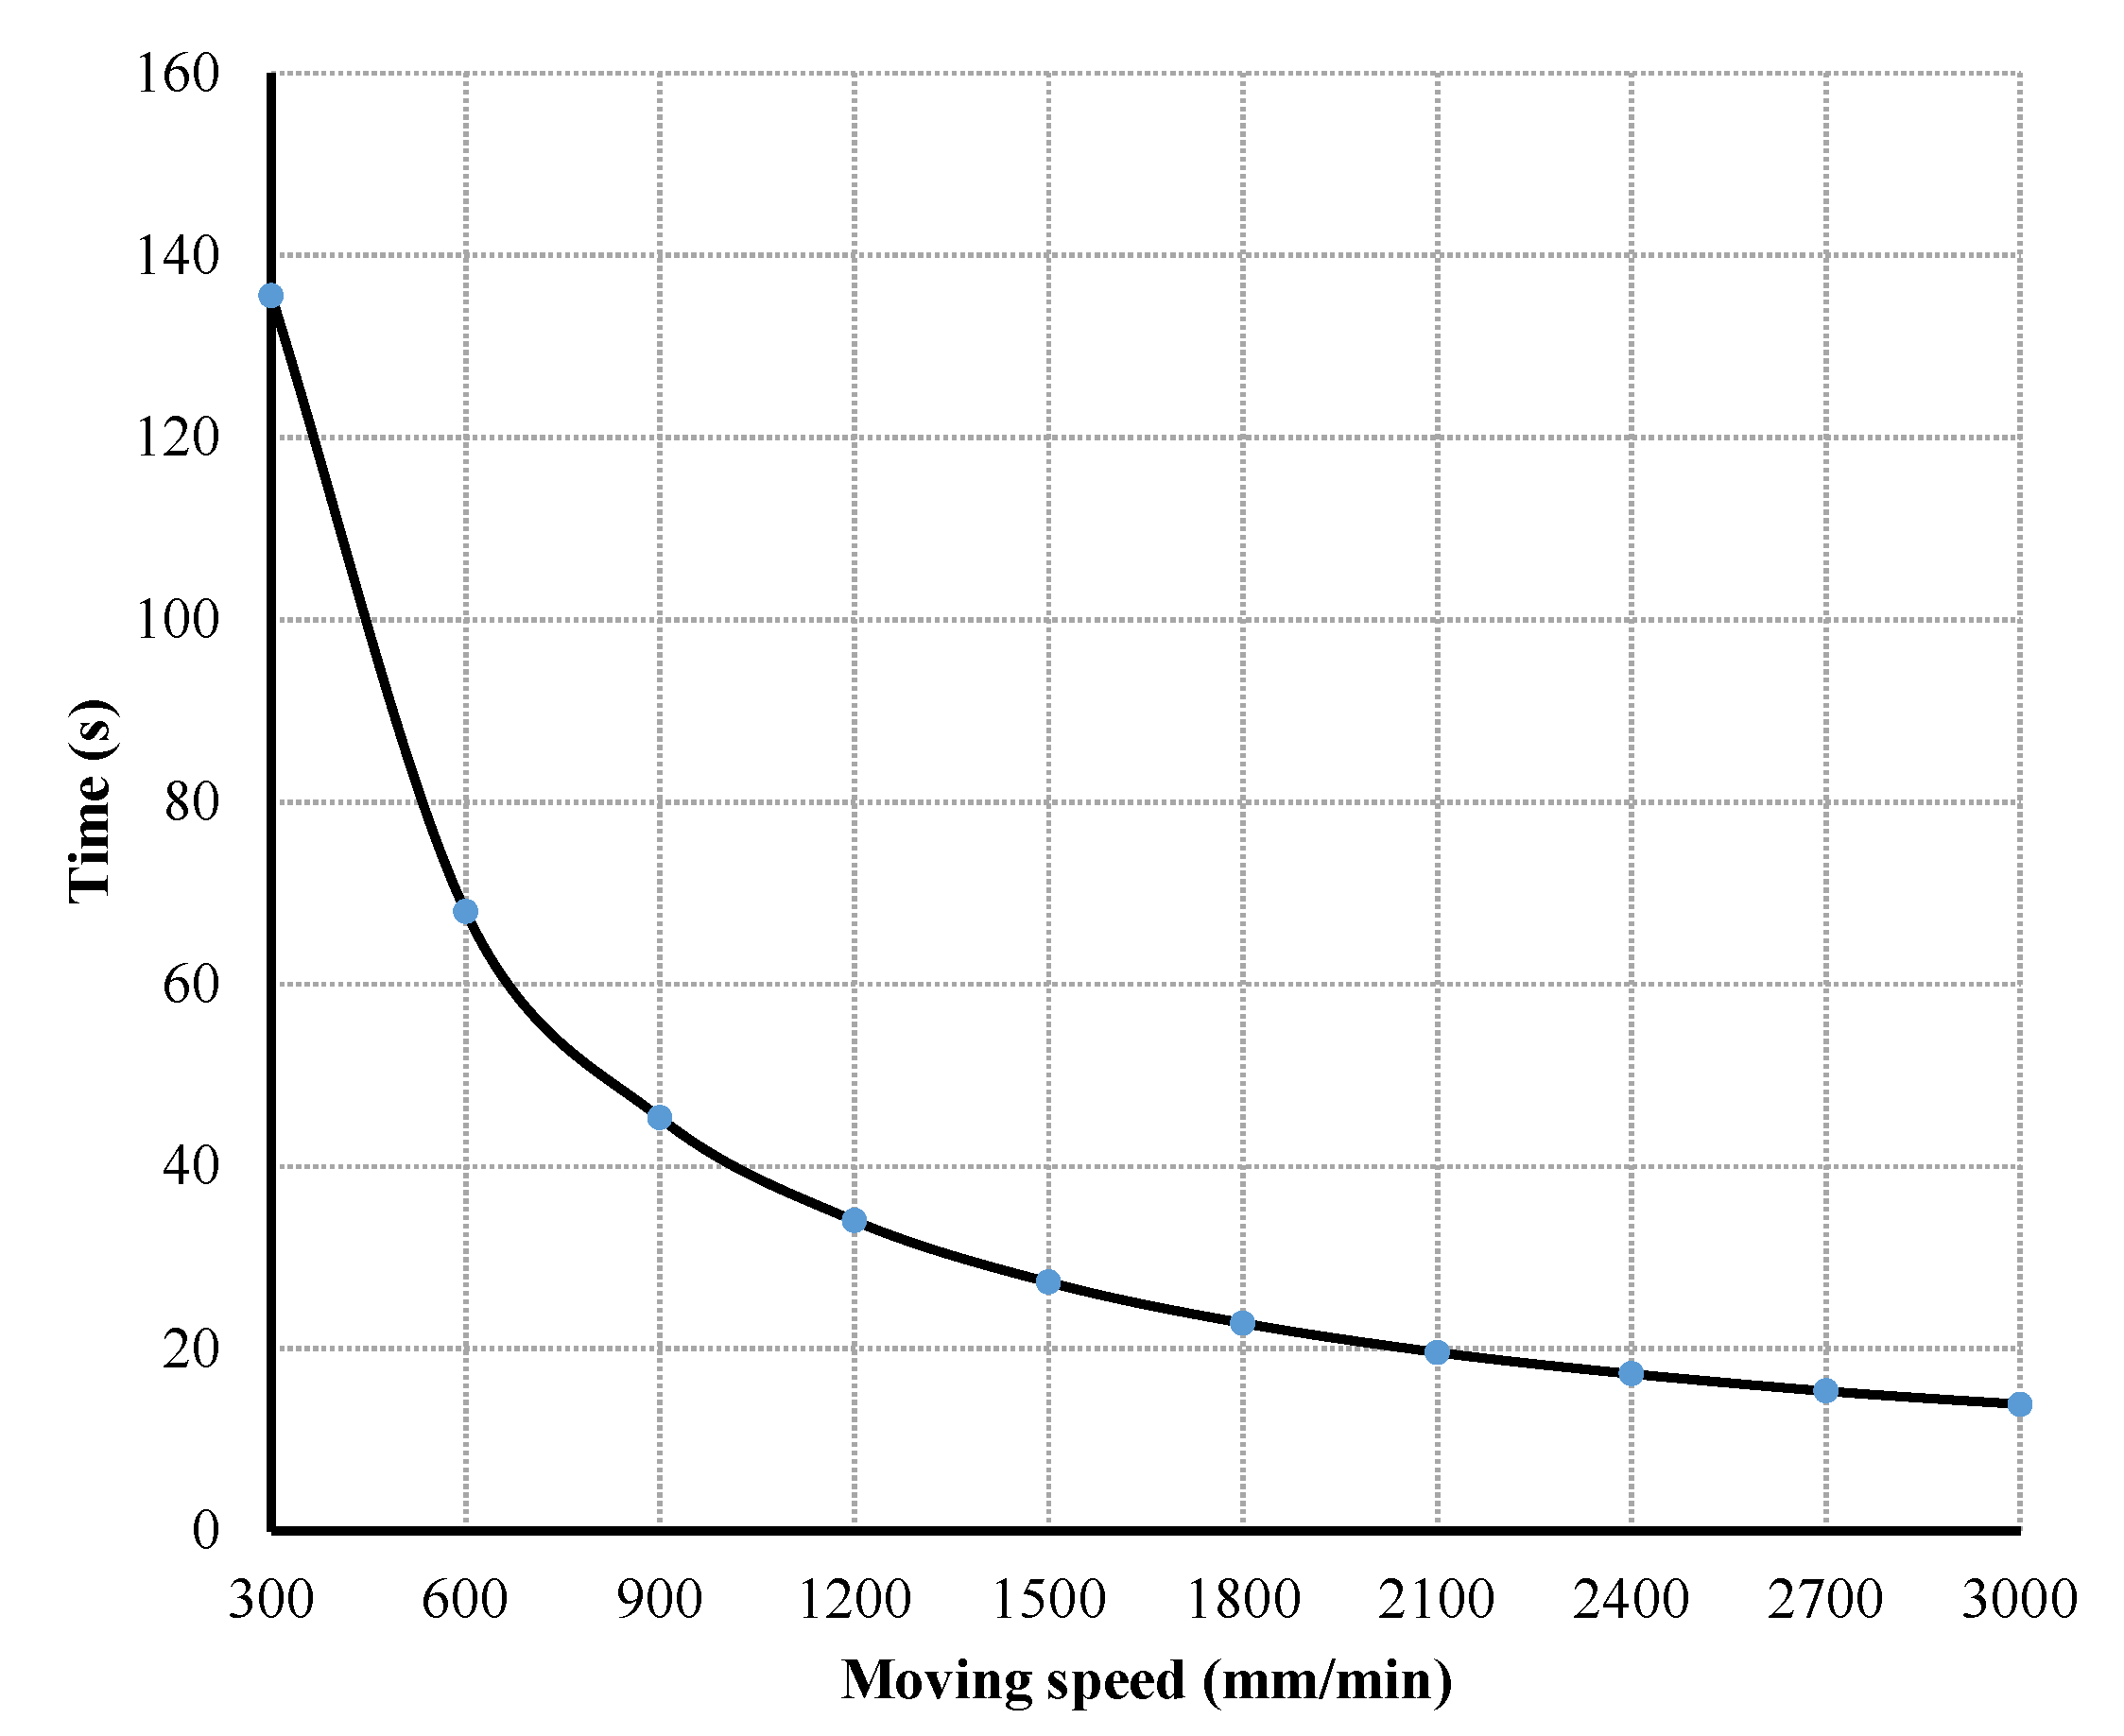
It is clear that the power consumption is primarily affected by printing time as it is computed as a function of time. A reduction in time decreases the amount of energy consumed in sub-components such as heaters, motors, etc. In the literature, the printer should be set at the highest velocity possible. However, in the printing process, there is a relation between melting time and moving speed to form a quality product. The extruded material might not catch up the too-high speed, thus induce the deficiency of object. On the contrary, using too low of a speed can cause an excess amount of material on the artifact surface.
The curve in
Figure 9 depicts the printing time for some speed levels. The result shows that the relationship between speed and time is not linear, and it takes more time at the range of very low speed rather than at a high-speed range. It is beneficial to print with a high-speed range beyond 1000 mm/min. Nevertheless, note that the speed threshold must be compatible with the melting temperature of filament for the quality target [
10,
18].
Experimentally, the printing speed should be at around 1200 mm/min for the smooth surface layer.
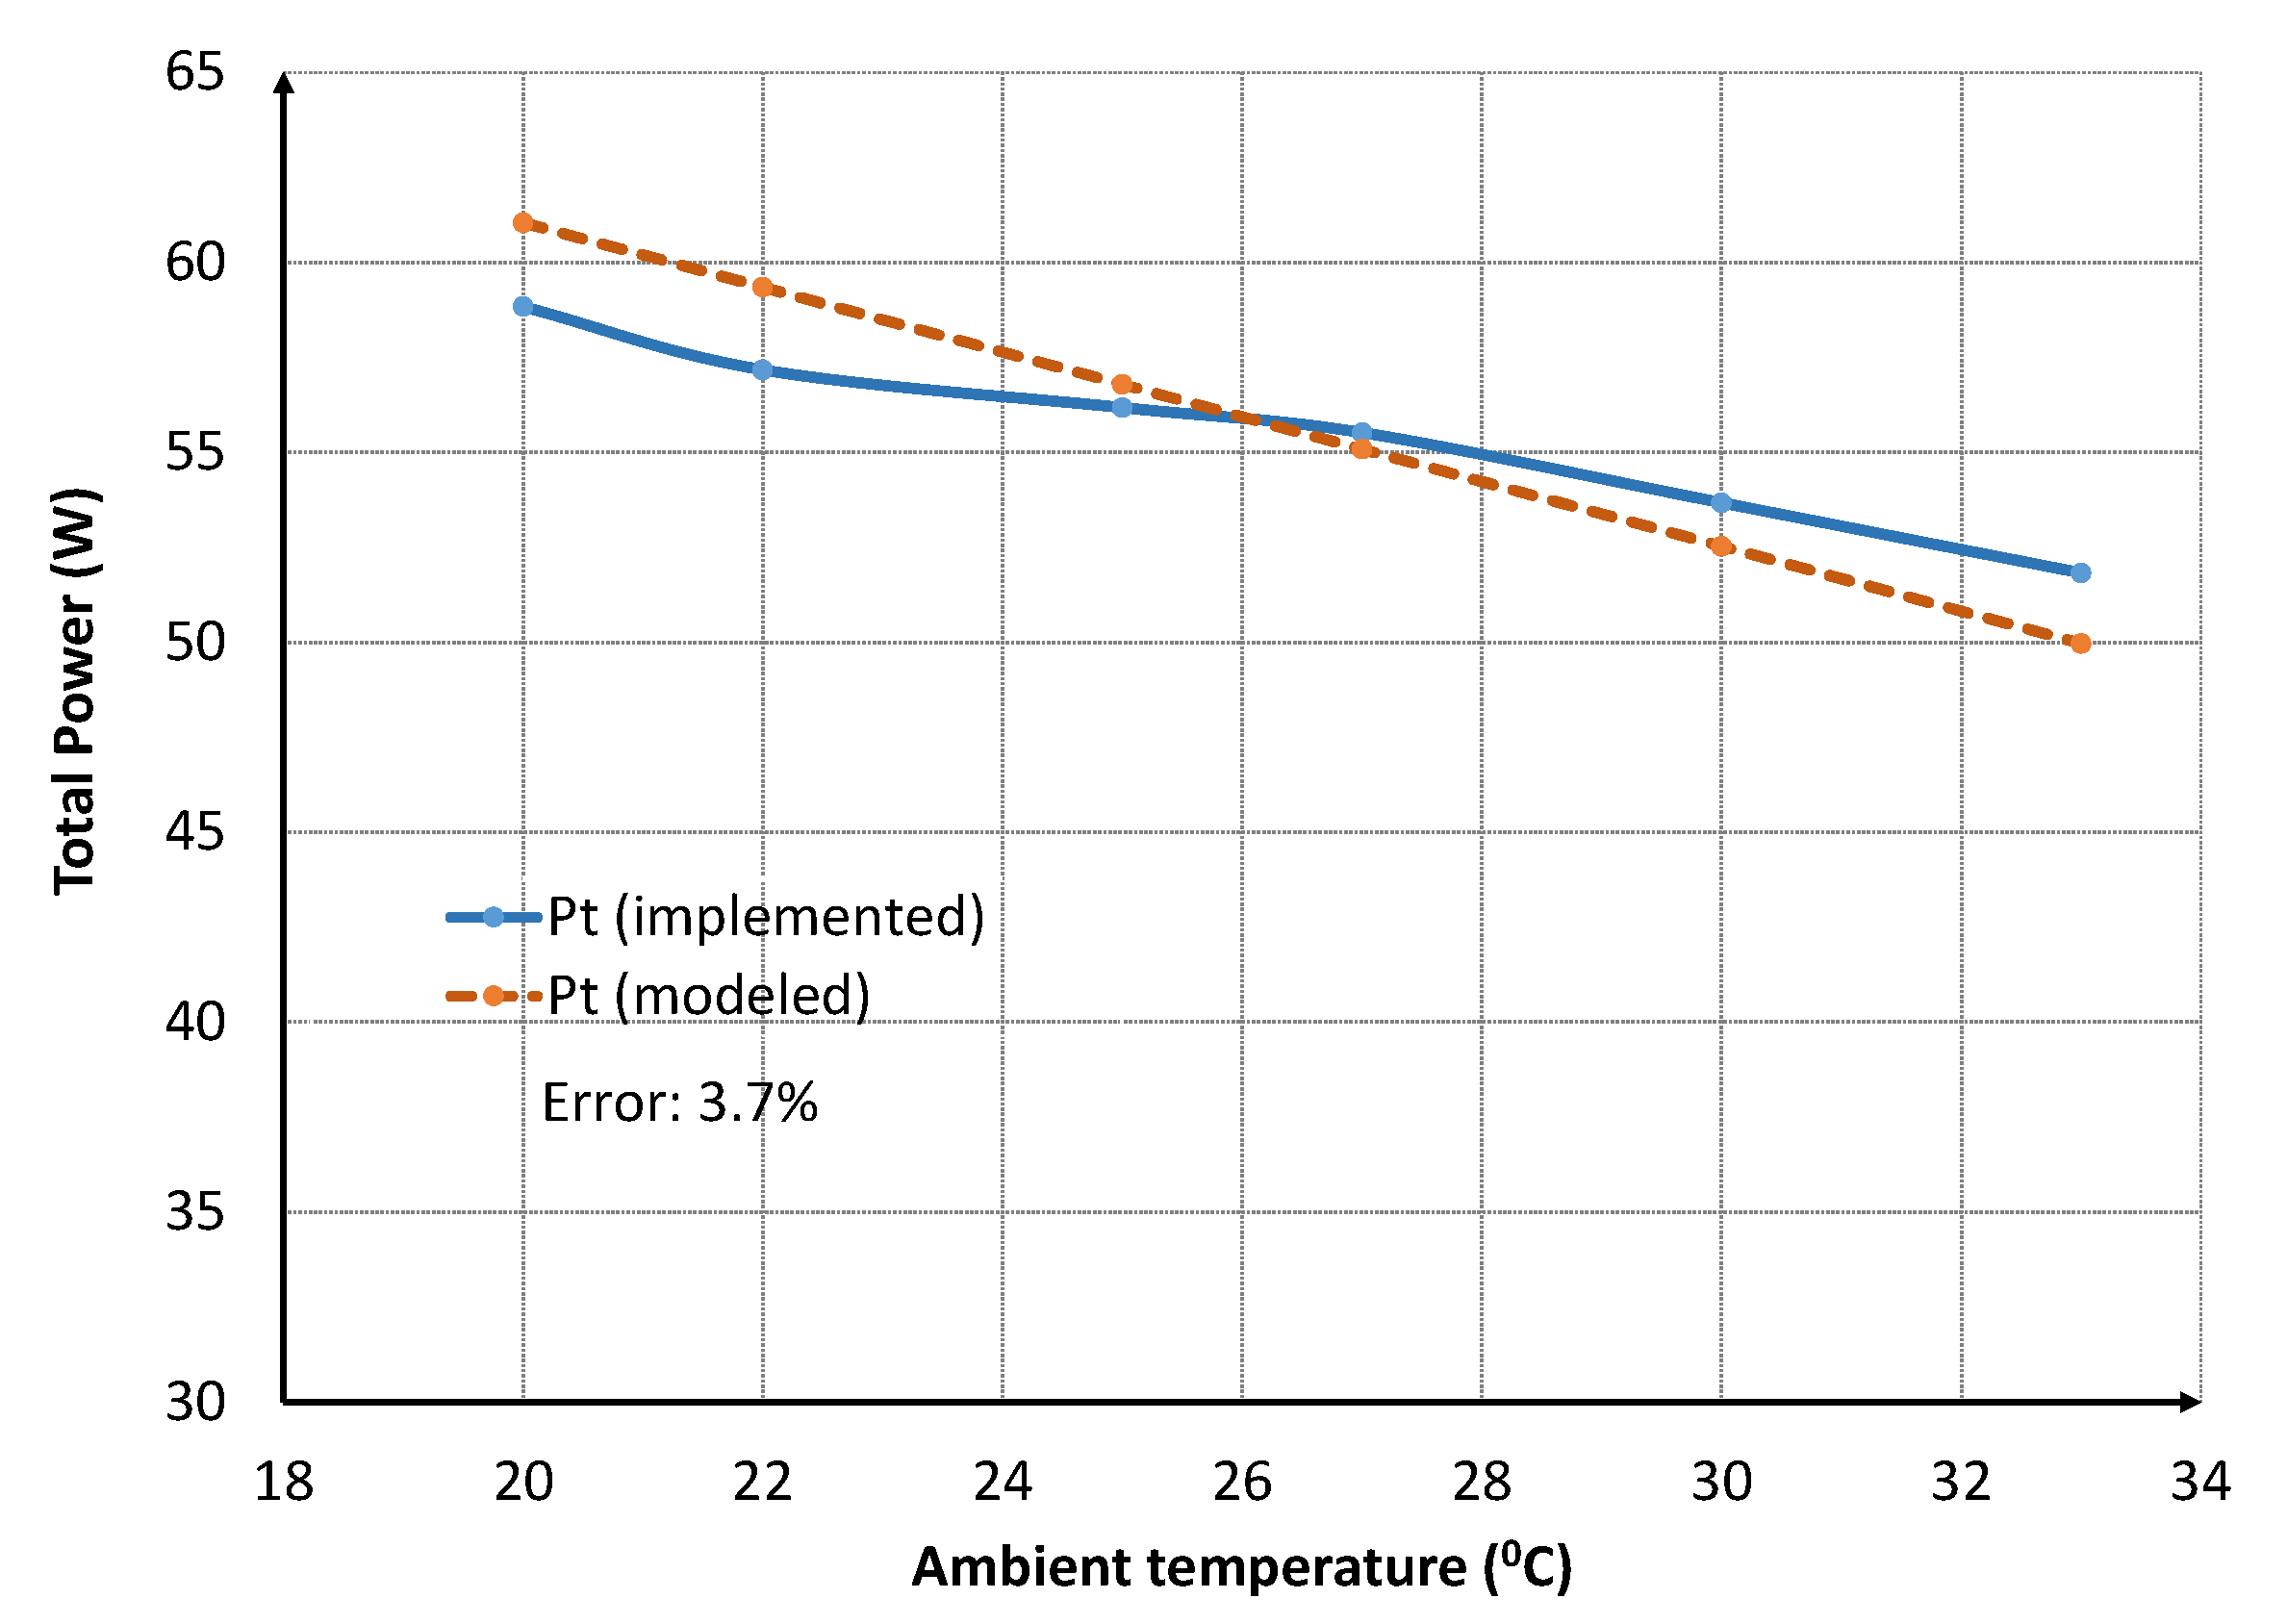
On the other hand, we target the strategy based on power optimization for heaters, especially for the heatbed. In our work, we repeatedly carry out the test for only heaters activated. The measurement result shown that there is a distinction in total power in some cases of different temperature. Explicitly, the temperature causes a significant impact on the required power for heating progress. The higher ambient temperature would involve the decreasing of power, and vice versa.
Figure 10 shows the character of the total power of the 3D printer in various ambient temperatures. Pt (model) implies to the total power of 3D printer calculated by the model. Pt (implemented) implies to the total power of 3D printer measured by DAQ.
In the next steps, we separate the heatbed into 16 plates. The plates that have their location belong to the printing area will be enabled at a higher temperature, and the surrounding plates will be set to lower temperature, simultaneously. In order to execute that, it is important to localize the printing area, then control the temperature following area-separated selection.
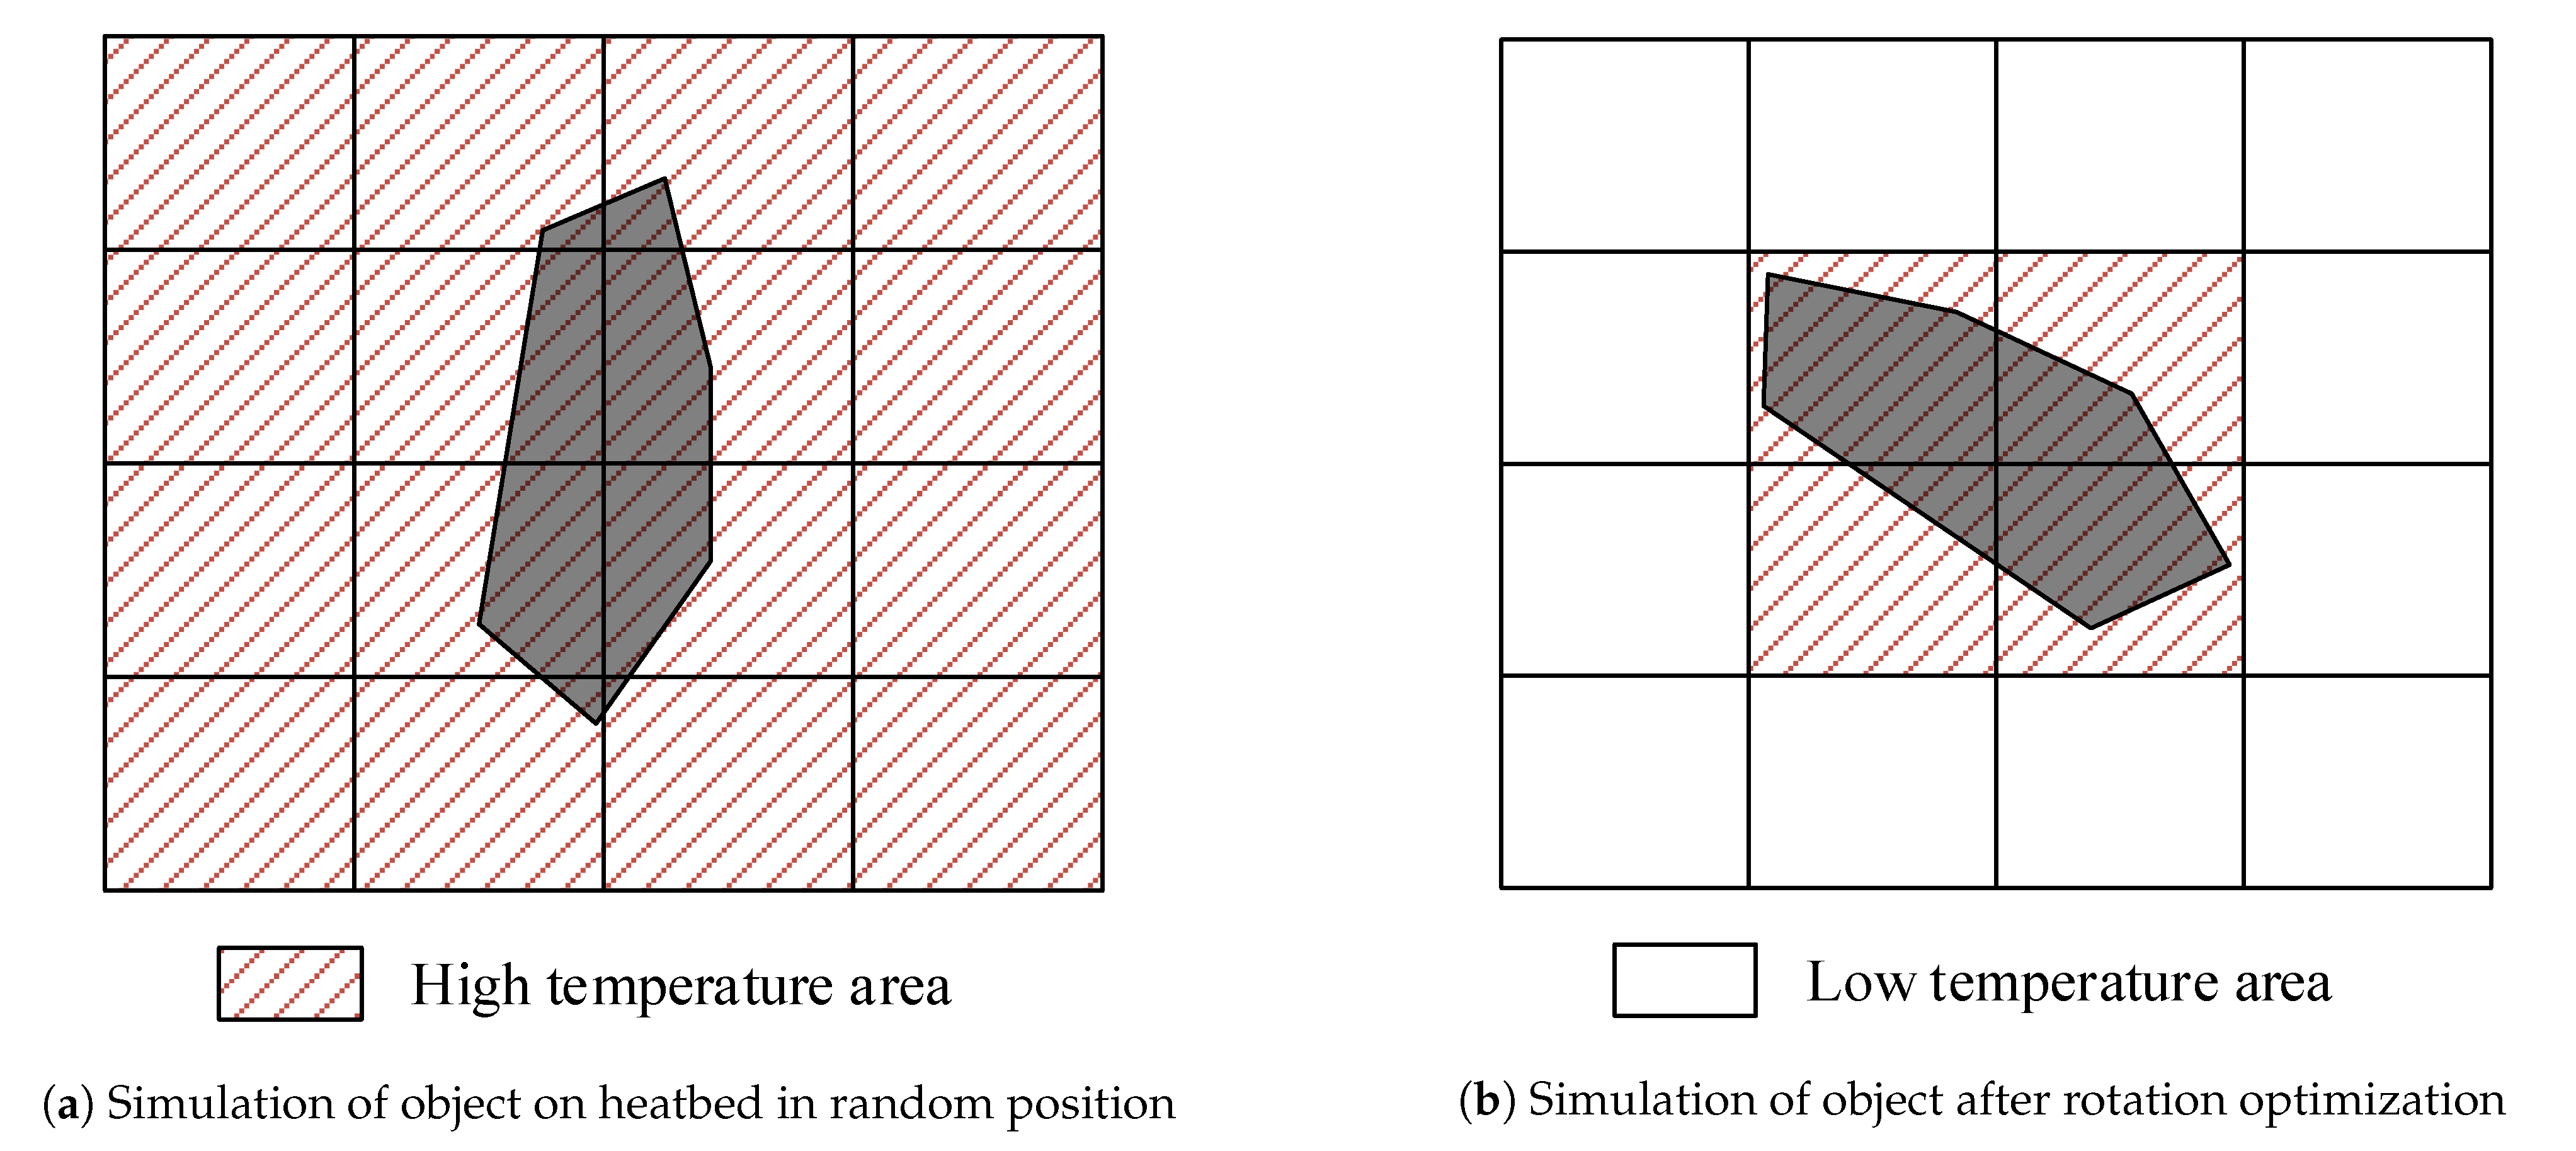
In this work, we separately control two heatbed–plate groups: the center group has four plates that are always set to a higher temperature, and the surrounding group has 12 plates that are set to a lower temperature if the printing area does not belong to. This way, less heating energy will be required, meaning lower power consumption for printing the small article. In addition, with some articles that have a special shape, we will rotate them for power optimization purposes. For example, as seen in
Figure 11, by rotating the sample to a certain angle, the number of enabling heatbed–plates at higher temperature will be reduced. Thus, the power requirement for the printing process will be optimized as the power consumption does not change with printing orientation.
For this approach, notice that we must consider the generating of Gcode file. The tool path should be generated completely inside the center group for the optimization.
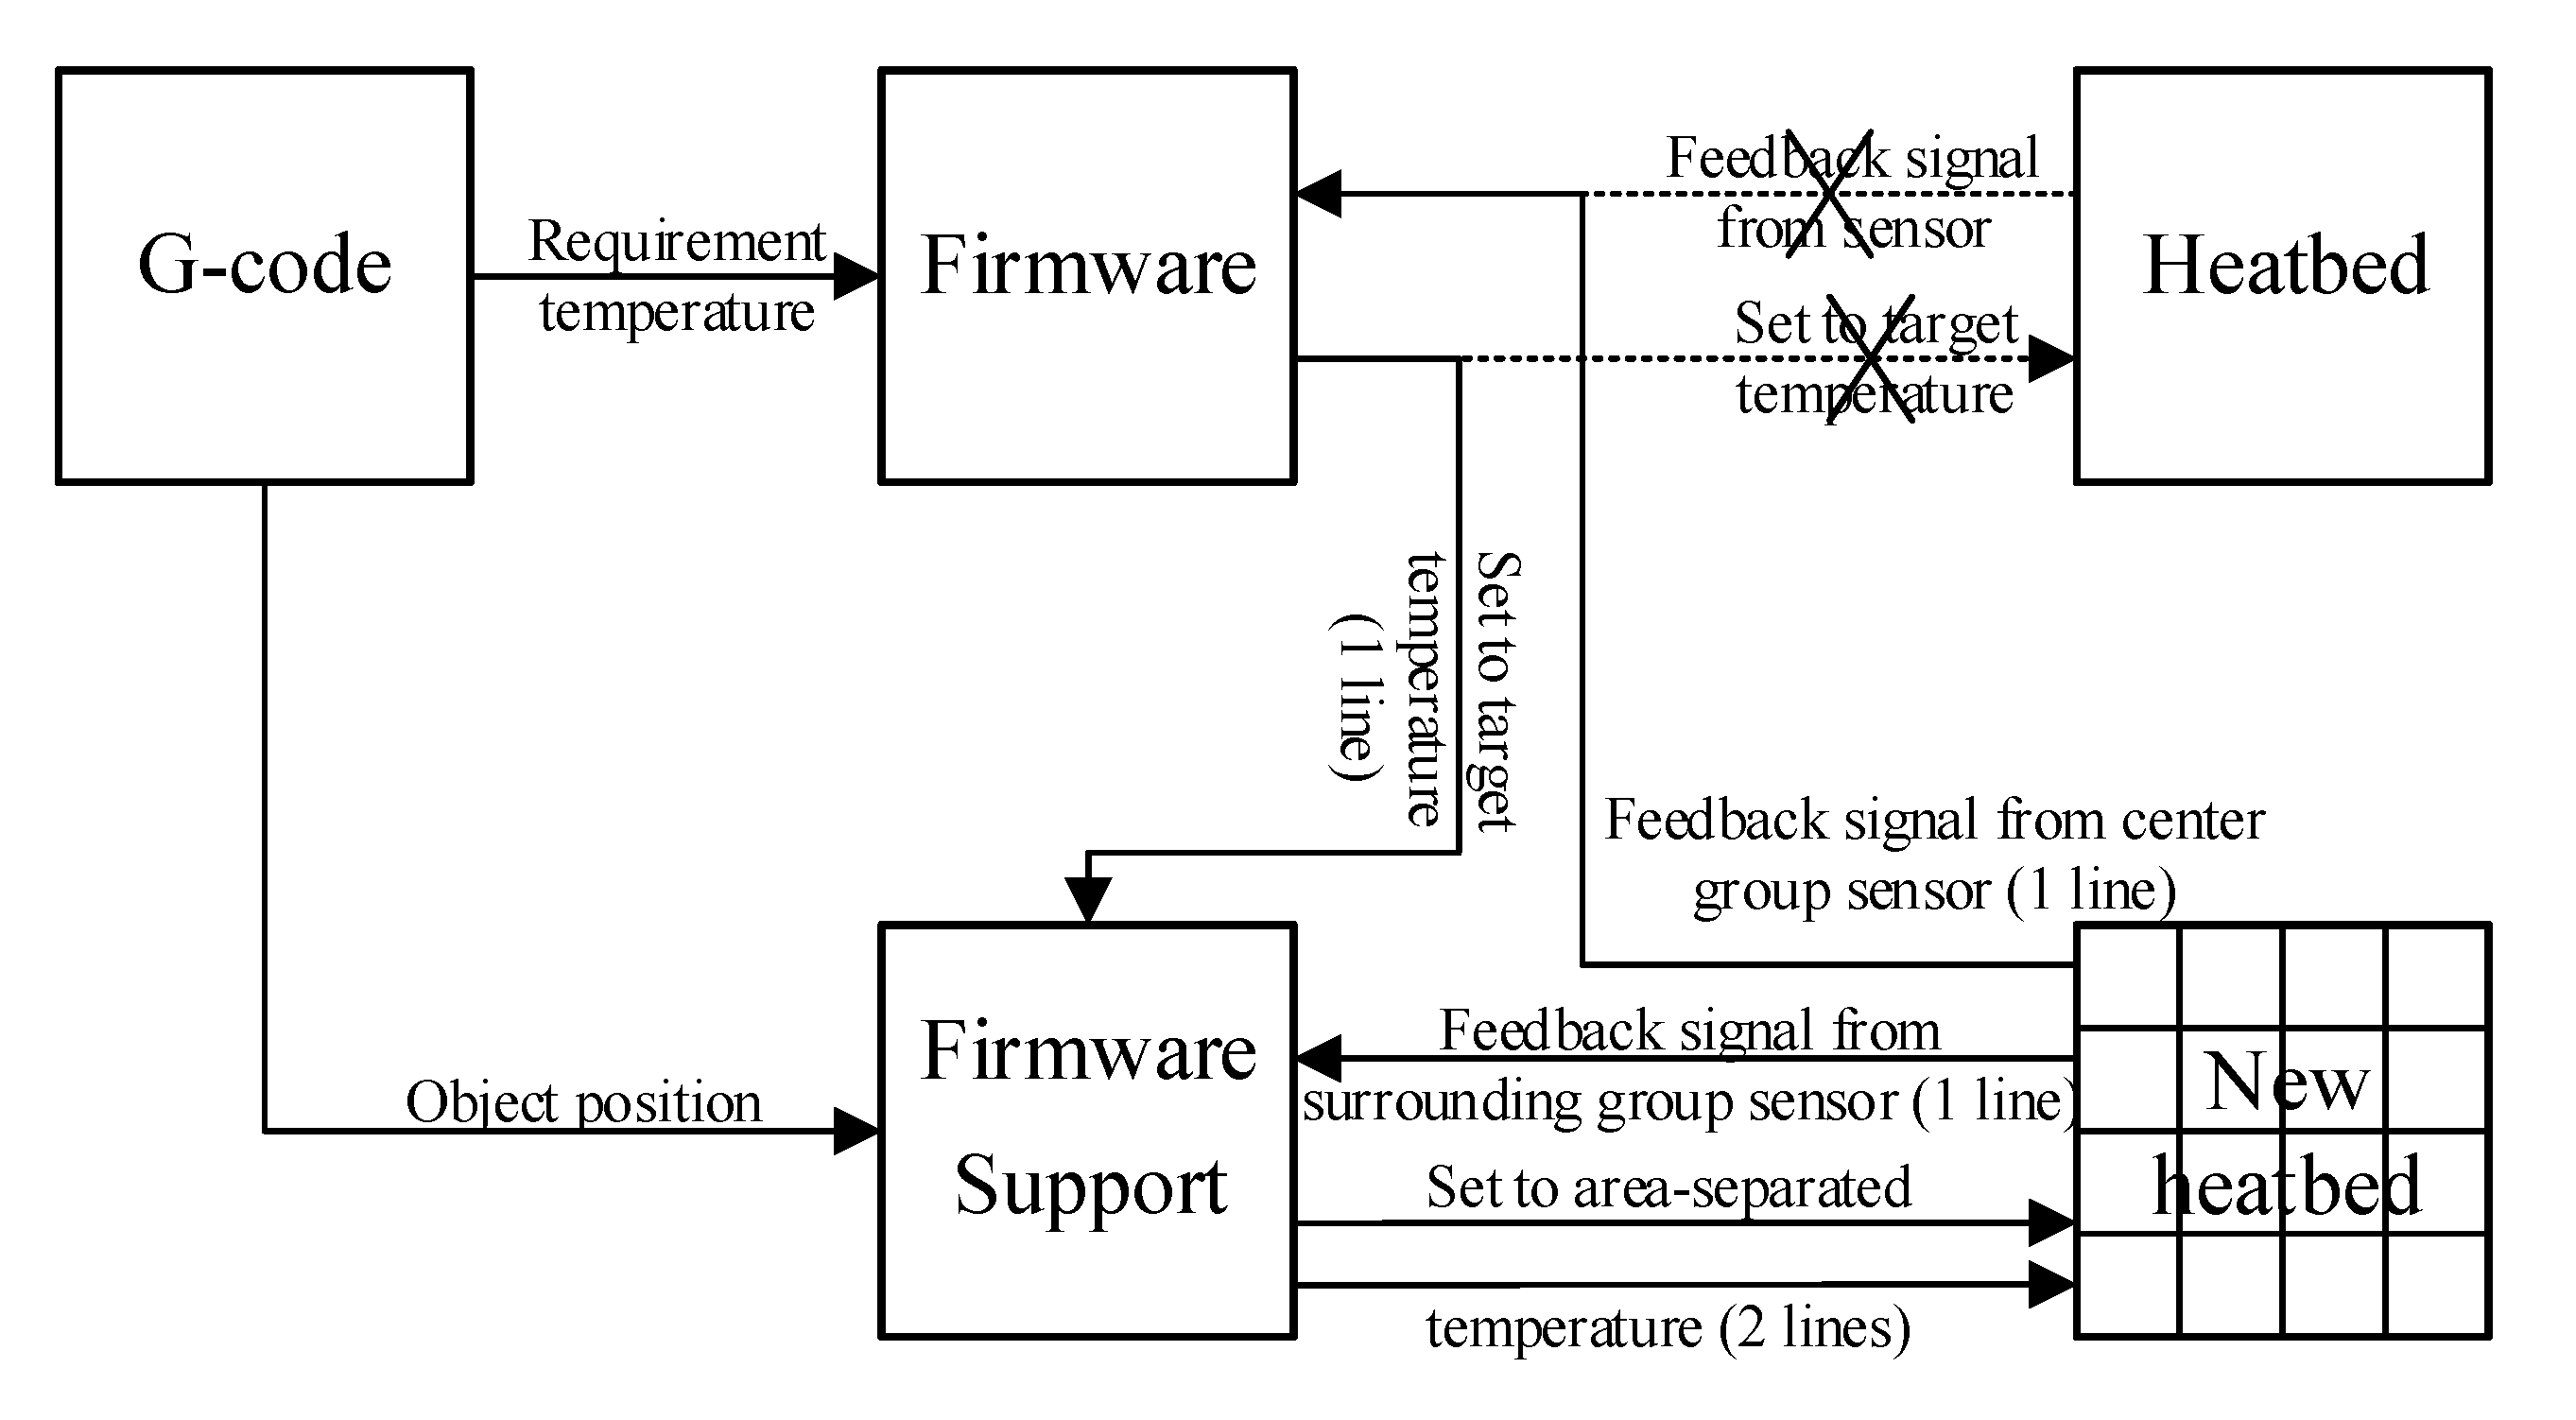
As shown in
Figure 12, we use a firmware support to control the new heatbed. The temperature control output of firmware (build-in firmware) will be input of firmware support. This control signal is directly supplied to the center group, and it is used to generate a lower setpoint temperature for the surrounding group, as well. The feedback temperature signal from center group is directly connected to the build-in firmware, while the feedback temperature signal from the surrounding group is connected to the firmware support. In addition, the position signal from G-code is required for firmware support to decide to set the surrounding group at same temperature or lower temperature than other group.
In the implementation, we set the motor’s speed to 1200 rpm, the melting temperature for the heater to 200 °C, and the warming temperature for the heatbed is 60 °C. Our system is set up in a small room so that we can adjust the ambient temperature. With some ambient temperature points, we do a certain number of tests to surely eliminate the unexpected errors of measurement. Concurrently, the same printing conditions is applied for a new strategy of heatbed, meanwhile the center group temperature is set to 60 °C, and surrounding group is set to 40 °C. Note that with the bigger articles, the surrounding group might be set to a higher temperature closer to the center group temperature. The results of measurement are aggregated to
Table 3 with the power saving up to 23.09%.


