1. Introduction
Digital media have transformed how tourists search for information, evaluate destination alternatives, and make travel decisions. Travel blogs and vlogs are particularly influential because they combine personal narratives, visual representations, destination recommendations, and practical planning information. Unlike conventional destination advertising, this content frequently presents destinations through creators’ firsthand experiences, allowing prospective tourists to form expectations before visiting. Social media and user-generated content have consequently become important sources of pre-trip information during destination search and evaluation [
1]. Travel bloggers and vloggers may also function as digital opinion leaders whose trustworthiness and information quality influence followers’ travel-related decisions [
2]. Through visual storytelling, narration, and representations of creator experiences, travel vlogs can stimulate inspiration and subsequent travel-planning behavior [
3].
Travel blogs and vlogs also operate within a broader digital-commerce environment. They connect prospective tourists with destinations, accommodation providers, travel platforms, booking services, attractions, and other tourism businesses. Their commercial relevance therefore extends beyond destination promotion because the information communicated through these channels can shape pre-purchase evaluation, reduce uncertainty, influence consideration sets, and support subsequent transactions involving transportation, accommodation, attractions, and travel services. Examining how consumers evaluate such content contributes to electronic-commerce research on digital marketing, influencer communication, platform-mediated consumer experiences, and online decision-making. This positioning emphasizes digital commerce, social commerce, influencer marketing, platform trust, and evolving consumer experiences.
However, exposure to travel content does not automatically produce a destination decision. Its influence partly depends on how prospective tourists perceive the information presented. Novel content can introduce unfamiliar experiences and perspectives, reliable content can strengthen confidence in destination claims, understandable content can reduce the cognitive effort required to process information, and interesting content can capture attention and sustain engagement. Previous research has shown that the novelty, understandability, and interestingness of travel-blog content can influence destination-related behavioral intentions through perceived enjoyment [
4]. Research on social media travel content has similarly identified novelty, reliability, understandability, and interestingness as relevant content characteristics that shape users’ evaluations and visit intentions [
5]. These findings indicate that digital travel content influences consumer responses not merely through exposure but through the informational and experiential qualities that audiences attribute to it.
Prospective tourists also require destination-specific information that supports practical planning. Accommodation information can help them evaluate location, facilities, prices, and suitability; itinerary information can support the organization of routes, schedules, and activities; and attraction information can communicate the experiences available at a destination. Travel-blog users particularly value content concerning itineraries, attractions, transportation, accommodation, and general destination information [
6]. Blogs and vlogs may therefore influence destination evaluations by supplementing formal promotional communication with experiential and planning-related information [
7]. Accordingly, the effectiveness of digital travel content may depend on both its general informational characteristics and its capacity to support destination-specific planning.
Despite growing knowledge about digital influencers and travel content, the mechanism through which these content features contribute to destination visit intentions remains insufficiently explained. Previous studies have emphasized influencer trustworthiness, information quality, enjoyment, source credibility, and tourist inspiration [
2,
3,
4]. Travel-vlog research has also frequently concentrated on direct behavioral outcomes without adequately explaining the internal evaluation through which exposure is translated into destination-related responses [
8]. Consequently, limited attention has been given to whether digital travel content enables prospective tourists to determine how informative a destination is for their personal decision, how it compares with alternatives, and whether the available evidence is sufficient to reduce uncertainty.
This study addresses this gap by positioning perceived destination diagnosticity as the cognitive mechanism connecting digital travel content with intention to visit. Destination diagnosticity refers to the extent to which travel content helps prospective tourists understand, compare, and evaluate a destination. Its theoretical basis lies in the accessibility–diagnosticity framework, which proposes that accessible information is more likely to influence judgment when consumers perceive it as useful for evaluating an alternative relative to other available information [
9,
10]. Diagnostic information therefore contributes to judgment not simply because it is available, but because it helps consumers distinguish among alternatives and reach a more informed evaluation. Previous electronic-commerce research has similarly treated diagnosticity as the capacity of online information or product presentation to support understanding and evaluation [
11,
12].
Destination diagnosticity is related to, but conceptually distinguishable from, information usefulness, informativeness, destination image, information adoption, and uncertainty reduction. Information usefulness expresses whether information is broadly beneficial for accomplishing a task, while informativeness concerns the amount or perceived richness of information provided. Destination image represents the beliefs, impressions, and associations held about a place, whereas information adoption refers to the decision to accept and use information. Uncertainty reduction describes a potential consequence of acquiring decision-relevant knowledge. In contrast, destination diagnosticity specifically captures whether available digital content enables a prospective tourist to understand, compare, and evaluate a destination as a choice alternative. It is therefore a judgment-enabling cognitive evaluation rather than an overall destination impression, a general evaluation of information quality, or the behavioral acceptance of information.
The Stimulus–Organism–Response framework provides the overarching structure for examining this mechanism. The framework proposes that environmental stimuli influence an individual’s internal cognitive or affective state, which subsequently generates an approach or avoidance response [
13]. In digital environments, stimuli need not be limited to objectively manipulated physical features. They may include users’ perceived attributes of online content, platforms, and informational environments because individuals respond to environmental cues as they are experienced and interpreted. Hospitality and tourism research has increasingly applied the framework to explain how informational and technological cues shape tourists’ internal evaluations and behavioral intentions [
14]. It is also considered suitable for travel-vlog research because it draws attention to the psychological processes connecting digital-content exposure with destination-related responses [
8].
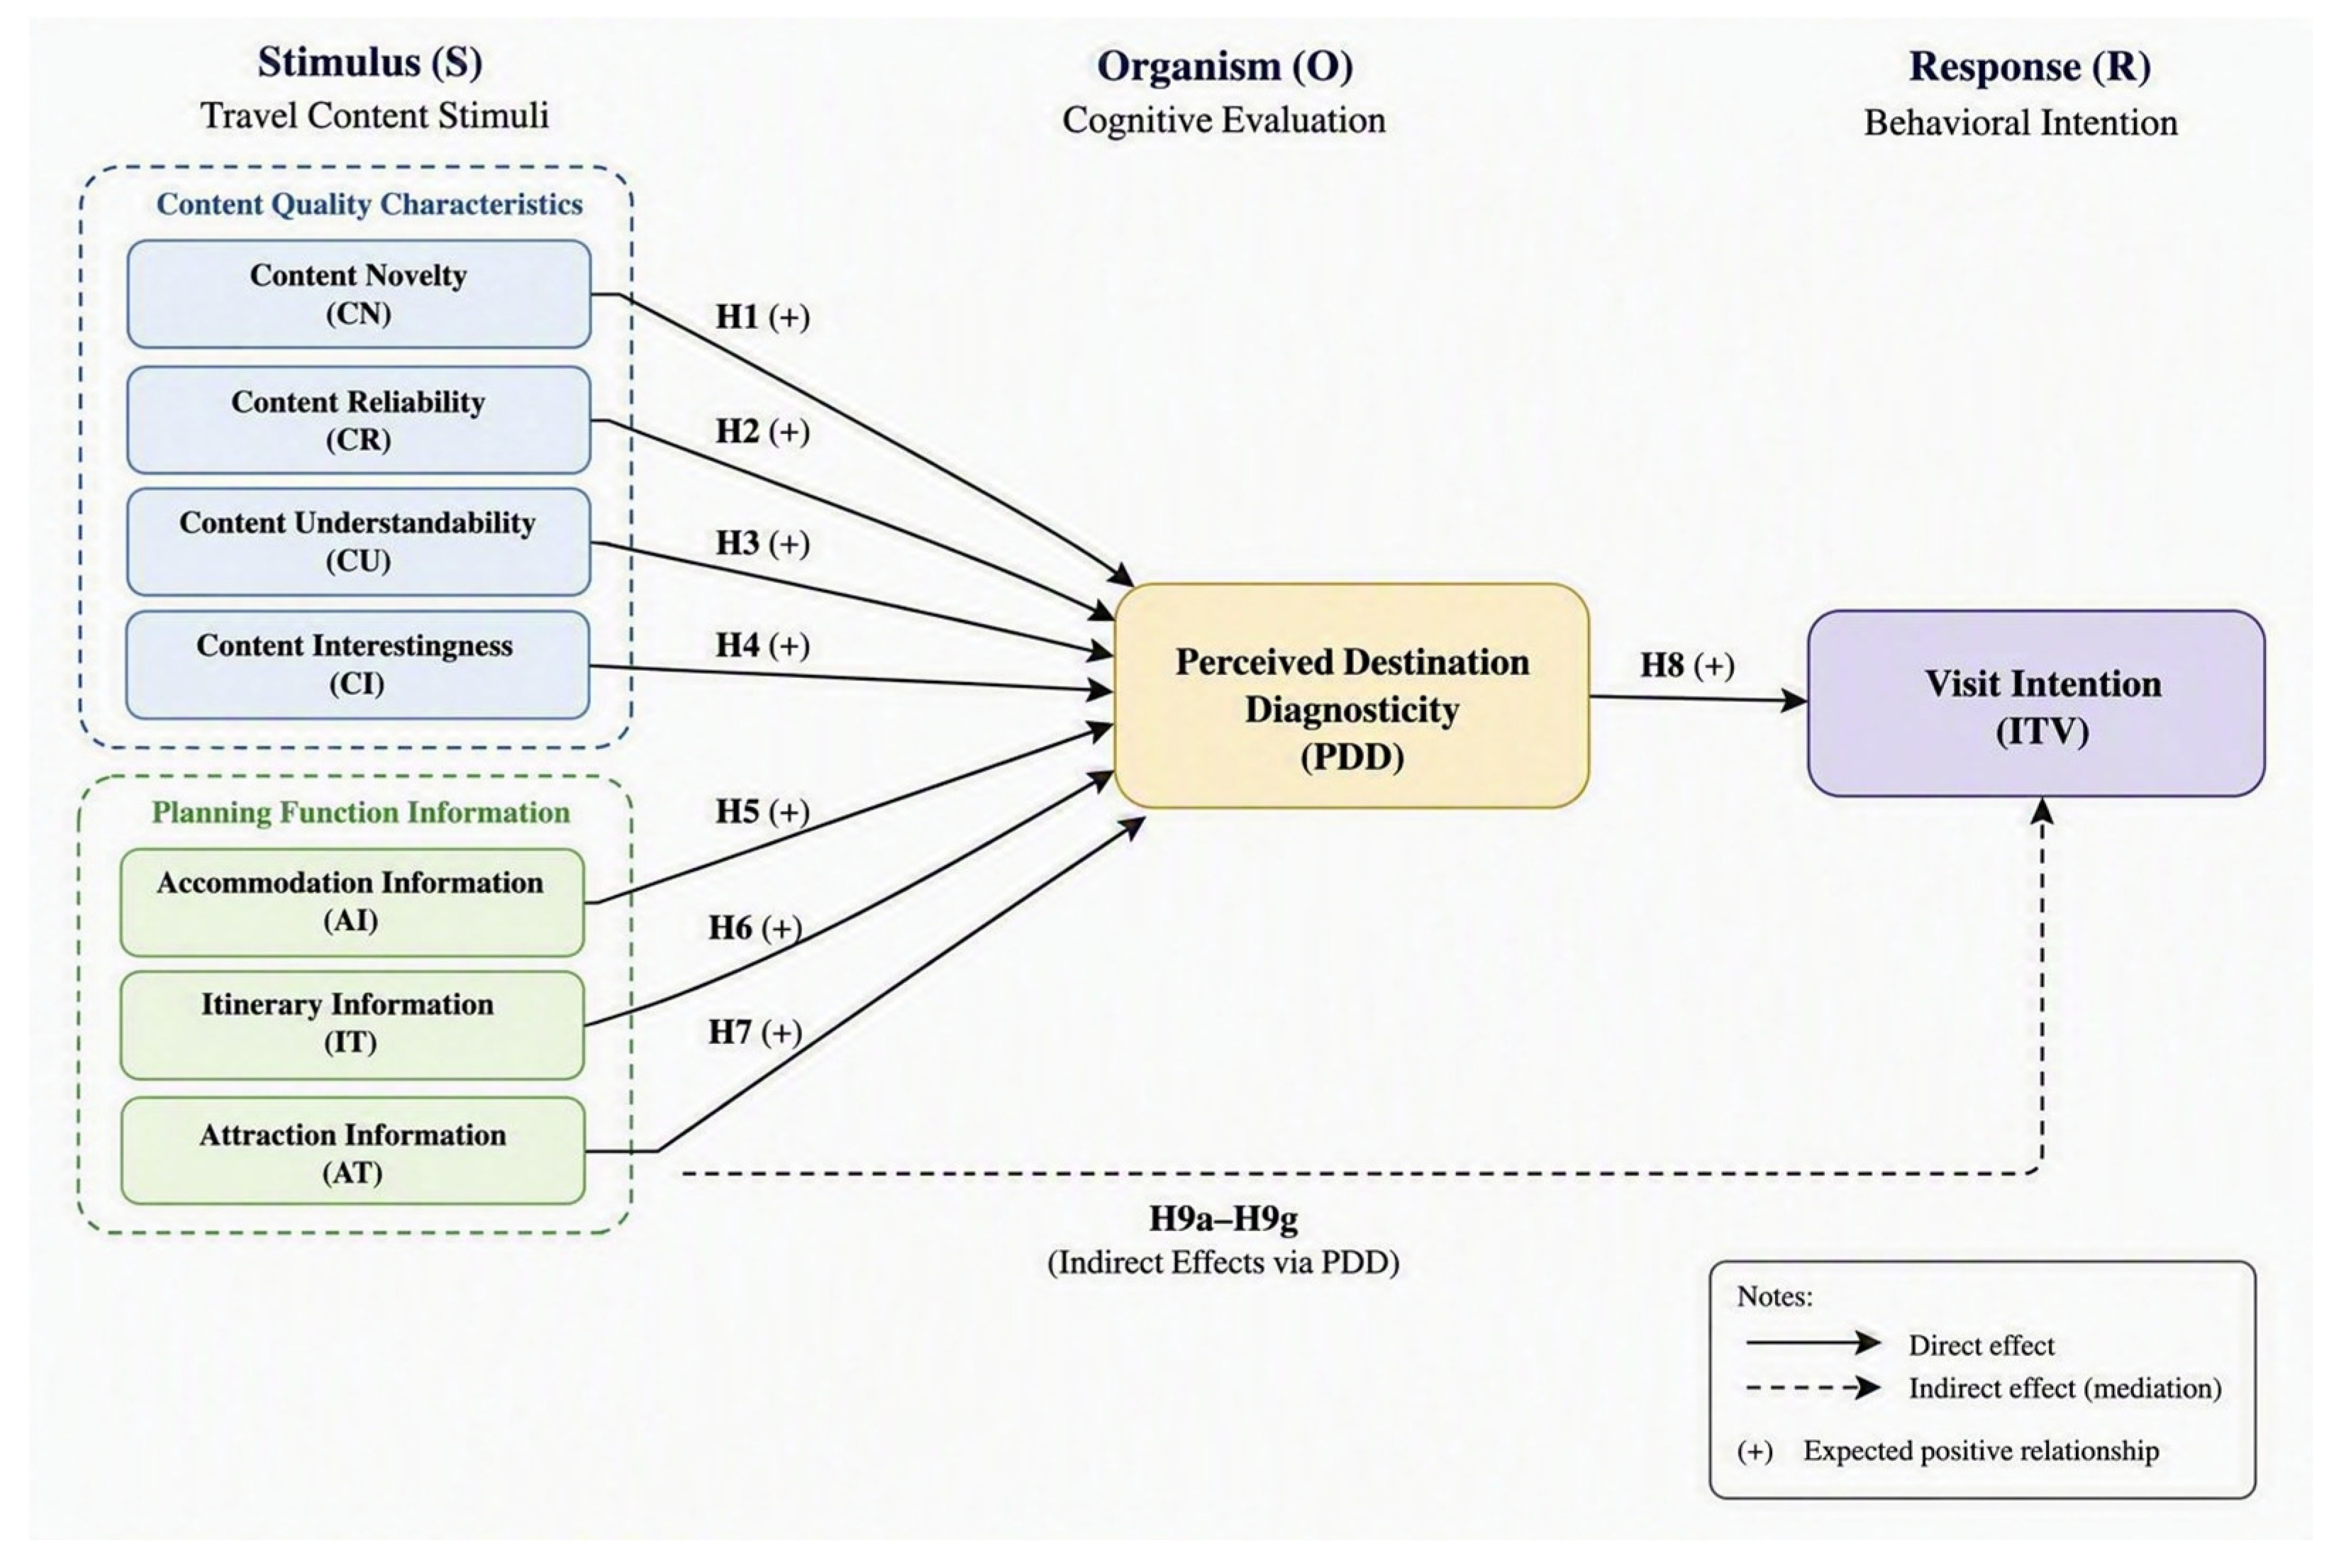
Accordingly, this study conceptualizes content novelty, reliability, understandability, and interestingness as perceived informational stimuli. Although measured through respondents’ perceptions, these constructs describe characteristics attributed to the digital content encountered rather than respondents’ internal evaluation of Khon Kaen as a destination. Accommodation, itinerary, and attraction information are conceptualized as destination-planning stimuli because they represent distinct types of functional information supplied by travel blogs and vlogs. Perceived destination diagnosticity constitutes the organism because it captures the internal judgment of whether the content enables effective destination evaluation. Intention to visit Khon Kaen represents the response because it reflects the behavioral inclination that follows the processing and evaluation of destination information.
The distinction between the content stimuli and destination diagnosticity is important. The stimulus constructs capture either how the content is presented and perceived, including novelty, reliability, understandability, and interestingness, or what planning information it provides, including accommodation, itinerary, and attraction information. Destination diagnosticity instead captures the evaluative capacity produced by processing that content. Thus, extensive or entertaining content may remain nondiagnostic when it is irrelevant, unclear, untrustworthy, or unsuitable for comparing destinations. Conversely, credible and decision-relevant content may improve tourists’ ability to assess whether a destination corresponds with their preferences and constraints. This distinction extends conventional S-O-R applications by identifying destination diagnosticity, rather than enjoyment, inspiration, or destination image, as the cognitive organism connecting digital travel information with behavioral intention.
Khon Kaen provides an appropriate context for examining this process because digital information may be particularly consequential for secondary destinations. Compared with internationally established Thai destinations, prospective tourists may possess less complete knowledge of Khon Kaen’s attractions, accommodation, itineraries, cultural resources, gastronomy, and events. Travel blogs and vlogs may therefore function as digital information channels that make less familiar destination attributes more accessible and evaluable. The setting offers an opportunity to investigate whether digital content supports the evaluation of a destination about which prospective tourists may have limited prior knowledge rather than merely reinforcing an established destination image.
Against this background, the study examines how the informational characteristics and planning functions of travel-blog and travel-vlog content influence intention to visit Khon Kaen through perceived destination diagnosticity. It addresses the following research question:
How do the informational characteristics and destination-planning functions of travel-blog and travel-vlog content influence tourists’ intention to visit Khon Kaen through perceived destination diagnosticity?
The study makes three contributions. First, it integrates the accessibility–diagnosticity perspective with the S-O-R framework by identifying perceived destination diagnosticity as a judgment-enabling cognitive organism that connects digital content with destination intention. Second, it distinguishes general content characteristics, represented by novelty, reliability, understandability, and interestingness, from destination-planning functions, represented by accommodation, itinerary, and attraction information. This distinction permits a more precise assessment of whether destination evaluation depends on how digital content is communicated, what information it provides, or both. Third, the study contributes to electronic-commerce research by explaining how user-generated and influencer-mediated travel content supports consumers’ evaluation of tourism offerings before potential transactions. In practical terms, the findings can assist destination management organizations, tourism businesses, digital platforms, and content creators in developing credible, distinctive, and decision-relevant content for less familiar destinations.
2. Literature Review and Hypothesis Development
2.1. Stimulus–Organism–Response Framework
The Stimulus–Organism–Response framework explains how features of an environment influence behavioral responses through an individual’s internal cognitive or affective state. Stimuli represent environmental cues encountered by an individual, the organism represents the internal processing and evaluation of those cues, and the response represents the resulting behavioral reaction [
13]. In digital environments, stimuli may include the perceived characteristics of online content because users respond to environmental cues according to how those cues are experienced and interpreted. The framework has been widely applied in hospitality and tourism research to explain how informational, technological, and environmental cues shape tourists’ perceptions, evaluations, emotions, and behavioral intentions [
14].
The S-O-R framework is particularly relevant to digital tourism because exposure to online content does not necessarily produce an immediate behavioral response. Prospective tourists first attend to and interpret the content, assess its relevance to their needs, and form an internal evaluation before developing a behavioral intention. Accordingly, travel-vlog research has identified S-O-R as an appropriate framework for explaining the psychological processes connecting digital-content exposure with destination-related responses [
8]. Previous studies have similarly shown that content characteristics and information quality influence tourism behavior through internal states such as enjoyment, inspiration, trust, resonance, and destination evaluation [
2,
3,
4,
15].
In this study, the perceived characteristics and planning functions of travel-blog and travel-vlog content constitute the stimuli. The first category comprises content novelty, reliability, understandability, and interestingness, which describe characteristics attributed to the information and presentation of the content. The second category comprises accommodation, itinerary, and attraction information, which represents the practical planning functions performed by the content. Although these constructs are measured through respondents’ perceptions, they concern attributes assigned to the digital content encountered rather than respondents’ internal evaluation of Khon Kaen. Perceived destination diagnosticity represents the organism because it captures the cognitive judgment of whether the content enables the prospective tourist to understand, compare, and evaluate the destination. Intention to visit represents the response because it reflects the behavioral inclination formed after processing the content.
This specification establishes a clear boundary between stimuli and the organism. The stimulus constructs describe either how the content is perceived, through novelty, reliability, understandability, and interestingness, or what functional information it provides, through accommodation, itinerary, and attraction information. Destination diagnosticity instead captures the evaluative capacity resulting from the processing of those cues. A travel vlog may be interesting, for example, without helping viewers compare Khon Kaen with competing destinations. Similarly, accommodation information may be extensive but remain nondiagnostic if it does not enable viewers to assess the suitability of the destination. Consequently, perceived destination diagnosticity is not treated as another content characteristic but as the internal cognitive evaluation linking digital content with visit intention.
2.2. Travel-Blog and Travel-Vlog Content as Informational Stimuli
Travel blogs and vlogs are digital content channels through which creators communicate destination experiences, recommendations, opinions, and practical information. Blogs generally combine written narratives and images, whereas vlogs use audiovisual storytelling to represent destinations, activities, and personal experiences. Despite their format differences, both enable prospective tourists to obtain experiential and planning-related information during destination search and evaluation [
1,
7]. They are examined jointly in this study because the research focuses on the perceived informational characteristics and decision-support functions shared by both formats rather than on format-specific effects. The distinction between blogs and vlogs nevertheless remains a relevant direction for future comparative research.
Travel content varies in its capacity to support consumer evaluation. Prior research identified novelty, reliability, understandability, and interestingness as relevant characteristics through which users assess travel-related content [
4,
5]. These characteristics may influence whether prospective tourists attend to the information, comprehend its meaning, trust its claims, and incorporate it into a destination evaluation. From an S-O-R perspective, they function as informational stimuli because they describe qualities of the digital content that initiate subsequent cognitive processing.
2.2.1. Content Novelty
Content novelty refers to the extent to which travel information presents unfamiliar, original, or distinctive knowledge about a destination. Novel content may introduce lesser-known attractions, alternative itineraries, local experiences, or perspectives that differ from conventional destination promotion. Novelty differs from timeliness: timeliness reflects whether information is current, whereas novelty reflects whether it provides knowledge or perspectives that are new to the audience.
Novel content can improve destination evaluation by expanding the range of attributes and experiences considered by prospective tourists. This function may be particularly important for secondary destinations because potential visitors may possess limited prior knowledge of their tourism offerings. Travel blogs and vlogs can reveal overlooked experiences and local perspectives, thereby making the destination easier to distinguish from alternatives. Previous research indicates that novelty can shape users’ evaluations of travel-blog content and their behavioral intentions [
4]. Novel online travel reviews may also provide additional decision value when they contribute information beyond what consumers have already encountered [
16].
From an accessibility–diagnosticity perspective, novelty alone does not guarantee influence. New information becomes consequential when prospective tourists consider it relevant for understanding and distinguishing a destination [
9,
10]. In the context of Khon Kaen, distinctive information may increase diagnosticity by revealing attributes and experiences that are not readily accessible through conventional promotional channels. Therefore:
H1. The perceived novelty of travel-blog and travel-vlog content positively influences the perceived diagnosticity of Khon Kaen as a travel destination.
2.2.2. Content Reliability
Content reliability refers to the extent to which information presented in travel blogs and vlogs is perceived as accurate, dependable, balanced, and credible. It concerns the reliability of the information rather than the broader credibility of its creator. Source credibility may derive from characteristics such as expertise or trustworthiness, whereas content reliability concerns whether specific destination claims are accurate, consistent, and supported by credible details.
Reliability is particularly important in tourism because many destination and service attributes cannot be fully evaluated before consumption. Prospective tourists therefore depend on externally provided information when assessing destination quality, accessibility, costs, and suitability. Influencer trustworthiness and information quality have been shown to influence followers’ travel-related decisions [
2]. Research on inaccurate travel recommendations similarly indicates that information accuracy affects perceived trustworthiness and destination-related intentions [
17].
Reliable content should increase destination diagnosticity because consumers are more likely to use information they regard as accurate and dependable when comparing alternatives. Conversely, exaggerated, outdated, commercially biased, or internally inconsistent information may increase uncertainty and reduce its value in destination evaluation. Therefore:
H2. The perceived reliability of travel-blog and travel-vlog content positively influences the perceived diagnosticity of Khon Kaen as a travel destination.
2.2.3. Content Understandability
Content understandability refers to the extent to which travel information is presented clearly, logically, and in a form that prospective tourists can comprehend without excessive cognitive effort. Understandability may be supported through coherent organization, straightforward language, maps, photographs, subtitles, explanations, and audiovisual demonstrations. It concerns not only whether users can access the content but also whether they can interpret and apply the information to destination evaluation.
Clear presentation is especially important when travel content includes transportation routes, costs, schedules, cultural practices, or destination facilities. Even accurate information may have limited diagnostic value if prospective tourists cannot determine how it relates to their travel requirements. Prior studies have found that understandability contributes to the evaluation and enjoyment of travel-related content and may shape destination-related behavioral responses [
4,
5]. Online tourism information quality can also influence cognitive and affective responses that contribute to conative destination evaluations [
15].
Understandable content should facilitate the identification, organization, and interpretation of relevant destination attributes. By reducing processing difficulty and ambiguity, it may strengthen tourists’ ability to assess Khon Kaen as a travel alternative. Thus:
H3. The perceived understandability of travel-blog and travel-vlog content positively influences the perceived diagnosticity of Khon Kaen as a travel destination.
2.2.4. Content Interestingness
Content interestingness refers to the extent to which travel content captures attention, sustains curiosity, and provides an engaging consumption experience. Interestingness may arise from compelling storytelling, attractive visual presentation, meaningful narratives, unfamiliar experiences, and the effective integration of information and entertainment. It is conceptually distinct from visit intention because it describes engagement with the content rather than a willingness to visit the destination.
Interesting content may encourage users to devote more attention to destination information and process it more extensively. Research has shown that interesting travel-blog content can increase perceived enjoyment and influence subsequent behavioral intentions [
4]. Interesting social media travel content has also been associated with enjoyment and destination visit intention [
5]. Moreover, interestingness can contribute to emotional resonance, which may influence destination-related behavioral predispositions [
15].
Within the S-O-R framework, interestingness functions as an experiential stimulus that draws attention to the available destination cues. Sustained engagement may increase the likelihood that prospective tourists process relevant information and develop a clearer basis for evaluating Khon Kaen. Accordingly:
H4. The perceived interestingness of travel-blog and travel-vlog content positively influences the perceived diagnosticity of Khon Kaen as a travel destination.
2.3. Destination-Planning Information as Functional Stimuli
General content characteristics describe how users perceive the quality and presentation of travel content, whereas destination-planning information describes the practical decision-support functions performed by that content. This distinction is important because novel or interesting content may capture attention without providing sufficient evidence for assessing whether a destination is suitable or feasible. Conversely, detailed information concerning accommodation, itineraries, and attractions can help prospective tourists evaluate different components of a potential visit.
Travel-blog users value practical content concerning accommodation, attractions, itineraries, transportation, and general destination information [
6]. Blogs and vlogs can also support destination evaluation by providing user-generated accounts that complement formal marketing communication [
7]. Accommodation, itinerary, and attraction information are therefore conceptualized as functional content stimuli rather than as dimensions of destination diagnosticity. They capture the types of information supplied by the content, whereas destination diagnosticity captures the resulting ability to evaluate the destination.
The three planning-information constructs are retained as separate first-order reflective constructs rather than modeled as dimensions of a higher-order planning-information construct. Accommodation, itinerary, and attraction information concern theoretically distinct decision domains and are not interchangeable manifestations of one general construct. Content may provide strong attraction information but limited accommodation or itinerary guidance. Treating them as a single higher-order construct could therefore conceal their distinct contributions to destination diagnosticity. Their separate specification also permits theoretically and managerially meaningful comparisons of which information category provides the greatest evaluation support. Each construct is reflectively measured because its indicators represent manifestations of respondents’ evaluation of the usefulness and adequacy of information within the same content domain.
2.3.1. Accommodation Information
Accommodation information refers to the extent to which travel blogs and vlogs provide useful details about lodging options, locations, prices, facilities, service features, booking procedures, and visitor experiences. Accommodation is an important component of travel planning because it affects budget, convenience, accessibility, safety, and the organization of daily activities.
The diagnostic contribution of accommodation information depends on whether it helps prospective tourists assess the feasibility and suitability of staying at the destination. General descriptions of hotels may provide limited decision support, whereas comparisons of prices, locations, facilities, and firsthand experiences may help tourists identify options compatible with their needs. Travel-blog users have been found to value accommodation-related information when selecting travel products and services [
6]. Within digital commerce, such information can also connect destination evaluation with subsequent searches and transactions through accommodation and booking platforms.
Accommodation information remains conceptually distinct from destination diagnosticity. It describes the usefulness of content concerning one component of the trip, whereas destination diagnosticity reflects the broader capacity to evaluate Khon Kaen as a destination alternative. Accordingly:
H5. The perceived usefulness of accommodation information in travel blogs and vlogs positively influences the perceived diagnosticity of Khon Kaen as a travel destination.
2.3.2. Itinerary Information
Itinerary information refers to content that assists tourists in organizing travel routes, schedules, activity sequences, and the allocation of time across a destination. It may include suggested day trips, transportation connections, recommended visiting periods, estimated travel times, and combinations of destination activities.
Itinerary planning requires tourists to integrate dispersed information while considering constraints such as distance, transportation, operating hours, weather, congestion, and available time. Content that organizes these elements into a coherent itinerary can reduce planning effort and enable prospective tourists to visualize how a visit could be implemented. Itinerary-related content is among the practical information categories valued by travel-blog users [
6], while user-generated content can support destination decisions by presenting experiences and planning information in an accessible form [
7].
In Khon Kaen, itinerary information can demonstrate how cultural sites, restaurants, attractions, events, and surrounding areas may be combined within a feasible visit. This information should improve destination diagnosticity by helping prospective tourists determine whether the destination can satisfy their preferences within their time and resource constraints. Therefore:
H6. The perceived usefulness of itinerary information in travel blogs and vlogs positively influences the perceived diagnosticity of Khon Kaen as a travel destination.
2.3.3. Attraction Information
Attraction information refers to content describing a destination’s natural, cultural, historical, recreational, gastronomic, and event-based experiences. It may concern both well-known and lesser-known attractions, including cultural sites, local communities, museums, temples, festivals, restaurants, and surrounding destinations. This information allows prospective tourists to assess whether the experiences available at a destination correspond with their interests and travel motivations.
Travel blogs and vlogs can make attraction information more accessible and vivid by combining factual descriptions with images, videos, creator narratives, and visitor perspectives. User-generated content can also increase the visibility of less conventional attractions that receive limited attention in formal destination promotion. Research indicates that blogs and vlogs shape destination evaluation by communicating experiential representations of destination attributes [
7]. Attraction information is also among the forms of travel-blog content most valued by prospective tourists [
6].
Attraction information remains distinct from perceived destination diagnosticity. The former concerns the perceived usefulness of content describing what can be experienced, whereas the latter concerns whether the overall content enables the destination to be evaluated and compared with alternatives. Attraction information should contribute to this broader evaluation by clarifying the range and relevance of destination experiences. Accordingly:
H7. The perceived usefulness of attraction information in travel blogs and vlogs positively influences the perceived diagnosticity of Khon Kaen as a travel destination.
2.4. Perceived Destination Diagnosticity as the Organism
Perceived destination diagnosticity refers to the extent to which available travel content helps prospective tourists understand, compare, and evaluate a destination. The construct is grounded in accessibility–diagnosticity reasoning, which proposes that information is more likely to influence judgment when it is accessible and perceived as useful for evaluating an alternative [
9,
10]. Thus, information does not influence consumer judgment solely because it is available. It must also assist the consumer in distinguishing among alternatives or evaluating the focal option.
Online diagnosticity research similarly indicates that digital information and presentation mechanisms can improve consumers’ understanding and evaluation of products and alternatives [
11,
12]. In travel settings, inaccurate information may reduce perceived trustworthiness and weaken destination intentions [
17], while online travel-platform information can contribute to trust, attitude formation, and booking intention by supporting the evaluation of available options [
18].
Destination diagnosticity is conceptually distinct from several related constructs. It is not equivalent to the quantity or richness of information because extensive content may remain irrelevant or confusing. It differs from information usefulness, which reflects a broader assessment of whether information assists task performance. It is also distinct from destination image, which concerns the beliefs, impressions, or associations held about a destination. Diagnosticity captures whether information enables evaluation and comparison, not whether that evaluation is favorable. Information adoption reflects the decision to accept and use information, while diagnosticity represents a judgment about its evaluation-support capacity. Finally, uncertainty reduction may result from diagnostic content but does not fully define it, because diagnosticity also includes understanding and comparison.
Within the S-O-R framework, perceived destination diagnosticity represents a cognitive organism because it reflects an internal judgment formed after external content cues have been processed. Novelty may expand accessible destination knowledge, reliability may increase confidence in that knowledge, understandability may facilitate its interpretation, and interestingness may sustain attention. Accommodation, itinerary, and attraction information may provide functional evidence about the feasibility and desirability of a potential visit. Together, these stimuli establish the informational basis from which prospective tourists evaluate Khon Kaen.
2.5. Intention to Visit Khon Kaen as the Response
Intention to visit refers to an individual’s conscious willingness, plan, or likelihood of traveling to a destination within a specified future period. It represents a prospective behavioral response rather than completed visitation. The construct therefore concerns personal intention, planning, likelihood, and willingness to make an effort to visit. Recommendation intention is conceptually different because an individual may recommend a destination without intending to visit it personally.
Digital travel information can shape visit intention by enabling prospective tourists to develop clearer and more confident evaluations. Travel-blog content characteristics have been shown to influence destination-related behavioral intentions [
4], while influencer trustworthiness and information quality contribute to travel decisions [
2]. Source credibility and inspiration may also influence travel-planning behavior through travel vlogs [
3]. Furthermore, cognitive and affective responses to online tourism information can shape conative destination evaluations [
15].
Perceived destination diagnosticity should increase visit intention because tourists are more likely to consider a destination when the available content helps them understand its attributes, compare it with alternatives, and assess its suitability. This relationship represents the transition from the cognitive organism to the behavioral response. Therefore:
H8. Perceived destination diagnosticity positively influences tourists’ intention to visit Khon Kaen.
2.6. Indirect Effects Through Perceived Destination Diagnosticity
The proposed S-O-R process implies that travel-content stimuli contribute to visit intention through prospective tourists’ internal destination evaluation. The content must first provide a sufficiently credible, distinctive, comprehensible, engaging, or functionally relevant basis for evaluating Khon Kaen. Perceived destination diagnosticity then translates this information into a behavioral inclination.
This study therefore tests specific indirect effects rather than treating mediation as a single omnibus relationship. Because the conceptual model emphasizes an indirect S-O-R sequence and does not use a longitudinal or experimental design, the resulting estimates are interpreted as statistical indirect effects rather than definitive evidence of causal mediation. The following hypotheses are proposed:
H9a. Perceived destination diagnosticity mediates the relationship between accommodation information and intention to visit Khon Kaen.
H9b. Perceived destination diagnosticity mediates the relationship between attraction information and intention to visit Khon Kaen.
H9c. Perceived destination diagnosticity mediates the relationship between content interestingness and intention to visit Khon Kaen.
H9d. Perceived destination diagnosticity mediates the relationship between content novelty and intention to visit Khon Kaen.
H9e. Perceived destination diagnosticity mediates the relationship between content reliability and intention to visit Khon Kaen.
H9f. Perceived destination diagnosticity mediates the relationship between content understandability and intention to visit Khon Kaen.
H9g. Perceived destination diagnosticity mediates the relationship between itinerary information and intention to visit Khon Kaen.
The proposed relationships are summarized in
Figure 1.
3. Research Methodology
3.1. Research Design
This study employed a quantitative, cross-sectional survey design to examine how the perceived characteristics and planning functions of travel-blog and travel-vlog content were associated with prospective tourists’ intention to visit Khon Kaen, Thailand. The conceptual model was grounded in the Stimulus–Organism–Response framework, which proposes that environmental stimuli influence individuals’ internal cognitive or affective states and subsequently shape their behavioral responses [
13]. Content novelty, content reliability, content understandability, content interestingness, accommodation information, itinerary information, and attraction information were conceptualized as perceived informational stimuli. Perceived destination diagnosticity represented the cognitive organism, while intention to visit Khon Kaen represented the behavioral response.
The model assessed the relationships between the seven travel-content stimuli and perceived destination diagnosticity, the relationship between perceived destination diagnosticity and visit intention, and the specific indirect relationships between each content stimulus and visit intention through perceived destination diagnosticity. This specification builds on previous research demonstrating that perceived travel-content characteristics influence destination evaluations and behavioral intentions [
4] and responds to calls for closer examination of the internal cognitive processes through which travel-vlog exposure is associated with destination-related responses [
8]. Because the study used cross-sectional, self-reported data, the estimated relationships were interpreted as statistical associations rather than definitive causal effects.
3.2. Target Population and Eligibility Criteria
The target population comprised adults aged 18 years or older who had previously viewed or read travel-blog or travel-vlog content concerning Khon Kaen. Exposure to relevant digital travel content was required because respondents needed an experiential basis for evaluating the content’s novelty, reliability, understandability, interestingness, and destination-planning value.
Two screening questions were used to determine eligibility. The first established whether respondents were at least 18 years old, while the second determined whether they had previously viewed or read travel-blog or travel-vlog content about Khon Kaen. Respondents who were younger than 18 years or had not encountered relevant Khon Kaen travel content were excluded from the analytical sample.
The outcome construct was operationalized as prospective intention to visit Khon Kaen within the following 12 months. Accordingly, all respondents answered the same first-visit-intention items, including their intention, plan, willingness to make an effort, and likelihood of visiting Khon Kaen. However, the questionnaire did not record respondents’ prior visitation to Khon Kaen. Therefore, although the measures were framed in terms of prospective visit intention, it was not possible to verify whether every respondent was a first-time prospective visitor or to distinguish first-visit intention from revisit intention among respondents who might have previously visited the destination. This issue is acknowledged as a limitation of the study.
3.3. Data Collection and Sample
Data were collected from 1 to 30 August 2025 through on-site and online survey administration. The on-site survey was conducted at Khon Kaen Bus Terminal 3 and generated 10 responses. The online questionnaire was administered through Google Forms and distributed in Facebook communities related to tourism and travel in Khon Kaen, including Kinn Tiao Khon Kaen and Pa Kinn Pa Tiao Khon Kaen. The survey was also distributed through other relevant online communities to reach individuals who had encountered travel-blog or travel-vlog content about Khon Kaen.
A nonprobability purposive-sampling technique was employed because respondents were required to satisfy the predefined age and digital-content-exposure criteria. This approach enabled the recruitment of respondents with sufficient experience to evaluate Khon Kaen-related travel blogs and vlogs. Nevertheless, because participation was voluntary and recruitment relied primarily on selected Facebook communities, the sample should not be considered statistically representative of all prospective visitors to Khon Kaen.
A total of 423 questionnaires were recorded. Two cases were excluded because the respondents had not previously viewed or read relevant Khon Kaen travel content, while 18 cases were excluded because the respondents were younger than 18 years. The screening procedure resulted in a final analytical sample of 403 cases, representing a usable-case rate of 95.27%. This percentage was not interpreted as a response rate because the number of individuals who viewed the recruitment invitation but did not participate was unknown.
The questionnaire recorded respondents’ annual frequency of using the Internet to search for travel information but did not record previous visitation to Khon Kaen. Consequently, it was not possible to determine whether the 10 respondents recruited at Khon Kaen Bus Terminal 3 were current visitors, previous visitors, local residents, or prospective visitors. The dependent construct was presented uniformly to all respondents as intention to visit Khon Kaen within the following 12 months. Nevertheless, the absence of prior-visitation information prevented a separate analysis of first-visit and revisit intentions. This is a limitation of this study.
Participation was voluntary. Before accessing the substantive questionnaire, respondents received information concerning the study’s purpose, eligibility requirements, confidentiality protections, data use, and right to withdraw without penalty. All respondents provided informed consent before proceeding to the questionnaire.
3.4. Questionnaire Development
The questionnaire was developed to assess respondents’ perceptions of travel-blog and travel-vlog content concerning Khon Kaen. It consisted of three sections. The first section collected respondents’ demographic and screening information, including age, gender, educational level, annual frequency of using the Internet to search for travel information, and previous exposure to Khon Kaen-related travel blogs or vlogs. Prior visitation to Khon Kaen was not included. The second section measured the seven perceived content stimuli: content novelty, content reliability, content understandability, content interestingness, accommodation information, itinerary information, and attraction information. The third section measured perceived destination diagnosticity and intention to visit Khon Kaen.
Before answering the substantive measurement items, respondents were instructed to consider the travel-blog or travel-vlog content about Khon Kaen that they had previously viewed or read. This common referent was used to ensure that the subsequent responses concerned Khon Kaen-related digital travel content rather than travel information in general.
All substantive items were measured using a five-point Likert-type agreement scale ranging from 1, “strongly disagree,” to 5, “strongly agree.” The same response scale was applied to all measurement items to avoid combining agreement, satisfaction, intensity, and likelihood formats within the questionnaire. The questionnaire was administered in Thai. Translation and back-translation procedures were conducted to ensure the reliability of questions.
3.5. Measurement of Constructs
The research model contained nine constructs: content novelty, content reliability, content understandability, content interestingness, accommodation information, itinerary information, attraction information, perceived destination diagnosticity, and intention to visit. Each construct was specified reflectively because its indicators were treated as manifestations of the corresponding underlying concept.
Content novelty, content reliability, content understandability, and content interestingness were adapted principally from Chen et al. [
4], who examined the behavioral influence of perceived characteristics of travel-blog content. The measurement of content reliability was also informed by research concerning travelers’ adoption of accommodation-related electronic word of mouth and the importance of accurate, relevant, valuable, and timely travel information [
19].
Accommodation, itinerary, and attraction information were conceptualized as separate categories of destination-planning information rather than as destination attributes or dimensions of destination diagnosticity. The indicators measured whether the encountered travel content supplied useful accommodation, itinerary, and attraction information that could support practical destination evaluation and travel planning. These measures were informed by previous research identifying accommodation, itineraries, attractions, transportation, and general destination information as important categories of travel-blog content [
6] and by research concerning the use of consumer-generated media for travel planning [
7].
The three destination-planning information constructs were retained as separate first-order reflective constructs rather than combined into a higher-order planning-information construct. Accommodation, itinerary, and attraction information represent distinct decision domains and are not interchangeable manifestations of a single concept. Travel content can, for example, provide detailed attraction information while offering limited accommodation or itinerary guidance. Their separate specification therefore permits an assessment of the relative contribution of each information category to perceived destination diagnosticity.
Perceived destination diagnosticity measured the extent to which travel-blog and travel-vlog content helped respondents understand, compare, and evaluate Khon Kaen as a destination. The indicators were adapted from online diagnosticity research, in which diagnosticity refers to the ability of digital information or presentation mechanisms to facilitate consumers’ understanding and evaluation of available alternatives [
11,
12].
Intention to visit Khon Kaen measured respondents’ prospective intention, planning, willingness to make an effort, and likelihood of visiting the destination within the following 12 months. The indicators were adapted from established destination-intention measures [
20,
21]. Recommendation intention was not included because recommending a destination to another individual is conceptually distinct from one’s own intention to visit. Although the indicators were prospectively framed, the absence of prior-visitation data means that the construct cannot empirically distinguish first-visit intention from revisit intention (see
Table 1).
3.6. Content Validation and Pilot Testing
Before the main data collection, the preliminary questionnaire was assessed for conceptual relevance, item clarity, and consistency with the S-O-R framework. The assessment considered whether the content-characteristic indicators represented perceived attributes of digital travel content, whether the destination-planning indicators captured the functional information supplied by the content, whether perceived destination diagnosticity represented an internal cognitive evaluation, and whether the visit-intention indicators measured respondents’ own prospective behavioral intentions.
The content-validation process involved three reviewers with expertise in tourism management. They evaluated the relevance, clarity, representativeness, and wording of the measurement items. Based on their assessment, minor revisions were made to each item. A pilot test was subsequently conducted with 50 eligible respondents who had previously encountered travel-blog or travel-vlog content about Khon Kaen. The pilot participants assessed the clarity of the instructions, measurement-item wording, response scale, questionnaire length, and technical functionality of the survey. The 50 pilot participants were excluded from the final analytical sample. Internal consistency was provisionally assessed using Cronbach’s alpha. The pilot-test coefficients were >0.6. Values of approximately 0.70 or higher were regarded as evidence of satisfactory preliminary internal consistency. Nevertheless, Cronbach’s alpha was not used as the sole basis for retaining or removing indicators because the coefficient can be influenced by the number of items, item redundancy, and the underlying dimensionality of a construct [
23].
Feedback from the pilot assessment resulted in the revision of items considered ambiguous, repetitive, or insufficiently aligned with their construct definitions. In particular, the duplicated content-understandability item was revised to eliminate repetition, while the item combining content interestingness with intention was corrected to avoid contamination between the predictor and outcome constructs. The revised instrument was subsequently employed in the main data collection, and its reliability and validity were evaluated through the PLS-SEM measurement model.
3.7. Data Screening and Statistical Analysis
The data were screened and analyzed using IBM SPSS Statistics 28 and SmartPLS 4.1.1.8. SPSS was used to identify ineligible cases, missing values, potentially duplicate submissions, response irregularities, and the distributions of the observed variables. The value 99, where used to represent an unclassified or missing response, was defined as missing and excluded from the relevant statistical analyses. Descriptive statistics included frequencies and percentages for respondents’ demographic characteristics and means, standard deviations, and correlations for the study constructs.
PLS-SEM was used to evaluate the proposed model because the study emphasized the explanation and prediction of perceived destination diagnosticity and intention to visit within a model containing seven exogenous constructs, one intervening construct, and one behavioral outcome. The analytical procedure followed a sequential assessment of the reflective measurement model and structural model [
24].
The reflective measurement model was evaluated using indicator loadings, Cronbach’s alpha, Dijkstra–Henseler’s rhoA, composite reliability, and average variance extracted. Discriminant validity was assessed using cross-loadings, the Fornell–Larcker criterion, and the heterotrait–monotrait ratio of correlations. Bootstrapped confidence intervals for HTMT were examined because cross-loadings and the Fornell–Larcker criterion may have insufficient sensitivity for identifying discriminant-validity problems [
25].
Following the measurement-model assessment, the structural model was evaluated using the inner variance inflation factors, standardized path coefficients, coefficients of determination (R2), effect sizes (f2), and predictive-performance measures. Statistical inference for the direct and specific indirect relationships was based on bias-corrected and accelerated bootstrapping with 5000 resamples. The bootstrap results were assessed using path coefficients, standard errors, t-values, p-values, and 95% BCa confidence intervals.
The specific indirect relationships were tested separately for H9a to H9g. An indirect relationship was considered statistically significant when its 95% bootstrap confidence interval did not include zero. Because the study used cross-sectional data, significant indirect relationships were interpreted as statistical indirect associations rather than definitive evidence of causal mediation.
The model’s out-of-sample predictive performance was examined using PLSpredict. The evaluation considered
Q2predict, root mean square error, and mean absolute error for the endogenous constructs. A positive
Q2predict value indicates that the prediction error from the PLS model is lower than that obtained using a naïve mean-based benchmark [
26].
Given that all constructs were measured using the same questionnaire and collected from the same respondents at one point in time, potential common-method bias was considered in the analysis. Common-method bias was statistically assessed using full-collinearity VIFs.
For the gender-based analysis, one respondent with an unclassified gender value was excluded because the category contained insufficient observations for group-specific model estimation. The final multigroup sample therefore consisted of 402 respondents, including 235 female and 167 male respondents.
Before comparing the female and male structural coefficients, measurement invariance was assessed using the Measurement Invariance of Composite Models procedure [
27]. MICOM comprised three sequential steps: establishing configural invariance, testing compositional invariance, and examining the equality of composite means and variances. This procedure was necessary to determine whether the constructs were measured equivalently across the two groups.
Following the MICOM assessment, permutation-based multigroup analysis was conducted to compare the female and male path coefficients directly. A gender difference was inferred only when the between-group coefficient difference was statistically significant. A path being statistically significant in one group but nonsignificant in another was not interpreted as evidence of a genuine between-group difference. Because gender moderation was not theoretically hypothesized before the analysis, the gender-based analysis was treated as exploratory.
3.8. Ethical Considerations
The study was reviewed by the Khon Kaen University Ethics Committee for Human Research and was granted an exemption under approval number 1582/2567, dated 25 June 2024. The exemption applied to survey research involving adult participants and minimal risk.
All respondents provided informed consent before participating. They were informed of the study’s objectives, procedures, voluntary nature, confidentiality protections, intended use of the data, and right to withdraw without penalty. No directly identifying information was reported in the study, and the analytical data were stored and processed in anonymized form. No financial incentives or other compensation were offered to participants.
5. Discussion
This study examined how the perceived characteristics and destination-planning functions of travel-blog and travel-vlog content were associated with intention to visit Khon Kaen through perceived destination diagnosticity. The findings supported the proposed relationships involving content novelty, content reliability, itinerary information, attraction information, and perceived destination diagnosticity. In contrast, content understandability, content interestingness, and accommodation information did not demonstrate statistically significant unique associations with perceived destination diagnosticity. Accordingly, the structural coefficients represent the unique associations estimated after accounting for substantial shared variance among the predictors.
Content novelty was positively associated with perceived destination diagnosticity (β = 0.168,
p = 0.005), supporting H1. Novel travel content may provide prospective tourists with unfamiliar information, lesser-known experiences, and distinctive perspectives that help differentiate Khon Kaen from competing destinations. This interpretation is consistent with evidence that novel online travel reviews provide additional decision value when they contribute information beyond what consumers have already encountered [
35]. From an accessibility–diagnosticity perspective, novel information becomes relevant to destination judgment when it helps consumers distinguish the focal destination from available alternatives [
9,
10]. The finding therefore suggests that novelty contributes to destination evaluation not merely because the information is new, but because it potentially expands the range of destination attributes available for consideration.
Content reliability was also positively associated with perceived destination diagnosticity (β = 0.179,
p = 0.030), supporting H2. Blog and vlog content perceived as accurate, dependable, and supported by credible details may provide respondents with greater confidence when evaluating Khon Kaen. This result is consistent with research indicating that trustworthy and high-quality tourism information facilitates information adoption and destination-related decision-making [
36,
37]. Reliability is especially relevant in tourism because many destination and service attributes cannot be fully evaluated until consumption. Prospective visitors must therefore depend on information supplied through digital channels when assessing destination suitability, accessibility, costs, and available experiences.
Content understandability was not significantly associated with perceived destination diagnosticity (β = 0.086,
p = 0.250); therefore, H3 was not supported. One possible explanation is that clear presentation represents a basic expectation of contemporary digital content rather than a characteristic that independently differentiates its diagnostic value. Understandable information may facilitate initial processing but may not provide sufficient evidence for destination evaluation unless the information is also distinctive, credible, detailed, and relevant to travel planning. This result differs from evidence showing that functional dimensions of travel-vlog information quality can enhance audience responses [
38]. However, the nonsignificant coefficient does not demonstrate that understandability is unimportant. Because content understandability was strongly correlated with several other constructs, its unique contribution may have been reduced after their shared variance was considered.
Content interestingness produced a negative but nonsignificant coefficient for perceived destination diagnosticity (β = −0.121,
p = 0.137); thus, H4 was not supported. Interesting travel content may attract attention, encourage continued viewing, and produce an engaging consumption experience without necessarily supplying the evidence needed to compare and evaluate a destination. This interpretation is broadly consistent with findings suggesting that engagement-oriented content characteristics may influence affective mechanisms, whereas relevant, complete, and value-added information contributes more directly to cognitive destination evaluation [
39]. Nevertheless, the negative coefficient should not be interpreted as evidence that interesting content reduces diagnosticity. Its nonsignificance, combined with the elevated correlations and collinearity among the predictors, suggests that it may reflect shared predictor variance or a suppression pattern rather than a substantive adverse relationship.
Accommodation information was not significantly associated with perceived destination diagnosticity (β = −0.041, p = 0.493); therefore, H5 was not supported. Accommodation may constitute a supporting travel component rather than the central attribute through which respondents distinguish Khon Kaen from competing destinations. Individuals may also obtain detailed accommodation information through dedicated booking platforms, hotel websites, and online travel agencies rather than relying primarily on travel blogs or vlogs. Accordingly, accommodation information presented in creator-generated travel content may offer limited additional diagnostic value once attraction and itinerary information are considered simultaneously.
Itinerary information was positively associated with perceived destination diagnosticity (β = 0.189,
p = 0.010), supporting H6. Itineraries organize attractions, routes, schedules, activities, and time requirements into actionable travel plans. Such information may help prospective tourists visualize how a visit could be implemented and determine whether Khon Kaen is compatible with their available time, preferences, and resources. This interpretation is consistent with research demonstrating that comprehensive, relevant, and value-added online tourism information supports tourists’ cognitive responses and destination-related evaluations [
39]. The result indicates that travel content may become diagnostically useful when it moves beyond general destination descriptions and shows audiences how a potential visit can be organized.
Attraction information demonstrated the strongest positive association with perceived destination diagnosticity (β = 0.514,
p < 0.001), supporting H7. Information about cultural, historical, natural, recreational, and gastronomic attractions directly communicates what prospective tourists can experience at a destination. It may therefore provide a particularly concrete basis for determining whether Khon Kaen corresponds with their interests and travel motivations. This finding is consistent with research showing that high-quality travel-vlog and social-media tourism information assists audiences in identifying where to go and what to do, thereby supporting destination evaluation and behavioral intention [
36,
40]. Attraction information also had a medium effect size, whereas novelty, reliability, and itinerary information had small effects. This pattern suggests that the content’s destination-specific subject matter may contribute more strongly to diagnosticity than its general presentation characteristics.
Perceived destination diagnosticity was strongly and positively associated with intention to visit Khon Kaen (β = 0.878,
p < 0.001), supporting H8. When digital travel content enabled respondents to understand, compare, and evaluate Khon Kaen, they expressed stronger intentions to visit the destination. This finding is consistent with the accessibility–diagnosticity perspective, which proposes that accessible information is more likely to influence judgment when it is perceived as useful for evaluating an alternative [
9,
10]. It also corresponds with evidence that diagnostic and high-quality digital information supports information adoption, trust, destination evaluation, and destination choice [
37,
40].
The magnitude of the PDD-to-ITV coefficient, its very large effect size, and the high explained variance in intention to visit should nevertheless be interpreted cautiously. The strong association may partly reflect conceptual proximity or the common positive response tendency arising from the use of self-reported measures in a single questionnaire. Furthermore, the questionnaire did not record prior visitation to Khon Kaen. The outcome therefore represents prospectively framed intention to visit but cannot distinguish first-visit intention from revisit intention among respondents who may have visited the destination previously.
The specific indirect-effect analysis provided further support for the proposed S-O-R sequence. Perceived destination diagnosticity transmitted the statistical associations of content novelty (β = 0.148, p = 0.005), content reliability (β = 0.157, p = 0.028), itinerary information (β = 0.166, p = 0.010), and attraction information (β = 0.451, p < 0.001) with intention to visit. H9b, H9d, H9e, and H9g were therefore supported. In contrast, the specific indirect relationships involving accommodation information, content interestingness, and content understandability were not statistically significant; thus, H9a, H9c, and H9f were not supported.
The particularly strong indirect relationship involving attraction information indicates that content describing concrete destination experiences may be associated with visit intention primarily when that information enables audiences to evaluate Khon Kaen as a travel alternative. These findings are consistent with research showing that cognitive mechanisms, including trust, resonance, destination evaluation, and information adoption, transmit the relationships between digital tourism information and behavioral intention [
37,
39,
40].
However, these results should be described as specific indirect effects, rather than full or partial mediation. The estimated model did not include direct relationships from the seven content stimuli to intention to visit. Consequently, the analysis cannot determine whether perceived destination diagnosticity represents complementary, competitive, indirect-only, or direct-only mediation [
39,
41,
42]. Moreover, the cross-sectional design cannot establish the temporal ordering needed for causal mediation. The findings therefore support statistical indirect associations consistent with the proposed S-O-R sequence but do not establish causal mediation.
The exploratory multigroup analysis did not identify statistically significant differences between female and male respondents. Although content novelty and content reliability were statistically significant within the female group and itinerary information was statistically significant within the male group, none of the corresponding between-group coefficient differences reached statistical significance. Attraction information and perceived destination diagnosticity were significant in both groups, but their coefficients also did not differ significantly across gender.
Accordingly, differences in within-group significance should not be interpreted as evidence that particular content characteristics are more important for one gender than another. The permutation results indicate that the structural relationships were statistically comparable across the female and male samples. Moreover, compositional invariance was not established for content novelty, further limiting interpretation of the CN-to-PDD comparison. The study therefore provides no empirical support for gender moderation, and gender-specific theoretical or managerial claims are not warranted.
5.1. Theoretical Contributions
This study makes three principal theoretical contributions. First, it integrates the S-O-R framework with the accessibility–diagnosticity perspective by conceptualizing perceived destination diagnosticity as a judgment-enabling cognitive organism. Previous digital tourism applications of S-O-R have frequently emphasized enjoyment, inspiration, trust, resonance, or destination image as internal mechanisms [
8,
37,
39]. The present study instead focuses on whether digital travel content enables audiences to understand, compare, and evaluate a destination. This specification clarifies how content exposure may be associated with behavioral intention through an internal assessment of the content’s capacity to support destination judgment.
Second, the study distinguishes between general content characteristics and destination-planning information. Content novelty, reliability, understandability, and interestingness describe how audiences perceive the content’s informational and presentational qualities. Accommodation, itinerary, and attraction information instead represent the functional subject matter supplied by the content. This distinction enables a more precise assessment of whether destination diagnosticity is associated with how content is communicated, what practical information it provides, or both.
The findings indicate that novelty and reliability had significant but small unique associations with perceived destination diagnosticity, while itinerary information also had a small association and attraction information had a medium association. Understandability and interestingness were not significant after the other predictors were considered. These results suggest that engaging and accessible presentation may not independently generate diagnostic value unless the content also provides credible, distinctive, and destination-specific evidence.
Third, the study contributes to electronic-commerce research by explaining how influencer-mediated and user-generated travel content may support consumers’ pre-purchase evaluation of tourism offerings. Travel blogs and vlogs connect content exposure with subsequent evaluations of destinations, attractions, accommodation, transportation, and other travel services. Perceived destination diagnosticity therefore represents a potential cognitive bridge between digital-content engagement and commercial activities such as destination consideration, service comparison, information adoption, and travel booking.
The study also provides evidence of specific indirect relationships linking novelty, reliability, itinerary information, and attraction information with intention to visit through perceived destination diagnosticity. These results are consistent with the proposed S-O-R process, but they should not be treated as proof of causal mediation because the temporal sequence was not observed and the stimulus-to-intention direct relationships were not estimated. The theoretical contribution therefore lies in identifying a plausible judgment-enabling mechanism that should be tested more rigorously in subsequent longitudinal and experimental research.
Finally, the gender analysis contributes primarily by demonstrating the importance of distinguishing within-group statistical significance from statistically significant between-group differences. The direct permutation comparison found no significant gender differences. The results consequently support structural stability across the female and male respondents rather than gender-contingent theoretical relationships.
5.2. Practical Implications
The findings provide practical guidance for destination management organizations, tourism businesses, digital platforms, and travel-content creators. Attraction information should receive the greatest emphasis because it demonstrated the strongest positive direct and indirect associations with perceived destination diagnosticity and intention to visit. Blogs and vlogs should provide concrete information about cultural sites, local communities, festivals, gastronomy, recreational activities, lesser-known attractions, accessibility, opening hours, entrance costs, and recommended visitor experiences. Visual demonstrations, location details, and firsthand explanations may further help audiences assess whether the available experiences match their travel interests.
Itinerary information should also be presented in an actionable format. Content creators and destination marketers may develop one-day, weekend, and multi-day itineraries that connect attractions, restaurants, cultural sites, transport options, and nearby areas. Information should be organized according to geographic location, travel time, budget, visitor interests, and seasonal conditions. Such organization can help audiences evaluate whether visiting Khon Kaen is practically feasible and how destination experiences can be combined within their constraints.
Content reliability should be strengthened by ensuring that prices, opening hours, transport details, accessibility information, booking requirements, and seasonal conditions are accurate and current. Content creators should distinguish personal opinion from factual information, identify the date of their visit, disclose sponsored relationships, and update or remove outdated recommendations. Destination management organizations and tourism businesses can support this process by providing verifiable information, media resources, and update channels for creators.
Novel content can further improve destination differentiation. Promotional communication should highlight lesser-known attractions, local cuisine, community-based experiences, cultural traditions, creative districts, seasonal events, and connections between Khon Kaen and nearby destinations. However, novelty should be supported by accurate and decision-relevant details. Unusual or visually appealing content may attract attention, but it may not facilitate destination evaluation unless audiences can understand why the experience is relevant and how it can be incorporated into a visit.
The nonsignificant findings for content understandability, interestingness, and accommodation information should not be translated into recommendations that these elements are unnecessary. Interesting and understandable content may remain important for attracting attention and facilitating information processing, while accommodation information remains an essential component of travel planning. The results only indicate that these constructs did not explain unique variance in perceived destination diagnosticity after the other highly correlated predictors were considered.
No gender-specific content strategy is recommended. Although some relationships were significant within one group and nonsignificant within the other, the direct permutation tests showed no statistically significant differences between female and male respondents. Destination marketers should therefore avoid assuming that female audiences require novelty and reliability while male audiences require itinerary information. Instead, attraction information, credible details, and actionable planning guidance should be emphasized across audiences, with segmentation based on empirically validated travel motivations, interests, destination familiarity, budget, trip purpose, or media-use behavior.