Abstract
In contemporary e-commerce, enterprises coordinate transactions, supply chains, and customer interactions within platform-based, data-intensive ecosystems. Integrated office application (IOA) serves as the operational backbone of these ecosystems by unifying communication, content management, workflow automation, and analysis across procurement, fulfillment, and after-sales service processes. As e-commerce processes become fully digitized, employees’ daily interactions with IOA directly impact service quality, operational efficiency, and sustainability outcomes. However, the micro-mechanisms by which IOA attributes translate into sustainable work practices are under-explored in the e-commerce literature. This study aims to explore how system quality, information quality, and collaboration quality influence user perceptions (perceived ease of use and usefulness), social influences (subjective norms), and satisfaction, thus jointly driving user intention and IOA-enabled sustainable behaviors. By integrating the Technology Acceptance Model, the Theory of Planned Behavior, and the IS Success Model, this research elaborates in a human-centered way on how an e-commerce enterprise’s system support can promote corporate and individual sustainability through employees’ adoption and continuous effective use.
1. Introduction
The accelerated expansion of e-commerce has reshaped traditional business processes and work performance outcomes [1]. In this context, sustainability is no longer confined to environmental protection but encompasses organizational resilience, employee well-being, and long-term operational viability, especially in labor-intensive, digital environments [2]. While previous research has identified the macro-drivers of digital enterprise sustainability, such as policies supporting industrial transformation through technology [3] or corporate social responsibility initiatives [4], a crucial micro-level gap remains regarding how everyday digital tools shape sustainable work practices at the individual and team levels.
Previous studies have emphasized organizational levers for encouraging sustainable behavior, including gamification, social interaction, and pay satisfaction, and have documented the negative impacts of work stress [5]. However, these studies have overlooked the socio-technical infrastructure that sustains daily work interactions [6], especially Integrated Office Applications (IOA), which is the cornerstone of coordinating work in the e-commerce environment. Typical applications included in IOA are collaboration tools like Slack and Microsoft Teams, project management software such as Asana and Trello, and content management systems such as SharePoint and Google Docs. By standardizing communication, version control, and task orchestration across devices and operating systems, IOA reduces transactional friction; increases information transparency; and enables flat, responsive coordination. These functions facilitate quicker content updates, coordinated customer service, and synchronized order fulfillment. As a result, the flexibility of e-commerce processes is enhanced, promoting the sustainability of e-commerce enterprises and individuals. Despite the widespread use of IOA, the mechanisms by which it influences sustainability outcomes remain theoretically unexplained.
This study aims to address this research gap. From a theoretical integration perspective, it explores how the user experience of IOA in the e-commerce industry translates into sustainable work practices. While the technology acceptance model (TAM) and the information systems (IS) success model explain technology adoption and system effectiveness and the theory of planned behavior (TPB) clarifies behavioral intentions, none of these models alone can fully explain the path from system quality to sustainability. This study extends the information technology performance logic to the e-commerce field [7,8] and integrates these frameworks to uncover the mechanisms by which IOA promotes efficiency improvements and durable, resilient, and socially responsible work practices.
It also positions IOA as a lever that can drive the development of e-commerce through seamless digital coordination and promote sustainability through healthier and more sustainable work practices. To maintain conceptual simplicity and measurement rigor, sustainability was operationalized as employees’ long-term work intention and sense of belonging [9], as direct and observable outcomes of IOA-mediated work. These behaviors form the basis of a broader sustainability agenda related to e-commerce. Consequently, the empirical research focused on capturing the behavioral prerequisites through which IOA can achieve environmental, social, and resilience outcomes. Guided by the TPB, TAM, and IS success model, this study explores how perceptions of system quality, information quality, and collaboration features shape user satisfaction and subjective norms through perceived usefulness and ease of use, and how these factors, together with perceived behavioral control, influence the intention and behavior of sustainable work in e-commerce.
E-commerce enterprises face significant pressure to minimize waste, retain talent, and maintain service continuity during periods of rapid expansion. Achieving these goals relies on sustainable human–computer interaction. IOA can alleviate employee burnout, enhance role clarity, and align individual behaviors with the organization’s sustainability goals by standardizing work processes, reducing redundant communication, and enabling transparent collaboration. For small-and medium-sized enterprises (SMEs), which typically lack dedicated sustainability programs, IOA can serve as an accessible lever integrated into daily operations to promote sustainable practices. Therefore, understanding how and why IOA shapes sustainable behavior is crucial for both theory and practice. The research provides practical guidance to organizations seeking to leverage investments in IOA to build stable, responsive, and sustainability-oriented digital workplaces for e-commerce, thereby enhancing corporate performance and individual well-being.
2. Theoretical Background and Model Construction
2.1. TPB, TAM and IS Success Models
This study integrates three important perspectives from information systems and organizational behavior to explain how IOA shapes employees’ intentions and behaviors in the digitally mediated workplace within the e-commerce industry. These perspectives include the theory of planned behavior (TPB), the technology acceptance model (TAM), and the information systems (IS) success model. Consistent with post-adoption research, continued use of an information system and subsequent outcomes are influenced by previous experience with the system and beliefs formed through that experience [10]. Melville [11] extended this view at the user level by proposing the belief-action-outcome (BAO) framework, which tracks how potential perceptions translate into specific actions and measurable outcomes when organizations adopt sustainable information systems. Building on this, the present study has developed a belief-action model focusing on user experience factors in IOA within the e-commerce context. This model examines how these evaluations ultimately form intentions and sustainable behaviors related to e-commerce operations and the long-term well-being of individual employees. This study deliberately restricted the attitudinal, normative, and control paths to prevent the diffusion of concepts in the model and clarify how IOA traits map onto cognitions and downstream outcomes.
Firstly, the theory of planned behavior (TPB) provides a concise explanation for why employees in e-commerce implement target behaviors at work. According to Ajzen [12], behavior is the result of rational planning and is determined by behavioral attitudes (BA), subjective norms (SN), perceived behavioral control (PBC), and behavioral intentions (BI). However, in the context of technology-enabled post-adoption behavior, the attitude dimension often conceptually and empirically overlaps with user satisfaction (US), and US is a core attitudinal concept in the IS Success model. Both BA and US reflect an individual’s overall positive or negative evaluation of participating in a certain system or behavior. To avoid conceptual overlap and ensure the parsimony of the model, this study excluded behavioral attitude and instead treated user satisfaction as the main attitudinal mediating variable. This decision is consistent with the broader literature [13], which regards satisfaction as an emotional anchor that links system quality perceptions to behavioral intentions in post-adoption situations.
In the context of IOA, subjective norms (SNs) capture the expectations generated from digitally enhanced interactions among colleagues and management, while perceived behavioral control (PBC) reflects the perceived ability to mobilize IOA resources to complete tasks. Both are crucial when IOA becomes the connecting point of e-commerce processes. For instance, the fulfillment of omnichannel orders requires coordinated cross-functional collaboration and timely information sharing, which depends on employees’ perceived control and the normative signals embedded in the platform-based workflow.
Secondly, since trust, learning, and regular use of IOA are inseparable from the adoption of digital technologies in the e-commerce industry, the technology acceptance model (TAM) is also of great importance. Davis [14] formally proposed perceived usefulness (PU) and perceived ease of use (PEOU) to explain the acceptance and use of information systems. TAM has proven to be a stable and reliable measurement method across situations [15,16]. In technology adoption in e-commerce workplaces, behavioral intention is the proximal driver of use and is shaped by PU and PEU [17,18]. When deploying IOA to coordinate e-commerce work such as content updates, service recovery, and distributed project tracking, PU captures the platform’s perceived performance advantages, and PEU captures the frictions in daily interactions. Both are directly affected by users’ experiences with the system, information, and collaboration functions. They are conceptually distinct, so they are modeled through different paths.
Then, the information systems (IS) success model supplements the theory of planned behavior (TPB) and the technology acceptance model (TAM) by clarifying the quality preconditions for employee satisfaction and usage rates, as well as linking them to the net benefits of e-commerce enterprises. DeLone and McLean [19] categorized IS success as consisting of information quality, system quality, service quality, intention to use, user satisfaction (US), and net benefits [20]. These quality dimensions influence usage rates and satisfaction, which determine final outcomes. In the context of e-commerce, the information systems success perspective clarifies the quality preconditions and positions user satisfaction (US) as an attitudinal mediating variable between beliefs (PU, PEU) and intentions.
Meanwhile, the literature also points out its limitations, such as the incomplete specification of the structural determinants of net benefits [21]. Therefore, in the integrated model, this study designates US as the sole attitudinal construct and treats quality constructs strictly as system attributes rather than beliefs. This separation reduces conceptual overlap with the TAM. Additionally, the study refrains from modeling net benefits to avoid cross-level confounding and focuses on individual-level sustainability outcomes.
Ultimately, to enhance conceptual clarity and avoid redundancy among the three theories, this study explicitly sorted out the overlapping constructs. Specifically, both behavioral attitude and US represent overall emotional evaluations. Therefore, this study retained only US. The quality constructs of the IS success model are exogenous traits. PU and PEU are different cognitive beliefs that are not covered by the TPB or the IS success model, so they were included in the study. SN and PBC involve social influence and agency, dimensions that do not appear in the TAM and the IS success model, and were retained as unique determinants of behavioral intention. This selective integration ensures that each theoretical perspective contributes non-overlapping and theoretically grounded constructs, thus enhancing the model’s coherence and explanatory power. Figure 1 shows a combined diagram of the three models and clarifies how they are interrelated in the context of e-commerce.
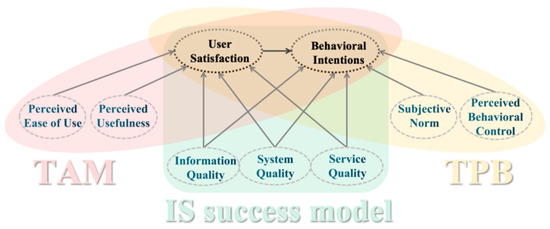
Figure 1.
Combination of TPB, TAM and IS Success models.
This integrated theoretical stance underpins the core premise of this study. Specifically, when enterprises implement IOA, the platform not only streamlines the internal processes underpinning e-commerce, such as faster cycles, coordinated responses, and transparent handovers, but also constructs a belief–attitude–intention–behavior pathway that encourages sustainable work behaviors. In this way, IOA can facilitate the development of e-commerce and promote the sustainability of both enterprises and individuals. This integration maintains simplicity and theoretical consistency by clarifying the role of each construct family in this path.
2.2. A Research Model for Evaluating User Experience Factors in IOA
Leveraging the synergy among the TPB, TAM, and IS success models, this study proposes a research model that tracks how user experience qualities of IOA in the e-commerce industry influence beliefs, attitudes, and intentions related to sustainable work. It is worth noting that, in the environment of e-commerce enterprises, which are characterized by cross-project work, fluctuating demands, and time-sensitive coordination, employees rely on online collaboration and e-workflows to complete tasks [9]. When such collaboration is achieved through IOA, manufacturers can reduce losses and improve capacity utilization under unstable demand. This operational logic is consistent with sustainable performance [22]. To capture this logic within an IS-success-oriented structure, this study replaces service quality with collaboration quality (CQ). This substitution indicates that, in an IOA environment, collaborative services are embedded in the platform’s functions (e.g., channel handovers, document co-editing, and task orchestration) rather than in external service interactions. This substitution also reduces the overlap with the TAM belief set, as CQ is modeled as a system attribute that drives PU and SN, rather than a belief itself.
Therefore, the dimensions of the IOA user experience are conceptualized as system quality (SQ), information quality (IQ), and collaboration quality (CQ). Figure 2 depicts the proposed framework. SQ and IQ influence PEU and PU, while CQ influences PU and SN. PEU and PU influence US, and SN, PBC, and US influence the intention of sustainable work behavior (SBI). SBI, in turn, drives sustainable work behavior in e-commerce. This mapping preserves the structural distinctions among different models.
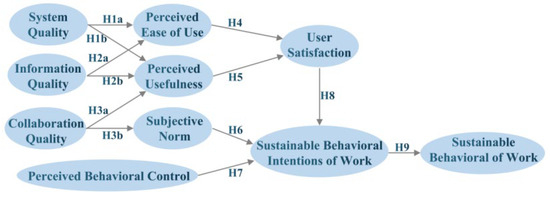
Figure 2.
Research framework model.
The model is designed with the goal of the sustainable development of e-commerce enterprises. First, by elevating CQ as a primary driver of the SN and PU, it establishes digitally mediated collaboration as a core feature of e-commerce operations, a prominent aspect of IOA. Second, it retains the TAM path from beliefs to attitudinal responses (US), acknowledging the evidence showing that quality perceptions shape employee satisfaction and usage outcomes [13,19]. Finally, it incorporates intention formation within the TPB, recognizing that SN and PBC jointly determine motivation to sustain work behaviors and benefits. These decisions maintain theoretical parsimony, minimize conceptual overlap, and enhance the contribution of the integrated TPB-TAM-IS Success framework in the context of IOA.
2.3. Based on the Hypotheses of the Research Framework Model
System quality (SQ) represents the reliability, responsiveness, and availability of the IOA platform. The IOA platform is the technological foundation of the user experience in e-commerce business processing. SQ determines the extent to which employees can efficiently complete tasks and indirectly influences their satisfaction, intentions, and behaviors through PU and PEU. Previous studies have shown that, apart from PU and PEU, important beliefs exist in office application environments [23] and that users usually require encouragement to extensively use installed work systems [24]. A stable and responsive SQ can reduce friction and support scalability. As intelligent assistants are increasingly integrated into IOA to accelerate daily tasks and build trust in automation, it is crucial to evaluate the relationship between SQ and PEU and PU for modeling the corporate adoption trajectory. Therefore, hypotheses are proposed.
H1a.
The system quality of IOA positively influences the users’ perceived ease of use.
H1b.
The system quality of IOA positively influences the users’ perceived usefulness.
Information quality (IQ) refers to the accuracy, timeliness, relevance, and completeness of outputs generated and disseminated through IOA. As a core evaluation dimension in e-commerce business processing [25], IQ influences satisfaction and intention. Studies on technology acceptance demonstrate that information credibility is a significant predictor of behavioral intention [26], and IQ is a critical precondition for PU and PEU [27]. Specifically, accurate and timely IQ improves judgment and reduces rework, driving the rapid progress of e-commerce businesses. In an IOA-coordinated workplace, business process information connects users to tasks and interdependencies. Industry background information supports decision-making quality and learning. These two information flows are functions of platform design and the enterprise’s support for sustainable employee learning. Therefore, this study anticipates that IQ can enhance PU and PEU.
H2a.
The information quality of IOA positively influences the users’ perceived ease of use.
H2b.
The information quality of IOA positively influences the users’ perceived usefulness.
According to Boughzala and De Vreede [28], collaboration is a core determinant of team output and organizational performance. High collaboration quality (CQ) can reduce coordination delays and is essential for enterprises to grow responsibly in the e-commerce industry and for individuals to have sustainable employment. As e-commerce becomes more globalized and products and services become more complex, enterprises are relying more and more on distributed, interdisciplinary, and cross-cultural teams [29]. Collaboration features, such as communication channels, co-creation, and visibility of work progress, can enhance perceived performance benefits (PU) by increasing the speed and reliability of interdependent work [30]. Conversely, CQ manifests as visible, work-related social cues, such as shared norms and responsiveness. These cues strengthen the perceived service efficiency by conveying expectations of how work “should” be done on the platform [31]. However, implementation is difficult because the quality of information sharing is a group-level criterion for effective collaboration, while technological attributes determine adoption and assimilation [32]. Therefore, the following hypotheses are proposed.
H3a.
The collaboration quality of IOA positively influences the users’ perceived usefulness.
H3b.
The collaboration quality of IOA positively influences the users’ subjective norms.
According to existing research, perceived ease of use (PEU) and perceived usefulness (PU) positively impact employees’ evaluations and perceptions [33]. Numerous studies have demonstrated the relationship between perceived usefulness, perceived ease of use, and behavioral intention [34]. In the e-commerce industry, however, user satisfaction (US) reflects the degree to which employees are satisfied with using the system to complete their tasks [35] and is influenced by multiple quality dimensions [36]. Literature on the IS success model shows that beliefs significantly influence US [37,38]. Therefore, when implementing IOA to support e-commerce workflows, higher PEU and PU should result in higher US, reflecting both tool fluency and perceived value [39].
H4.
Users’ perceived ease of use positively influences user satisfaction with IOA.
H5.
Users’ perceived usefulness positively influences user satisfaction with IOA.
Subjective norm (SN) represent employees’ perception of social pressure and expectations within an e-commerce organizational environment [40]. In the context of IOA, these expectations are amplified through persistent digital traces, shared dashboards, and visible participation patterns. These patterns extend beyond the tools themselves and encompass the relationships mediated by IOA. SN can also predict employees’ willingness to accept industry changes [41].
In contrast, perceived behavioral control (PBC) reflects users’ perceived ability to access and use IOA resources to achieve desired results. From users’ perspectives, perceived value aligns with net benefits [42] by integrating evaluations of past and future outcomes, as well as personal values and net benefits. In an IOA system, valuable resources such as time-saving templates, knowledge bases, and automation can be considered controllable costs [43]. The stronger the PBC, the more likely users are to maintain desired work behaviors. Therefore, examining whether PBC enabled by IOA enhances the willingness for sustainable work is of great significance.
Meanwhile, user satisfaction (US) refers to employees’ evaluative stance toward IOA [44] and can be considered the difference between expectations and perceived performance [45]. As a key and universal indicator of success in e-commerce operations [46]. improving US as a perceived reward mechanism supports employees’ continuous engagement with IOA and stable work practices.
Furthermore, user sustainable behavioral intentions (SBIs) measure the intensity of an individual’s willingness to participate in work continuously [47]. In this study, SBI represents employees’ willingness to work sustainably under the influence of IOA. Consistent with TPB, SBI is expected to stem from SN, PBC, and US. US reflects satisfaction-based motivation, while SN and PBC encode normative and control influences [48]. Therefore, the following hypotheses are proposed in this study.
H6.
Users’ subjective norms positively influence users’ sustainable behavioral intentions of work.
H7.
Users’ perceived behavioral control positively influences users’ sustainable behavioral intentions of work.
H8.
User satisfaction with IOA positively influences users’ sustainable behavioral intentions of work.
Numerous studies based on TPB, TAM and IS success suggest that human behavior largely depends on behavioral intention [48]. Positive attitudes strengthen intentions toward target behaviors [49], and strong intentions often predict subsequent actions. In the current context, a more robust SBI should result in more consistent sustainable work behaviors, which are crucial for resilient e-commerce operations and individuals’ long-term development within the company. Therefore, hypotheses regarding sustainable behavioral of work (SB) are proposed.
H9.
Users’ sustainable behavioral intentions of work positively influence users’ sustainable behavioral of work.
In summary, this study’s research framework integrates the TPB, TAM, and IS success models to explain how enterprise information-oriented management can be achieved through the integration of digital work platforms in an e-commerce context. These mechanisms improve internal efficiency and form the behavioral foundation for developing modern e-commerce. Subsequently, the empirical research methods of the model are introduced based on the integration of existing theories.
3. Method
3.1. Questionnaire Design
All constructs in the research model of this study are derived from previous research. The survey measures used in this study were adapted from the updated DMISM [19]. Experts from various positions in the e-commerce industry who have over five years of experience using integrated office apps reviewed this questionnaire. The scale consists of 10 constructs (40 items in total) that are given in the final version of the questionnaire. Responses were recorded on a seven-point Likert scale (1 = strongly disagree, 7 = strongly agree) for all construct items [50]. The complete list of measurement item sources is presented in Table 1.

Table 1.
Definition of variables and sources of reference scales.
To ensure cross-linguistic consistency and equivalence, the relevant measurement items were translated for English and Chinese versions of the questionnaire. A pretest was subsequently conducted with three professors specializing in information and interactive systems to evaluate the suitability and clarity of the translations. Their feedback informed targeted revisions to enhance item comprehensibility and precision.
3.2. Research Methodology
Structural equation modeling (SEM) was employed to examine the interrelationships among the components of the proposed model. SEM is applicable because it can simultaneously estimate complex models containing multiple endogenous and exogenous variables [66]. In this study, partial least squares SEM (PLS-SEM) was adopted as a causal-predictive method that links explanation and prediction [67]. The PLS-SEM path model is well-suited for evaluating causal models across different theoretical and empirical contexts and generally exhibits high composite reliability and convergent validity [68].
All analyses were conducted using SmartPLS (variance-based PLS-SEM). The choice of SmartPLS over AMOS (covariance-based SEM) is in line with the research design and objectives. Since the goal of this study is to explain the variance in key outcomes through causal prediction and assess out-of-sample correlations, using PLS-SEM is more appropriate [67]. Secondly, the model integrates multiple latent constructs and two measurement foci. Under these conditions, variance-based estimation has more advantages and fewer restrictions on distributional assumptions [66,68].
In contrast, AMOS is optimized for covariance-based confirmatory model testing, focusing on global model fit under more stringent distributional requirements. Given that this study mainly focuses on predicting the impact of user-experience factors of IOA on employees’ sustainable work behaviors in the e-commerce context, SmartPLS provides a more suitable estimation environment [69]. Therefore, using PLS-SEM in SmartPLS is consistent with the objectives and data characteristics of this study, and it supports a rigorous evaluation of the proposed relationships.
3.3. Data Collection
In information and e-commerce systems research, questionnaire surveys are a common method for studying human behavior and system usage [70]. This study adopted a non-probability convenience sampling strategy to recruit participants. Specifically, an online survey was conducted, which was hosted on a secure web platform. Survey links were used to recruit respondents through e-commerce enterprises and industry forums, as well as professional social media groups focused on digital office tools. The survey was carried out entirely online. Participants were voluntary and anonymous, aged 18 or above, and had at least three months of IOA usage experience in e-commerce-related workplaces. After completing the questionnaire, participants received a small cash incentive (equivalent to $2), which is a common practice in online survey research. It helps to increase the response rate without introducing response bias [71].
This survey consists of three parts. In the first part, respondents were asked whether they had worked in an enterprise related to e-commerce and had at least three months of experience using IOA for office work. If the answer was negative, the survey automatically ended. The second part included questions about the respondents’ demographic profiles. The third part contained items measuring the respondents’ continuous use of IOA. To lighten the burden on respondents and increase the completion rate of the 40 item questionnaire, this study logically grouped the constructs and used plain language.
Before comprehensively collecting data, this study conducted a pilot test (pretest; n = 55) to assess the face validity of the questionnaire, cross-language consistency, item clarity, survey flow, and method feasibility. Based on the feedback from the pre-test, minor adjustments were made to the wording and layout. The responses from the pre-test were excluded from the final sample. In addition, the recruitment process was divided into two stages. First, posts containing the survey link were published on the designated forums and mailing lists. One week later, reminder posts were published in the same channels, allowing for a snowball effect (participants could share the link with eligible colleagues).
All procedures adhered to ethical standards and received approval from the Research Ethics Review Committee (No. 2025204). The survey first provided respondents with a Participant Information Sheet introducing the research background and objectives. It was emphasized that their participation was completely voluntary, they could withdraw at any time without any consequences. Confidentiality and anonymity were safeguarded through digital coding procedures. Participants were informed that all data would remain confidential and used exclusively for academic purposes. Informed consent was obtained electronically; respondents read and digitally signed the consent form prior to participation.
Data collection lasted for two months. Out of the 680 questionnaires distributed through the above-mentioned channels, a total of 556 complete responses were received (a response rate of 81.76%). During the data screening process, an analysis was conducted to ascertain the standard deviation across 40 survey items. This analysis facilitated the identification and subsequent exclusion of questionnaires that either presented a standard deviation of zero. Furthermore, although PLS-SEM can tolerate relatively small sample sizes, the adequacy of the sample size hinges on model characteristics [72]. The final sample size for analysis was 505, surpassing the recommended value of at least 10 observations per item [73], thus ensuring the statistical power necessary for PLS-SEM analysis [18]. The entire procedure enables transparent and replicable data collection and can be employed to assess how IOA user experience factors relate to sustainable work behaviors within an e-commerce environment.
4. Results
4.1. Descriptive Statistical Analysis
Appendix B shows the basic profile of the respondents for descriptive analysis. The participant gender distribution comprised 268 males (53.1%) and 237 females (46.9%). The age distribution of the user base predominantly spanned the 30–39 (31.9%) and 18–29 (28.1%) age brackets, with less usage by older users, which may be related to the e-commerce industry’s relatively short history. This underscores the need for research on IOA in the context of e-commerce. Traditional industries’ organizational structures were established earlier, so they have greater difficulty accepting and reforming new information technologies [74]. Successful pilot cases are needed to promote IOA further. In addition, 27.1% of the respondents were from small or medium-sized enterprises (SMEs), and 23.0% of the respondents were from multinational enterprises. Of all the users surveyed, 87.9% used IOA for more than 5 h per day on weekdays. IOA is used by 87.9% of all respondents for more than 5 h per day on weekdays, which represents the popularity of IOA in the e-commerce industry.
4.2. Measurement Model
Firstly, the Unmeasured Latent Method-factor (ULMC) approach was adopted to assess the Common Method Bias (CMB). As shown in Appendix C, the average loading of the substantive factors (R1) was 0.858 (mean R12 = 0.738), while the average loading of the method factor (R2) was approximately 0.000 (mean R22 = 0.001), indicating that the common method component was negligible. After incorporating the method factor, all |R2| values were less than 0.10, the signs of the method-factor loadings showed a mixed distribution, and the substantive loading values remained at a high level, which is consistent with the absence of a systematic common method effect. These results conform to the expected pattern of the ULMC test, with the mean of the squared loadings of the substantive factors being significantly higher than that of the CMB factor loadings, suggesting no serious CMB problem. The observed associations mainly reflect substantive variance.
Subsequently, the research initiated a reliability analysis to evaluate the consistency and stability of the measurements. An increase in consistency corresponds to the questionnaire’s excellent reliability. This study measured the reliability of the four constructs through Cronbach’s α. Table 2 indicates that each construct achieved a factor loading above the 0.7 threshold, as recommended for Cronbach’s α [75]. The questionnaire’s overall Cronbach’s alpha coefficient stood at 0.880, meeting the assessment criteria and suggesting that the questionnaire’s reliability aligns well with anticipated standards.
Table 2.
Internal consistency reliability and convergent validity results.
Further ensuring the questionnaire’s validation and confirming its validity, this research study carries out a validation factor analysis that tests the model in terms of construct validity using the AVE extracted with the composite reliability. Overall, from Table 2, it can be inferred that the variables adopted by the model are accurate, as all AVE values exceed 0.5, and CR scores surpass the threshold of 0.70, as recommended by [75], indicating strong convergent validity.
Then, the study checked the latent variables for discriminant validity, demonstrating how independent assessment methods result in distinct measures for different features. Fornell and Larcker [75] propose evaluating the discriminant validity of factors by comparing the square root of each construct’s AVE with the correlations among constructs. If the square root of a construct’s AVE exceeds all off-diagonal elements in its corresponding rows and columns, it indicates stronger association with its own construct than with others. The discriminant validity test results, presented in Table 3, show that all diagonal elements (square roots of AVE) surpass the correlation coefficients in their respective columns, thus affirming discriminant validity.
Table 3.
Fornell-Larcker criterion.
Finally, the Heterotrait–Monotrait (HTMT) ratio of correlations, as introduced by Henseler et al. [76], serves as a measure for evaluating discriminant validity, addressing limitations found in the Fornell-Larcker criterion and cross-loading methods that may fail to identify numerous discriminant validity problems. A threshold of ≤0.90 is recommended for acceptable discriminant validity [77]. This study utilized the SmartPLS 4.0 to obtain the HTMT values for assessing discriminant validity. Analysis results presented in Table 4 indicate that all coefficients fall below 0.8, validating discriminant validity. Consequently, the measurement model demonstrates adequate construct validity [78].
Table 4.
HTMT correlation matrix.
4.3. Structural Model
4.3.1. Collinearity Statistics and F2 Test
The variance inflation factor (VIF) quantifies the extent to which the variance of regression coefficients is inflated due to multicollinearity [79]. As recommended by [80], a VIF value below 5 indicates no multicollinearity issues in the estimation of path coefficients. As shown in Table 5, all internal VIF values range from 1.000 to 1.308, well below the conventional threshold, suggesting that exogenous variables contribute different information to their respective endogenous targets, confirming that there are no serious multicollinearity problems in the structural model. This supports the stability and reliability of the estimated regression coefficients and enhances confidence in subsequent hypothesis testing. In addition to the variance inflation factor (VIF), the effect size (F2) was also evaluated to determine the substantive relevance of each predictive relationship [81]. Most of the paths have F2 greater than 0.02, meaning they have a good amount of effect. However, the F2 of the path of perceived behavioral control related to sustainable work behavioral intentions was 0.000, indicating no effect. The combined results of VIF and F2 confirm the statistical robustness and theoretical sophistication of the proposed model.
Table 5.
VIF and F2 analysis results.
4.3.2. Hypothesis Testing and Model Evaluation
The R2 value is a statistical indicator in regression analysis. It quantifies the percentage of variance in the dependent variable that can be attributed to the independent variables [82]. The analysis indicates that the data support all the proposed hypotheses, suggesting that the R2 value demonstrates the substantial explanatory power of the considered model. According to Table 6, it can be seen that the R2 of most of the dependent variables is above 0.2, which indicates that the model has good explanatory power. Table 6 also presents the results of evaluating the predictive relevance of the Q2 results through Blindfolding in SmartPLS. All Q2 values exceed the established threshold (above zero), suggesting that the model has the ability to indirectly predict its latent variables [66].
Table 6.
Results of R2 test and Q2 level assessment.
Furthermore, after confirming the model’s explanatory power, this research evaluated path coefficients’ statistical significance and importance [66]. Path coefficients, standardized forms of linear regression weights, facilitate examining potential causal links between statistical variables within the structural equation modeling framework [83]. Hypothesis testing uses the Bootstrap method to sample 5000 observations of the 95% confidence interval to determine if the correlated paths are significant by observing if the 95% confidence interval contains zero [84,85]. T statistics and p values were utilized to determine the statistical significance of the path coefficient β values [86]. The 5% statistical significance level indicates a p < 0.05 for the hypothesis to be accepted and a T statistics > 1.65.
Table 7 showcases the outcomes derived from the Bootstrap algorithm. Specific, Perceived behavioral control has no significant influence on Sustainable behavioral intentions of work (β = 0.001, p > 0.05), and the hypothesis is invalid. The 95% confidence intervals of all the remaining paths do not contain 0. The p values are less than 0.05. Consequently, the hypotheses of H1a–H3a, H1b–H3b, H4–H6, and H8–H9 are assumed to have a significant positive effect, and the hypotheses are valid.
Table 7.
Results of path analysis and hypothesis testing.
Finally, Figure 3 summarizes the results of the structural model, showing the explained variance (R2) of each key construct, the path coefficients of each hypothesized relationship, and their significance levels (non-significant paths are represented by dashed lines).
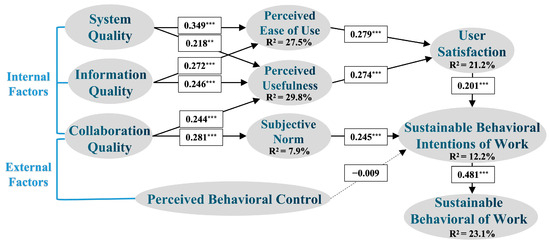
Figure 3.
Structural model results. Note: ** p < 0.01; *** p < 0.001; the dotted line represents the insignificant path.
5. Discussion
This study uses a framework that integrates the TPB, TAM, and IS success models to explain how IOA influences employees’ sustainable work practices in the e-commerce industry, thereby promoting e-commerce development. Using PLS-SEM, this research identifies the user-experience levers with the greatest impact on workplace sustainability outcomes and validates 11 out of 12 hypotheses. Unlike previous studies with an isolated, single-theoretical perspective [49,87], this study’s approach links system, information, and collaboration qualities with TAM cognitions (PEU/PU), attitudinal and normative mechanisms (US/SN), and ultimately, sustainable intentions and behaviors. Conceptually, this redefines the daily digital workplace platform, shifting its role from auxiliary to primary in achieving sustainability in the e-commerce industry. Demonstrating that the core IOA experience can catalyze sustainable practices of enterprises and individuals expands the evidence based on incentive mechanisms [4,5].
The findings of this study theoretically expand the TPB by identifying a socio-technical path through which IOA incorporates norms and attitudes into daily work. As an antecedent of SN at the platform level, CQ clarifies how functional visibility of daily collaboration reinforces normative expectations, eliminating the need for separate programs (H3b). Together with the impact of SN on SBI (H6), CQ provides a basis for the normative path of the TPB in digital teams. The research results also refine the TAM by clearly showing that SQ and IQ are upstream design levers that influence PEU and PU and ultimately integrate into US (H1a–H2b, H4–H5). In the integrated model, US serves as an attitudinal evaluation channel that avoids duplication with TPB attitudes while maintaining predictive validity for SBI (H8). IS Success is expanded by replacing service quality with CQ, which better reflects the inherent characteristics of IOA. The impacts of CQ on PU and SN (H3a–H3b) imply that the “service” in collaborative work is provided by the platform itself rather than external support functions. Finally, the strong association between SBI and SB (H9) links the belief-attitude-norm path to sustained behavior. This positions sustainability as an attribute that emerges from daily platform use rather than as an additional initiative.
To be specific, H1a, H1b, H2a, and H2b were all supported. System quality (SQ) and information quality (IQ) positively impact perceived ease of use (PEU) and perceived usefulness (PU). Consistent with established findings regarding information system (IS) success and adoption [13,88], these effects extend from consumer and e-commerce service environments to enterprise information architecture. Notably, the results of this study suggest that these classic quality-cognition associations propagate to satisfaction and norms, which ultimately influence sustainability outcomes. Reliability, accuracy, and timeliness can enhance PEU and PU, and shape sustainable intentions and behaviors as upstream design levers. These findings expand TAM and TPB, filling a void in workplace sustainability research [11]. For e-commerce operations demanding continuous synchronization of content, services, and fulfillment, strengthening SQ and IQ can reduce coordination friction, improve decision-making quality, and support resilient, low-waste processes beneficial to companies and employees.
H3a and H3b were also supported, establishing collaboration quality (CQ) as a precursor to perceived usefulness (PU) and subjective norms (SN). The functional affordances of IOA can help e-commerce teams address persistent collaboration challenges by establishing shared situational awareness [89], coordinating individual and collective goals [90], and selecting effective collaborative technologies [91]. This strengthens SN around appropriate work behaviors on the platform. Replacing service quality with collaboration quality allows the model to better reflect the performance evaluation of the IOA environment, in which collaboration is inherent to the system. The observed CQ-SN link provides an empirical sociotechnical microfoundation for the normative path of TPB, complementing research on shaping norms through explicit incentives [4]. In an e-commerce environment where throughput depends on rapid, interdependent actions, routine collaborative processes can establish sustainable practices without additional procedures, thereby improving operational agility and labor continuity.
H4 and H5 were supported, suggesting that PEU and PU increase user satisfaction (US). This finding aligns with previous research on e-services [87,92]. The research findings present a more complete chain of sustainable intention and behavior in the context of enterprise IOA, indicating that the enhancement of the daily IOA experience can jointly promote productivity and sustainability [10]. These results imply that enhancing the daily IOA experience can promote both productivity and sustainability simultaneously. In digital commerce, tool use is continuous rather than sporadic. Satisfaction consolidates tool fluency and perceived value, thereby strengthening employees’ long-term willingness to maintain high-quality, low-waste work habits.
The model also supports H6 and H8, indicating that sustainable behavioral intention (SBI) is positively influenced by social norms (SN) and user satisfaction (US). This is consistent with the view that the organizational context enhances end-user satisfaction and application utilization [93] and with evidence showing that satisfaction predicts continued use [94]. In an IOA environment characterized by high levels of collaboration and transparency, the US serves as a proximal attitudinal driver of sustainability, embedding shared expectations into daily practices. These results unify the normative and attitudinal paths of the TPB within a mechanism based on the use of a technology platform to support scalable e-commerce operations.
Consistent with previous sustainability research [95,96], SBI significantly predicts sustainable behavior at work (SB). This effect indicates that enhancing SQ, IQ, and CQ to boost PEU, PU, US, and SN represents the generation of meaningful behavioral benefits without the need for separate sustainability initiatives. For e-commerce, this means that investments in IOA can be directly translated into reliable execution, reduced rework, and sustained employee engagement, thereby enhancing business performance and individual well-being.
However, one hypothesis was not supported. Perceived behavioral control (PBC) did not significantly impact SBI, which differs from some previous research findings [97]. This indicates that in a standardized, collaboration-intensive IOA environment where access, work processes, and resources are regulated by platform policies, the perceived personal control has little incremental variance beyond SN and US. This reconciles the mixed evidence regarding PBC, suggesting that platform governance can attenuate the role of personal control in intention formation [98]. In this case, visible norms and satisfaction with shared tools may outweigh beliefs about personal control, resulting in a weak relationship between PBC and intention [99]. This boundary condition has implications for design and governance. When organizations use IOA to standardize processes and make collective behavior visible, shaping norms and satisfaction becomes a more reliable path to sustainability than merely attempting to increase perceived autonomy.
The integrated path redefines IOA, transforming it from a mere productivity tool into an infrastructure for sustainability. By clarifying how the digital platform can enhance personal well-being, social cohesion, and organizational resilience, IOA provides a theoretical advancement and practical blueprint for e-commerce enterprises seeking to integrate digital transformation with sustainability.
Furthermore, the research findings can be translated into priority improvement measures for e-commerce managers. Firstly, strengthen SQ, including response speed, stability, and interface clarity, to enhance PEU and PU. This will help shorten cycle times and reduce rework. Secondly, implement IQ governance, including ownership, freshness, service-level agreements, and relevance tagging, to reduce duplicate work and judgment errors and support waste-reducing operations. Thirdly, open up collaborative functions across multiple domains to enhance SQ and standardize sustainable work processes among teams. Fourthly, improve US through iterative user experience (UX) design of high-frequency work processes and in-app guidance. Finally, in highly standardized work processes, interventions for extensive autonomy should be reduced, as PBC does not add explanatory power. The remaining resources should be used to strengthen norms and improve user satisfaction. Together, these initiatives align platform design with sustainable behavior, benefiting enterprises and individuals alike.
6. Conclusions
This study integrates the Theory of Planned Behavior, the Technology Acceptance Model, and the IS Success Model to establish a comprehensive sociotechnical path from the quality of IOA to sustainable employee behavior. Through this unified perspective, the study clarifies how system, information, and collaboration quality influence perceived ease of use and perceived usefulness. These factors are then integrated into user satisfaction, which strengthens subjective norms. Ultimately, this cultivates sustainable work intentions and behaviors. This study’s innovation lies in identifying collaboration quality as a major driver of subjective norms and providing a specific mechanism through which daily platforms shape normative expectations.
Theoretically, the scope of application of this integrated framework extends from technology adoption and continuous application to sustainability-oriented digital work design, moving towards embedded and scalable change. This dynamic interaction mechanism enriches the existing literature, demonstrating how attitudinal and normative paths converge within the e-commerce environment. Although the empirical variables in this study capture individual behavior sustainability, the validated paths have broader implications. It redefines sustainability, no longer merely regarding it as general green actions but as a multi-dimensional construct that includes employee well-being at the individual level, a collaborative digital culture at the social level, and resilient and waste-reducing operations at the organizational level. Improving the quality of IOA can reduce repetitive work and rework, enhance employee engagement and equitable participation, and stabilize coordination and increase employee retention rates. Therefore, the measured behaviors can serve as a direct lever for enterprises to promote environmental management, social well-being, and resilience without changing the structure or results of the research.
At the practical level, the research findings provide practical guidance. By optimizing the usability, information clarity, and collaborative features of IOA, user satisfaction can be enhanced and prosocial norms can be strengthened. Prioritizing user-centered design, targeted training, and consistent communication strategies enables organizations to streamline interdependent work processes, reduce rework and coordination costs, and retain key talent. In an e-commerce environment where information speed and cross-functional coordination determine performance, these improvements can translate into faster cycle times, higher service reliability, and more resilient operations, benefiting both enterprises and their employees. In particular, SMEs with limited resources can integrate sustainability into their daily work without large-scale interventions.
There are several limitations worth considering. E-commerce channels with strict confidentiality requirements may necessitate customized IOA solutions, which could generate different usage patterns than those of widely deployed platforms. In global enterprises, geographical, cultural, and organizational differences may complicate unified adoption, highlighting the need to expand the scope of the sample. Additionally, while this study focuses on IOA-related drivers, employees’ sustainable behaviors are influenced by factors such as career development. Since this study uses a cross-sectional, self-reported design, it only captures perceptions at a single point in time. This limits causal inferences and requires cautious interpretation.
Future research could address these limitations by using longitudinal designs to track changes in sustainable work behaviors and by conducting cross-cultural analyses to test the model’s generalizability. Expanding the framework to include more antecedents, such as perceived organizational support or personal environmental values, could allow for a more nuanced analysis of sustainability determinants. Finally, qualitative research could complement the quantitative model by clarifying how and why the use of IOA translates into e-commerce sustainability outcomes in different organizational contexts.
Author Contributions
Conceptualization, S.W.; data curation, S.W. and X.L.; formal analysis, S.W., J.G., Y.P., C.D. and K.N.; funding acquisition, X.L.; investigation, S.W.; methodology, S.W.; project administration, S.W.; software, S.W., J.G., Y.P., C.D. and K.N.; validation, S.W.; visualization, S.W., J.G., Y.P., C.D. and K.N.; writing—original draft, S.W.; writing—review and editing, S.W. and J.G.; resources, S.W. and X.L.; supervision, X.L. All authors have read and agreed to the published version of the manuscript.
Funding
This research was funded by [the 14th Five Year Plan for Education Science in Beijing in 2024: the interdisciplinary collaborative innovation talent training model of “x+design” in the era of digital intelligence] grant number [CDDB24216].
Institutional Review Board Statement
All procedures performed in studies involving human participants were in accordance with the ethical standards of the institutional and/or national research committee and with the 1964 Helsinki Declaration and its later amendments or comparable ethical standards. The study was approved by the Beijing Technology and Business University Research Ethics Review Committee (approval code: No. 2025204; approval date: 14 May 2025).
Informed Consent Statement
Informed consent was obtained from all subjects involved in the study. Before completing the questionnaire, all participants were fully informed about the research purpose and data usage. They volunteered to sign the electronic informed consent forms, agreeing that their data could be used in this research and that anonymized data could be published in journal papers. The information of all participants was coded to ensure anonymity.
Data Availability Statement
All data generated or analyzed during this study are available from the corresponding author upon reasonable request.
Conflicts of Interest
The authors declare no conflicts of interest.
Appendix A. Specific Measured Variables
| Research Variable | Measurement Term | |
| System Quality | SQ1 | The IOA supports seamless interaction across different devices and platforms (e.g., desktop, mobile, web). |
| SQ2 | The IOA responds quickly and without lag during use. | |
| SQ3 | The IOA operates reliably and makes efficient use of system resources. | |
| SQ4 | The IOA has a clean, clear, and easy-to-navigate interface. | |
| Information Quality | IQ1 | The information provided by the IOA is up to date and timely. |
| IQ2 | The information in the IOA is easy to understand. | |
| IQ3 | The IOA provides comprehensive information needed for my work. | |
| IQ4 | The information in the IOA is relevant to my daily tasks. | |
| Collaboration Quality | CQ1 | Using the IOA reduces the time and effort needed for communication with colleagues. |
| CQ2 | The IOA enables smooth coordination across different departments or teams. | |
| CQ3 | The IOA helps me collaborate more closely with my coworkers. | |
| CQ4 | The IOA expands the range of ways I can cooperate with others (e.g., co-editing, task sharing, real-time updates). | |
| Perceived Ease of Use | PEU1 | The IOA is easy to operate. |
| PEU2 | Using the IOA is convenient for my daily work. | |
| PEU3 | I can use the IOA skillfully and efficiently. | |
| PEU4 | The IOA’s workflow feels intuitive and logical. | |
| Perceived Usefulness | PU1 | The IOA is dependable for completing my work tasks. |
| PU2 | The IOA helps me save time in my daily work. | |
| PU3 | The IOA reduces work-related costs and improves my efficiency. | |
| PU4 | The IOA helps streamline my work processes. | |
| Subjective Norm | SN1 | My colleagues and supervisors expect me to use the IOA regularly. |
| SN2 | Most of my coworkers use the IOA consistently and appropriately. | |
| SN3 | People in my company believe using IOA strengthens unity. | |
| SN4 | In my team, we are expected to use IOA for effective project management. | |
| Perceived Behavioral Control | PBC1 | Using the IOA helps me better assess my own performance. |
| PBC2 | The IOA makes my work responsibilities and content clearer. | |
| PBC3 | I have the resources and autonomy to use IOA when needed. | |
| PBC4 | The IOA helps me better define my professional needs. | |
| User Satisfaction | US1 | Using IOA allows me to effectively utilize my work time. |
| US2 | I find using the IOA interesting and engaging. | |
| US3 | My overall experience with the IOA has been positive. | |
| US4 | I am satisfied with how the IOA supports my current work situation. | |
| Sustainable Behavioral Intentions of Work | SBI1 | I intend to continue using the IOA consistently in the future. |
| SBI2 | Using the IOA strengthens my sense of belonging to the company. | |
| SBI3 | The IOA has become indispensable to my daily work. | |
| SBI4 | The availability of IOA would influence my decision to stay with or leave this company. | |
| Sustainable Behavioral of Work | SB1 | I have gradually increased how often and how long I use the IOA. |
| SB2 | My work habits have changed (e.g., become more organized or efficient) since using the IOA. | |
| SB3 | I have become more proactive and engaged in my work due to the IOA. | |
| SB4 | I am less likely to consider changing jobs because of the support provided by the IOA. | |
Appendix B. Basic Data Statistics
| Basic Data Statistics | Percentage | Frequency | |
| Gender | Male | 268 | 53.1% |
| Female | 237 | 46.9% | |
| Age | 18–29 | 142 | 28.1% |
| 30–39 | 161 | 31.9% | |
| 40–49 | 101 | 20.0% | |
| 50–59 | 66 | 13.1% | |
| 60 years and over | 35 | 6.9% | |
| Educational Background | High School Diploma | 11 | 2.2% |
| Bachelor degree | 242 | 47.9% | |
| Master’s degree | 162 | 32.1% | |
| Doctor’s degree | 75 | 14.9% | |
| Other | 15 | 3.0% | |
| Type of Enterprise | Small or medium size enterprise (SME) | 137 | 27.1% |
| Nationalized enterprise | 96 | 19.0% | |
| Joint Ventures | 91 | 18.0% | |
| Multinational enterprise | 116 | 23.0% | |
| Fortune 500 enterprise | 65 | 12.9% | |
| Average daily hours spent using integrated office apps | Less than 2 h | 16 | 3.2% |
| 2 h–4 h | 45 | 8.9% | |
| 5 h–7 h | 212 | 42.0% | |
| 8 h–10 h | 197 | 39.0% | |
| More than 10 h | 35 | 6.9% | |
| Average daily frequency of using integrated office apps to establish communication and connectivity | Less than 3 times | 36 | 7.1% |
| 4 times–7 times | 121 | 24.0% | |
| 8 times–11 times | 172 | 34.1% | |
| 12 times–15 times | 111 | 22.0% | |
| More than 15 times | 65 | 12.9% | |
Appendix C. ULMC Analysis Results for CMB Assessment
| Item | Substantive Factor Loading (R1) | R12 | CMB Factor Loading (R2) | R22 |
| CQ → CQ1 | 0.869 | 0.755 | 0.011 | 0.000 |
| CQ → CQ2 | 0.781 | 0.610 | 0.053 | 0.003 |
| CQ → CQ3 | 0.843 | 0.711 | −0.006 | 0.000 |
| CQ → CQ4 | 0.946 | 0.895 | −0.052 | 0.003 |
| IQ → IQ1 | 0.809 | 0.654 | 0.006 | 0.000 |
| IQ → IQ2 | 0.860 | 0.740 | 0.016 | 0.000 |
| IQ → IQ3 | 0.845 | 0.714 | −0.037 | 0.001 |
| IQ → IQ4 | 0.838 | 0.702 | 0.013 | 0.000 |
| PBC → PBC1 | 0.844 | 0.712 | 0.035 | 0.001 |
| PBC → PBC2 | 0.871 | 0.759 | 0.002 | 0.000 |
| PBC → PBC3 | 0.874 | 0.764 | −0.010 | 0.000 |
| PBC → PBC4 | 0.893 | 0.797 | −0.027 | 0.001 |
| PEU → PEU1 | 0.835 | 0.697 | −0.013 | 0.000 |
| PEU → PEU2 | 0.794 | 0.630 | 0.058 | 0.003 |
| PEU → PEU3 | 0.858 | 0.736 | −0.020 | 0.000 |
| PEU → PEU4 | 0.857 | 0.734 | −0.026 | 0.001 |
| PU → PU1 | 0.795 | 0.632 | 0.086 | 0.007 |
| PU → PU2 | 0.908 | 0.824 | −0.082 | 0.007 |
| PU → PU3 | 0.870 | 0.757 | −0.009 | 0.000 |
| PU → PU4 | 0.844 | 0.712 | 0.003 | 0.000 |
| SB → SB1 | 0.888 | 0.789 | 0.036 | 0.001 |
| SB → SB2 | 0.893 | 0.797 | −0.004 | 0.000 |
| SB → SB3 | 0.902 | 0.814 | −0.043 | 0.002 |
| SB → SB4 | 0.887 | 0.787 | 0.011 | 0.000 |
| SBI → SBI1 | 0.839 | 0.704 | 0.030 | 0.001 |
| SBI → SBI2 | 0.850 | 0.723 | −0.006 | 0.000 |
| SBI → SBI3 | 0.893 | 0.797 | −0.011 | 0.000 |
| SBI → SBI4 | 0.856 | 0.733 | −0.014 | 0.000 |
| SN → SN1 | 0.864 | 0.746 | 0.006 | 0.000 |
| SN → SN2 | 0.807 | 0.651 | 0.041 | 0.002 |
| SN → SN3 | 0.909 | 0.826 | −0.007 | 0.000 |
| SN → SN4 | 0.863 | 0.745 | −0.040 | 0.002 |
| SQ → SQ1 | 0.878 | 0.771 | −0.020 | 0.000 |
| SQ → SQ2 | 0.752 | 0.566 | 0.092 | 0.008 |
| SQ → SQ3 | 0.873 | 0.762 | −0.002 | 0.000 |
| SQ → SQ4 | 0.916 | 0.839 | −0.067 | 0.004 |
| US → US1 | 0.887 | 0.787 | −0.048 | 0.002 |
| US → US2 | 0.811 | 0.658 | 0.072 | 0.005 |
| US → US3 | 0.865 | 0.748 | −0.028 | 0.001 |
| US → US4 | 0.851 | 0.724 | 0.003 | 0.000 |
| Average | 0.858 | 0.738 | 0.000 | 0.001 |
References
- Liu, W.; Batra, R.; Wang, H. Product touch and consumers’ online and offline buying: The role of mental representation. J. Retail. 2017, 93, 369–381. [Google Scholar] [CrossRef]
- Florez-Jimenez, M.P.; Lleo, A.; Danvila-del-Valle, I.; Sanchez-Marin, G. Corporate sustainability, organizational resilience and corporate purpose: A triple concept for achieving long-term prosperity. Manag. Decis. 2024, 62, 2189–2213. [Google Scholar] [CrossRef]
- Feng, W.; Li, Y.; Chen, S. What has influenced the growth and structural transformation of China’s cultural industry?—Based on the input-output bias analysis. Appl. Econ. 2025, 1–14. [Google Scholar] [CrossRef]
- Delmas, M.A.; Pekovic, S. Corporate sustainable innovation and employee behavior. J. Bus. Ethics 2018, 150, 1071–1088. [Google Scholar] [CrossRef]
- Oppong-Tawiah, D.; Webster, J.; Staples, S.; Cameron, A.F.; de Guinea, A.O.; Hung, T.Y. Developing a gamified mobile application to encourage sustainable energy use in the office. J. Bus. Res. 2020, 106, 388–405. [Google Scholar] [CrossRef]
- Al-Emran, M. Beyond technology acceptance: Development and evaluation of technology-environmental, economic, and social sustainability theory. Technol. Soc. 2023, 75, 102383. [Google Scholar] [CrossRef]
- Lee, K.; Azmi, N.; Hanaysha, J.; Alzoubi, H.; Alshurideh, M. The effect of digital supply chain on organizational performance: An empirical study in Malaysia manufacturing industry. Uncertain Supply Chain Manag. 2022, 10, 495–510. [Google Scholar] [CrossRef]
- Aral, S.; Brynjolfsson, E.; Wu, D.J. Which came first, it or productivity? Virtuous cycle of investment and use in enterprise systems. Virtuous cycle of investment and use in enterprise systems. In Proceedings of the Twenty Seventh International Conference on Information Systems, Milwaukee, WI, USA, 10–13 December 2006. [Google Scholar]
- Yang, Z.; Sun, J.; Zhang, Y.; Wang, Y.; Cao, L. Employees’ collaborative use of green information systems for corporate sustainability: Motivation, effort and performance. Inf. Technol. Dev. 2017, 23, 486–506. [Google Scholar] [CrossRef]
- Bhattacherjee, A. Understanding information systems continuance: An expectation-confirmation model. MIS Q. 2001, 25, 351–370. [Google Scholar] [CrossRef]
- Melville, N.P. Information systems innovation for environmental sustainability. MIS Q. 2010, 34, 1–21. [Google Scholar] [CrossRef]
- Ajzen, I. The theory of planned behavior. Organ. Behav. Hum. Decis. Process. 1991, 50, 179–211. [Google Scholar] [CrossRef]
- Al-Fraihat, D.; Joy, M.; Sinclair, J. Evaluating E-learning systems success: An empirical study. Comput. Hum. Behav. 2020, 102, 67–86. [Google Scholar] [CrossRef]
- Davis, F.D. Perceived usefulness, perceived ease of use, and user acceptance of information technology. MIS Q. 1989, 13, 319–340. [Google Scholar] [CrossRef]
- He, W.; Qi, C.; Ding, L. The mechanism analysis on the farmers’ motivation of using the quality traceability system based on TAM-ECM model. Sci. Rep. 2023, 13, 22283. [Google Scholar] [CrossRef] [PubMed]
- Tam, C.; Santos, D.; Oliveira, T. Exploring the influential factors of continuance intention to use mobile Apps: Extending the expectation confirmation model. Inf. Syst. Front. 2020, 22, 243–257. [Google Scholar] [CrossRef]
- Hess, T.J.; McNab, A.L.; Basoglu, K.A. Reliability generalization of perceived ease of use, perceived usefulness, and behavioral intentions. MIS Q. 2014, 38, 1–28. [Google Scholar] [CrossRef]
- Yu, J.; Yan, W.; Gong, J.; Wang, S.; Nah, K.; Cheng, W. Motivation of University Students to Use LLMs to Assist with Online Consumption of Sustainable Products: An Analysis Based on a Hybrid SEM–ANN Approach. Appl. Sci. 2025, 15, 8088. [Google Scholar] [CrossRef]
- DeLone, W.H.; McLean, E.R. The DeLone and McLean model of information systems success: A ten-year update. J. Manag. Inf. Syst. 2003, 19, 9–30. [Google Scholar]
- Pushparaj, N.; Sivakumar, V.J.; Natarajan, M.; Bhuvaneskumar, A. Two decades of DeLone and Mclean IS success model: A scientometrics analysis. Qual. Quant. 2023, 57, 2469–2491. [Google Scholar] [CrossRef]
- Salam, M.; Farooq, M.S. Does sociability quality of web-based collaborative learning information system influence students’ satisfaction and system usage? Int. J. Educ. Technol. High. Educ. 2020, 17, 26. [Google Scholar] [CrossRef]
- Seok, H.; Nof, S.Y. Collaborative capacity sharing among manufacturers on the same supply network horizontal layer for sustainable and balanced returns. Int. J. Prod. Res. 2014, 52, 1622–1643. [Google Scholar] [CrossRef]
- Vijayasarathy, L.R. Predicting consumer intentions to use on-line shopping: The case for an augmented technology acceptance model. Inf. Manag. 2004, 41, 747–762. [Google Scholar] [CrossRef]
- Jasperson, J.; Carter, P.E.; Zmud, R.W. A comprensive conceptualization of post-adoptive behaviors associated with information technology enabled work systems. MIS Q. 2005, 29, 525–557. [Google Scholar] [CrossRef]
- Negash, S.; Ryan, T.; Igbaria, M. Quality and effectiveness in web-based customer support systems. Inf. Manag. 2003, 40, 757–768. [Google Scholar] [CrossRef]
- Yadav, R.; Sharma, S.K.; Tarhini, A. A multi-analytical approach to understand and predict the mobile commerce adoption. J. Enterp. Inf. Manag. 2016, 29, 222–237. [Google Scholar] [CrossRef]
- Lin, F.; Fofanah, S.S.; Liang, D. Assessing citizen adoption of e-Government initiatives in Gambia: A validation of the technology acceptance model in information systems success. Gov. Inf. Q. 2011, 28, 271–279. [Google Scholar] [CrossRef]
- Boughzala, I.; De Vreede, G.J. Evaluating team collaboration quality: The development and field application of a collaboration maturity model. J. Manag. Inf. Syst. 2015, 32, 129–157. [Google Scholar] [CrossRef]
- Nie, J.X.; Heidebrecht, C.; Zettler, A.; Pearce, J.; Cunha, R.; Quan, S.; Mansfield, E.; Tang, T. The Perceived Ease of Use and Perceived Usefulness of a Web-Based Interprofessional Communication and Collaboration Platform in the Hospital Setting: Interview Study With Health Care Providers. JMIR Hum. Factors 2023, 10, e39051. [Google Scholar] [CrossRef]
- Paul, D.L.; McDaniel, R.R., Jr. A field study of the effect of interpersonal trust on virtual collaborative relationship performance. MIS Q. 2004, 28, 183–227. [Google Scholar] [CrossRef]
- Shih, H.P.; Lai, K.H.; Cheng, T.E. Examining structural, perceptual, and attitudinal influences on the quality of information sharing in collaborative technology use. Inf. Syst. Front. 2015, 17, 455–470. [Google Scholar] [CrossRef]
- Bajwa, D.S.; Lewis, L.F.; Pervan, G.; Lai, V.S.; Munkvold, B.E.; Schwabe, G. Factors in the global assimilation of collaborative information technologies: An exploratory investigation in five regions. J. Manag. Inf. Syst. 2008, 25, 131–166. [Google Scholar] [CrossRef]
- Trevino, L.K.; Webster, J. Flow in computer-mediated communication: Electronic mail and voice mail evaluation and impacts. Commun. Res. 1992, 19, 539–573. [Google Scholar] [CrossRef]
- Wang, S.; Nah, K. Exploring Sustainable Learning Intentions of Employees Using Online Learning Modules of Office Apps Based on User Experience Factors: Using the Adapted UTAUT Model. Appl. Sci. 2024, 14, 4746. [Google Scholar] [CrossRef]
- Alzahrani, A.I.; Mahmud, I.; Ramayah, T.; Alfarraj, O.; Alalwan, N. Modelling digital library success using the DeLone and McLean information system success model. J. Librariansh. Inf. Sci. 2019, 51, 291–306. [Google Scholar] [CrossRef]
- Mata-Domingo, S. Evaluation on the Effectiveness and Usability of the Developed Collaborative Interaction Management System. Res. Soc. Sci. Technol. 2018, 3, 122–133. [Google Scholar] [CrossRef]
- DeLone, W.H.; McLean, E.R. Information systems success revisited. In Proceedings of the 35th Annual Hawaii International Conference on System Sciences, Big Island, HI, USA, 1–10 January 2002; pp. 2966–2976. [Google Scholar]
- Zhao, L.; Lu, Y. Perceived interactivity: Exploring factors affecting micro-blogging service satisfaction and continuance intention. In Proceedings of the PACIS 2010—14th Pacific Asia Conference on Information Systems, Taipei, Taiwan, 9–12 July 2010. [Google Scholar]
- Chen, S.C.; Liu, S.C.; Li, S.H.; Yen, D.C. Understanding the mediating effects of relationship quality on technology acceptance: An empirical study of e-appointment system. J. Med. Syst. 2013, 37, 9981. [Google Scholar] [CrossRef]
- Zheng, S.; Cheng, Y.; Ju, Y. Understanding the intention and behavior of renting houses among the young generation: Evidence from Jinan, China. Sustainability 2019, 11, 1507. [Google Scholar] [CrossRef]
- Samah, S. Acceptance of Change Behaviour among Middle Managers: The Importance of Subjective Norms and Social Influence as Environmental Predictors. Asian Soc. Sci. 2018, 14, 155–164. [Google Scholar] [CrossRef][Green Version]
- Seddon, P.B. A respecification and extension of the DeLone and McLean model of IS success. Inf. Syst. Res. 1997, 8, 240–253. [Google Scholar] [CrossRef]
- Kim, T.G.; Lee, J.H.; Law, R. An empirical examination of the acceptance behaviour of hotel front office systems: An extended technology acceptance model. Tour. Manag. 2008, 29, 500–513. [Google Scholar] [CrossRef]
- Thong, J.Y.; Yap, C.S. Information systems effectiveness: A user satisfaction approach. Inf. Process. Manag. 1996, 32, 601–610. [Google Scholar] [CrossRef]
- Remenyi, D.; Money, A. A user-satisfaction approach to IS effectiveness measurement. J. Inf. Technol. 1991, 6, 162–175. [Google Scholar] [CrossRef]
- Seddon, P.; Kiew, M.Y. A partial test and development of DeLone and McLean’s model of IS success. Australas. J. Inf. Syst. 1996, 4, 90–109. [Google Scholar] [CrossRef]
- Choi, Y.; Wen, H.; Chen, M.; Yang, F. Sustainable determinants influencing habit formation among mobile short-video platform users. Sustainability 2021, 13, 3216. [Google Scholar] [CrossRef]
- Ajzen, I.; Fishbein, M. Attitudes and normative beliefs as factors influencing behavioral intentions. J. Personal. Soc. Psychol. 1972, 21, 1. [Google Scholar] [CrossRef]
- Rex, J.; Lobo, A.; Leckie, C. Evaluating the drivers of sustainable behavioral intentions: An application and extension of the theory of planned behavior. J. Nonprofit Public Sect. Mark. 2015, 27, 263–284. [Google Scholar] [CrossRef]
- Dawes, J. Do data characteristics change according to the number of scale points used? An experiment using 5-point, 7-point and 10-point scales. Int. J. Mark. Res. 2008, 50, 61–104. [Google Scholar] [CrossRef]
- Loiacono, E.T.; Watson, R.T.; Goodhue, D.L. WebQual: A measure of website quality. Mark. Theory Appl. 2002, 13, 432–438. [Google Scholar]
- Zeithaml, V.A.; Parasuraman, A.; Malhotra, A. A Conceptual Framework for Understanding e-Service Quality: Implications for Future Research and Managerial Practice; Marketing Science Institute: Cambridge, MA, USA, 2000; Volume 115. [Google Scholar]
- Shim, M.; Jo, H.S. What quality factors matter in enhancing the perceived benefits of online health information sites? Application of the updated DeLone and McLean Information Systems Success Model. Int. J. Med. Inform. 2020, 137, 104093. [Google Scholar] [CrossRef]
- Srinivasan, A. Alternative measures of system effectiveness: Associations and implications. MIS Q. 1985, 9, 243–253. [Google Scholar] [CrossRef]
- Bailey, J.E.; Pearson, S.W. Development of a tool for measuring and analyzing computer user satisfaction. Manag. Sci. 1983, 29, 530–545. [Google Scholar] [CrossRef]
- Pinelle, D.; Gutwin, C.; Greenberg, S. Task analysis for groupware usability evaluation: Modeling shared-workspace tasks with the mechanics of collaboration. ACM Trans. Comput.-Hum. Interact. 2003, 10, 281–311. [Google Scholar] [CrossRef]
- Bangor, A.; Kortum, P.T.; Miller, J.T. An empirical evaluation of the system usability scale. Intl. J. Hum.-Comput. Interact. 2008, 24, 574–594. [Google Scholar] [CrossRef]
- Gillenson, M.L.; Sherrell, D.L. Enticing online consumers: An extended technology acceptance perspective. Inf. Manag. 2002, 39, 705–719. [Google Scholar] [CrossRef]
- Hamilton, S.; Chervany, N.L. Evaluating information system effectiveness-Part I: Comparing evaluation approaches. MIS Q. 1981, 5, 55–69. [Google Scholar] [CrossRef]
- Rhodes, R.E.; Courneya, K.S. Threshold assessment of attitude, subjective norm, and perceived behavioral control for predicting exercise intention and behavior. Psychol. Sport Exerc. 2005, 6, 349–361. [Google Scholar] [CrossRef]
- La Barbera, F.; Ajzen, I. Control interactions in the theory of planned behavior: Rethinking the role of subjective norm. Eur. J. Psychol. 2020, 16, 401. [Google Scholar] [CrossRef]
- De Vries, H.; Dijkstra, M.; Kuhlman, P. Self-efficacy: The third factor besides attitude and subjective norm as a predictor of behavioural intentions. Health Educ. Res. 1988, 3, 273–282. [Google Scholar] [CrossRef]
- Ajzen, I. Perceived behavioral control, self-efficacy, locus of control, and the theory of planned behavior. J. Appl. Soc. Psychol. 2002, 32, 665–683. [Google Scholar] [CrossRef]
- Melin, J.; Bonn, S.E.; Pendrill, L.; Lagerros, Y.T. A questionnaire for assessing user satisfaction with mobile health apps: Development using Rasch measurement theory. JMIR mHealth uHealth 2020, 8, e15909. [Google Scholar] [CrossRef]
- Stoyanov, S.R.; Hides, L.; Kavanagh, D.J.; Zelenko, O.; Tjondronegoro, D.; Mani, M. Mobile app rating scale: A new tool for assessing the quality of health mobile apps. JMIR mHealth uHealth 2015, 3, e3422. [Google Scholar] [CrossRef]
- Hair, J.F.; Risher, J.J.; Sarstedt, M.; Ringle, C.M. When to use and how to report the results of PLS-SEM. Eur. Bus. Rev. 2019, 31, 2–24. [Google Scholar] [CrossRef]
- Shmueli, G.; Sarstedt, M.; Hair, J.F.; Cheah, J.H.; Ting, H.; Vaithilingam, S.; Ringle, C.M. Predictive model assessment in PLS-SEM: Guidelines for using PLSpredict. Eur. J. Mark. 2019, 53, 2322–2347. [Google Scholar] [CrossRef]
- Hair, J.F.; Ringle, C.M.; Sarstedt, M. PLS-SEM: Indeed a silver bullet. J. Mark. Theory Pract. 2011, 19, 139–152. [Google Scholar] [CrossRef]
- Dash, G.; Paul, J. CB-SEM vs PLS-SEM methods for research in social sciences and technology forecasting. Technol. Forecast. Soc. Change 2021, 173, 121092. [Google Scholar] [CrossRef]
- Li, H.; Liu, Y. Understanding post-adoption behaviors of e-service users in the context of online travel services. Inf. Manag. 2014, 51, 1043–1052. [Google Scholar] [CrossRef]
- Göritz, A.S. Incentives in web studies: Methodological issues and a review. Int. J. Internet Sci. 2006, 1, 58–70. [Google Scholar]
- Rigdon, E.E. Choosing PLS path modeling as analytical method in European management research: A realist perspective. Eur. Manag. J. 2016, 34, 598–605. [Google Scholar] [CrossRef]
- Kline, R.B. Principles and Practice of Structural Equation Modeling; Guilford Publications: New York, NY, USA, 2023. [Google Scholar]
- Davenport, T.H.; Short, J.E. The new industrial engineering: Information technology and business process redesign. MIT Sloan Manag. Rev. 1990, 31, 11–27. [Google Scholar]
- Fornell, C.; Larcker, D.F. Evaluating structural equation models with unobservable variables and measurement error. J. Mark. Res. 1981, 18, 39–50. [Google Scholar] [CrossRef]
- Henseler, J.; Ringle, C.M.; Sarstedt, M. A new criterion for assessing discriminant validity in variance-based structural equation modeling. J. Acad. Mark. Sci. 2015, 43, 115–135. [Google Scholar] [CrossRef]
- Roemer, E.; Schuberth, F.; Henseler, J. HTMT2–an improved criterion for assessing discriminant validity in structural equation modeling. Ind. Manag. Data Syst. 2021, 121, 2637–2650. [Google Scholar] [CrossRef]
- Wang, S.; Ahn, S. Exploring User Behavior Based on Metaverse: A Modeling Study of User Experience Factors. In Proceedings of the International Conference on Human-Computer Interaction, Washington, DC, USA, 29 June–4 July 2024; Springer Nature: Cham, Switzerland, 2024; pp. 99–118. [Google Scholar]
- Shrestha, N. Detecting multicollinearity in regression analysis. Am. J. Appl. Math. Stat. 2020, 8, 39–42. [Google Scholar] [CrossRef]
- Zuur, A.F.; Ieno, E.N.; Elphick, C.S. A protocol for data exploration to avoid common statistical problems. Methods Ecol. Evol. 2010, 1, 3–14. [Google Scholar] [CrossRef]
- Lix, L.M.; Keselman, J.C.; Keselman, H.J. Consequences of assumption violations revisited: A quantitative review of alternatives to the one-way analysis of variance F test. Rev. Educ. Res. 1996, 66, 579–619. [Google Scholar] [PubMed]
- Plonsky, L.; Ghanbar, H. Multiple regression in L2 research: A methodological synthesis and guide to interpreting R2 values. Mod. Lang. J. 2018, 102, 713–731. [Google Scholar] [CrossRef]
- Wright, S. Path coefficients and path regressions: Alternative or complementary concepts? Biometrics 1960, 16, 189–202. [Google Scholar] [CrossRef]
- Streukens, S.; Leroi-Werelds, S. Bootstrapping and PLS-SEM: A step-by-step guide to get more out of your bootstrap results. Eur. Manag. J. 2016, 34, 618–632. [Google Scholar] [CrossRef]
- Romano, J.P.; Wolf, M. Exact and approximate stepdown methods for multiple hypothesis testing. J. Am. Stat. Assoc. 2005, 100, 94–108. [Google Scholar] [CrossRef]
- Kock, N. One-tailed or two-tailed P values in PLS-SEM? Int. J. e-Collab. 2015, 11, 1–7. [Google Scholar] [CrossRef]
- Gupta, P.; Prashar, S.; Vijay, T.S.; Parsad, C. Examining the influence of antecedents of continuous intention to use an informational app: The role of perceived usefulness and perceived ease of use. Int. J. Bus. Inf. Syst. 2021, 36, 270–287. [Google Scholar] [CrossRef]
- Knauer, T.; Nikiforow, N.; Wagener, S. Determinants of information system quality and data quality in management accounting. J. Manag. Control 2020, 31, 97–121. [Google Scholar] [CrossRef]
- Weick, K.E.; Sutcliffe, K.M.; Obstfeld, D. Organizing and the process of sensemaking. Organ. Sci. 2005, 16, 409–421. [Google Scholar] [CrossRef]
- Ren, Y.; Kiesler, S.; Fussell, S.R. Multiple group coordination in complex and dynamic task environments: Interruptions, coping mechanisms, and technology recommendations. J. Manag. Inf. Syst. 2008, 25, 105–130. [Google Scholar] [CrossRef]
- Kolfschoten, G.L.; De Vreede, G.J. A design approach for collaboration processes: A multimethod design science study in collaboration engineering. J. Manag. Inf. Syst. 2009, 26, 225–256. [Google Scholar] [CrossRef]
- Al-Rahmi, A.M.; Shamsuddin, A.; Alturki, U.; Aldraiweesh, A.; Yusof, F.M.; Al-Rahmi, W.M.; Aljeraiwi, A.A. The influence of information system success and technology acceptance model on social media factors in education. Sustainability 2021, 13, 7770. [Google Scholar] [CrossRef]
- Amoroso, D.L.; Cheney, P.H. Testing a causal model of end-user application effectiveness. J. Manag. Inf. Syst. 1991, 8, 63–89. [Google Scholar] [CrossRef]
- Ashfaq, M.; Yun, J.; Yu, S.; Loureiro, S.M.C. I, Chatbot: Modeling the determinants of users’ satisfaction and continuance intention of AI-powered service agents. Telemat. Inform. 2020, 54, 101473. [Google Scholar] [CrossRef]
- Rausch, T.M.; Kopplin, C.S. Bridge the gap: Consumers’ purchase intention and behavior regarding sustainable clothing. J. Clean. Prod. 2021, 278, 123882. [Google Scholar] [CrossRef]
- Si, H.; Shi, J.G.; Tang, D.; Wu, G.; Lan, J. Understanding intention and behavior toward sustainable usage of bike sharing by extending the theory of planned behavior. Resour. Conserv. Recycl. 2020, 152, 104513. [Google Scholar] [CrossRef]
- Vamvaka, V.; Stoforos, C.; Palaskas, T.; Botsaris, C. Attitude toward entrepreneurship, perceived behavioral control, and entrepreneurial intention: Dimensionality, structural relationships, and gender differences. J. Innov. Entrep. 2020, 9, 5. [Google Scholar] [CrossRef]
- Yap, S.F.; Othman, M.N.; Wee, Y.G. The fallacy of one-dimensional theory of planned behaviour structure in predicting health behaviour. Int. J. Behav. Healthc. Res. 2013, 4, 26–44. [Google Scholar] [CrossRef]
- Dachner, A.M.; Ellingson, J.E.; Noe, R.A.; Saxton, B.M. The future of employee development. Hum. Resour. Manag. Rev. 2021, 31, 100732. [Google Scholar] [CrossRef]
Disclaimer/Publisher’s Note: The statements, opinions and data contained in all publications are solely those of the individual author(s) and contributor(s) and not of MDPI and/or the editor(s). MDPI and/or the editor(s) disclaim responsibility for any injury to people or property resulting from any ideas, methods, instructions or products referred to in the content. |
© 2025 by the authors. Licensee MDPI, Basel, Switzerland. This article is an open access article distributed under the terms and conditions of the Creative Commons Attribution (CC BY) license (https://creativecommons.org/licenses/by/4.0/).