1. Introduction
In the competitive landscape of modern electronic commerce, understanding and optimizing the customer journey is paramount. Online retailers and digital marketers are faced with an increasingly complex web of user interactions that span multiple channels, from social media campaigns and search engine marketing to direct website traffic and email newsletters. The path from initial contact to final purchase is rarely linear, and identifying the precise points where potential customers abandon this journey is a critical task for improving conversion rates and maximizing revenue.
Traditional e-commerce analytics tools, such as web dashboards and spreadsheets, typically present Key Performance Indicators (KPIs) in tabular or simple 2D chart formats. While useful, these methods often fail to provide an intuitive, integrated view of the customer journey. Analysts must mentally connect disparate data points—such as page views, session durations, click-through rates, and cart abandonment statistics—to a conceptual model of the conversion funnel. It is hypothesized that this cognitive overhead can obscure important patterns and make it difficult to quickly identify the most significant bottlenecks in the user experience, and that a visualization that spatially integrates KPIs with the funnel structure may mitigate this effect. This hypothesis is formally tested in
Section 5.
This situation reveals a critical research gap: the lack of accessible and intuitive visualization tools that can directly map quantitative performance metrics onto a coherent, visual model of the e-commerce customer journey. While 3D visualization has been explored in fields like software engineering and scientific data analysis, its application to the specific challenges of e-commerce analytics remains underdeveloped. To address this gap, this research is guided by the following questions:
RQ1: To what extent can a 3D visualization that embeds Key Performance Indicators (KPIs) as geometric properties improve the speed, accuracy, and cognitive load of e-commerce funnel analysis compared to conventional 2D dashboards?
RQ2: What is a viable software architecture for a flexible, web-based 3D visualization library tailored to customer journey mapping that balances rendering performance with ease of use for developers?
To answer these questions, this paper introduces Aurea EDEN (Evolving Diagramming with Enriched Notations), an open-source 3D diagramming library created by the author. By leveraging the third dimension as a data-encoding channel, Aurea EDEN enables the creation of rich, data-driven models of e-commerce processes. The framework’s practical value is underscored by its commercial adoption within the Aurea low-code development platform, where it is used to analyze real-world business data. Building on this foundation, the paper makes the following contributions:
A novel visualization technique that encodes e-commerce KPIs directly as geometric attributes (bar height, color) on a 3D funnel model to facilitate rapid, at-a-glance comparison of stage-wise performance.
An open-source software library and domain-specific notation (Aurea EDEN with the ECommerceFunnelDiagram class) for programmatically creating and interacting with these 3D journey maps, available via a public repository and live demo.
The results of a comparative user study () evaluating this 3D approach against a traditional 2D dashboard, providing empirical evidence on its effects on task performance, cognitive workload, and usability.
A quantitative performance benchmark of the Aurea EDEN library, measuring key metrics like load time and frames per second (FPS) to establish a technical profile of its scalability for complex diagrams.
The remainder of this paper is organized as follows.
Section 2 reviews related work in e-commerce analytics and 3D visualization.
Section 3 describes the architecture and functionalities of the Aurea EDEN library.
Section 4 provides illustrative examples on how to use the library to create enriched visualizations.
Section 5 details the methodology of the empirical evaluation, including a user study and a performance benchmark.
Section 6 presents the results of these studies, which are then interpreted in
Section 7. A summary of contributions concludes the paper in
Section 8.
2. Related Work
2.1. Analytics and Optimization of the E-Commerce Customer Journey
The analysis of the customer journey is a cornerstone of modern e-commerce, supported by a rich ecosystem of tools and methodologies [
1,
2]. A primary tool in this domain is funnel analysis, which tracks user progression through a predefined series of steps, such as from a product page to purchase confirmation. Tools like Google Analytics 4 (GA4) offer robust funnel exploration reports that quantify drop-off rates at each stage, allowing analysts to identify where users abandon a workflow [
3,
4]. Complementing this is path exploration, which takes a more discovery-oriented approach to visualize the varied, often non-linear routes users actually take through a site. While funnel analysis is ideal for optimizing known workflows, path exploration helps uncover unexpected user behaviors.
A more advanced technique for discovering these behaviors is process mining, which applies algorithms to raw event data, such as server logs or clickstream data, to automatically generate a process model of the customer journey [
5,
6]. This data-driven approach can reveal the dominant paths, bottlenecks, and deviations in user flow without requiring a predefined funnel structure, offering a more objective view of how a website is navigated. These analytical activities are central to the practice of Conversion Rate Optimization (CRO), a systematic workflow that typically involves analyzing data to find opportunities, forming a hypothesis, running controlled A/B tests to validate it, and iteratively refining the user experience to improve the percentage of users who complete a desired action [
7].
However, these established tools and workflows share a common limitation: they typically present quantitative data (e.g., conversion rates, user counts) in formats like tables, 2D bar charts, or Sankey diagrams, which are physically and cognitively separate from the conceptual model of the customer journey itself. This separation forces analysts to perform a mental mapping between the data and the journey structure, increasing cognitive load and potentially obscuring stage-wise comparisons, especially when multiple KPIs are considered simultaneously [
8,
9,
10,
11]. This limitation directly motivates the research into a visualization that integrates KPI data directly onto a spatial model of the funnel.
2.2. Theoretical Foundations of 3D Data Visualization
The design of the visualization is grounded in established principles of information visualization and human perception. A core consideration is the choice of visual channels to encode quantitative data. Research by Cleveland and McGill, later extended by Mackinlay, provides a ranking of visual channels based on perceptual accuracy [
12,
13]. Position on a common scale (as used in bar charts) is ranked highest for comparing quantitative values, significantly outperforming channels like color saturation, angle, or area [
14,
15]. This principle strongly supports the primary design choice: encoding the main KPI for each funnel stage as the height of a 3D bar, allowing for direct and accurate comparison across stages.
Color is used as a redundant and secondary encoding channel. A sequential, colorblind-safe HSL-based color scale is employed (from red for low performance to green for high performance) to provide an at-a-glance assessment of performance, following established guidelines for effective color mapping [
16,
17].
The use of 3D for abstract data visualization is not without its challenges, most notably occlusion (where one object obscures another) and perspective distortion (where objects farther from the viewer appear smaller) [
13,
18]. These issues can impede accurate quantitative comparisons. To mitigate this, the system’s
ANALYZE mode defaults to an orthographic projection rather than a perspective projection. Orthographic projection eliminates foreshortening, ensuring that the heights of the 3D bars can be compared accurately regardless of their position in the scene. This design choice is informed by empirical studies that have shown the benefits of orthographic views for precise tasks in 3D environments.
Therefore, these principles yield a clear design implication for the Aurea EDEN system: to support the primary task of comparing KPI magnitudes across funnel stages, it is necessary to prioritize encoding data via position on a common scale (bar height) and to use an orthographic projection to minimize perceptual distortion, while using color as a redundant and secondary channel for at-a-glance assessment.
In contrast to 2D dashboards which fragment data across multiple charts and tables, and path discovery tools which focus on generating the structure of the journey, the proposed approach—termed KPI-as-geometry—focuses on visualizing performance on a known funnel structure. By embedding KPIs directly into the geometry of the 3D model, Aurea EDEN aims to reduce the cognitive load of mental mapping and facilitate faster, more intuitive stage-wise comparisons.
3. Software Description
3.1. Software Architecture
Aurea EDEN is the author’s open-source 3D diagramming library that enables developers to create, visualize, and interact with various notations. Its key metadata is summarized in
Table 1.
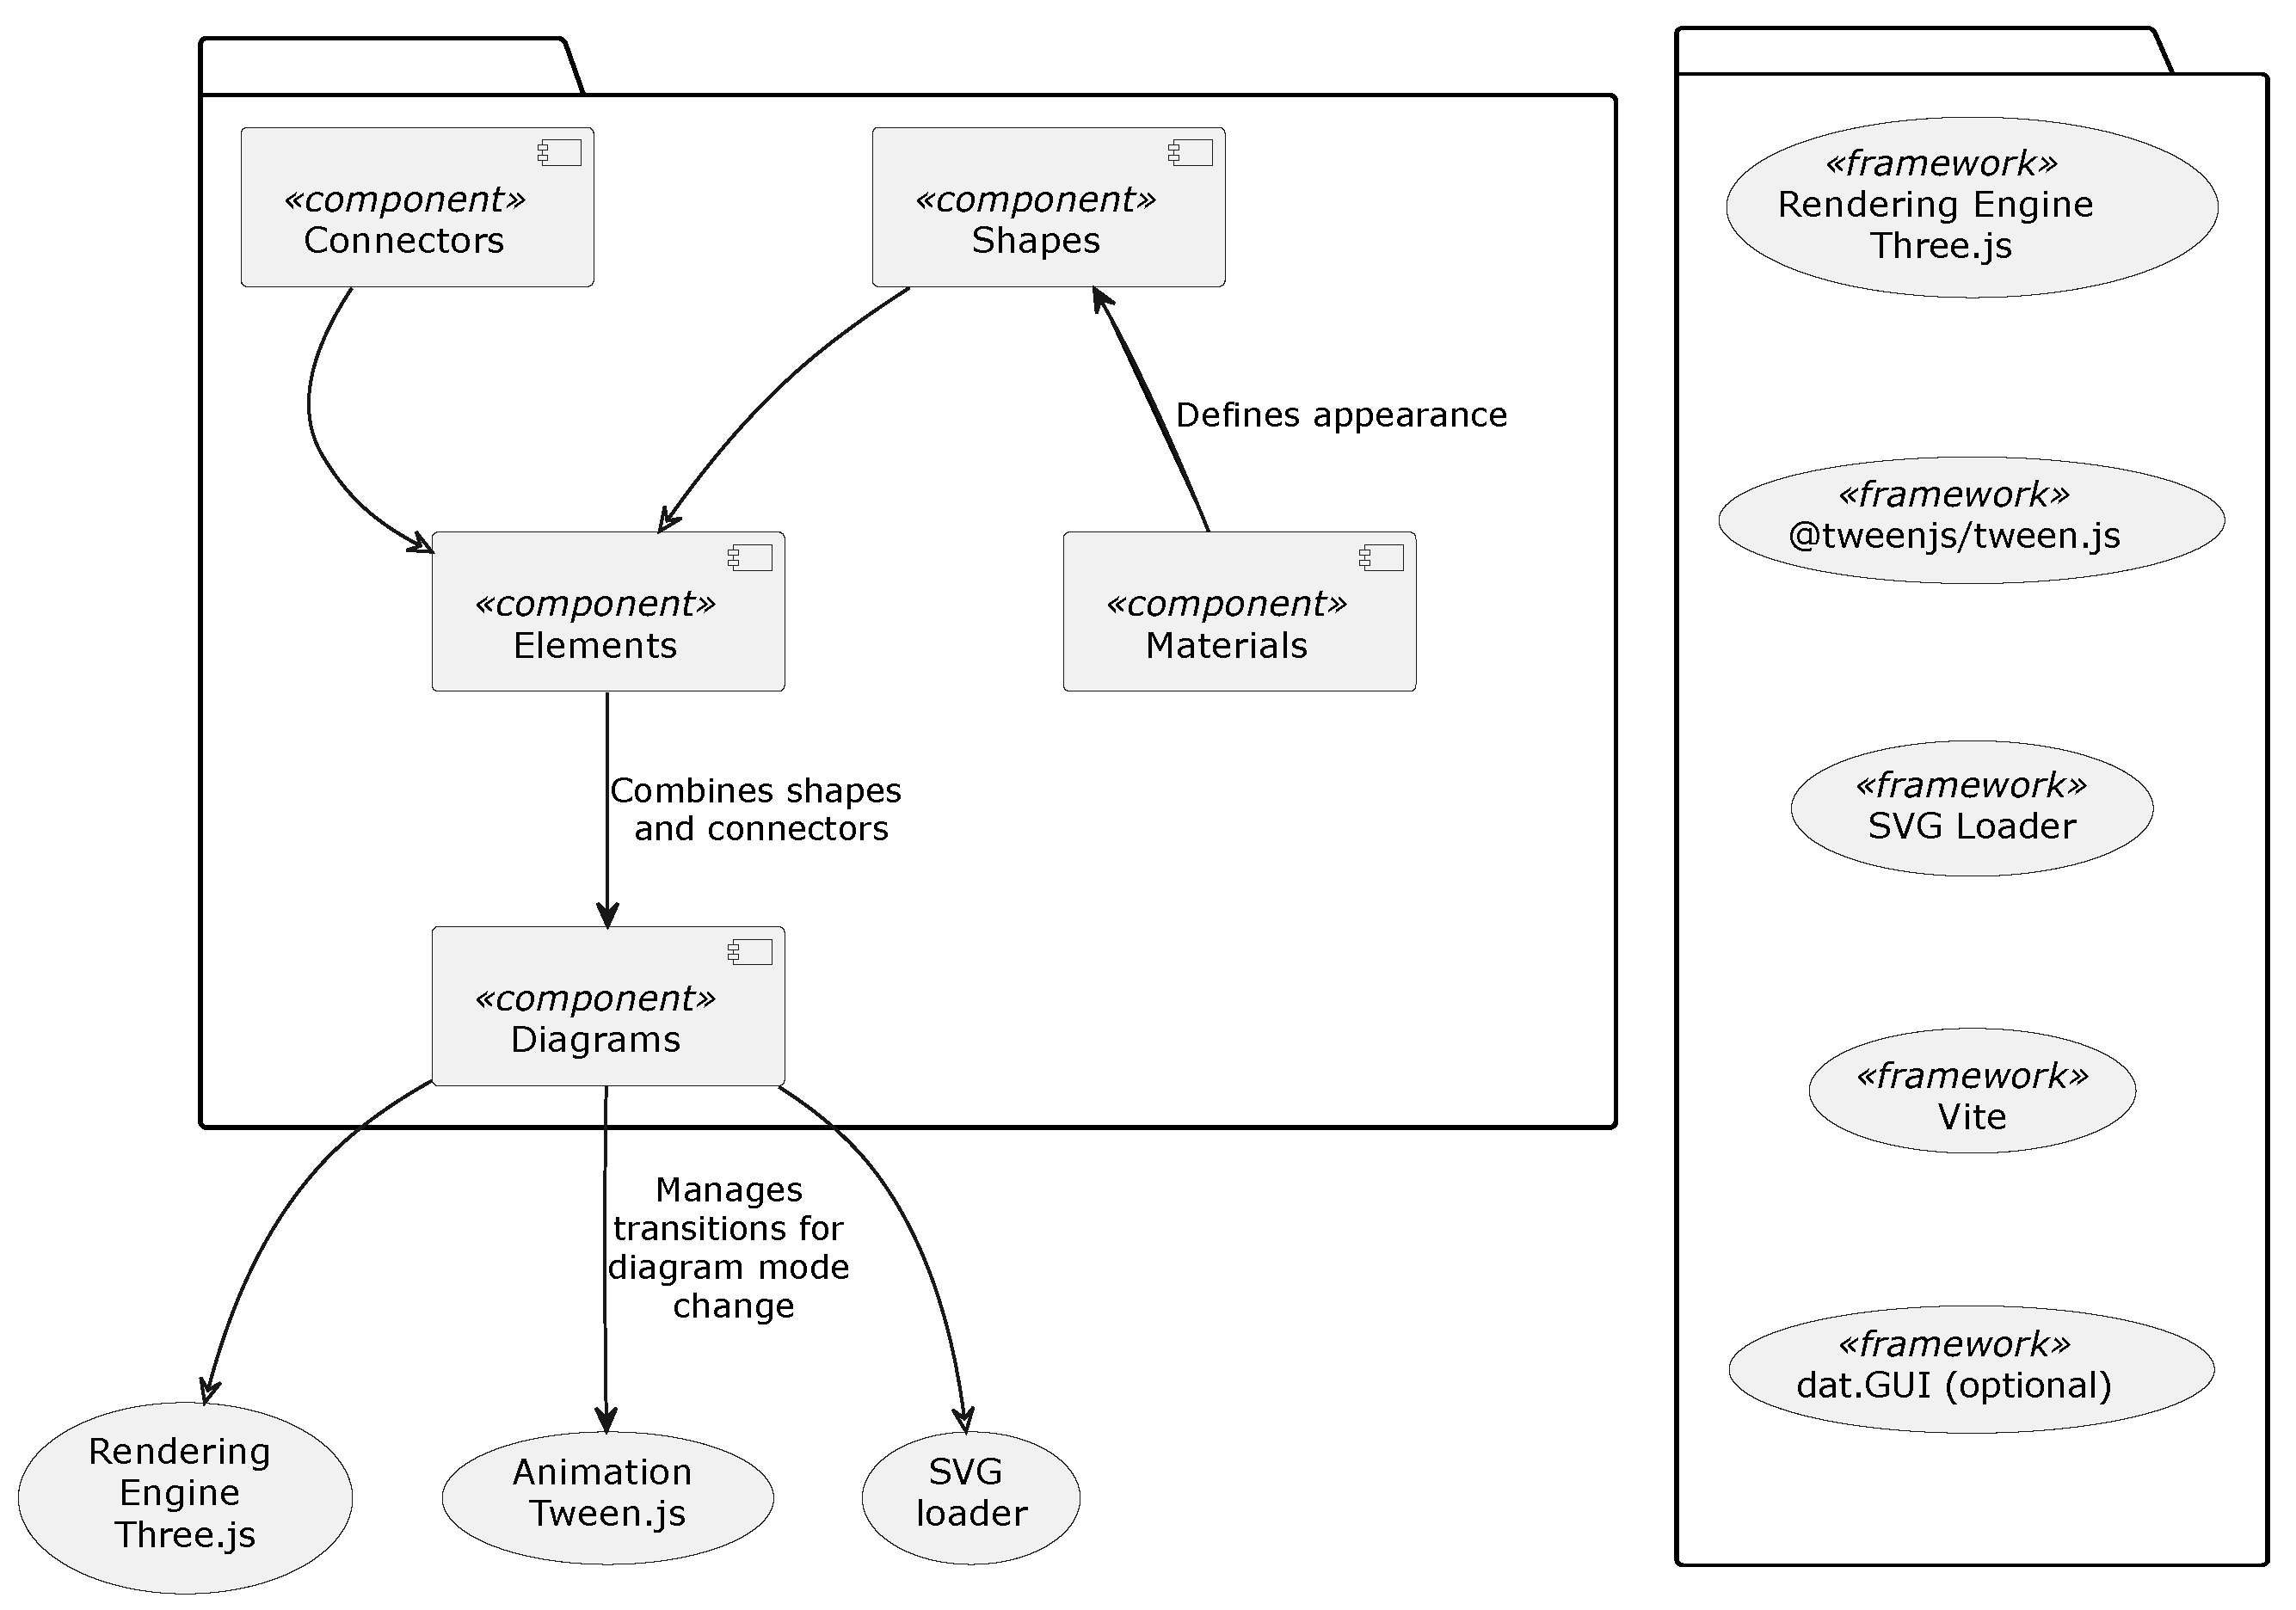
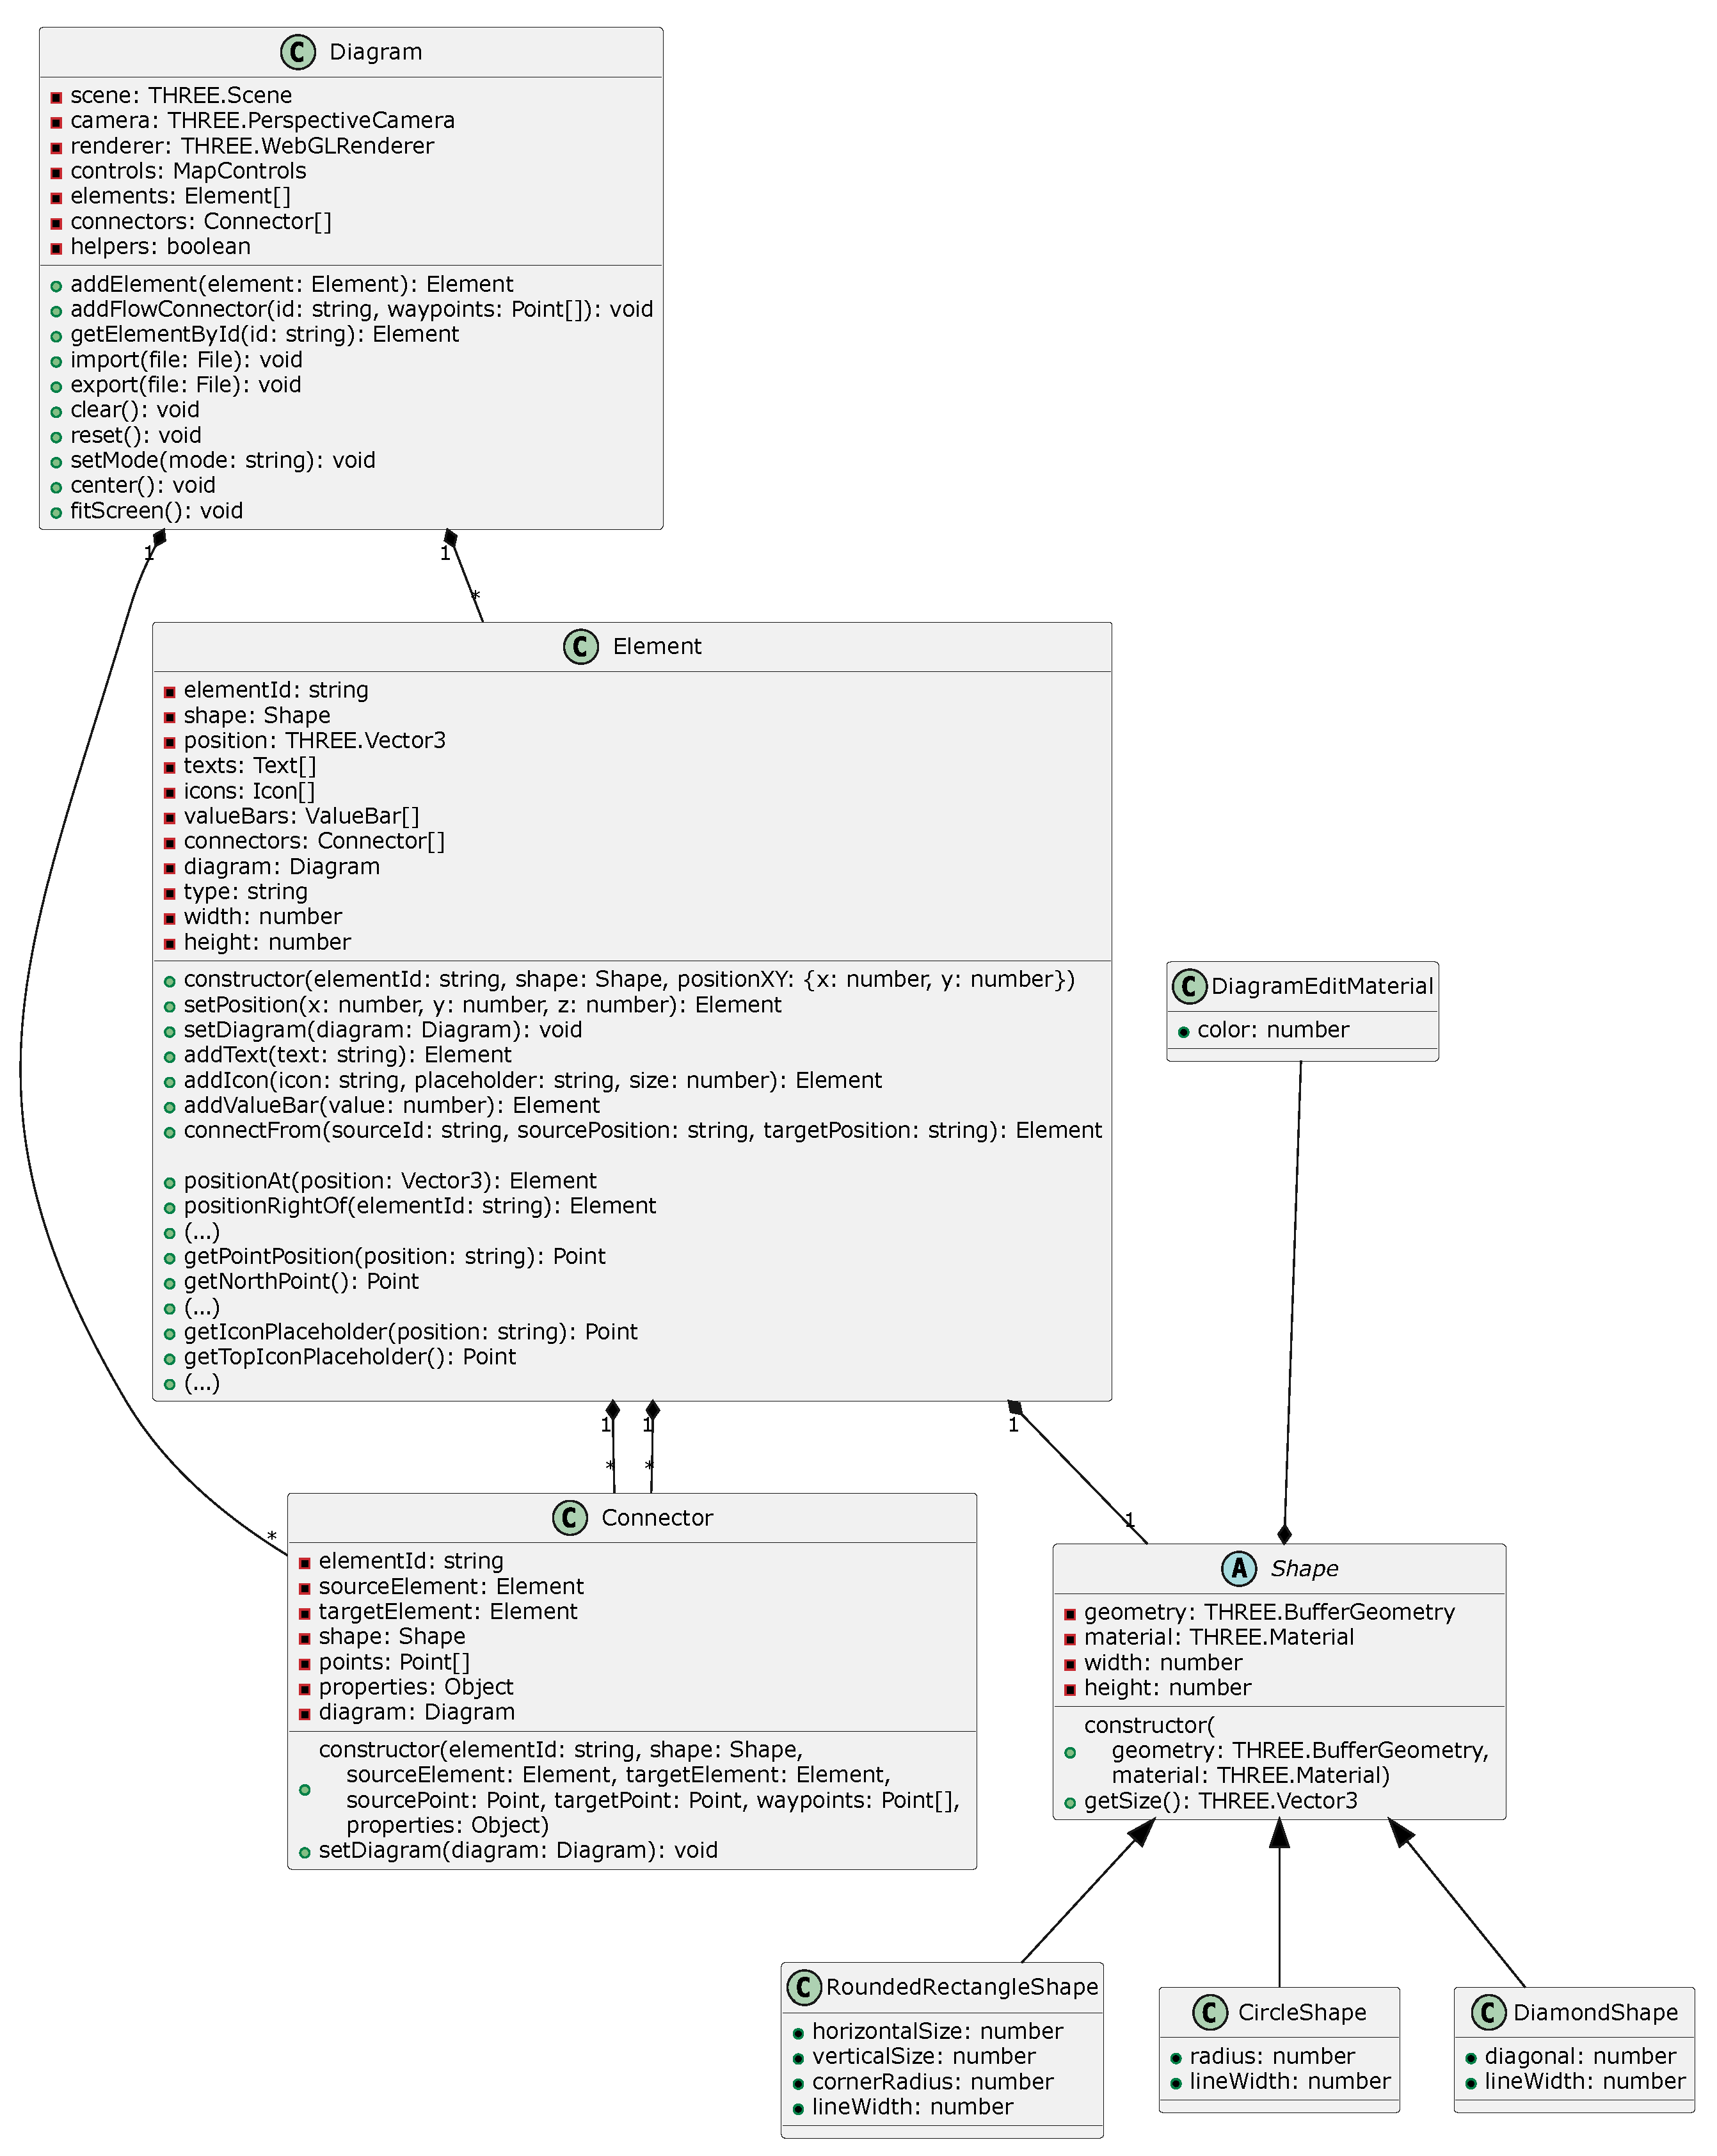
The software architecture is modular and extensible. By abstracting the specifics of any particular notation, the library provides a flexible foundation for building diagramming tools. This is achieved through a core set of reusable components for diagrams, elements (e.g., steps in a funnel), shapes, connectors (e.g., user flow paths), and materials, which abstract the complexities of individual notation creation. Its integration with Three.js ensures high-quality 3D rendering. The overall software architecture is illustrated in
Figure 1, which shows all the fundamental components of the library.
The key components of the library are:
- 1.
The diagram component manages the overall structure and rendering of the diagram. It provides the core logic for managing elements, connectors, and interactions. It manages the scene, camera, and rendering using Three.js and provides methods for adding elements, centering the diagram, and fitting it to the screen.
- 2.
Elements combine shapes and connectors to represent diagram components, such as stages in a customer journey or specific user actions. The Element class provides methods for positioning elements relative to one another (e.g., .positionRightOf, positionUpOf). It also supports adding labels, icons, and value bars to elements and provides methods like connectFrom that allow for interaction.
- 3.
Connectors define the relationships between elements in the diagram, representing the flow of users between stages. The component provides reusable 3D connectors for linking elements, such as an orthogonal connector with rounded corners (RoundedCornerOrthogonalConnectorShape). All connectors handle positioning and alignment between connected elements. They support customization of connector styles.
- 4.
Shapes are the building blocks of the library. They provide reusable 3D shapes for diagram elements, such us rectangular elements for funnel steps (RoundedRectangleShape), or circular elements for entry/exit points (CircleShape). Developers can create custom shapes by extending the Shape class.
- 5.
Materials define the appearance of shapes and connectors. The class provides reusable materials for rendering shapes and connectors. The component supports customization of colors, textures, and transparency. Ensures consistency in the visual style of diagrams.
The software utilizes a variety of external libraries, which are listed in
Table 2.
Figure 2 depicts the library’s modular, object-oriented architecture, centered around four primary classes:
Diagram,
Element,
Connector, and
Shape. The abstract
Shape class defines fundamental geometric properties and materials for visual representation. Elements are diagram components that combine these shapes with features like text or icons, offering an API for manipulation and establishing connections. Connectors manage relationships between elements, utilizing
waypoints for path definition. The
Diagram class acts as the central controller, managing the Three.js-based 3D scene, camera, rendering, element collections, diagram manipulation, and import/export functions. This extensible architecture supports diverse diagram types via a consistent interface, simplifying complex diagram creation by encapsulating 3D rendering complexities.
3.2. Software Functionalities
The main functionalities of the software are:
- 1.
Flexible creation of new notations
The library facilitates the creation of new diagram notations For example, an ECommerceFunnelDiagram class can extend the base Diagram class to provide elements and connectors specific to customer journey mapping. The Diagram class initializes the Three.js scene, camera, and renderer. New notations can be defined through the extension of the Diagram class and the implementation of custom elements, connectors, and parsing logic.
- 2.
Extended functionality for element placement and connection design
The library provides extended functionality for element placement and connection design, including:
Contextual Positioning—Elements can be positioned relative to other existing elements. Examples include placing an element to the right of another (element.positionRightOf(’e1’)) or to the bottom-right (element.positionDownRightOf(’e1’)).
Direct Positioning—Elements can be placed at explicit coordinates (e.g., .positionAt({ x: 1, y: 1, z: 0 })) or aligned with another element’s position (e.g., element.positionAt(element2.position)).
Definable Connection Points—The library supports the use of a geographical style nomenclature for specifying connection points on elements (e.g., north, west, northwest, east-west, north-north-west).
Contextual Linking—New elements can be automatically created and linked to existing ones. Connection points on both elements can be specified (e.g., element.connectFrom(’e1’, ’east’, ’west’)).
Dynamic Waypoints—The automatic calculation of connector waypoints is supported based on the source and target element positions, as well as the specified connection points (e.g., Connector.determinePoints( sourcePoint, targetPoint, sourcePosition, targetPosition )).
Direct Connector Design—Explicit definition of a connector’s waypoints is possible, allowing for precise control over its path (e.g., diagram.addConnector(’c1’, [{0,0},{1,0},{1,1},{2,1}])).
- 3.
3D visualizing
This library utilizes 3D rendering to create interactive and data-rich diagram visualizations [
19,
20,
21,
22]. Key 3D functionalities include:
Visualization and Manipulation—Built on
Three.js, the library provides robust 3D rendering with customizable scenes, lighting, interactive camera controls (panning, zooming, rotating) [
23,
24,
25], and dynamic element animations with
Tween.js. Diagrams can be rotated, for instance, to better view data in an
ANALYZE mode.
Model Parameters Visualization—Element data is represented directly within the 3D diagram, such as using the
addValueBar method to display 3D bars corresponding to numerical values for comparison. This is ideal for showing e-commerce KPIs like drop-off rates or conversion values [
26,
27,
28,
29].
Extensible Parameter Visualization—The system is designed for diverse data representation beyond simple bars, anticipating advanced techniques like multi-parameter displays or color scales via custom Element decorations.
Dynamic Material Assignment—Element material properties can be modified in real-time (e.g., color changes on hover or selection) to visually reflect their state and enhance interactivity.
3.3. Sample Code Snippets Analysis
The software’s modular design and Three.js integration enable versatile creation, visualization, and interaction with various diagram notations. All code listings presented are original examples demonstrating the use of the Aurea EDEN library, which is the author’s own open-source software and the subject of this paper. The following examples demonstrate these core functionalities, reframed for an e-commerce analytics context.
Listing 1 illustrates the creation of a diagram for an e-commerce funnel.
| Listing 1. Diagram Creation |
![Jtaer 20 00279 i001 Jtaer 20 00279 i001]() |
- 2.
Customer Journey Elements Creation
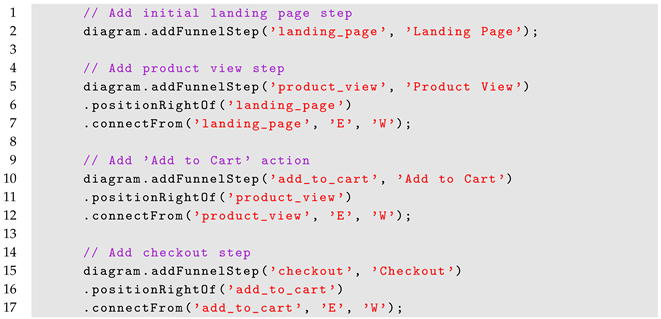
Listing 2 illustrates the creation of funnel steps and their connections. The listing employs methods such as addFunnelStep and addDecisionPoint that would be defined in a custom ECommerceFunnelDiagram class. It demonstrates connecting a new step to a previous one, modeling the user flow.
| Listing 2. Customer Journey Elements Creation |
![Jtaer 20 00279 i002 Jtaer 20 00279 i002]() |
- 3.
Connectors Creation
Connectors representing user flow are generated automatically via the connectFrom method. For more complex, non-linear journeys, custom connectors can be built by supplying a list of waypoints, as shown in Listing 3.
| Listing 3. Custom Connector Creation |
![Jtaer 20 00279 i003 Jtaer 20 00279 i003]() |
- 4.
Analyzing the E-Commerce Funnel
The library’s primary value for e-commerce is visualizing performance data directly on the funnel model. Each step can be augmented with a 3D bar representing a key metric. For instance, a bar can show the percentage of users who proceed to the next step, making drop-offs immediately apparent. The addValueBar method adds these data visualizations, and setMode(“ANALYZE”) tilts the diagram for a 3D perspective. Listing 4 shows how to visualize conversion rates.
| Listing 4. Visualizing Conversion Rates with Value Bars |
![Jtaer 20 00279 i004 Jtaer 20 00279 i004]() |
There are three distinct Diagram Operation Modes:
VIEW Mode (Default)—A top-down view (0° rotation) focused on basic diagram display with standard navigation. Value bars are removed and camera maintains orthogonal perspective for clear element visualization.
ANALYZE Mode—An analytical perspective with −60° camera rotation, designed for data visualization. Adds colored value bars to elements containing parameter data, using HSL color scale (120° green for highest, 0° red for lowest values). Values are normalized for consistent visual comparison.
EDIT Mode—Identical to VIEW mode in terms of camera positioning (0° rotation) and element display, intended as a foundation for editing operations.
- 5.
Camera Control
Because this is a 3D diagram, scaling the diagram and changing display methods involves controlling the camera. The Diagram object has built-in methods for centering the diagram, scaling it to fit the screen, or setting the viewing angle. The way these methods are called is shown in Listing 5.
| Listing 5. Camera Control |
![Jtaer 20 00279 i005 Jtaer 20 00279 i005]() |
- 6.
Extensibility
The Aurea EDEN library is designed for extensibility, allowing developers to implement custom notations for different e-commerce models or other domains. The following subsections and listings show how to extend the library’s core components.
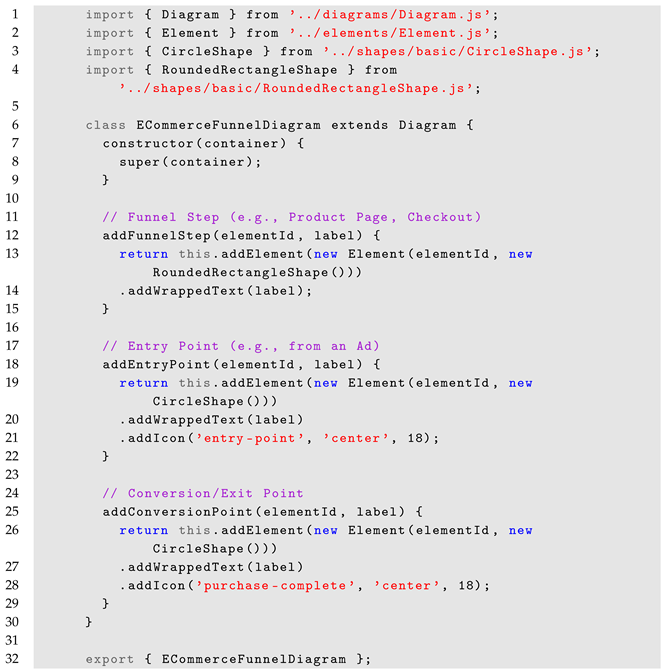
Support for Multiple Notations—The library’s architecture enables the creation of new notations by extending the fundamental Diagram class. A custom notation for an e-commerce funnel is provided in Listing 6.
| Listing 6. Custom E-Commerce Funnel Notation |
![Jtaer 20 00279 i006 Jtaer 20 00279 i006]() |
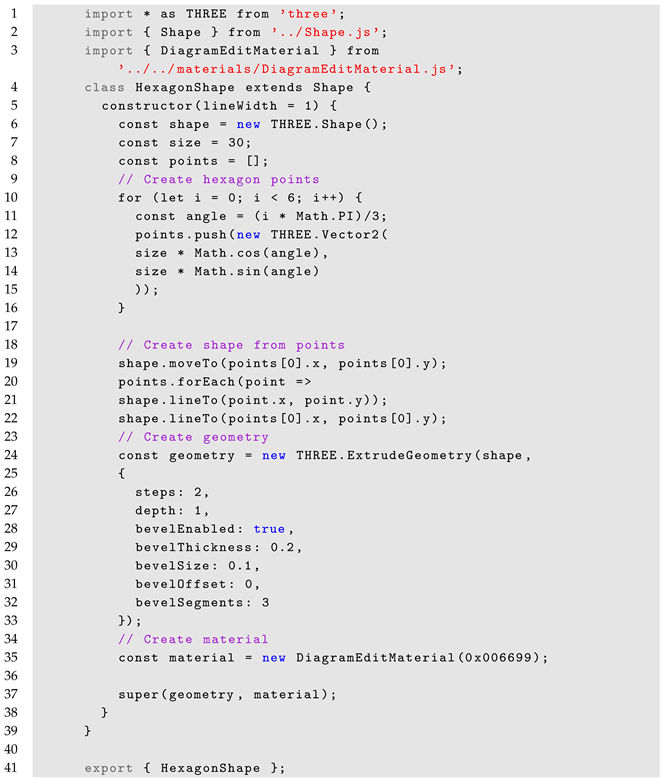
Custom Shapes—Listing 7 shows how to create custom shapes by extending the base Shape class:
| Listing 7. Custom Hexagon Shape |
![Jtaer 20 00279 i007 Jtaer 20 00279 i007]() |
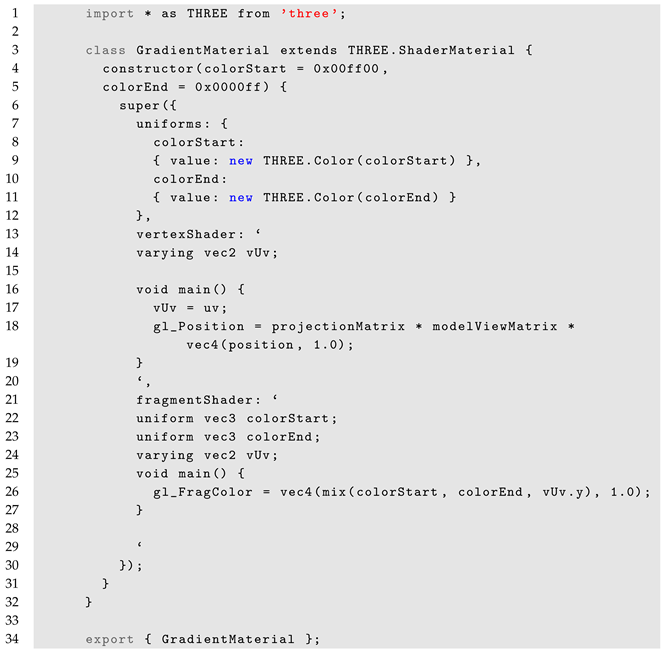
Custom Materials—Listing 8 shows how to create custom materials for different visual styles.
| Listing 8. Custom Gradient Material |
![Jtaer 20 00279 i008 Jtaer 20 00279 i008]() |
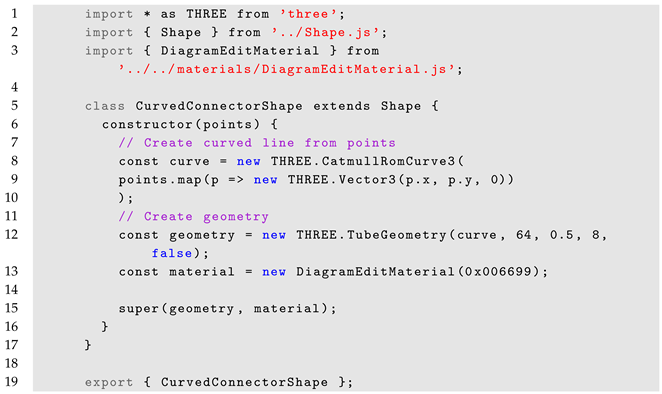
Custom Connectors—Listing 9 shows how to create custom connectors for specialized connections.
| Listing 9. Custom Curved Connector |
![Jtaer 20 00279 i009 Jtaer 20 00279 i009]() |
The software provides a comprehensive set of functionalities for creating, customizing, and managing 3D diagrams. Its modular design and extensibility make it a powerful tool for visualizing e-commerce funnels and other complex systems, while its real-time interaction capabilities enhance the user experience.
4. Illustrative Examples
This section details a case study demonstrating how Aurea EDEN can be applied to model and analyze a typical e-commerce customer journey. A specialized ECommerceFunnelDiagram class was developed, extending the core Diagram class, to provide methods tailored for this domain.
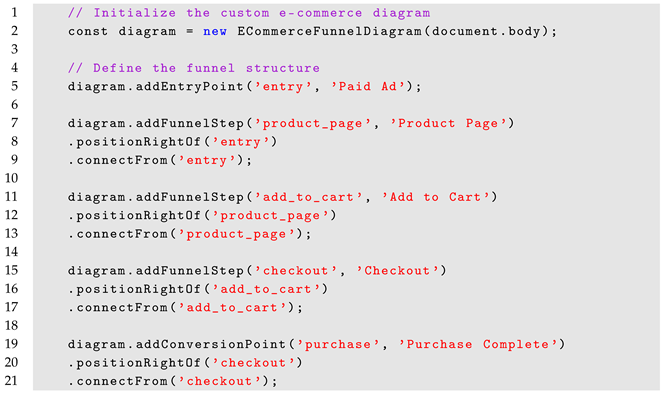
The case study models a standard online retail conversion funnel: a user arrives from a paid advertisement, views a product, adds it to the cart, and proceeds to checkout. Each stage is represented by a distinct element in the diagram. Listing 10 shows the code used to programmatically generate this funnel structure. Methods like addEntryPoint, addFunnelStep, and addConversionPoint were created to simplify the representation of common e-commerce concepts.
| Listing 10. Programmatic Creation of the E-Commerce Funnel |
![Jtaer 20 00279 i010 Jtaer 20 00279 i010]() |
The resulting 2D visualization provides a clear, high-level map of the intended customer path, as shown in
Figure 3. This view is analogous to traditional flowcharting and serves as the structural baseline for analysis.
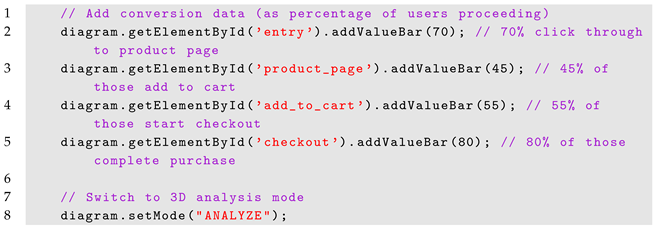
The primary innovation of Aurea EDEN is its ability to overlay this structural model with quantitative performance data. Using the addValueBar method, key e-commerce metrics can be mapped directly onto each funnel step. In this case study, the drop-off rate at each stage is visualized. A taller bar indicates a higher percentage of users proceeding to the next step, while a shorter bar visually flags a significant drop-off point. Listing 11 demonstrates how this data is added, and how the diagram is switched to ANALYZE mode for 3D viewing.
| Listing 11. Visualizing KPIs on the Funnel |
![Jtaer 20 00279 i011 Jtaer 20 00279 i011]() |
Figure 4 shows the resulting 3D visualization. The perspective view allows the analyst to immediately compare the performance of each step. In this example, the significant drop in the bar height between ‘Product Page’ and ‘Add to Cart’ instantly highlights this transition as the largest point of customer churn, suggesting it as a prime candidate for UX improvements or A/B testing. This data-rich 3D model provides a far more intuitive and actionable insight than reviewing the same numbers in a table.
5. Empirical Evaluation
The presented approach was validated through two empirical studies: a user study assessed the 3D visualization’s effectiveness for analytical tasks, and a technical performance benchmark evaluated the library’s scalability.
5.1. Effectiveness and Usability Study
The primary goal of this study was to empirically compare the effectiveness of the Aurea EDEN 3D visualization against a traditional 2D dashboard for common e-commerce analysis tasks. A within-subjects design was employed, where each of the 32 participants completed tasks using both interfaces. To mitigate learning effects, the order of the two conditions—the Aurea EDEN 3D view and a 2D baseline dashboard—was counterbalanced across participants. The participant pool included 16 professionals with experience in digital marketing or data analysis and 16 graduate students in related fields, ensuring a representative sample of users with relevant expertise.
To ensure a fair comparison, both interfaces displayed the exact same underlying datasets representing a typical e-commerce conversion funnels. In the Aurea EDEN 3D view, this data was presented as a 3D model where the height and color of a bar at each stage corresponded to the user conversion rate. In the 2D baseline condition, the identical data was presented in a standard dashboard format, using a table and a simple 2D bar chart. Participants were asked to complete three tasks designed to simulate authentic analytical activities. The first task, Identification, required participants to identify the funnel stage with the greatest percentage drop-off. The second, Estimation, asked them to approximate the total number of final purchases given a hypothetical percentage improvement at a specific stage. The third and most complex task, Prioritization, required participants to compare two potential optimization targets and determine which would yield a greater absolute increase in final conversions.
A combination of objective and subjective data was collected to form a comprehensive evaluation. Objective performance was measured through task completion time (in seconds), accuracy (percentage correct), and, for the estimation task, the absolute percentage error. Subjective feedback was gathered using two standardized instruments: the NASA-Task Load Index (NASA-TLX) was administered after each condition to assess perceived cognitive workload [
30,
31,
32,
33], and the System Usability Scale (SUS) was used to measure perceived usability [
34,
35]. Finally, a post-study questionnaire captured qualitative feedback, including user preference and confidence ratings. The study was conducted in a controlled lab setting on a 24-inch 1920 × 1080 monitor, with each session including a training phase, practice trials, and the main tasks for both conditions.
5.2. Performance and Scalability Benchmark
The Aurea EDEN library’s technical performance was assessed with a benchmark. It measured rendering performance under systematically varied loads.
The benchmark methodology used generated diagrams at three complexity levels low medium and high. Complexity was based on the number of elements, connectors and KPI bars.
Performance metrics for each complexity level were initial page load time and average frames per second FPS. FPS was measured during user interactions like panning and zooming.
Key optimization techniques were evaluated on a standardized machine equipped with an Intel i7 CPU (Intel Corporation, Santa Clara, CA, USA), an NVIDIA RTX 4060 GPU (NVIDIA Corporation, Santa Clara, CA, USA), and 16 GB of RAM.
6. Results
This section presents the quantitative and qualitative findings from the empirical evaluation.
The results from the user study (
Table 3 and
Table 4) show that participants were significantly faster at completing all tasks using the Aurea EDEN 3D interface. For the prioritization task (T3), accuracy was also significantly higher. For simpler tasks like identification (T1) and estimation (T2), accuracy was comparable between the two interfaces. Subjective measures (
Table 5) reveal a significant preference for the 3D interface, which received a significantly lower cognitive workload score on the NASA-TLX and a significantly higher usability score on the SUS. The performance benchmark (
Table 6) demonstrates that the library maintains interactive frame rates (well above 30 FPS) even under high load, confirming its viability for complex, real-world e-commerce funnels.
7. Discussion
7.1. Summary of Findings
The empirical evaluation provides strong evidence supporting the effectiveness of the 3D visualization approach especially for larger datasets. The user study revealed that embedding KPIs as geometric properties on a 3D funnel model leads to faster task performance for identification, estimation, and prioritization tasks compared to a traditional 2D dashboard. Notably, for the more complex prioritization task, the 3D view also led to higher decision accuracy. Furthermore, participants perceived the 3D interface as having significantly lower cognitive workload and higher usability. The technical benchmark confirmed that the underlying software architecture is robust and scalable, capable of rendering complex diagrams at interactive frame rates.
7.2. Practical Implications for CRO
For e-commerce practitioners, the findings suggest potential benefits for the CRO workflow. The significant reductions in task completion time (e.g., 22% for T3) and cognitive load (18% on NASA-TLX) point to the 3D approach’s potential for accelerating the identification of performance bottlenecks. This efficiency may allow analysts to proceed to A/B testing more quickly. The high SUS score (82.4) also suggests that users perceive the tool as usable, pointing to a positive initial reception.
Interestingly, the prioritization task (T3), while strategically complex, was completed faster than the estimation task (T2). This suggests that both visualizations made the primary bottleneck so immediately apparent during the initial identification task (T1) that the subsequent strategic decision in T3 required minimal additional cognitive effort. This rapid translation from data perception to actionable insight is a key goal for effective analytics tools.
This direct visualization of KPIs allows for faster, more intuitive identification of problem areas, leading to more effective data-driven decision-making.
7.3. Research Opportunities
This work opens several avenues for future research. The current study focused on a single KPI (conversion rate); future studies could explore more complex scenarios with multiple, competing KPIs encoded using different visual channels (e.g., color, texture) on the 3D model. Another direction is to investigate the visualization of more complex journey structures, such as those with branching paths or loops, which are common in real-world e-commerce but were simplified in this study. Finally, the library’s API creates opportunities for research into AI-driven analytics, including the automated generation of diagrams from natural language and the use of machine learning to detect and highlight anomalous patterns within the visualized data.
7.4. Limitations
This study has several limitations. The participant pool, while including professionals, was not exclusively composed of seasoned CRO experts, which may affect the generalizability of the findings to that specific population. The tasks, while representative, were simplified versions of real-world analysis and did not involve the full complexity of a real dataset. Threats to internal validity were mitigated through counterbalancing and a controlled experimental setup. External validity is a key consideration; the 3D approach may not be universally superior. For very simple, linear funnels with a single KPI, a traditional 2D bar chart is likely sufficient. It is hypothesized that the approach provides the most benefit in scenarios involving the analysis of more complex funnels, the simultaneous comparison of multiple KPIs, or the comparison of performance across different user segments or A/B test variants.
7.5. Ethics and Licensing
The user study protocol received institutional ethics approval. All participants provided informed consent and were compensated for their time. The Aurea EDEN software v1.25.1 is open-source, available under a GPL-3.0 license to encourage adoption and further research by the community.
8. Conclusions
This paper presented Aurea EDEN, a novel library for creating interactive 3D diagrams, and provided empirical evidence of its effectiveness for the application of e-commerce analytics. By encoding KPIs directly as geometric properties on a 3D model of the customer journey, the approach offers a more integrated and intuitive alternative to traditional 2D dashboards. The user study demonstrated that this method significantly improves the speed of analysis and reduces cognitive load for common e-commerce tasks, while the performance benchmark confirmed the library’s technical viability.
The key contribution of this work is the validation of the “KPI-as-geometry” approach, demonstrating that using the third dimension as a semantic channel for data encoding can yield measurable performance and usability benefits. This direct visualization of data changes how analysts interact with e-commerce metrics, providing a powerful and flexible foundation for advancing the state-of-the-art in analytics.
The practical utility of this approach is highlighted by Aurea EDEN’s successful integration into a commercial low-code platform (Aurea LCDP) and its adoption by a user base of nearly nineteen thousand across commercial and academic sectors as of May 2025. This real-world adoption underscores the tool’s relevance and impact.
Aurea EDEN provides a powerful and flexible foundation for advancing the state-of-the-art in e-commerce analytics, enabling new research avenues and providing practitioners with a more insightful way to understand and optimize the digital customer experience.

