Abstract
As self-service technologies (SSTs) such as kiosks become embedded in service infrastructure, understanding the socio-cognitive drivers of adoption has grown in importance. This study extends the Technology Acceptance Model (TAM) by integrating Digital Readiness (DR), Trust in Technology (TT), Perceived Usefulness (PU), and Perceived Barriers (PB) into a single framework, and tests it using structural equation modeling (SEM) with survey data from 750 kiosk users in China. TT emerges as the strongest direct predictor of intention to use (IU) and also increases PU while reducing PB. The deterrent effect of PB exceeds the positive effect of PU. DR promotes adoption indirectly by raising TT and PU and lowering PB, whereas its direct path to IU is negative, suggesting a tension between readiness and heightened expectations. Multi-group analyses show that non-digital natives and low-frequency users are more sensitive to trust-related factors, whereas digital natives and high-frequency users respond more to barrier reduction. These findings integrate trust and barrier perspectives into TAM and reconceptualize DR as an ambivalent antecedent. Practically, a segment- and journey-oriented design frame centered on trust and friction provides a common reference for aligning kiosk design, KPIs, and investment decisions across industries.
1. Introduction
The accelerating digitalization of services has fundamentally transformed the way consumers interact with technology. Among various innovations, self-service technologies (SSTs) such as kiosks have become a central driver of modern service delivery, enabling transactions, information retrieval, and other processes without human intermediaries [1,2,3]. The COVID-19 pandemic further accelerated this transformation, making contactless solutions essential for ensuring service continuity and public safety [4,5]. Even after the pandemic, the demand for kiosks has not declined; rather, they have become a permanent service infrastructure that reshapes consumer expectations and operational standards across industries [6,7].
Against this backdrop, kiosk adoption is no longer a question of “whether” but of “how.” The challenge for both academia and industry lies not only in implementing the technology but in ensuring that it is used continuously and effectively. Identifying the drivers of adoption is therefore crucial, not only from the perspective of functional performance but also in terms of the psychological and social mechanisms that influence user acceptance and sustained use [8].
The Technology Acceptance Model (TAM) has provided a theoretical foundation for technology adoption research, identifying perceived usefulness (PU) and perceived ease of use (PEU) as key determinants [9,10,11,12]. However, in unattended service environments, socio-psychological factors such as digital readiness (DR), trust in technology (TT), and perceived barriers (PB) may play a more critical role [13,14]. Social Trust Theory posits that trust reduces uncertainty and perceived risk, thereby facilitating adoption [15,16], while the concept of barriers provides an extended pathway in TAM to capture negative inhibitory factors beyond usefulness and ease of use [17]. Nevertheless, empirical studies that integrate TT with DR, PU, and PB in kiosk settings remain scarce, and studies that explicitly compare different user groups are still limited in scope [3,8].
Existing kiosk research has also tended to focus on specific industries (e.g., quick-service restaurants, transportation hubs) or restricted samples, limiting generalizability [18,19]. For example, defined as individuals born after the early 1980s who have grown up with digital technologies as part of their everyday lives [20], tend to have high technology familiarity and faster learning curves, and may therefore be more sensitive to barrier reduction than to trust formation [21]. In contrast, non-digital natives, with limited experience using such technologies, may view trust building as a central factor in adoption [22]. Similarly, high-frequency users may rely more on functional efficiency and obstacle removal, while low-frequency users may depend more heavily on lowering initial entry barriers and fostering psychological comfort. Understanding these differences is essential for advancing theory and refining practical strategies.
In response, this study extends TAM by integrating DR, TT, PU, and PB into a unified socio-cognitive analytical framework and empirically examines their effects on intention to use kiosks (IU) in the context of China, a country with advanced digital infrastructure. It further explores segmental differences by generation and usage frequency, thereby reinterpreting kiosk adoption through both a trust-centered and barrier-sensitive lens. From a practical perspective, the study highlights the need for differentiated strategies, balancing trust-building measures for less experienced users with barrier-reduction strategies for digitally proficient users.
The remainder of this paper is organized as follows. Section 2 reviews relevant literature and hypotheses. Section 3 outlines the research design and methodology. Section 4 reports the empirical results. Section 5 discusses the findings and robustness checks, and Section 6 concludes with implications and future research directions.
2. Literature Review and Hypothesis Development
2.1. Literature Review
2.1.1. Extended TAM and Kiosk Adoption
Self-service technologies (SSTs) are technological interfaces that allow customers to obtain services without direct employee assistance [23]. Kiosks, in particular, have become one of the most prevalent SST formats across retail, hospitality, transportation, and healthcare sectors. The Technology Acceptance Model (TAM) identifies perceived usefulness (PU) and perceived ease of use (PEU) as central drivers of adoption [9,24]. These constructs were later extended in UTAUT and UTAUT2, which integrated social influence, facilitating conditions, and hedonic motivation [25,26]. While foundational, these models have been critiqued for emphasizing technological attributes while neglecting socio-psychological mechanisms particularly salient in unattended service contexts.
Early SST research emphasized these shortcomings. Studies showed that adoption is shaped not only by usefulness and ease but also by control perceptions, risk, technology anxiety, and prior experience [12,27,28,29]. Blut, Wang and Schoefer [1] further revealed through meta-analysis that perceived barriers often exert stronger effects than perceived usefulness in shaping intention. More recent research has incorporated constructs such as trust in technology (TT) and perceived barriers (PB) [8,17,30], while outcome-oriented kiosk studies have highlighted behavioral consequences such as enhanced shopping value and self-image [31]. Yet, these contributions remain bounded by specific industries or situational contexts, such as fast-food restaurants, airports, or the pandemic [5,8,32]. Collectively, this literature underscores the need for integrative frameworks that account for both positive drivers and negative inhibitors of kiosk adoption.
To provide a systematic overview, Table 1 summarizes prior studies across five research streams—TAM, SST, trust, perceived barriers, and digital readiness—highlighting their key findings and representative studies.

Table 1.
Summary of Prior Studies.
2.1.2. Digital Readiness
Digital readiness (DR) refers to an individual’s capacity and disposition to effectively engage with digital technologies [38]. Drawing on socio-technical systems theory [39], adoption emerges from interactions between technical features and socio-cultural contexts rather than technical compatibility alone. High levels of DR reduce psychological resistance and increase favorable evaluations of new technologies [11].
Empirical evidence confirms DR’s influence across multiple pathways: it fosters trust [8,22], strengthens perceived usefulness [22,32], and reduces perceived barriers [42]. However, contradictory findings suggest that high DR may also elevate service expectations, potentially lowering intention to use if kiosk performance falls short [37]. Studies on DR have often been limited to online environments or specific demographic groups [40,41], while kiosk-related research remains fragmented across industries [5,8,32]. These limitations highlight the need to examine how DR interacts with TT, PU, and PB simultaneously in shaping adoption.
2.1.3. Trust in Technology
Trust in technology (TT) is the extent to which users perceive a technology as reliable, dependable, and secure [33]. Social Trust Theory posits that trust reduces uncertainty and perceived risk, thereby facilitating adoption [15]. Prior studies highlight TT’s significance in both online environments [34,35] and offline SST contexts where human assistance is absent [1].
TT operates as a central psychological antecedent by reducing anxiety [1], enhancing perceived usefulness [36], and lowering perceived barriers [1]. Moreover, DR shapes TT by reducing technology-related anxiety and shortening learning curves, thereby creating indirect effects on PU and PB through TT [8,22]. This mediating role positions TT as a crucial bridge between readiness and adoption intention, offering a more nuanced explanation of kiosk usage mechanisms.
2.1.4. Perceived Usefulness and Perceived Barriers
PU has consistently been identified as a strong positive predictor of adoption intention [9,24,32]. However, usefulness alone cannot explain adoption outcomes, as barriers such as malfunctions, complex interfaces, payment errors, and insufficient guidance substantially weaken usage intention [1,23]. Unlike perceived ease of use (PEU), which primarily reflects the simplicity and intuitiveness of system operation, perceived barriers (PB) encompass a wider range of practical and psychological inhibitors that undermine adoption in unattended contexts. Because basic usability has already become an industry standard in kiosk design, PEU often has limited explanatory power, while PB more directly captures the frictions that discourage usage. Moreover, whereas PEU’s effects are often mediated through PU [9,24], PB represents independent inhibitory mechanisms that cannot be reduced to usefulness [1].
Importantly, prior studies show that PB exerts asymmetric effects, in which negative influences outweigh the positive contribution of PU [1,17]. This indicates that adoption is often sustained less by the presence of usefulness than by the absence of barriers. By foregrounding PB in our model, this study captures the full spectrum of frictions—technical, procedural, and psychological—that are central to understanding kiosk adoption in real-world, unattended environments.
2.2. Hypothesis Development
2.2.1. Effects of Digital Readiness (H1–H4)
Digital readiness enhances individuals’ self-efficacy and sense of control when engaging with new technologies [17,38]. Higher self-efficacy fosters favorable interpretations of a system’s predictability and recoverability, leading to stronger perceptions of stability and reliability [14,21]. In kiosk usage—where users must independently complete essential procedures such as payment, data entry, and navigation—those with higher DR are more likely to view potential risks as “manageable situations” rather than “threats” [43].
H1.
Digital readiness positively influences trust in technology.
Perceived usefulness reflects the cognitive judgment of how much a technology improves task performance [9,44]. Individuals with high DR learn system functions more quickly, utilize a wider range of features effectively, and thereby perceive greater performance benefits [14,45]. In the kiosk context, processes such as menu navigation, option selection, and payment are directly linked to time savings and error reduction—performance benefits that high-DR users quickly recognize and value [5].
H2.
Digital readiness positively influences perceived usefulness.
Perceived barriers encompass not only physical and technical issues but also psychological barriers [1,30]. Users with high DR are less intimidated by interface complexity and procedural friction, and their ability to identify recovery strategies in the event of errors reduces perceived anxiety [5,7]. Consequently, even common kiosk-related obstacles—such as delayed responses or payment errors—are more likely to be interpreted by high-DR users as “minor, surmountable frictions” [43].
H3.
Digital readiness negatively influences perceived barriers.
Beyond technical competence, digital readiness (DR) encompasses openness to innovation and a proactive attitude toward adopting new technologies [17,44]. Such dispositions lower psychological resistance to new systems, accelerate initial learning and adaptation, and reduce uncertainty during use [21]. As a result, even before specific evaluations of perceived usefulness (PU) or perceived barriers (PB) are formed, users with high DR face a lower threshold for trying new technologies and are more inclined to explore novel features or interfaces. This behavioral openness and reduced anxiety directly strengthen their intention to adopt the technology [5].
H4.
Digital readiness positively influences intention to use.
2.2.2. Effects of Trust in Technology (H5–H7)
Trust in technology reduces the uncertainty and perceived risks associated with using a system. This reduction in risk perception allows users to shift from a defensive stance—focused on avoiding negative events such as payment errors or system failures—to a proactive stance aimed at maximizing efficiency and performance [33,46]. This shift occurs because trust enhances expectations regarding the predictability of outcomes and the consistency of procedures (e.g., the belief that the likelihood of errors is low and that, if errors occur, recovery is possible), enabling users to reallocate the attention and cognitive resources they would otherwise devote to error monitoring toward improving task efficiency and performance [47,48]. High levels of trust in technology (TT) strengthen the belief that the system will perform as intended, thereby reinforcing positive evaluations of its efficiency, accuracy, and speed [16,21]. In kiosk contexts, trust provides assurance that even sensitive procedures—such as authentication or payment—will operate safely and as intended, which reduces vigilance against potential risks like data breaches or transaction failures and fosters the perception that such processes are stable and secure [13,49]. This perception of safety serves as a cognitive foundation for evaluating the technology as “useful” in achieving performance goals, thereby enhancing perceived usefulness.
H5.
Trust in technology positively influences perceived usefulness.
Perceived barriers (PB) often stem from concerns about technology failure or the complexity of usage procedures [1,30]. When trust in technology (TT) is high, users—based on prior experience and social or technical cues about the system’s stability—believe that the system will operate reliably and that any problems can be resolved [5,46]. This belief fosters the perception that “even if a problem occurs, its consequences will not be severe,” which reduces anxiety about potential errors [47,50] and leads users to view the same frictions or inconveniences as manageable and temporary rather than as threats. As a result, users with high TT perceive fewer barriers when using kiosks [7].
H6.
Trust in technology negatively influences perceived barriers.
In unattended service environments, adoption decisions are inherently trust-dependent, meaning that without confidence in the stability and predictability of system operations—as well as the protection of personal and transactional data—users are unlikely to proceed [34,49]. This dependency is particularly salient in kiosk contexts, where payment and personal information entry occur without staff involvement, making trust in technology (TT) a prerequisite for adoption [13,46]. Once trust surpasses a certain threshold, users perceive that minimum acceptable standards for transaction safety and privacy protection have been met, prompting a binary “use or not use” decision to shift toward adoption. In this process, trust simultaneously reduces perceived risk and increases the weight assigned to expected benefits—such as convenience, speed, and accuracy—thereby activating approach motivation [34,49]. Consequently, high TT reinforces the conviction that the technology is “safe” and “efficient,” which strengthens intention to use [16].
H7.
Trust in technology positively influences intention to use.
2.2.3. Effects of Perceived Usefulness and Perceived Barriers (H8–H9)
One of the core pathways in the Technology Acceptance Model (TAM) is the direct positive effect of perceived usefulness (PU) on intention to use (IU) [9,24]. This relationship occurs because when users believe that a given technology will improve their task performance, their expected utility from using the technology increases, which in turn makes the perceived costs—such as time, effort, and risk—relatively less significant [51]. In other words, when the perceived benefits outweigh the costs, a positive net benefit assessment is formed, reinforcing the decision that the technology is “worth using.” This cognitive evaluation process ultimately leads to a stronger behavioral intention.
In the kiosk context, simplified menu navigation, reduced waiting times, and improved accuracy enhance users’ expected utility [1,23] and lower operational burdens or error risks, thereby strengthening the net benefit assessment and increasing usage motivation [5].
H8.
Perceived usefulness positively influences intention to use.
Perceived barriers impose additional costs in the form of time, effort, and psychological barriers, which weaken adoption intentions [1,30]. Due to the negativity bias, users are often more sensitive to losses or inconveniences than to equivalent gains [7,46]. In kiosk usage, typical barriers—such as slow response times, payment failures, or insufficient guidance—can significantly deter use, even when PU is high [5].
H9.
Perceived barriers negatively influence intention to use.
2.3. Research Framework
Figure 1 presents the proposed research framework, which extends the Technology Acceptance Model (TAM) by incorporating Digital Readiness (DR), Trust in Technology (TT), Perceived Usefulness (PU), and Perceived Barriers (PB) as key antecedents of Intention to Use (IU) kiosks. In this framework, DR is positioned as a foundational factor that directly influences TT, PU, PB, and IU. TT is hypothesized to exert both direct and indirect effects on IU by shaping PU and PB. PU and PB serve as core cognitive evaluations that determine whether users translate their assessments of technology into actual behavioral intentions. By capturing both the direct and mediated pathways from DR to IU, this model enables a more comprehensive understanding of kiosk adoption decisions in self-service contexts.
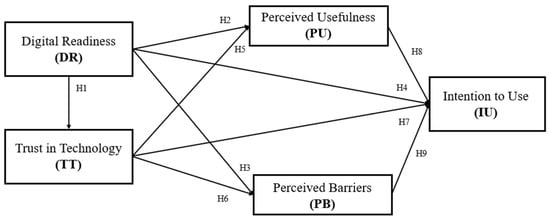
Figure 1.
Research Framework. Note: In addition to testing the direct and indirect relationships hypothesized in H1–H9, multi-group structural equation modeling (SEM) was conducted to explore potential differences across (1) generational cohorts (Gen Z vs. Non-Gen Z) and (2) kiosk usage frequency (high vs. low). These multi-group analyses are intended as robustness checks and exploratory extensions rather than formal hypothesis testing.
3. Methodology
The proposed hypotheses were empirically examined using a structured survey instrument based on previously validated scales. The items were carefully refined to reflect the specific context of kiosk usage, ensuring both content validity and theoretical alignment. Structural equation modeling (SEM) was employed to assess the direct and indirect relationships among digital readiness, trust in technology (TT), perceived usefulness, perceived barriers, and intention to use kiosks. In addition, multi-group moderation analyses were conducted based on generational cohort and kiosk usage frequency, and a robustness check using the Maximum Likelihood Robust (MLR) estimation method was performed to validate the stability of the results.
3.1. Data Collection
To investigate the psychological and behavioral determinants of kiosk adoption, this study targeted only individuals with prior kiosk usage experience. Participants were recruited through a combination of snowball and convenience sampling via WeChat, the most widely used digital communication platform in China. This approach enabled broad participation across diverse generational and regional backgrounds.
A screening question was positioned at the beginning of the survey to confirm prior usage experience; only those who responded affirmatively were allowed to proceed. IP tracking was employed to prevent duplicate entries, and all responses were collected anonymously in compliance with data privacy standards. After excluding incomplete or invalid submissions, a total of 750 valid responses were retained for analysis.
Because the sampling strategy was non-probabilistic, the findings should be interpreted with caution regarding their generalizability. In particular, the exclusion of non-users and digitally excluded groups inherently limits the extent to which the results can be generalized beyond active kiosk users. Nevertheless, the inclusion of respondents across multiple demographic and behavioral strata—such as gender, generational cohort, city tier, occupational group, and kiosk usage frequency—enhances the external validity of the study within the context of kiosk users in China.
3.2. Measures and Instruments
All measurement items were adapted from previously validated scales and refined to suit the context of kiosk usage. Excluding the first six demographic and screening questions, the remaining 25 items were mapped onto five core latent constructs—Digital Readiness (DR), Trust in Technology (TT), Perceived Usefulness (PU), Perceived Barriers (PB), and Intention to Use (IU). Each construct was measured using five items, and all responses were recorded on a seven-point Likert scale ranging from 1 (Strongly Disagree) to 7 (Strongly Agree).
Statistical analyses were conducted using R (version 4.5.1). Confirmatory factor analysis (CFA), structural equation modeling (SEM), and tests of reliability and validity (including HTMT) were performed using the lavaan and semTools packages. Multicollinearity was assessed via VIF, and descriptive statistics were computed to ensure analytical precision and replicability.
Digital Readiness (DR) was measured using items adapted from Compeau and Higgins [52], Bandura [53], Davis [9], and Venkatesh and Davis [24], capturing respondents’ confidence in using digital technologies. Trust in Technology (TT) was assessed using modified items from Mcknight, Carter, Thatcher and Clay [47], Gefen, Karahanna and Straub [50], and Pavlou [34], reflecting users’ perceptions of system reliability, integrity, and security. Perceived Usefulness (PU) was based on scales developed by Davis [9] and Venkatesh, Morris, Davis and Davis [25] measuring the degree to which kiosk services are perceived to enhance task performance and autonomy. Perceived Barriers (PB) drew from Venkatesh, Morris, Davis and Davis [25] and Pavlou [34], assessing psychological and practical concerns associated with kiosk usage—such as technological difficulty, breakdown risk, or discomfort with non-human interaction. Intention to Use (IU) was measured using items derived from Venkatesh, Morris, Davis and Davis [25] and Fishbein and Ajzen [54], representing respondents’ behavioral intentions to continue using kiosks and recommend them to others.
All items were originally written in English, translated into simplified Chinese, and back-translated by bilingual experts to ensure semantic equivalence and cultural appropriateness.
3.3. Sample Characteristics
In this study, a “kiosk user” is defined as an individual who has used a self-service terminal for ordering, payment, or information retrieval in commercial or public settings such as restaurants, hospitals, or transportation hubs. To ensure behavioral context relevance, kiosk usage experience was first confirmed through a screening question at the beginning of the survey, and respondents without prior experience were not allowed to proceed. This design choice was intentional, as the purpose of this study was to examine the psychological and cognitive mechanisms that emerge after direct usage experience.
The updated dataset comprises 750 valid responses collected through a combination of snowball and convenience sampling via WeChat in mainland China. This context reflects a high degree of digital infrastructure maturity and widespread kiosk penetration, providing an appropriate setting to explore psychological and behavioral mechanisms of kiosk adoption.
The sample exhibits considerable demographic diversity. Females accounted for 54.7%, males for 45.1%, and 0.2% identified as other or non-disclosed. In terms of generational cohort, 39.3% were Gen Z (born 1997–2010), 36.8% Gen Y (1980–1996), and 23.9% Gen X or older (born 1979 or earlier). City tier distribution included 24.0% from Tier 1 (highly developed cities), 36.7% from Tier 2, 27.7% from Tier 3, and 11.6% from rural or less-developed areas. Occupations were distributed across customer-facing roles (25.2%), office/administrative (23.2%), education/public/professional (26.0%), and self-employed/freelancer/others (25.6%).
Regarding kiosk usage frequency, 32.9% reported very frequent use (weekly or more), 43.9% reported frequent use (2–3 times/month), while 12.0% used kiosks occasionally (about once/month), and 11.2% rarely (less than once/month). This variation allows for comparative analysis across high- and low-experience user segments.
Although the sampling strategy is non-probabilistic, the inclusion of respondents across diverse demographic and behavioral strata demonstrates that the sample reflects a broad cross-section of actual kiosk users in China. This diversity strengthens the external validity of the study by capturing multiple usage contexts and user groups, thereby enhancing confidence that the findings are representative of the active kiosk user population. However, it is acknowledged that the study does not include kiosk non-users or digital avoiders, which may limit interpretability for digitally excluded populations.
Table 2 presents a comprehensive demographic and behavioral profile of the final sample.
Table 2.
Sample Characteristics (n = 750).
4. Empirical Results
4.1. Measurement Model Evaluation
Framed by the Technology Acceptance Model (TAM) and informed by the Unified Theory of Acceptance and Use of Technology (UTAUT) for measurement practice, the measurement model was first evaluated to ensure that it met the psychometric standards required for subsequent structural analysis. The assessment covered four key aspects: internal consistency, convergent validity, discriminant validity, and overall model fit.
As shown in Table 3, all five latent constructs—Digital Readiness (DR), Trust in Technology (TT), Perceived Usefulness (PU), Perceived Barriers (PB), and Intention to Use (IU)—exhibited exceptionally high internal consistency. Cronbach’s alpha and composite reliability (CR) values ranged from 0.975 to 0.980, well above the conventional 0.70 threshold, while the average variance extracted (AVE) values ranged from 0.885 to 0.906, exceeding the 0.50 criterion. These results confirm that the items within each construct consistently measure the same underlying concept, indicating strong convergent validity.
Table 3.
Construct Reliability and Convergent Validity (n = 750).
Confirmatory factor analysis (CFA) results further supported the robustness of the measurement model. As reported in Table 4, incremental fit indices and residual-based indices indicated excellent model fit (CFI = 0.999, TLI = 0.999, RMSEA = 0.014, SRMR = 0.011), notwithstanding a marginally significant χ2 (χ2 = 305.792, df = 265, p = 0.043), a common outcome in large-sample CFA applications. Additionally, all standardized factor loadings exceeded 0.94, underscoring the strong association between each item and its corresponding latent construct. While such high loadings can sometimes suggest redundancy, variance inflation factor (VIF) checks revealed no multicollinearity issues, indicating that the items capture distinct facets of the construct while maintaining conceptual cohesion.
Table 4.
CFA Model Fit Indices (n = 750).
Discriminant validity was confirmed using the Heterotrait–Monotrait (HTMT) ratio of correlations (Table 5). All HTMT values ranged from 0.48 to 0.87, remaining below the conservative 0.90 threshold. Notably, PU and PB—both evaluative constructs—were clearly distinguished, supporting the notion from dual-process theory [55] that positive and negative evaluations are processed through separate cognitive pathways.
Table 5.
HTMT Values for Discriminant Validity (n = 750).
4.2. Descriptive Statistics and Multicollinearity Assessment
Before estimating the structural model, descriptive statistics were analyzed to understand the general perception patterns across the five constructs, and multicollinearity diagnostics were performed to ensure the independence of predictors.
As shown in Table 6, mean scores ranged from 3.72 (PB) to 4.41 (IU) on a seven-point Likert scale. The highest mean for IU suggests that respondents generally hold favorable intentions toward kiosk usage. In contrast, PB recorded both the lowest mean and the highest standard deviation (SD = 2.00), indicating not only a relatively low perception of barriers overall but also substantial variation across individuals—implying that certain user segments perceive kiosk usage as significantly more challenging than others.
Table 6.
Construct Reliability and Descriptive Statistics (n = 750).
Internal consistency remained exceptionally high for all constructs (Cronbach’s α = 0.975–0.980), reaffirming the reliability of the measurement scales. VIF values ranged from 1.78 (DR) to 3.52 (PB), far below the common cutoff of 5.00, confirming the absence of problematic multicollinearity. While PU and PB exhibited relatively higher VIFs compared to other constructs, they still remained well within acceptable bounds, suggesting that the constructs capture related but statistically distinguishable aspects of the user experience.
Taken together, the descriptive statistics highlight a generally positive orientation toward kiosks, with variation in perceived barriers serving as a meaningful source of heterogeneity in adoption behavior. The multicollinearity results further confirm that the constructs are sufficiently independent for inclusion in the structural model.
4.3. Structural Model and Hypothesis Testing
The structural equation modeling (SEM) results indicated an excellent overall model fit (CFI = 0.989, TLI = 0.988, RMSEA = 0.041, SRMR = 0.068). All structural paths were statistically significant (p < 0.001), and the standardized estimates aligned closely with theoretical expectations, with one notable exception.
Table 7 summarizes the numerical results of hypothesis testing, and Figure 2 illustrates the structural model with standardized path coefficients and hypothesis testing outcomes. Together, they provide both statistical and visual confirmation of the hypothesized relationships.
Table 7.
Results of hypothesis testing based on the structural equation model (n = 750).
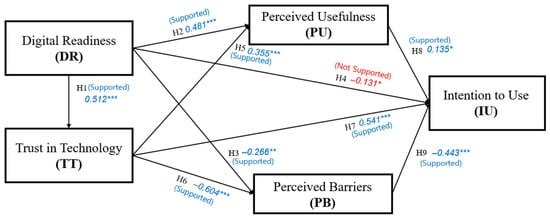
Figure 2.
Results of the structural model. Notes: Standardized path coefficients (β) and significance levels are displayed next to each path. * p < 0.05, ** p < 0.01, *** p < 0.001. “Supported” and “Not Supported” indicate the outcome of hypothesis testing.
For H1, digital readiness (DR) exerted a strong positive effect on trust in technology (TT; β = 0.512, p < 0.001), confirming that greater digital competence fosters higher levels of trust. This aligns with the self-efficacy perspective of Compeau and Higgins [52] and Bandura [53], which views familiarity and capability as foundational to trust formation. H2 predicted a positive relationship between DR and perceived usefulness (PU), which was supported (β = 0.481, p < 0.001), indicating that digitally proficient users are more likely to view kiosks as enhancing efficiency and performance. Consistent with H3, DR had a significant negative impact on perceived barriers (PB; β = −0.266, p < 0.001), suggesting that digital familiarity reduces cognitive and psychological resistance to technology use.
H4 hypothesized a positive direct effect of DR on intention to use (IU). However, the observed coefficient was significant but negative (β = −0.131, p < 0.001), opposite to the hypothesized direction. Accordingly, H4 was not supported in its direct form. This pattern is consistent with a suppression effect, wherein DR influences IU primarily through indirect pathways—via TT, PU, and PB—which are positive, while the residual direct path captures other factors. One possible explanation is that highly digitally proficient users may hold elevated performance expectations, making them more sensitive to even minor usability flaws or service delays. They may also prefer alternative channels, such as mobile applications, that they already trust and perceive as offering greater autonomy. As a result, while DR fosters adoption indirectly through trust and perceived usefulness, its direct effect can become negative when heightened expectations and alternative preferences outweigh its facilitating role.
H5 and H6 examined the effects of TT on PU and PB, respectively. TT significantly increased PU (β = 0.355, p < 0.001) and reduced PB (β = −0.604, p < 0.001), underscoring its dual role in enhancing positive evaluations and lowering perceived friction. For H7, TT emerged as the strongest direct predictor of IU (β = 0.541, p < 0.001). This finding reaffirms prior studies by Pavlou [34] and Gefen, Karahanna and Straub [50] that highlight the centrality of trust in self-service technology adoption decisions.
Finally, H8 and H9 assessed the influence of motivational appraisals. PU exerted a small but significant positive effect on IU (β = 0.135, p < 0.001), whereas PB had a much stronger negative effect (β = −0.443, p < 0.001). This suggests that reducing barriers is more critical for ensuring sustained usage than enhancing usefulness.
Overall, eight of the nine hypotheses (H1–H3, H5–H9) were supported; H4 was not supported in its direct form due to the opposite sign, although indirect pathways via TT, PU, and PB were positive.
4.4. Multi-Group Structural Equation Modeling (SEM) Analysis
Multi-group SEM analyses were conducted to examine whether the structural relationships varied according to generational cohort and kiosk usage frequency.
Generational Cohort Comparison (Gen Z vs. Non-Gen Z) (Table 8) revealed clear differences in the role of digital readiness (DR; H1–H4). Among Non-Gen Z users, DR exerted significant positive effects on trust in technology (TT; β = 0.338) and perceived usefulness (PU; β = 0.667), and a significant negative effect on perceived barriers (PB; β = −0.411). This indicates that for less digitally native users, digital competence plays a pivotal role in fostering trust, enhancing utility perceptions, and reducing friction. In contrast, for Gen Z, DR had negligible effects on TT (β = 0.044) and PU (β = 0.033), suggesting that baseline trust and utility perceptions are already high, leaving little room for improvement through readiness.
Table 8.
Multi-Group SEM Results by Generational Cohort: Gen Z vs. Non-Gen Z.
Across cohorts, the direct path from DR to IU remained small and negative (Non-Gen Z: β = −0.037; Gen Z: β = −0.038), indicating no support for H4 at the subgroup level.
The effects of TT (H5–H7) also varied. While TT increased PU (Non-Gen Z: β = 0.127; Gen Z: β = 0.635) and reduced PB (Non-Gen Z: β = −0.509; Gen Z: β = −0.706) in both cohorts, the magnitudes were larger for Gen Z, implying that once trust is established, younger users translate it more strongly into positive evaluations and barrier reduction. However, TT had a much stronger direct effect on intention to use (IU) among Non-Gen Z (β = 0.670) than among Gen Z (β = 0.154), indicating that trust serves as a primary motivational driver for older cohorts, whereas for Gen Z, barrier presence or absence is more decisive.
Consistent with H8–H9, PU positively influenced IU in both groups (Non-Gen Z: β = 0.094; Gen Z: β = 0.245), while PB exerted strong negative effects, with a substantially larger impact among Gen Z (Non-Gen Z: β = −0.306; Gen Z: β = −0.684). This highlights younger users’ heightened sensitivity to friction in service interactions.
Usage Frequency Comparison (High vs. Low) (Table 9) produced a similar pattern. Among low-frequency users, DR significantly increased TT (β = 0.335) and PU (β = 0.689), and reduced PB (β = −0.423), indicating that digital competence is crucial for fostering positive perceptions among less experienced users. In contrast, for high-frequency users, DR had no meaningful effect on TT (β = −0.195), PU (β = −0.010), or PB (β = 0.003), suggesting that accumulated experience overrides initial competence.
Table 9.
Multi-Group SEM Results by Kiosk Usage Frequency: High vs. Low.
Similarly, the direct DR → IU path was near zero and negative for both groups (Low: β = −0.033; High: β = −0.020), further indicating non-support for H4 across usage segments.
TT’s effects (H5–H7) were positive in both groups, enhancing PU (Low: β = 0.127; High: β = 0.625) and reducing PB (Low: β = −0.500; High: β = −0.710), with larger magnitudes for high-frequency users. This suggests that experienced users channel trust more directly into efficiency appraisals and friction reduction. However, TT’s direct influence on IU was much stronger for low-frequency users (β = 0.658) than for high-frequency users (β = 0.140), implying that trust formation is essential for novices, while minimizing barriers is more critical for habitual users.
H8–H9 analysis further confirmed that PU positively and PB negatively influenced IU in both groups, with the deterrent effect of PB particularly pronounced among high-frequency users (β = −0.758). This finding suggests that experienced users are more likely to reduce their intention sharply when encountering usability obstacles.
Taken together, both generational cohort and usage frequency function as important moderators in the pathways linking DR, TT, and motivational appraisals to IU. For digital natives and highly experienced users, removing barriers is the primary strategy for fostering adoption, whereas for Non-Gen Z and low-frequency users, building trust is the critical bridge between capability and intention.
Consistent with these patterns, the absence of a positive direct DR → IU effect suggests that DR operates primarily through TT, PU, and PB rather than directly influencing intention.
5. Robustness Check
To verify that the structural equation modeling (SEM) results were not biased by violations of distributional assumptions such as non-normality and heteroskedasticity, the hypothesized model was re-estimated using the robust maximum likelihood estimator (MLR). This method adjusts standard errors and chi-square statistics, enabling more reliable inference under less-than-ideal data conditions.
As shown in the robustness check results (Table 10), the fit indices from the MLR estimation were virtually identical to those from the ML estimation, confirming the stability of overall model fit (CFI = 0.989, TLI = 0.988, RMSEA = 0.041, SRMR = 0.068). All values comfortably exceeded conventional thresholds (CFI/TLI ≥ 0.95, RMSEA ≤ 0.05, SRMR ≤ 0.08), indicating that the model maintained excellent fit even under robust estimation.
Table 10.
Results of Hypothesis Testing Based on the Structural Equation Model (MLR Estimation, n = 750).
Path coefficients also remained stable in both magnitude and significance. Notably, the direct DR → IU path (H4) remained negative and significant under MLR (β = −0.131, p < 0.001), thus failing to support the hypothesized positive direction. In contrast, digital readiness (DR) continued to positively influence trust in technology (TT; H1, β = 0.512), while TT enhanced perceived usefulness (PU; H5, β = 0.355) and reduced perceived barriers (PB; H6, β = −0.604). TT also remained the strongest direct predictor of intention to use (IU; H7, β = 0.541). The negative effect of PB on IU (H9, β = −0.443) again outweighed the positive effect of PU (H8, β = 0.135).
Furthermore, the bootstrap results in Table 11 reaffirmed the robustness of these relationships. All 95% confidence intervals excluded zero, and the effect sizes were consistent with the MLR results. In particular, the DR → IU path was again negative and significant (β = −0.116, 95% CI [−0.16, −0.07]), confirming non-support for H4 due to the opposite sign. The DR → TT path (β = 0.475, 95% CI [0.40, 0.54]) and TT → IU path (β = 0.517, 95% CI [0.43, 0.60]) both exhibited high significance and stability, reinforcing TT as the most influential direct predictor of IU.
Table 11.
Bootstrap Confidence Intervals for Structural Paths (2000 Resamples, n = 750).
In summary, as evidenced in Table 10 and Table 11, the proposed structural relationships are robust to both estimation method and sampling variability. Trust in technology (TT) functions not only as a strong direct determinant of IU but also as a consistent mediator in the DR → TT → IU pathway. Although indirect effects are not reported here, including bootstrapped indirect effects in future drafts would further quantify the mediation mechanism.
6. Conclusions
This study empirically examined how digital readiness (DR), trust in technology (TT), perceived usefulness (PU), and perceived barriers (PB) shape the intention to use kiosks (IU), incorporating multi-group analyses by generational cohort and usage frequency. Beyond simple hypothesis testing, the results provide deeper insights into the mechanisms of kiosk adoption.
First, the analysis confirms that adoption in self-service technology contexts is not driven solely by usefulness, as suggested by the traditional Technology Acceptance Model (TAM) [9,25], but rather by a more complex interplay in which trust and barrier reduction emerge as the most decisive factors. TT exerted both direct and indirect positive effects on IU, while PB consistently demonstrated a stronger negative influence than the positive effect of PU. This finding underscores the importance of reducing friction as a precondition for sustained adoption.
Second, the results reveal the dual role of digital readiness. While DR indirectly fosters adoption by strengthening TT and PU and lowering PB, its direct path to IU was significantly negative. This paradox suggests that high digital proficiency may raise performance expectations, heighten sensitivity to usability issues, and foster preferences for alternative channels or greater autonomy. Accordingly, DR should be conceptualized not as a simple enabler but as a contingent factor with both facilitative and constraining effects.
Third, the multi-group analysis shows that adoption pathways differ across user segments. For non-digital natives and low-frequency users, trust formation is the primary driver, whereas for digital natives and high-frequency users, barrier minimization is more decisive. This highlights the need for tailored adoption strategies that account for generational and experiential diversity rather than relying on uniform approaches.
Taken together, these findings extend TAM by demonstrating the centrality of trust and barriers, validating the context-dependent role of DR, and empirically confirming the segmented nature of kiosk adoption mechanisms. These insights provide both theoretical refinement and practical guidance for developing differentiated strategies.
6.1. Theoretical Implications
Unlike UTAUT2, which extends TAM mainly by adding motivational and social influence factors, this study takes a different direction. It emphasizes negative determinants (PB), redefines digital readiness (DR) as an ambivalent construct, and incorporates segmentation logic. In this way, the model is not just an additional extension but a theoretical redirection that explains SST adoption through friction minimization and contextual variability.
First, by adding trust in technology (TT) and perceived barriers (PB) to TAM, the study moves the focus away from the traditional usefulness-centered view. Instead, it shows that building trust and reducing barriers are critical drivers of behavioral intention. This helps to correct the imbalance in earlier TAM studies that paid too much attention to perceived usefulness (PU) and perceived ease of use (PEU).
Second, the findings redefine digital readiness (DR). Rather than being a simple positive enabler, DR shows a dual role. It strengthens adoption indirectly through TT and PU but can also suppress adoption when expectations or autonomy concerns become too strong. This helps explain why user competence can sometimes encourage adoption but in other cases create resistance.
Third, the study introduces segmentation into TAM by showing that adoption pathways differ across generations and usage frequencies. Non-digital natives and low-frequency users rely more on trust, while digital natives and high-frequency users are influenced more by barrier reduction. This highlights why a one-size-fits-all model is not sufficient and why TAM needs to be adaptive to user segments.
Finally, the results show that PB has a stronger and more stable effect than PU. This asymmetry suggests that reducing friction and barriers may be more effective than increasing usefulness. It calls for rethinking SST adoption from a barrier-sensitive perspective, where inhibitors are seen as central, not secondary.
In summary, this study differentiates itself from earlier TAM extensions by focusing on inhibitors, redefining readiness, and embedding segmentation logic. These contributions refine TAM into a trust-centered, barrier-sensitive, and context-aware framework that better explains SST adoption in today’s diverse digital environments.
6.2. Business Implications
The findings of this study suggest that kiosk adoption strategies must go beyond generic implementation and directly address the asymmetries revealed in our model.
First, the stronger impact of perceived barriers compared to perceived usefulness indicates that firms should shift their managerial focus from promoting benefits to eliminating frictions. Traditional marketing emphasizes “why kiosks are useful,” but our evidence shows that adoption depends more on removing doubts, inconveniences, and risks. This insight calls for a strategic reorientation: reducing friction is not supplementary, it is the core value proposition of self-service technologies, consistent with prior SST research emphasizing the salience of barriers [23].
Second, the dual role of digital readiness challenges a common managerial assumption. Highly skilled digital users are not necessarily easy adopters. Instead, they are the most demanding customers, quick to abandon kiosks when performance is suboptimal. For managers, this implies that sustaining adoption among digital natives requires investments in reliability, autonomy-respecting design, and multi-channel flexibility. This aligns with prior findings that technologically ready users often hold elevated expectations [38].
Third, industry contexts reveal distinct managerial priorities. In hospitality, adoption hinges on reducing psychological barriers through multilingual support and visible assistance, particularly for international tourists. In healthcare, kiosk use will fail unless trust is actively cultivated through strict privacy safeguards and transparent data practices. In transportation, speed and error-free performance are not operational add-ons but the decisive conditions for adoption in high-volume environments. In retail and food service contexts, streamlined ordering processes and seamless payment integration can further strengthen adoption.
Finally, our results emphasize that adoption strategies must be temporally staged. Initial adoption requires trust-building and onboarding; sustained usage requires continuous reliability; and long-term loyalty requires personalization and predictive maintenance. Misallocating resources across these stages—for example, overspending on long-term personalization before establishing trust—may undermine adoption.
By reframing adoption as a process where friction minimization outweighs utility maximization and by identifying the dual role of user readiness, this study provides actionable guidance that challenges prevailing managerial assumptions. These insights equip service providers to design not just functional kiosks, but adoption ecosystems aligned with diverse user segments and industry contexts [20].
6.3. Limitations and Future Research
This study has several limitations, and each of them suggests avenues for further research.
Research design limitations. Because the study used a cross-sectional design, it cannot establish causal relationships. In addition, the use of a non-probability sampling method restricts generalizability. These methodological choices were reasonable for capturing a snapshot of kiosk adoption among active users, but they do not allow for the observation of long-term changes or resistance at the early stages of adoption. Future studies should therefore employ longitudinal or experimental designs to examine how trust, perceived barriers, and adoption behaviors evolve over time.
Sample-specific limitations. The analysis was based exclusively on current kiosk users. This design made it possible to investigate adoption mechanisms grounded in actual experience, yet it also meant that non-users and digitally excluded populations were not represented. As a result, important early-stage barriers such as technophobia, distrust of automation, or digital inequality were not fully captured. Because the study relied on active users and a non-probabilistic method, the findings should be generalized with caution. Even so, by focusing on experienced users, this study provides a benchmark for understanding the mechanisms that operate after direct interaction, which can complement future research on first-time adoption.
Segmentation limitations. Respondents were segmented by generational cohort and usage frequency, both of which are meaningful dimensions for digital proficiency and exposure. Other demographic factors, such as gender, occupation, or city tier, may also influence adoption pathways. Future research could explore these additional dimensions through latent class analysis, machine learning approaches, or mixed-method designs in order to build more refined user profiles. Such methods would allow for a more integrated view of psychological traits, trust orientations, and technology experience. Acknowledging this limitation points to concrete directions for advancing both methodology and theory.
Contextual limitations. The research was conducted in China, which is characterized by advanced digital infrastructure and widespread kiosk penetration. This makes China a highly suitable setting for studying kiosk adoption, but it also restricts the ability to generalize the findings to markets with lower levels of digital maturity. Nevertheless, prior Western SST adoption studies have confirmed universal mechanisms such as trust, barriers, and technology-related anxiety [23,27,56]. These parallels suggest that the processes identified in this study are not uniquely Chinese but share common ground with global patterns, thereby enhancing the cross-cultural relevance of our findings. At the same time, this study contributes beyond earlier work by revealing the dual role of digital readiness and by demonstrating that adoption pathways differ across generational and usage-frequency segments—insights that open new avenues for theory building and comparative research.
Theoretical opportunities. The findings challenge the traditional assumption in TAM that effects are linear and consistently positive. The suppression effect of digital readiness and the stronger influence of perceived barriers relative to perceived usefulness suggest that future extensions of TAM should take nonlinear and context-dependent dynamics into account. Future research should also examine affective responses such as frustration, anxiety, or confidence as possible mediating or moderating factors [57]. These dynamics are likely to become even more important in AI-augmented or autonomous SST environments.
By organizing the limitations thematically and reflecting on their implications, this study not only clarifies its boundaries but also positions itself as both an empirical and theoretical benchmark for future research across different user groups and market contexts.
Author Contributions
Conceptualization, J.Y.J. and J.M.K.; methodology, J.Y.J.; software, J.Y.J.; validation, J.Y.J., R.K.M. and J.M.K.; formal analysis, J.Y.J.; investigation, J.Y.J.; resources, J.Y.J.; data curation, J.Y.J. and R.K.M.; writing—original draft preparation, J.Y.J. and J.M.K.; writing—review and editing, R.K.M.; visualization, J.Y.J.; supervision, J.Y.J.; project administration, J.Y.J.; funding acquisition, J.M.K. All authors have read and agreed to the published version of the manuscript.
Funding
This research received no external funding.
Institutional Review Board Statement
The study was conducted in accordance with the Declaration of Helsinki, and approved by the Wenzhou-Kean University Ethics Committee (protocol code WKUIRB2025-135 on 30 April 2025).
Informed Consent Statement
Informed consent was obtained from all subjects involved in the study.
Data Availability Statement
The data gathered and used in this study is available upon reasonable request to the corresponding author.
Conflicts of Interest
The authors declare no conflicts of interest.
References
- Blut, M.; Wang, C.; Schoefer, K. Factors influencing the acceptance of self-service technologies: A meta-analysis. J. Serv. Res. 2016, 19, 396–416. [Google Scholar] [CrossRef]
- Ha, J.-H.; Kim, S.-I. A study on the increase of kiosk user experience in Non-face-to-face Era for the Elderly-Focused on the McDonald Kiosk. J. Digit. Converg. 2021, 19, 285–292. [Google Scholar] [CrossRef]
- Baba, N.; Hanafiah, M.H.; Mohd Shahril, A.; Zulkifly, M.I. Investigating customer acceptance, usage, trust, and perceived safety risk of self-ordering kiosk technology in Malaysian quick-service restaurants during COVID-19 pandemic. J. Hosp. Tour. Technol. 2023, 14, 309–329. [Google Scholar] [CrossRef]
- Kim, J.-K.; Yang, J.-J.; Lee, Y.-K. How do self-service kiosks improve covid-19 pandemic resilience in the restaurant industry? Sustainability 2023, 15, 10168. [Google Scholar] [CrossRef]
- Wongyai, P.H.; Suwannawong, K.; Wannakul, P.; Thepchalerm, T.; Arreeras, T. The adoption of self-service check-in kiosks among commercial airline passengers. Heliyon 2024, 10, e38676. [Google Scholar] [CrossRef]
- John, J.; Thakur, R. Long term effects of service adaptations made under pandemic conditions: The new “post COVID-19” normal. Eur. J. Mark. 2021, 55, 1679–1700. [Google Scholar] [CrossRef]
- Cheng, X.; Xue, T.; Yang, B.; Ma, B. A digital transformation approach in hospitality and tourism research. Int. J. Contemp. Hosp. Manag. 2023, 35, 2944–2967. [Google Scholar] [CrossRef]
- Amiri, F.; Shishan, F.; Bazi, S.; Nimri, R.; Obeidat, Z. Examining customers’ continuous intention to use self-service kiosks: An extended approach in the context of fast food restaurants using the technology readiness index and technology acceptance model. Tour. Hosp. Res. 2025 2025, 25, 3–20. [Google Scholar] [CrossRef]
- Davis, F.D. Perceived usefulness, perceived ease of use, and user acceptance of information technology. MIS Q. 1989, 13, 319–340. [Google Scholar] [CrossRef]
- Lee, H.-J.; Yang, K. Interpersonal service quality, self-service technology (SST) service quality, and retail patronage. J. Retail. Consum. Serv. 2013, 20, 51–57. [Google Scholar] [CrossRef]
- Lin, J.-S.C.; Hsieh, P.-L. The influence of technology readiness on satisfaction and behavioral intentions toward self-service technologies. Comput. Hum. Behav. 2007, 23, 1597–1615. [Google Scholar] [CrossRef]
- Weijters, B.; Rangarajan, D.; Falk, T.; Schillewaert, N. Determinants and outcomes of customers’ use of self-service technology in a retail setting. J. Serv. Res. 2007, 10, 3–21. [Google Scholar] [CrossRef]
- Peng, M.Y.-P.; Yan, X. Exploring the influence of determinants on behavior intention to use of multiple media kiosks through technology readiness and acceptance model. Front. Psychol. 2022, 13, 852394. [Google Scholar] [CrossRef]
- Le, N.; Mai, N.; Ngo, N.; Dang, H. The moderating role of trust in the adoption of self-service payment systems by consumers. J. Organ. Technol. Entrep. 2024, 2, 65–83. [Google Scholar] [CrossRef]
- Mayer, R.C.; Davis, J.H.; Schoorman, F.D. An integrative model of organizational trust. Acad. Manag. Rev. 1995, 20, 709–734. [Google Scholar] [CrossRef]
- Linh, T.T.; Huyen, N.T.T. An extension of Trust and TAM model with TPB in the adoption of digital payment: An empirical study in Vietnam. F1000Research 2025, 14, 127. [Google Scholar] [CrossRef] [PubMed]
- Kandasamy, J.; Venkat, V.; Mani, R.S. Barriers to the adoption of digital technologies in a functional circular economy network. Oper. Manag. Res. 2023, 16, 1541–1561. [Google Scholar] [CrossRef]
- Collier, J.E.; Kimes, S.E. Only if it is convenient: Understanding how convenience influences self-service technology evaluation. J. Serv. Res. 2013, 16, 39–51. [Google Scholar] [CrossRef]
- Wang, C.; Harris, J.; Patterson, P.G. Customer choice of self-service technology: The roles of situational influences and past experience. J. Serv. Manag. 2012, 23, 54–78. [Google Scholar] [CrossRef]
- Prensky, M. Digital natives, digital immigrants part 2: Do they really think differently? Horizon 2001, 9, 1–6. [Google Scholar] [CrossRef]
- Zhao, C.; Zhao, L. Digital nativity, computer self-efficacy, and technology adoption: A study among university faculties in China. Front. Psychol. 2021, 12, 746292. [Google Scholar] [CrossRef]
- Na, T.-K.; Lee, S.-H.; Yang, J.-Y. Moderating effect of gender on the relationship between technology readiness index and consumers’ continuous use intention of self-service restaurant kiosks. Information 2021, 12, 280. [Google Scholar] [CrossRef]
- Meuter, M.L.; Ostrom, A.L.; Roundtree, R.I.; Bitner, M.J. Self-service technologies: Understanding customer satisfaction with technology-based service encounters. J. Mark. 2000, 64, 50–64. [Google Scholar] [CrossRef]
- Venkatesh, V.; Davis, F.D. A theoretical extension of the technology acceptance model: Four longitudinal field studies. Manag. Sci. 2000, 46, 186–204. [Google Scholar] [CrossRef]
- Venkatesh, V.; Morris, M.G.; Davis, G.B.; Davis, F.D. User acceptance of information technology: Toward a unified view. MIS Q. 2003, 27, 425–478. [Google Scholar] [CrossRef]
- Venkatesh, V.; Thong, J.Y.; Xu, X. Consumer acceptance and use of information technology: Extending the unified theory of acceptance and use of technology. MIS Q. 2012, 36, 157–178. [Google Scholar] [CrossRef]
- Dabholkar, P.A.; Bagozzi, R.P. An attitudinal model of technology-based self-service: Moderating effects of consumer traits and situational factors. J. Acad. Mark. Sci. 2002, 30, 184–201. [Google Scholar] [CrossRef]
- Meuter, M.L.; Ostrom, A.L.; Bitner, M.J.; Roundtree, R. The influence of technology anxiety on consumer use and experiences with self-service technologies. J. Bus. Res. 2003, 56, 899–906. [Google Scholar] [CrossRef]
- Curran, J.M.; Meuter, M.L. Self-service technology adoption: Comparing three technologies. J. Serv. Mark. 2005, 19, 103–113. [Google Scholar] [CrossRef]
- Wang, X.; Wong, Y.D.; Sun, S.; Yuen, K.F. An investigation of self-service technology usage during the COVID-19 pandemic: The changing perceptions of ‘self’and technologies. Technol. Soc. 2022, 70, 102032. [Google Scholar] [CrossRef]
- Lao, A.; Vlad, M.; Martin, A. Exploring how digital kiosk customer experience enhances shopping value, self-mental imagery and behavioral responses. Int. J. Retail Distrib. Manag. 2021, 49, 817–845. [Google Scholar] [CrossRef]
- Moon, J.; Shim, J.; Lee, W.S. Antecedents and consequences of the ease of use and usefulness of fast food kiosks using the technology acceptance model. Systems 2022, 10, 129. [Google Scholar] [CrossRef]
- Gefen, D. E-commerce: The role of familiarity and trust. Omega 2000, 28, 725–737. [Google Scholar] [CrossRef]
- Pavlou, P.A. Consumer acceptance of electronic commerce: Integrating trust and risk with the technology acceptance model. Int. J. Electron. Commer. 2003, 7, 101–134. [Google Scholar] [CrossRef]
- Wu, J.-H.; Wang, S.-C. What drives mobile commerce?: An empirical evaluation of the revised technology acceptance model. Inf. Manag. 2005, 42, 719–729. [Google Scholar] [CrossRef]
- Benbasat, I.; Wang, W. Trust in and adoption of online recommendation agents. J. Assoc. Inf. Syst. 2005, 6, 4. [Google Scholar] [CrossRef]
- Chen, X.; Chang-Richards, A.; Ling, F.Y.Y.; Yiu, K.T.W.; Pelosi, A.; Yang, N. Effects of digital readiness on digital competence of AEC companies: A dual-stage PLS-SEM-ANN analysis. Build. Res. Inf. 2024, 52, 905–922. [Google Scholar] [CrossRef]
- Parasuraman, A.; Colby, C.L. An updated and streamlined technology readiness index: TRI 2.0. J. Serv. Res. 2015, 18, 59–74. [Google Scholar] [CrossRef]
- Emery, F.E.; Trist, E.L. The causal texture of organizational environments. Hum. Relat. 1965, 18, 21–32. [Google Scholar] [CrossRef]
- Musyaffi, A.M.; Mulyani, S.; Suraida, I.; Sukmadilaga, C. Lack of readiness of digital banking channel acceptance: Study on TAM 3 and technology readiness. Acad. Strateg. Manag. J. 2021, 20, 1–18. [Google Scholar]
- Revythi, A.; Tselios, N. Extension of technology acceptance model by using system usability scale to assess behavioral intention to use e-learning. Educ. Inf. Technol. 2019, 24, 2341–2355. [Google Scholar] [CrossRef]
- Fanani, M.F.; Yuhana, U.L.; Shiddiqi, A.M. Development of a Model to Evaluate Users’ technology Readiness and Acceptance in Using the Self-Check-In Kiosk Service at Soekarno-Hatta International Airport. JUTI J. Ilm. Teknol. Inf. 2024, 22, 125–139. [Google Scholar] [CrossRef]
- Höyng, M.; Lau, A. Being ready for digital transformation: How to enhance employees’ intentional digital readiness. Comput. Hum. Behav. Rep. 2023, 11, 100314. [Google Scholar] [CrossRef]
- Al-Adwan, A.S.; Li, N.; Al-Adwan, A.; Abbasi, G.A.; Albelbisi, N.A.; Habibi, A. Extending the technology acceptance model (TAM) to Predict University Students’ intentions to use metaverse-based learning platforms. Educ. Inf. Technol. 2023, 28, 15381–15413. [Google Scholar] [CrossRef]
- AlDreabi, H.; Halalsheh, N.; Alrawashdeh, M.N.; Alnajdawi, A.M.; Alsawalqa, R.O.; Al-Shboul, M. Sustainable digital communication using perceived enjoyment with a technology acceptance model within higher education, in Jordan. Front. Educ. 2023, 8, 1226718. [Google Scholar] [CrossRef]
- Haudi, H.; Handayani, W.; Musnaini, M.; Suyoto, Y.T.; Prasetio, T. The effect of social media marketing on brand trust, brand equity and brand loyalty. Int. J. Data Netw. Sci. 2022, 6, 961–972. [Google Scholar] [CrossRef]
- Mcknight, D.H.; Carter, M.; Thatcher, J.B.; Clay, P.F. Trust in a specific technology: An investigation of its components and measures. ACM Trans. Manag. Inf. Syst. (TMIS) 2011, 2, 1–25. [Google Scholar] [CrossRef]
- Lee, J.D.; See, K.A. Trust in automation: Designing for appropriate reliance. Hum. Factors 2004, 46, 50–80. [Google Scholar] [CrossRef]
- Ibrahim, F.; Münscher, J.-C.; Daseking, M.; Telle, N.-T. The technology acceptance model and adopter type analysis in the context of artificial intelligence. Front. Artif. Intell. 2025, 7, 1496518. [Google Scholar] [CrossRef]
- Gefen, D.; Karahanna, E.; Straub, D.W. Trust and TAM in online shopping: An integrated model. MIS Q. 2003, 27, 51–90. [Google Scholar] [CrossRef]
- Chiu, C.-M.; Hsu, M.-H.; Sun, S.-Y.; Lin, T.-C.; Sun, P.-C. Usability, quality, value and e-learning continuance decisions. Comput. Educ. 2005, 45, 399–416. [Google Scholar] [CrossRef]
- Compeau, D.R.; Higgins, C.A. Computer self-efficacy: Development of a measure and initial test. MIS Q. 1995, 19, 189–211. [Google Scholar] [CrossRef]
- Bandura, A. Social Foundations of Thought and Action; Prentice-Hall: Hoboken, NJ, USA, 1986; Volume 1986, p. 2. [Google Scholar]
- Fishbein, M.; Ajzen, I. Beliefs, Attitude, Intention, and Behavior: An Introduction to Theory and Research; Addison-Wesley: Boston, MA, USA, 1975. [Google Scholar]
- Petty, R.E.; Cacioppo, J.T. Communication and Persuasion Central and Peripheral Routes to Attitude Change; Springer: New York, NY, USA, 1986. [Google Scholar] [CrossRef]
- Hilton, T.; Hughes, T.; Little, E.; Marandi, E. Adopting self-service technology to do more with less. J. Serv. Mark. 2013, 27, 3–12. [Google Scholar] [CrossRef]
- Hassenzahl, M. The interplay of beauty, goodness, and usability in interactive products. Hum. Comput. Interact. 2004, 19, 319–349. [Google Scholar] [CrossRef]
Disclaimer/Publisher’s Note: The statements, opinions and data contained in all publications are solely those of the individual author(s) and contributor(s) and not of MDPI and/or the editor(s). MDPI and/or the editor(s) disclaim responsibility for any injury to people or property resulting from any ideas, methods, instructions or products referred to in the content. |
© 2025 by the authors. Licensee MDPI, Basel, Switzerland. This article is an open access article distributed under the terms and conditions of the Creative Commons Attribution (CC BY) license (https://creativecommons.org/licenses/by/4.0/).