Article

Spatial Heterogeneity of Intra-Urban E-Commerce Demand and Its Retail-Delivery Interactions: Evidence from Waybill Big Data

School of Architecture and Urban Planning, Guangdong University of Technology, Guangzhou 510090, China
*
Author to whom correspondence should be addressed.
These authors contributed equally to this work.
J. Theor. Appl. Electron. Commer. Res. 2025, 20(3), 190; https://doi.org/10.3390/jtaer20030190 (registering DOI)
Submission received: 29 May 2025 / Revised: 20 July 2025 / Accepted: 25 July 2025 / Published: 1 August 2025
(This article belongs to the Topic Data Science and Intelligent Management)

Abstract

E-commerce growth has reshaped consumer behavior and retail services, driving parcel demand and challenging last-mile logistics. Existing research predominantly relies on survey data and global regression models that overlook intra-urban spatial heterogeneity in shopping behaviors. This study bridges this gap by analyzing e-commerce demand’s spatial distribution from a retail service perspective, identifying key drivers, and evaluating implications for omnichannel strategies and logistics. Utilizing waybill big data, spatial analysis, and multiscale geographically weighted regression, we reveal: (1) High-density e-commerce demand areas are predominantly located in central districts, whereas peripheral regions exhibit statistically lower volumes. The spatial distribution pattern of e-commerce demand aligns with the urban development spatial structure. (2) Factors such as population density and education levels significantly influence e-commerce demand. (3) Convenience stores play a dual role as retail service providers and parcel collection points, reinforcing their importance in shaping consumer accessibility and service efficiency, particularly in underserved urban areas. (4) Supermarkets exert a substitution effect on online shopping by offering immediate product availability, highlighting their role in shaping consumer purchasing preferences and retail service strategies. These findings contribute to retail and consumer services research by demonstrating how spatial e-commerce demand patterns reflect consumer shopping preferences, the role of omnichannel retail strategies, and the competitive dynamics between e-commerce and physical retail formats.

1. Introduction

The exponential growth of online shopping has significantly propelled global e-commerce demand [1]. According to Ti Insight’s Global Express & Small Parcels 2024 report, the market size is projected to grow from EUR 565.9 billion in 2024 to EUR 736.6 billion in 2028 [2]. China, the world’s largest parcel market, accounted for one-third of the global parcel volume in 2023, with an average of 94 parcels per capita annually [3], and this figure continues to rise. However, this rapid expansion has simultaneously highlighted and exacerbated the vulnerabilities within urban logistics networks [4,5,6]. The disparity in delivery efficiency between central urban areas and suburbs [7,8] becomes particularly pronounced during peak shopping periods [9]. Retailers face numerous systemic challenges, including sharply escalating delivery costs and the persistent difficulty of ensuring timely deliveries to peripheral urban areas [10]. This spatial inequality in delivery service accessibility is increasingly emerging as a critical bottleneck constraining the inclusivity and sustainability of e-commerce.
Addressing these challenges necessitates a thorough understanding of the interdependencies among online shopping, e-commerce operations, and parcel delivery. These elements form a tightly coupled feedback loop: online shopping demand drives the functioning of e-commerce systems [11], which in turn generates parcel delivery demand [12]. Conversely, the efficiency and accessibility of delivery services influence consumers’ online shopping intentions and behaviors. Within this loop, parcel delivery volume serves as a robust proxy indicator for e-commerce demand [13]. Specifically, the number of parcels delivered reflects the intensity of online shopping activity, as each online transaction typically necessitates a physical delivery. Consequently, waybill data can effectively capture the spatial distribution patterns of e-commerce demand, providing a detailed and objective measure of consumer behavior’s spatial manifestations. Nevertheless, traditional research methods, such as questionnaires and linear regression models, often struggle to adequately capture the inherent spatial heterogeneity of e-commerce demand [14,15,16]. Although recent studies have begun leveraging waybill data and incorporating spatial econometric methods (e.g., Moran’s I index [17] and the Spatial Durbin Model [18]), they still fall short in revealing the spatial non-stationarity of key influencing factors—that is, the phenomenon where the magnitude and nature of their effects vary geographically.
In practice, both e-commerce demand and the spatial provision of supporting facilities within cities exhibit pronounced heterogeneity; however, existing theoretical analyses have yet to adopt methods that explicitly capture this spatial non-stationarity. This disjuncture impedes the alignment between supply-side capabilities and demand-side requirements, posing a critical challenge for cities seeking to formulate differentiated and place-based planning policies. To bridge this gap, this study utilizes waybill big data from the 2023 Singles’ Day (November 11) shopping festival to accurately map the spatial distribution of e-commerce demand and rigorously examine the geospatial heterogeneity of its underlying drivers. By doing so, this research aims to deepen the understanding of the spatial patterns and mechanisms governing e-commerce demand and provide robust empirical support for developing tailored, place-based logistics infrastructure planning policies capable of effectively meeting diverse regional needs. The remainder of this paper is structured as follows. Section 2 reviews the relevant literature. Section 3 outlines the study area, methodology, and data sources. Section 4 presents and discusses the modeling results. Finally, Section 5 concludes the study.

2. Literature Review

A deep understanding of the spatial heterogeneity of e-commerce demand is crucial for effectively addressing the interconnected challenges of online shopping, e-commerce operations, and parcel delivery services. Current research on e-commerce demand primarily unfolds along two distinct paths: the first path focuses on using questionnaire surveys to directly investigate online shopping demand itself; the second path employs waybill data to indirectly infer delivery demand through reverse reconstruction. However, both approaches face methodological limitations in capturing spatial heterogeneity. Table 1 summarizes the research perspectives, data sources, and analytical methods of relevant studies.
Early research focusing on online shopping demand typically employed questionnaire data, adopting an individual behavioral perspective to directly capture the drivers of online purchasing decisions through consumer self-reports. These studies primarily applied traditional statistical models, such as linear regression [14] and logistic regression [26,27,28], to analyze socio-economic factors (e.g., gender, age, income, education level) and spatial-contextual factors (e.g., distance to logistics points, in-store shopping experience, accessibility of offline facilities) influencing online shopping demand. Representative works include Farag et al. (2006) applying Ordinary Least Squares (OLS) to Dutch survey data [20]; Rotem-Mindali (2010) using an ordinal logit model with face-to-face survey data from the Tel Aviv metropolitan area [21]; and Beckers et al. (2018) constructing a logistic regression model based on questionnaire data from Comeos, the Belgian retail federation [22]. To explore more complex causal networks among variables, some scholars introduced Structural Equation Modeling (SEM) [23]. For instance, Etminani-Ghasrodashti and Hamidi (2020) integrated household survey data from the Shiraz metropolitan area in Iran, building a causal network model incorporating up to 18 socio-economic and spatial-contextual variables [29]. Additionally, Shao et al. (2022) attempted to combine comprehensive indices constructed by e-commerce platforms and used a Spatial Lag of Error model to explore the influence of virtual and real accessibility [19].
In contrast, research based on waybill data starts from the operational logistics outcomes, reverse-engineering demand characteristics by analyzing actual delivery occurrences. This provides a more objective, inverse proxy measure for gauging e-commerce demand. Studies along this path have utilized diverse analytical methods to investigate the drivers of e-commerce demand: Oliveira et al. (2025) applied Moran’s I and bivariate Moran’s I to examine spatial autocorrelation in waybill data from Belo Horizonte [17]; de Sousa et al. (2023) employed negative binomial regression on the same dataset [16]; Cheng et al. (2021) applied linear regression models to waybill data [15]; and Shin et al. (2023) utilized a spatial error model for their analysis [18]. Compared to questionnaire-based studies, this line of research places greater emphasis on the integrated analysis of socio-economic factors (e.g., income, population density, education level, household size, GDP) and spatial-contextual factors (e.g., commercial density, retail density, public transport coverage, land-use types, building age).
In summary, while both data sources offer valuable and complementary analytical perspectives, and their methodological approaches differ, they share a fundamental limitation: insufficient characterization of spatial heterogeneity. Traditional regression models, such as linear regression and negative binomial regression, assume global linear relationships between variables, making them ill-equipped to explain the significant spatial variation in the effects of influencing factors across different geographical regions. Although spatial econometric models, such as the spatial error model or spatial Durbin model, can effectively quantify spatial dependence, they still struggle to capture the spatial non-stationarity inherent in key explanatory variables—namely, the phenomenon where the intensity and mode of these factors’ impact on e-commerce demand dynamically change according to geographic location.

3. Materials and Methods
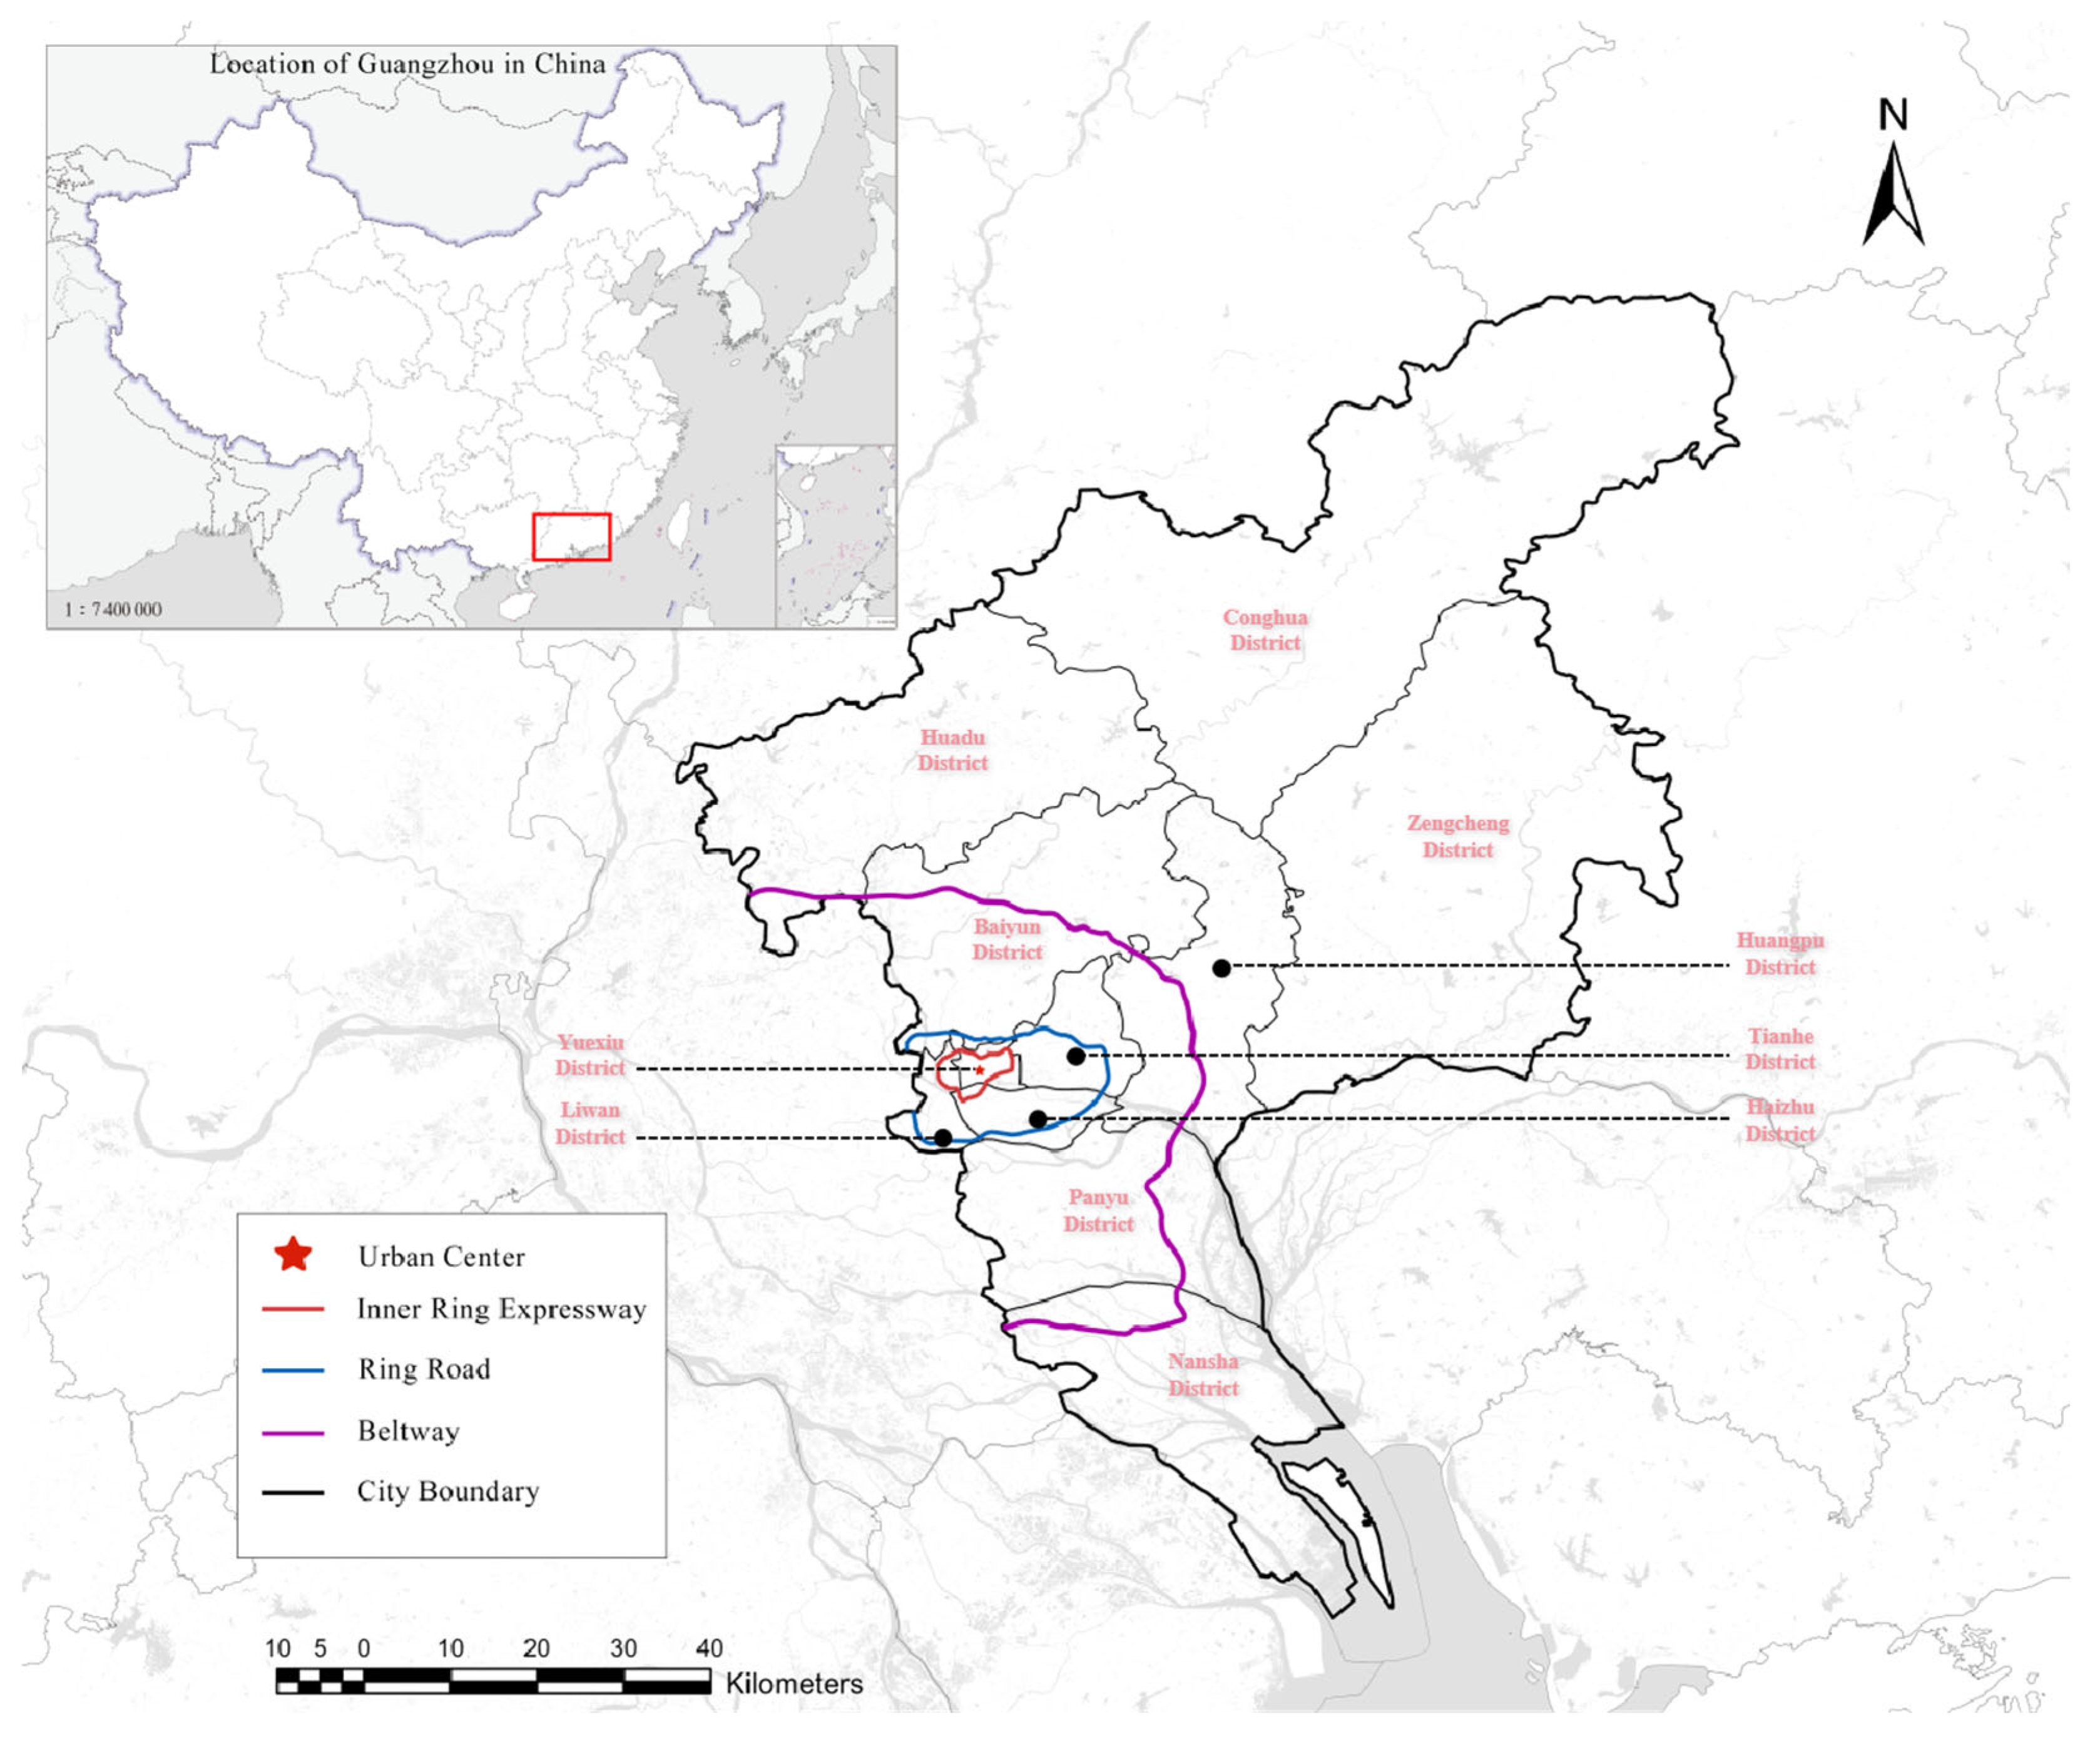
3.1. Study Area

Guangzhou is an ideal location for studying e-commerce demand for several reasons. As a major metropolis in Southern China, it boasts a robust and diversified economy, and it covers approximately 7434 square kilometers. This area is organized into three circles: the Inner Ring Expressway, the Ring Road, and the Beltway. According to the Seventh National Census [30], Guangzhou had a resident population of 18.67 million. This makes it one of the most populous and economically significant cities in China, which in turn influences e-commerce demand patterns. Its strategic position in the Pearl River Delta—a hub of economic activity in China—also increases its importance. Guangzhou serves as a crucial node in both national and international trade networks, having excellent land, sea, and air connectivity, and it is well positioned near to Hong Kong and Macau (see Figure 1).
The logistics industry in Guangzhou is undergoing a period of rapid growth, and the city currently leads the nation in terms of express-delivery business. In 2021, the express business volume in Guangzhou reached 10.6 billion items, making it the first city in China to exceed this milestone [31]. This achievement underscores Guangzhou’s pivotal role in the domestic express market. The city is home to the headquarters of several major express-delivery companies, including SF Express and YTO Express, which have extensive national operations. Additionally, Guangzhou features a well-developed express-delivery network and infrastructure, including numerous large logistics parks and distribution centers. Collectively, these assets provide a strong foundation for efficient and reliable express-delivery services.
In terms of industrial development, Guangzhou is renowned for its numerous “Taobao villages” and thriving wholesale markets. Taobao village refers to a village where the number of active online stores within the administrative village reaches more than 10% of the number of local households, or the annual transaction volume of e-commerce reaches more than 10 million yuan. These extensive commercial activities have significantly boosted the city’s express-delivery industry. A recent study noted that Guangzhou was home to 273 Taobao villages in 2021 [31]; these conduct large-scale merchandising through e-commerce platforms, with Dayuan Village alone handling an average of over 3 million express parcels every day. Additionally, Guangzhou’s wholesale industry is highly developed, as indicated by the presence of landmarks such as the Guangzhou International Commodity Exhibition Center and the Baiyun International Conference Center, as well as numerous professional markets offering a wide range of commodities to merchants nationwide. In 2020, the turnover of commodity trading markets in Guangzhou reached approximately 200 billion yuan, with individual market segments exceeding 100 million yuan. The city is highly regarded both domestically and internationally for its wholesale markets, which specialize in garments, electronics, and small commodities, attracting large numbers of buyers each year [32].
Guangzhou’s unique attributes make it an ideal location for studying e-commerce demand. The city’s vibrant economic environment, strategic geographic location, and advanced transportation and logistics infrastructure provide a compelling context for examining the spatial characteristics of parcel distribution.

3.2. Data Resources

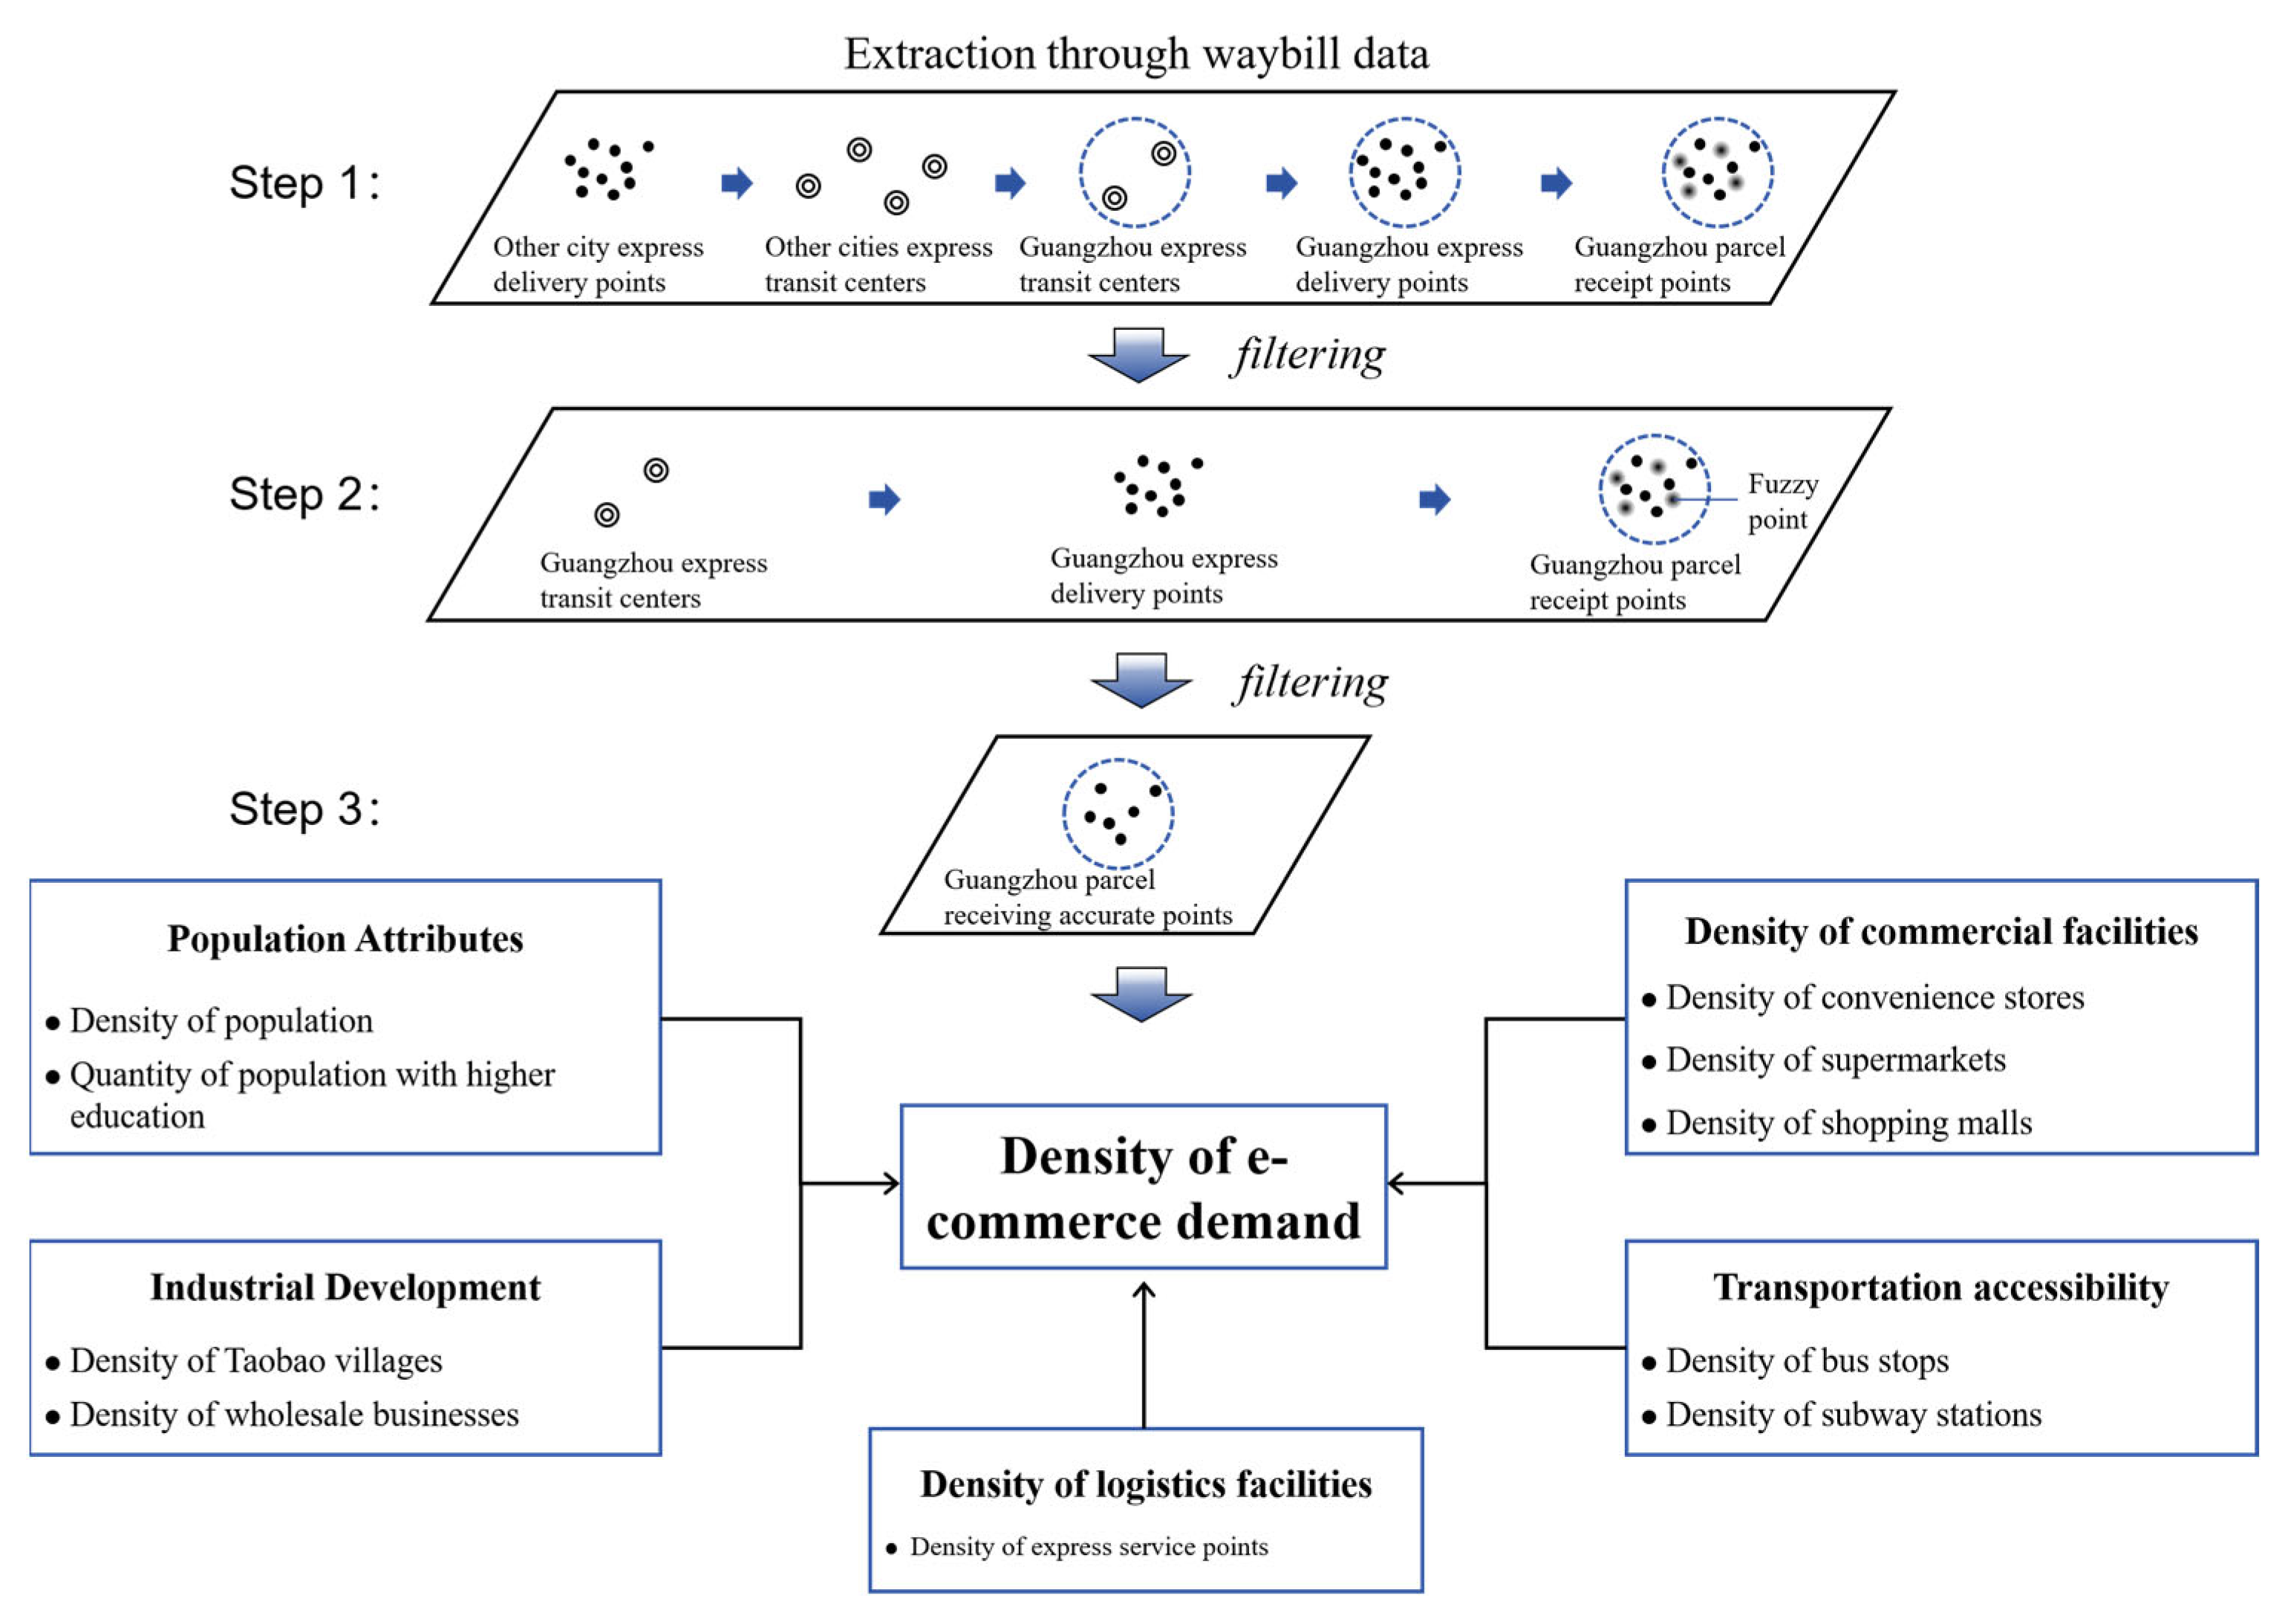
3.2.1. Data Sources for E-Commerce Demand

In this study, e-commerce demand is operationalized as the spatial density of parcel deliveries received at the sub-district level, as recorded in express waybill data during the 2023 Singles’ Day shopping festival. This metric serves as a proxy for aggregate online shopping activity, encompassing both individual consumer purchases and small-scale business transactions, but excluding bulk B2B logistics such as wholesale freight. Each parcel record corresponds to a single e-commerce transaction, regardless of the buyer type (consumer or micro-enterprise), thus reflecting total e-commerce-driven demand within a given spatial unit.
National express waybill data for this study were collected using the kuaidi100.com API to retrieve batch data, which was then processed using Python 3.11. The process entailed generating a batch of relevant waybill numbers based on express waybill-numbering regulations; the API was then called to retrieve tracking data using these numbers. Effective and authentic order numbers were filtered, and the obtained tracking data was then parsed to extract key information, including shipping locations, route points, receiving places, and timestamps.
The data sample of this study is focused on ZTO Express, which is a leading enterprise in the Chinese express delivery market with the highest market share (25%). As shown in Table 2, the example includes the waybill number, date, time, and process of the package (where it was transported, in the state of collection, transfer, and receipt): The package was collected from Wanjiang, Guangzhou on 11 November 2023, and then transferred to the Guangzhou Transfer Center on the same day. It was then delivered to the Guangzhou Tonghe Express Point on 12 November 2023, and finally received at the Guangzhou Baiyun Dabi West Road Branch of Express Supermarket. The dataset included 3,342,444 records of ZTO Express waybill data from the Double 11 shopping event. Given that ZTO Express handled 145 million parcels on that day, this sample constitutes approximately 2.3% of the total volume, meaning it has the potential to provide statistically significant insights. For specific analysis of Guangzhou, 104,577 data points with Guangzhou as the receipt point were extracted. After excluding data with incomplete or unclear delivery details, 42,107 valid observations remained. This refined dataset was used for visualization and further analysis, as detailed in Table 2 and illustrated in Figure 2.

3.2.2. Multi-Source Data Integration

The fundamental unit of analysis in this work was the sub-district or town, corresponding to the Chinese administrative terms “township” and “town.” The selection of these observation units is critical because it directly impacts model outcomes. Larger units may fail to capture spatial heterogeneities, whereas very small units, despite their potential to enhance precision, can complicate data integration across diverse sources. By focusing on sub-districts or towns, which represent the smallest administrative units for socioeconomic indicators, this study achieves a balance between granular spatial analysis and practical data collection. Therefore, the analysis covered 176 sub-districts or towns in Guangzhou.
To gain a comprehensive understanding of the subject matter, a multi-source data collection approach was used in this study. Initially, detailed population-attribute data for each sub-district or township were obtained from publicly available records from the seventh population census of Guangzhou. This dataset included information on population size and education levels. Next, spatial-location data for Taobao villages in Guangzhou were acquired from the Ali Research Institute. Additionally, enterprise registration data were sourced from the industry and commerce department; this provided key details such as the names of enterprises, along with their business scope, registration dates, and addresses. The business-scope data highlighted the wholesale industry as a significant area of interest. Furthermore, geographical coordinates for all bus stops, subway stations, express service points, convenience stores, supermarkets, and shopping malls in Guangzhou were collected using point-of-interest data from the Amap open platform. To account for variations in the size of areas between streets, a density measure was employed to represent the distribution intensity of each variable within the research units. Descriptive statistics for the variables are summarized in Table 3.

3.3. Methodology

This study utilizes waybill data to estimate e-commerce demand, facilitating a comprehensive comparison of global and local regression models. Parcel delivery volumes, operationalizing as a proxy for e-commerce demand, were analyzed as the dependent variable to capture spatially granular consumption behaviors. Explanatory variables were systematically categorized into factors related to population attributes, industrial development, the density of commercial facilities, transportation convenience, and the density of logistics facilities. The detailed conceptual framework for these variables is shown in Figure 2.

3.3.1. Kernel Density Estimation

Kernel density estimation (KDE) is a widely used method for visualizing and analyzing spatial point distributions. They are applicable in various fields, including historical geography, crime analysis, public health, and transportation planning, among other topics within spatial humanities studies. Heatmaps use a gradient of warm and cool colors to illustrate the density distribution trends of point data, effectively minimizing overlap and highlighting areas of higher concentration. KDE is a classical spatial statistical method that generates heatmaps by applying a kernel function and attenuation effects to capture spatial point patterns, in accordance with Tobler’s First Law of Geography [33]. In this study, KDE was employed to identify spatial heterogeneities in e-commerce demand. The general form of the KDE model is as follows:
f n ( x ) = 1 n h i = 1 n k x x i h
where k is the weight function of the kernel; h is the bandwidth, i.e., the width of the surface extended in space with x as the origin, which affects the smoothness of the graph; and xxi is the distance between the density-valuation point x and xi.

3.3.2. Global Regression Modeling

In traditional regression approaches such as ordinary least square (OLS) regression, it is assumed that the relationship between independent and dependent variables remains consistent across the study area. In this study, population attributes, industrial development, the density of commercial facilities, transportation convenience, and the density of logistics facilities were selected as independent variables, with e-commerce demand as the dependent variable. The theoretical model delineating the relationships between the explanatory and dependent variables is as follows:
D P D i = a 0 + b 1 × P A i + b 2 × I D i + b 3 × C D i + b 4 × T C i + b 5 × P R D i + ε
where i refers to the observation unit; DPD is the density of e-commerce demand; the population attributes PA include the population density and the quantity of population with higher education; the level of industrial development ID includes the density of Taobao villages and the density of wholesale businesses; the commercial-facilities density CD includes the density of convenience stores, supermarkets, and shopping malls; and the transportation convenience TC includes the density of bus stops and subway stations; PRD is the density of express service points; and ε is an estimation error term.

3.3.3. Local Regression Modeling

The global regression model is based on the assumption that the relationships between the explanatory and dependent variables are uniform and unchanging throughout the study area; this assumes that these relationships remain consistent across different spatial locations [34,35]. In contrast, a geographically weighted regression (GWR) model assumes that the regression coefficients will vary in different spatial locations. By incorporating spatial information, GWR models allow for more precise analysis of localized patterns that might be missed by global models. The structure of the GWR model used in this work is as follows:
y i = β 0 ( u i , v i ) + k = 1 m β k ( u i , v i ) x i k + ε i
where yi refers to the explained variable, xik refers to the explanatory variables, (ui, vi) refers to the coordinates of the centroid of observation unit i, β0 is an intercept term, and βk is a regression coefficient for xj.
Traditional GWR models are limited by their inability to regress all independent variables with varying bandwidths, and they can thus overlook local variations in features. In contrast, multiscale GWR (MGWR) models address this limitation by employing an optimal bandwidth for each independent variable. MGWR models allow for the selection of smaller bandwidths when independent variables exhibit significant local variation and larger bandwidths when they show more stable global patterns [36]. The equation for the MGWR model used in this work is
y i = j = 0 k β b w j ( u i , v i ) x i j + ε i
where yi is the explained variable, xij are the explanatory variables, (ui, vi) are to the coordinates of the centroid of observation unit i, bwj refers to the bandwidth used for the regression coefficient of xj, and βbwj is the regression coefficient for xj.

4. Results

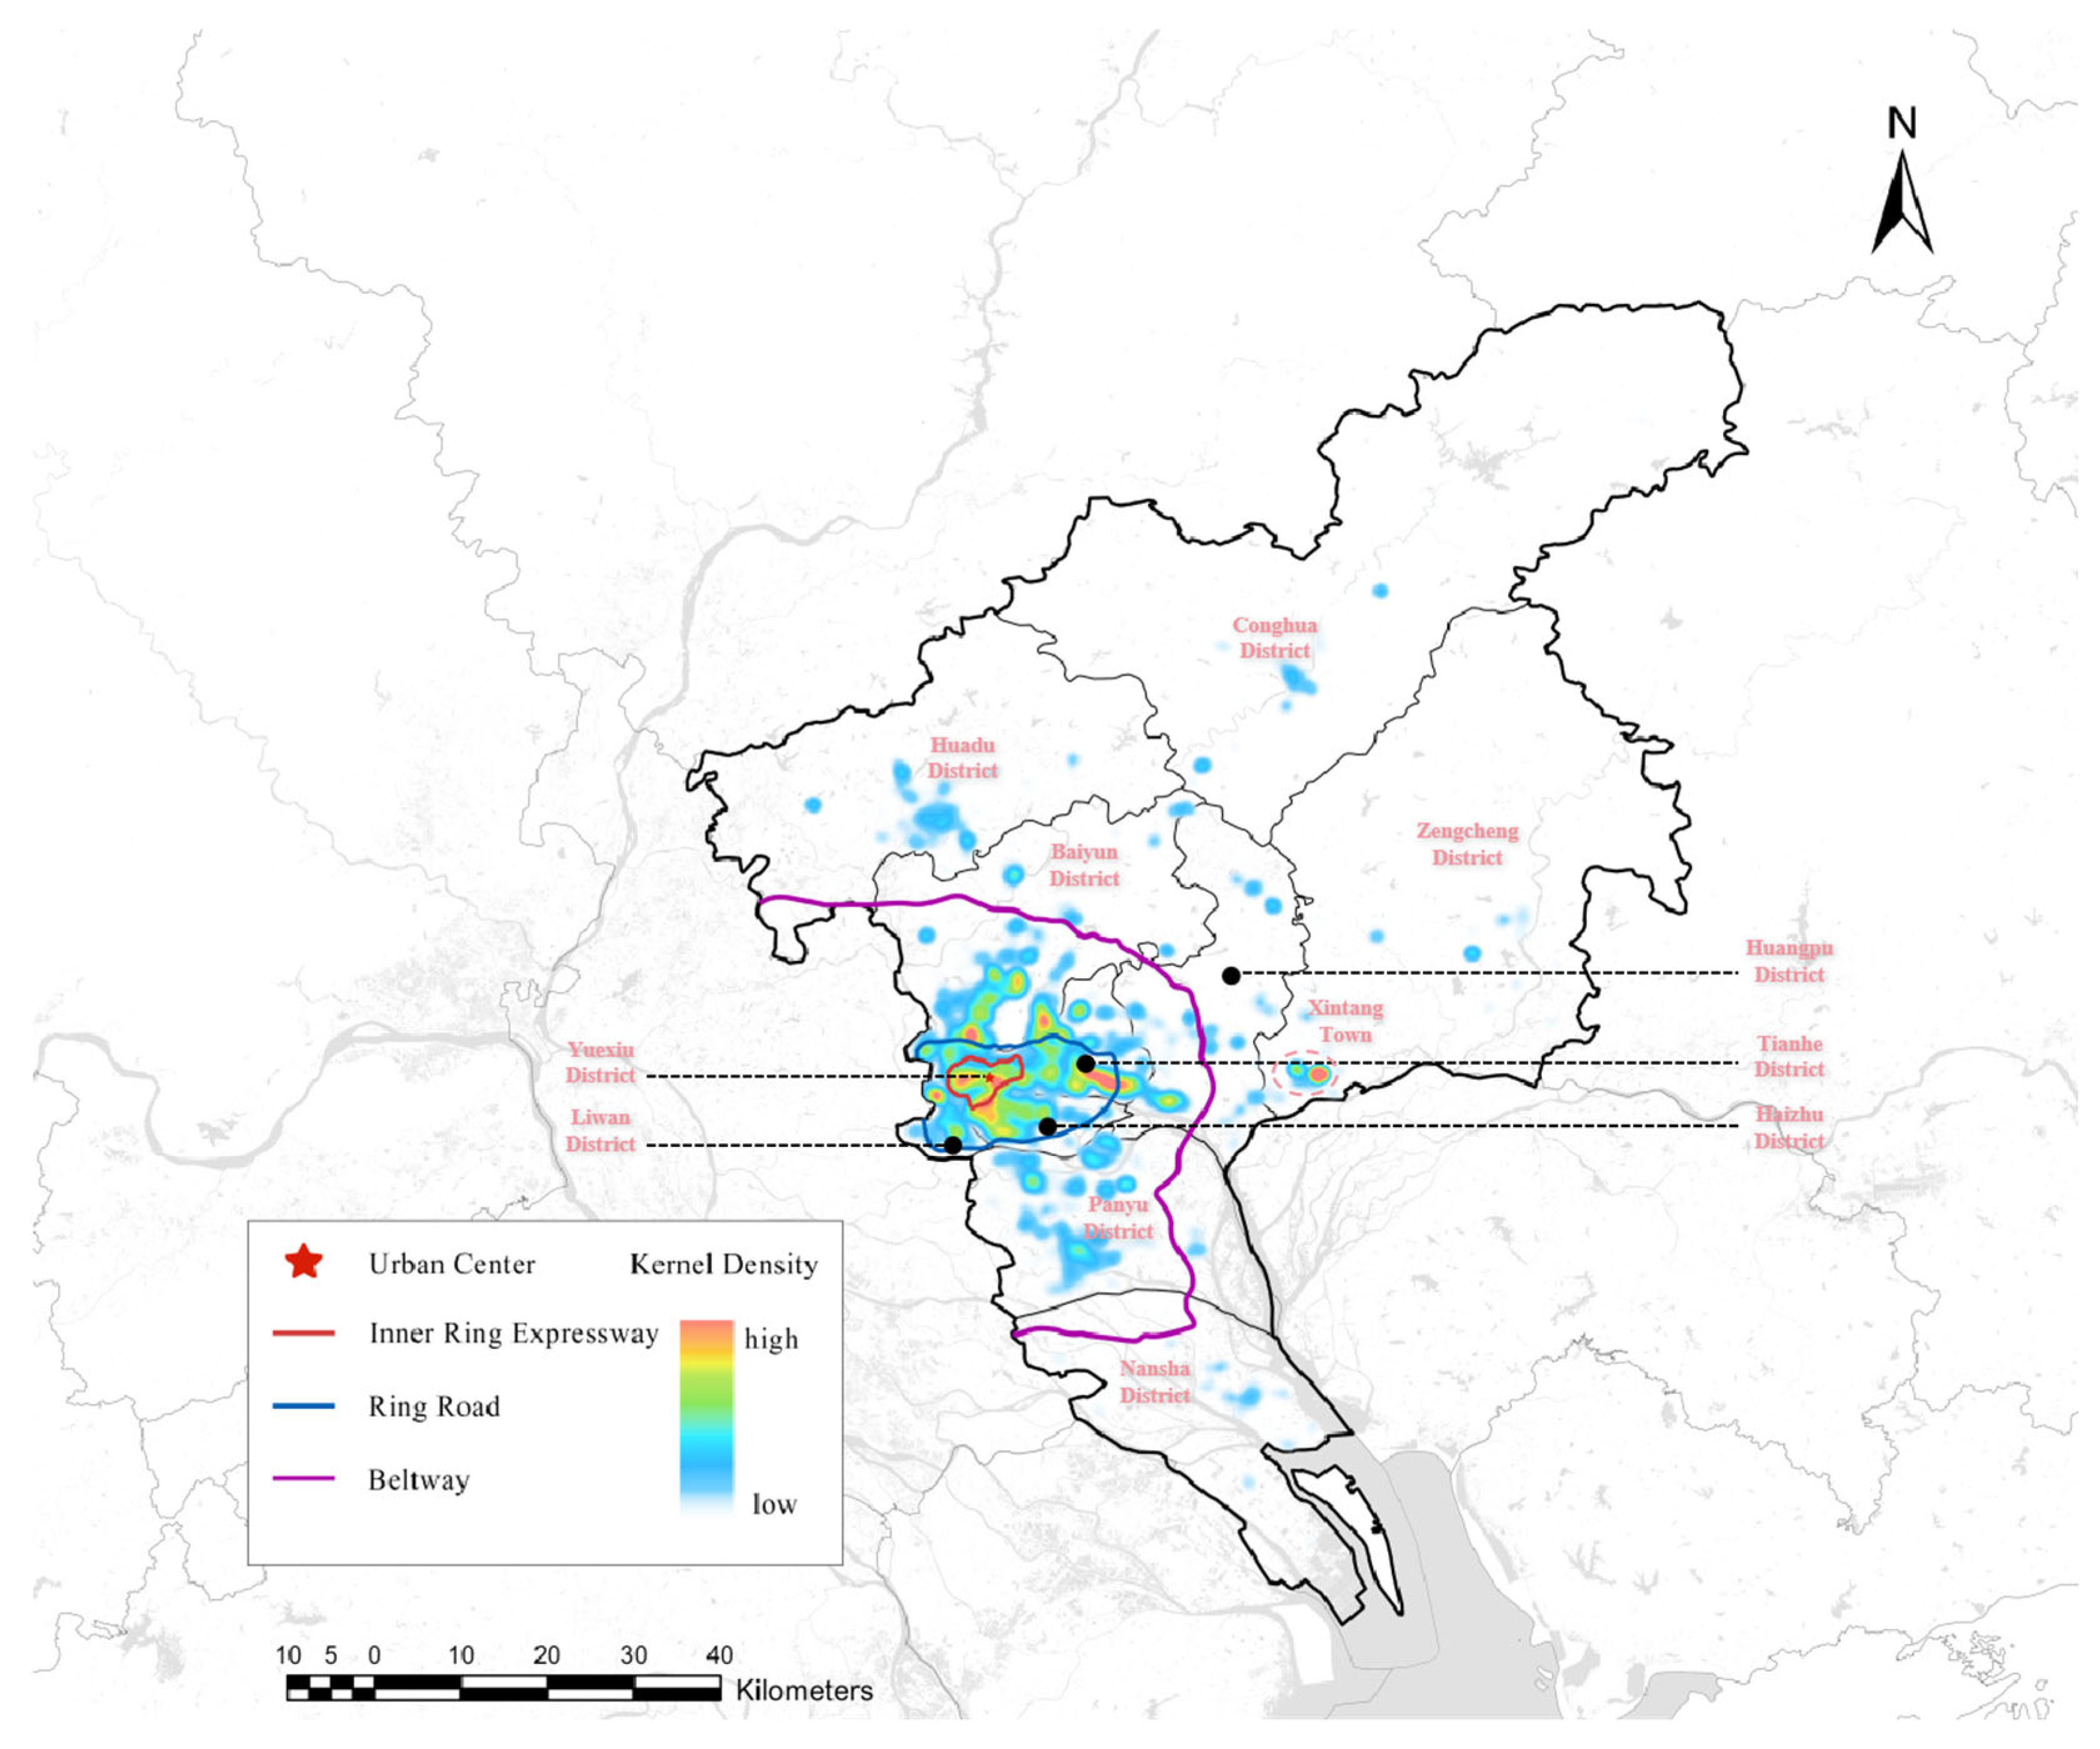
4.1. Kernel Density Estimation

The e-commerce demand in Guangzhou was found to exhibit pronounced spatial clustering, as shown in Figure 3. The highest e-commerce demand clustered in central Guangzhou and surrounding areas, reflecting the city’s economic activity, population density, and transportation accessibility.
First, it is noted that the downtown area of Guangzhou, including Tianhe, Yuexiu, Liwan, Haizhu, and Baiyun districts, serves as the epicenter of economic activities. This concentration attracts significant commercial and residential demand, resulting in high-density e-commerce demand. The commercial prosperity and high population density in these districts are key drivers of the demand for parcels. Additionally, a noticeable concentration of high-value regions can be seen in the eastern part of Guangzhou, particularly in Zengcheng District, Xintang Town. This area is a critical node in the eastward “axis” of urban spatial development, and it acts as a gateway between Guangzhou and neighboring cities. Its strategic location and rapid growth contribute to a significant volume of parcel delivery.
Second, Guangzhou’s well-developed transportation network, including the Inner Ring Expressway and main roads, facilitates the spatial aggregation of parcel delivery. The accessibility of these areas encourages logistics companies to set up facilities and distribution centers, thereby boosting the agglomeration effect of parcel intake.
The urban expansion pattern of Guangzhou has also influenced the spatial distribution of parcel delivery. The development of the city has transitioned from a concentric-circle model to a multi-core and belt-like pattern. This shift has resulted in the concentration of e-commerce demand not only in the city center but also in new agglomeration points between various core areas. The belt-shaped development along major transportation routes and rivers has further consolidated e-commerce demand due to the convenience of transportation links and the high concentration of commercial activities.
In summary, the spatial agglomeration of parcel delivery in Guangzhou is a result of the complex interplay between economic concentration, transportation accessibility, and evolving urban development patterns, exhibiting an overall trend of diffusion towards point-axis patterns. This confirms Anderson’s theory of innovation diffusion [37], and on this basis, it can be concluded that the spatial pattern of e-commerce demand diffusion aligns with the spatial pattern of urban development.

4.2. Global Regression

To identify the factors associated with e-commerce demand, we included various socioeconomic and geographic variables in our modeling process and used stepwise regression to determine the most effective model. Variance inflation factor (VIF) analysis was used to assess multicollinearity among the independent variables, ensuring that only relevant predictors were included in the regression model.
As shown in Table 4, the VIF values for the explanatory variables ranged from 1.108 to 5.56, well below the multicollinearity threshold of 10 recommended by Salmerón et al. (2018) [38]. Following this, stepwise regression was conducted, and the model’s fit was progressively improved with the addition of explanatory variables, as indicated by an increase in the adjusted R2 value from 0.845 to 0.893. The analysis revealed that population attributes, industrial development, the density of logistics facilities, and the density of commercial facilities all significantly impact e-commerce demand. In contrast, transportation accessibility did not have a significant effect. Among the variables, population density, the proportion of the population with higher education, the density of Taobao villages, the density of express service points, and the density of shopping malls were found to have the most substantial influence on e-commerce demand.
It can be seen that population attributes significantly influence e-commerce demand. A higher population density indicates a larger number of residents in a given area, and this is naturally associated with increased consumption activities. Residents in densely populated areas are more likely to engage in frequent and diverse consumption, leading to a higher volume of parcel received. Additionally, a high population density is often correlated with advanced economic development and greater consumption capacity, further impacting e-commerce demand. Consistent with the conclusions drawn by other scholars, education level has a significant impact on e-commerce demand [21,39,40]. Individuals with higher education typically have higher incomes, which increases the likelihood of them purchasing more products and services, including online purchases. Having completed higher education is also correlated with familiarity and trust in the security and convenience of online shopping, which leads to more frequent online purchases and, consequently, a higher volume of parcels received. Moreover, highly educated individuals often hold knowledge-oriented or white-collar positions with demanding schedules, which may lead them to use parcel delivery services more frequently for home deliveries. Industrial development and logistics facilities also play a clear role in e-commerce demand.
Although it was initially hypothesized that transportation accessibility might reduce the frequency of people shopping online, thereby decreasing e-commerce demand due to increased offline shopping, the results indicate otherwise. While improved transportation options, such as bus and subway stations, may influence some individuals to shop offline more frequently, it was found that they do not directly affect the overall number of parcels received. Interestingly, the density of supermarkets and shopping malls significantly affects the volume of parcels received. It can be understood that supermarkets and shopping malls, as the main places for offline shopping, have advantages that are unmatched by online shopping, while they are usually located in populated and economically developed areas, which leads to a significant impact on e-commerce demand either positively or negatively.
The results of the global regression model reveal that Koenker’s Breusch–Pagan statistic is statistically significant (p < 0.01), indicating regional disparities in the explanatory variables; this suggests the need for further local regression analysis to address these regional differences. As noted above, the OLS global model assumes a constant correlation between explanatory variables across the study area, but this fails to account for potential spatial variability in these relationships. To address this, Moran’s I test was first conducted to examine spatial dependence in e-commerce demand. The Moran’s I value was 0.551024 (p < 0.001), indicating a strong positive spatial autocorrelation in e-commerce demand. The findings underscore that the global OLS model, premised on spatial uniformity, fails to adequately capture the nuanced relationships between explanatory and dependent variables. Therefore, incorporating local regression models is essential to better account for spatial variations and improve the analysis.

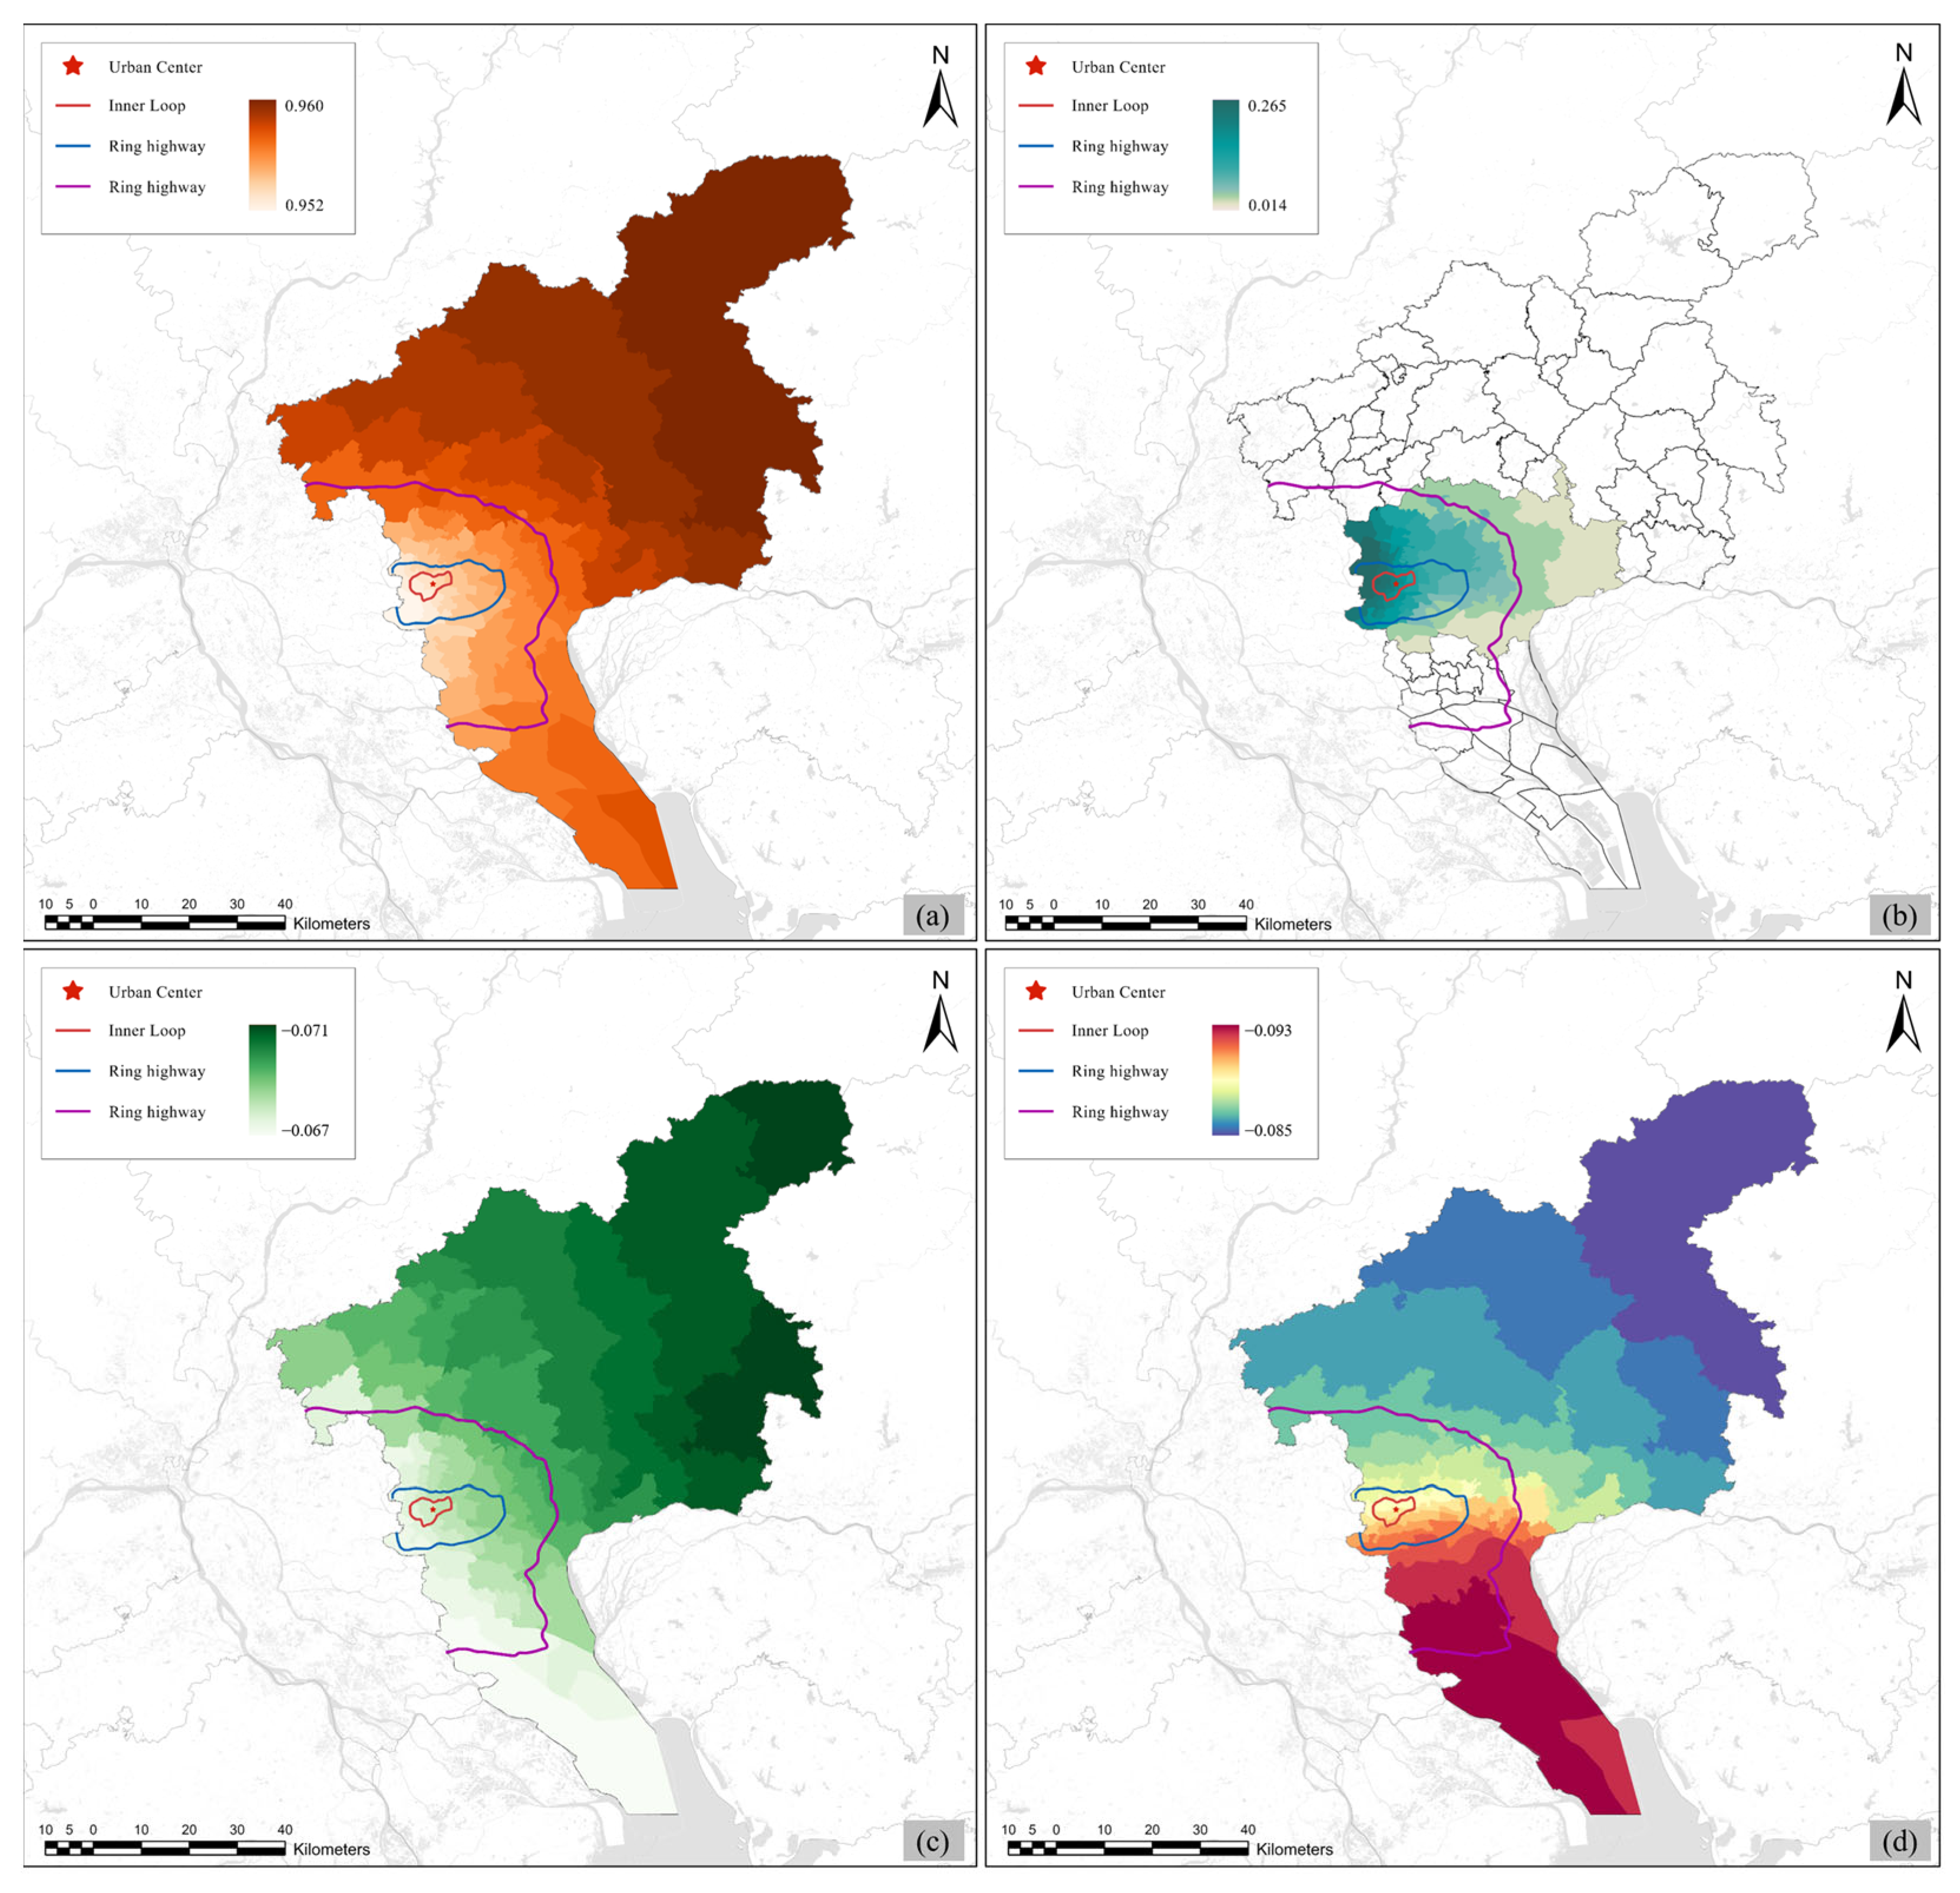
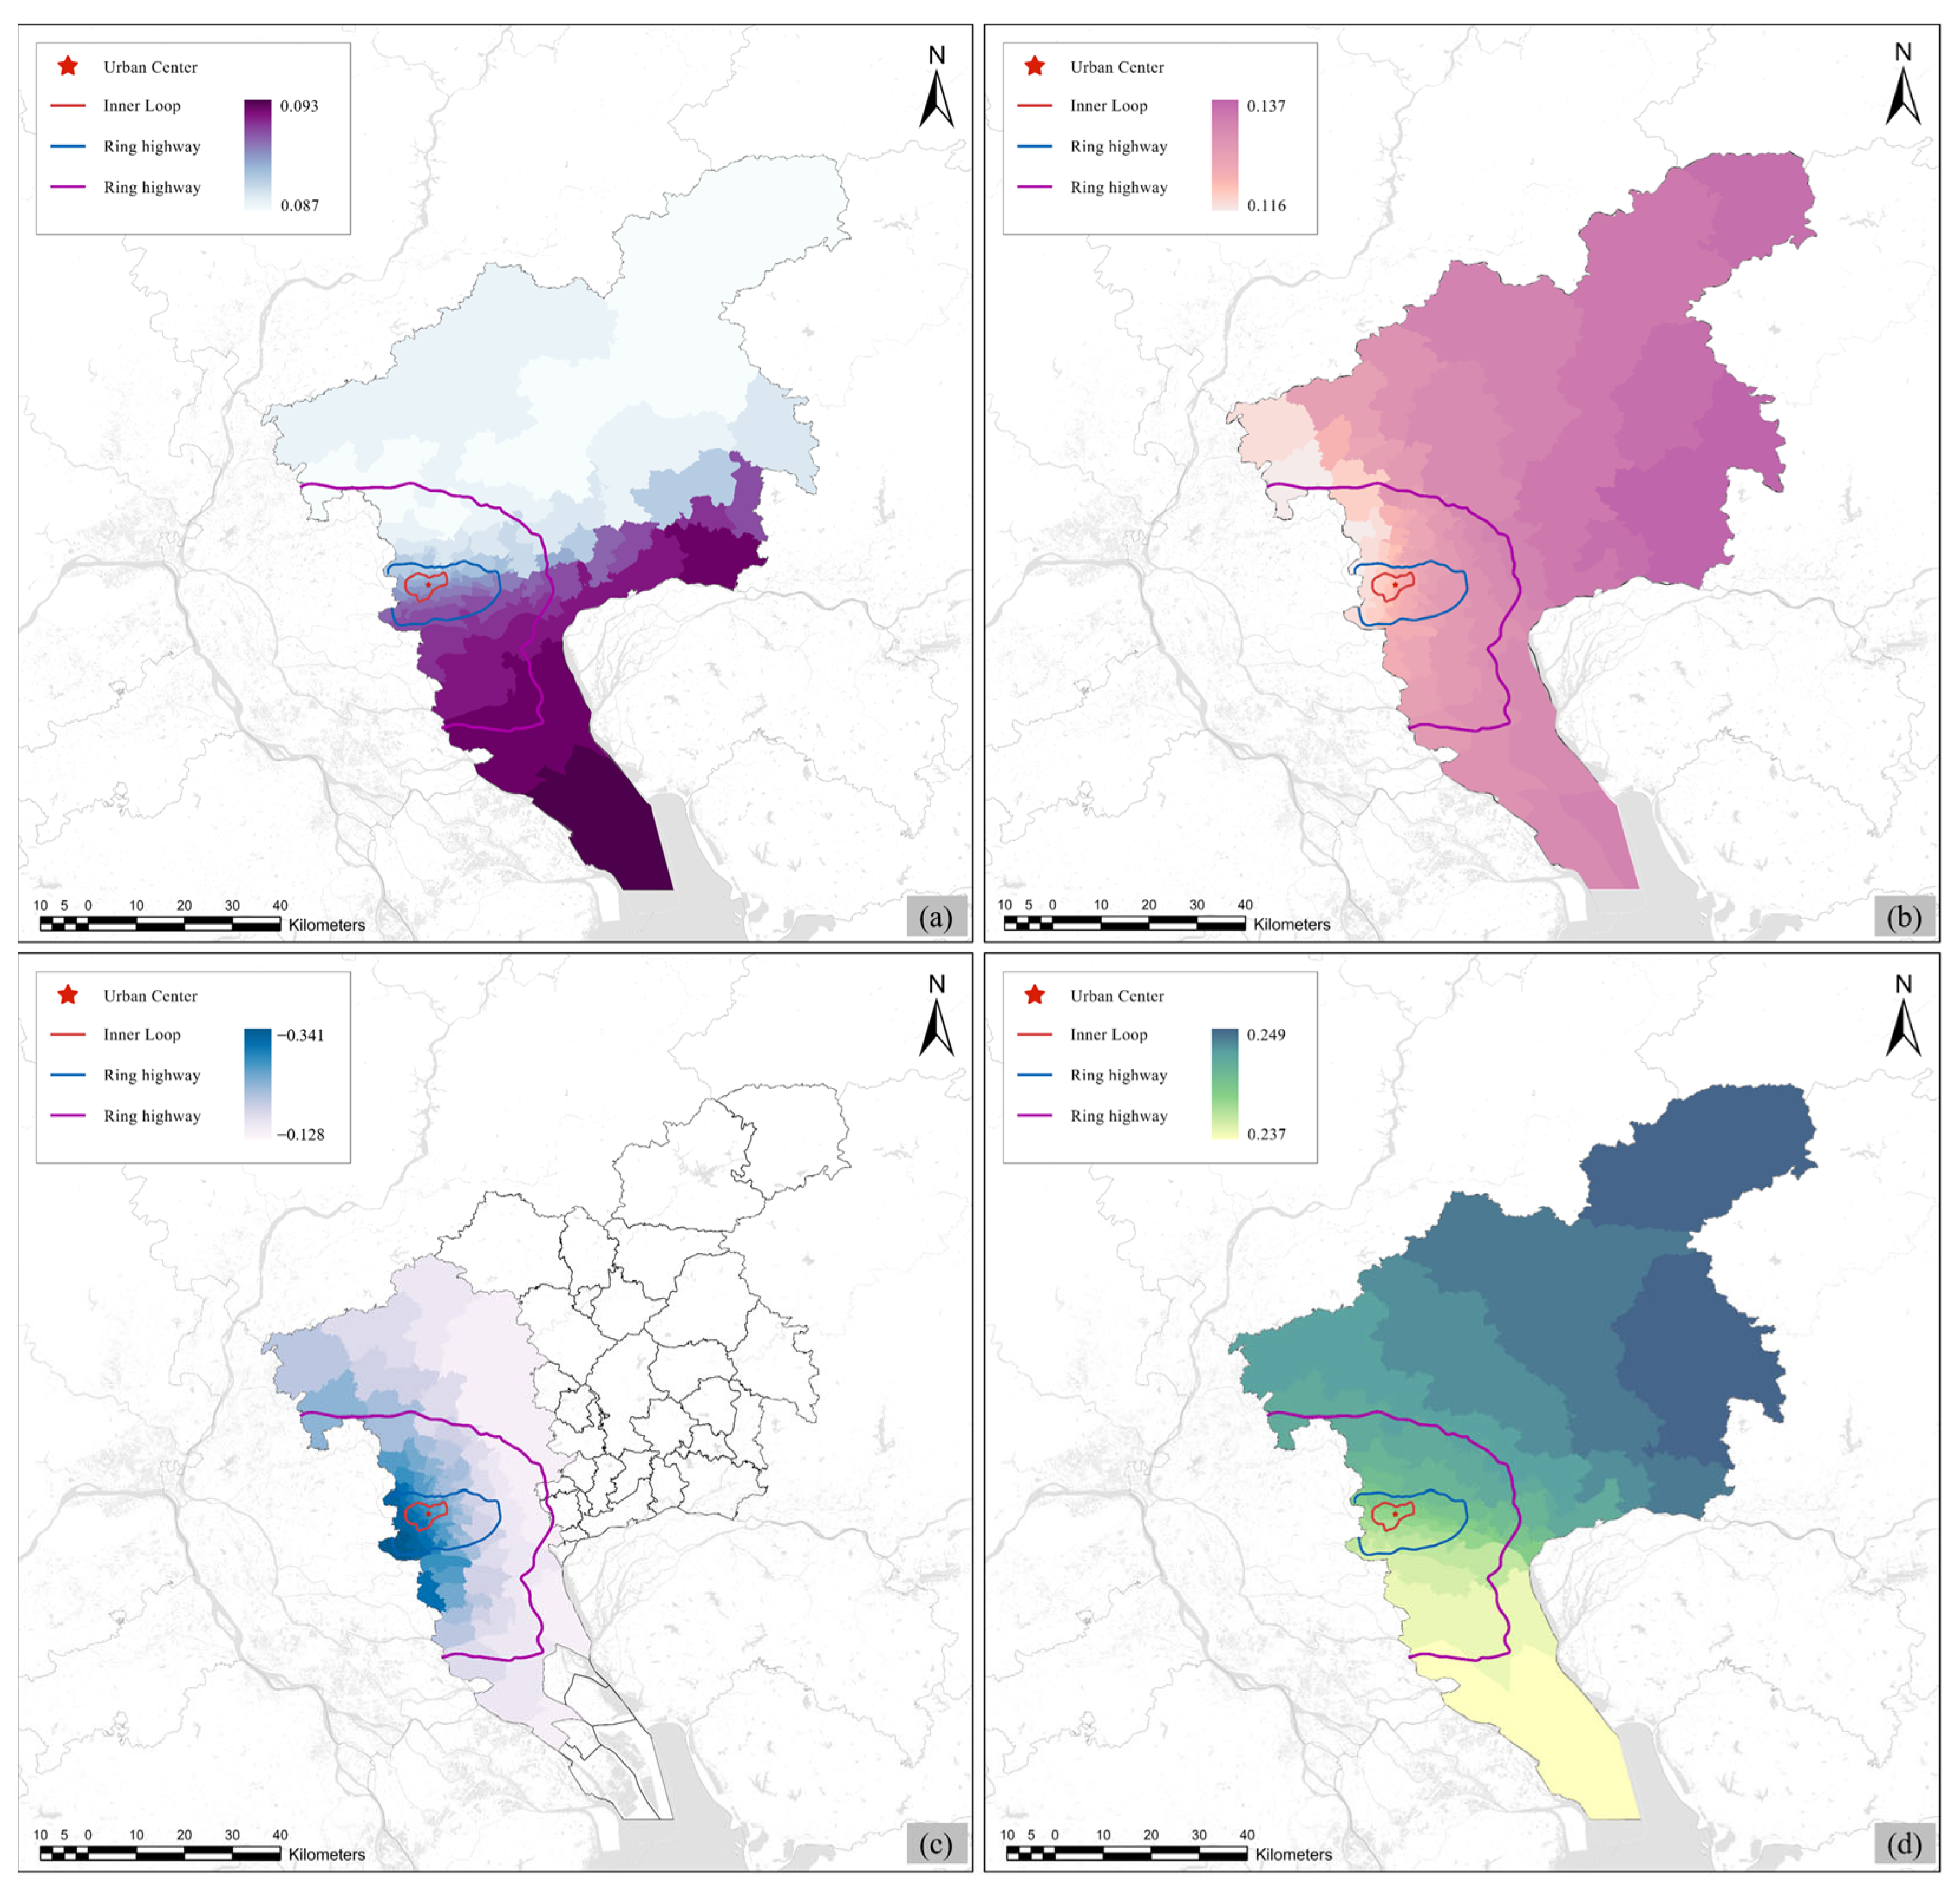
4.3. Local Regression

To further investigate local spatial variation patterns in e-commerce demand, we incorporated the same explanatory variables from the global regression model into two local regression models: a GWR model and an MGWR model. Local regression models require a spatial weight matrix to account for spatial autocorrelation [41]. This adjacency-based weighting scheme aligns with spatial econometric principles [42], ensuring that neighborhood effects are captured without overextending spatial dependency assumptions at the municipal scale.
Table 5 presents a comparison of the fit between the local and global regression models. Overall, the local regression models show better fits than the global models. The adjusted R2 value for the global regression model, which does not account for spatial correlation, is 0.889; the same value was obtained for the GWR model. In contrast, the MGWR model, which is optimized for bandwidth, achieved an adjusted R2 value of 0.896. The OLS model, which is prone to overfitting, exhibits a negative corrected Akaike information criterion (AICc) value (−148) and a lower R2 compared to both the GWR and MGWR models. The MGWR model, which has the highest adjusted R2 (0.896) and a lower AICc value (126.923) than the GWR model, demonstrates a superior fit. This suggests that the MGWR model more effectively captures spatial heterogeneities than the GWR model.
The bandwidths in the local regression models measure the influence ranges of independent variables on dependent variables. Table 6 displays the bandwidths for the variables in both the GWR and MGWR models. In the MGWR model, each independent variable has a unique bandwidth, while the GWR model uses a single fixed bandwidth. This allows the MGWR model to capture varying effective scales for different variables, whereas the GWR model only uses an average effective scale. The listed bandwidths indicate that the effective scales for the quantity of population with higher education and the density of supermarkets are relatively small, reflecting greater spatial variability in their impact on e-commerce demand. While the GWR model can only address spatial variation between variables, the MGWR model can offer insights into variation within variables. Consequently, the MGWR model offers a more nuanced analysis of spatial heterogeneities in the effects of independent variables.
As illustrated in Table 7, the influencing variables considered—the population density, the quantity of population with higher education, the density of express service points, the density of convenience stores, and the density of shopping malls—all exhibit positive correlations with e-commerce demand. The mean population density has the greatest influence (0.953) on the number of parcels received. The standard deviation (STD) of the quantity of population with higher education varies considerably, indicating that the impact of this variable differs notably across observation units. The density of Taobao villages, the density of wholesale businesses, and the density of supermarkets all have negative regression coefficients, indicating negative correlations with e-commerce demand. Based on this analysis, both the OLS and MGWR models lead to the same conclusion: the impact of transportation accessibility on e-commerce demand is not statistically significant.
This study makes a significant contribution to the literature by highlighting spatial heterogeneities in the influence of explanatory variables on e-commerce demand. Figure 4a shows that the coefficients of the MGWR model for population density vary spatially, with increasing differences from the city center to its periphery; however, the variation across different observation units remains relatively minor. This spatial heterogeneity can be attributed to the diverse lifestyles and shopping behaviors of residents in the city center, which diminish the impact of the population density in this area on e-commerce demand compared to in the periphery.
Figure 4b illustrates a decline in e-commerce demand from west to east after excluding insignificant regions, revealing more pronounced cellular variation. This variation can be linked to the prevalence of business activities and office areas in the western region. Additionally, the highly educated populations in these areas may have a greater tendency to use courier services for business-related items such as documents, samples, and contracts, leading to increased variability in parcel delivery.
Figure 4c reveals a negative correlation between the density of Taobao villages and e-commerce demand. This can be explained from two perspectives: first, Taobao’s business model in Guangzhou ensures quality and minimizes returns, with a primary focus on dispatching rather than receiving parcels. Second, Taobao villages are typically located in more remote areas where online shopping demand is low, resulting in a lesser impact on e-commerce demand.
Figure 4d shows a weak negative correlation between the density of wholesale businesses and e-commerce demand. This can be attributed to the nature of wholesale businesses, which generally handle commodities in bulk and undertake transactions that do not typically require courier or mail services. Instead, these transactions are often managed through specialized logistics channels such as freight and containerized transport. The negative correlation between density of wholesale businesses and e-commerce demand is more pronounced in the southern region compared to the northern region. In Guangzhou, the southern districts of Panyu and Nansha focus on imported goods, bulk items, and high-tech products, serving cross-border e-commerce and international trade. In contrast, the northern districts of Conghua and Huadu are known for the wholesale of flowers, daily necessities, and small commodities. This difference in commodity types and market positioning results in a weaker negative correlation between the density of wholesale businesses and parcel delivery in the northern part of Guangzhou.
Figure 5a illustrates that the impact of the density of express service points on e-commerce demand becomes more pronounced as one moves southward, although the effect remains relatively modest. In Guangzhou’s southern districts, where logistics capacity is still nascent, even modest increases in the density of express service points yield disproportionately large gains in e-commerce parcel demand, underscoring its pronounced elasticity to supply. In contrast, despite having fewer express service points and less favorable economic conditions, the northern region benefits from the presence of convenience stores that partially meet the demand for parcel delivery. This supplementation reduces the overall impact of the density of express service points on e-commerce demand in the northern areas.
Figure 5b shows a more pronounced positive correlation between the density of convenience stores and e-commerce demand in the eastern, southern, and northern regions than in the western part of Guangzhou. In China, convenience stores often function as parcel-collection points; therefore, in areas with relatively few logistics facilities—such as the eastern, southern, and northern regions—the density of convenience stores has a stronger positive correlation with e-commerce demand. This effect is less evident in the western region, which has a higher density of logistics facilities. Additionally, supermarkets, which can provide alternatives to online shopping, contribute to this observed correlation. In general, the positive correlation between convenience store density and e-commerce demand underscores their role as critical last-mile touchpoints in omnichannel retail ecosystems.
After excluding the areas in which the results were not credible, Figure 5c reveals a negative correlation between supermarket density and e-commerce demand, with this correlation growing stronger from the urban core to the periphery. In peripheral urban areas, logistical challenges such as delayed deliveries and incomplete services can affect online shopping. Supermarkets in these suburban areas offer immediate access to goods—particularly for urgent needs or food items—leading customers to prefer in-person shopping over waiting for online deliveries. Thus, the density of supermarkets in these peripheral regions has a greater influence on e-commerce demand. Furthermore, the negative correlation between supermarket density and e-commerce demand provides empirical support for the viability of “click-and-collect” models [43], where in-store pickup substitutes for pure online delivery.
The results in Figure 5d align with the findings of the previous OLS model, showing a positive correlation between the density of shopping malls and e-commerce demand, with notable spatial heterogeneity from south to north. In the southern and central regions, shopping malls are concentrated in commercial centers and feature large department stores and luxury brands, offering extensive offline shopping experiences. In response to the growth of online platforms, these malls are increasingly incorporating online shopping services and brand collaborations, thus increasing e-commerce demand. Conversely, due to geographic and demographic differences, shopping malls in the northern regions have adapted to offer more convenient and interactive shopping experiences; they also integrated online and offline marketing strategies earlier, promoting their products through e-commerce platforms. This integration has led to a spatial disparity between the north and south in terms of the influence of shopping malls on e-commerce demand.

5. Conclusions and Discussion

This empirical study aims to characterize online shopping demand through e-commerce demand, explore the factors influencing its spatial distribution, and determine whether there is spatial heterogeneity among them. The data sources included waybill data for extracting parcel delivery activity and supplementary industry and geographic data. To test the hypothesis of the existence of spatial heterogeneities in the impacts of various factors on e-commerce demand, both global and local regression models were examined. While contextual factors (e.g., Taobao villages) are unique to China, our methodological framework and key findings—such as the dual role of convenience stores in logistics–retail integration and the substitutive effect of supermarkets—offer transferable insights for cities in emerging economies with similar e-commerce growth trajectories (e.g., high-density Asian metropolises). Future comparative studies across cities could validate scalability.
Initially, global regression models were employed to analyze the relationships between e-commerce demand and several explanatory variables, including population attributes, industrial development, transportation accessibility, the density of logistics facilities, and the density of commercial facilities. This analysis revealed significant correlations between e-commerce demand and all of these variables except for transportation accessibility. This suggests that transportation accessibility does not directly affect online shopping habits or consumption behavior.
Subsequently, strong spatial autocorrelation was identified in e-commerce demand. Thus, the global model could not capture potential spatial correlations among explanatory variables, prompting the use of local regression models. The results indicate that local regression models offer a better fit compared to the original global model. Specifically, the MGWR model outperformed the GWR model, particularly regarding the effective bandwidth of the explanatory variables. The MGWR model confirmed substantial spatial variability in e-commerce demand. Among the factors analyzed, demographic attributes were found to have a more pronounced effect on e-commerce demand, showing significant spatial heterogeneities, while the density of logistical and commercial facilities provided additional insights.
Similar to previous research, there is a substitutive and complementary relationship between online shopping and physical stores [44,45,46]. At the same time, the necessity of considering retail geographic information methods in logistics planning was emphasized. Strategically co-locating convenience stores with parcel pickup services in peripheral areas can help address spatial inequities in service access while leveraging existing retail infrastructure. This approach can enhance last-mile delivery efficiency and improve consumer convenience, particularly in underserved regions. (1) The observed spatial heterogeneities indicate that the planning of logistics facilities should consider the influence of resource endowment, location conditions, economic factors, and other individual differences in different regions, and policies should be classified and implemented accordingly. Retailers and policymakers should consider spatially integrating retail facilities with logistics hubs to enhance consumer access to services while reducing delivery inefficiencies. For example, the co-location of supermarkets with parcel lockers or the expansion of convenience store pick-up networks can create synergistic service ecosystems while improving retail accessibility and delivery efficiency. (2) Our findings on the dual role of convenience stores align with the micro-fulfillment center concept [47], suggesting that these retail nodes not only serve immediate consumption needs but also act as decentralized logistics hubs, reducing last-mile delivery costs. China aims to achieve the goal of “countryside outlets and village services” by 2025. Strategic placement of convenience stores in peri-urban areas, informed by spatial demand elasticity patterns revealed in our MGWR analysis, could optimize last-mile network coverage while minimizing infrastructure redundancy. This approach will facilitate the efficient and compact establishment of small logistics service hubs. Such initiatives are expected to significantly enhance the supply chain resilience of economically disadvantaged and geographically isolated communities. (3) The negative correlation between the density of supermarkets and e-commerce demand shows the irreplaceable role of these shops, especially in people’s daily lives when purchasing food and urgently needed products. Therefore, it is crucial to ensure comprehensive coverage of supermarkets when planning commercial facilities. These spatial strategies contribute to building retail service resilience by diversifying fulfillment channels, thereby mitigating supply chain disruptions during peak demand periods like shopping festivals. At the same time, this substitution effect mirrors the “showrooming vs. Webrooming” dynamic in omnichannel retailing [48], where physical stores alternately compete with and complement digital platforms depending on product urgency and consumer time sensitivity.
This study’s limitations stem from a sample based on a single promotional period that may not generalize to routine demand, the absence of a complete daily dataset, and the lack of SKU or user-level attributes; future work should (i) access the full daily dataset, (ii) apply the MGWR framework across multiple quarters or years, and (iii) merge anonymized mobile-app or survey data to capture product and consumer heterogeneity.

Author Contributions

Conceptualization, Y.C., J.C. and S.L.; methodology, J.C. and S.L.; software, J.C.; formal analysis, J.C. and S.L.; resources, Y.C. and S.L.; data curation, J.C.; writing—original draft preparation, J.C.; writing—review and editing, Y.C. and S.L.; visualization, J.C.; funding acquisition, Y.C. and S.L. All authors have read and agreed to the published version of the manuscript.

Funding

This research was funded by National Natural Science Foundation of China [Grant No. 42301211], National Key Research and Development Program of China [Grant No. 2022YFF1303105], and Science and Technology Program of Guangzhou (Grant No. 2025A04J5203).

Institutional Review Board Statement

Ethical review and approval were waived for this study, as it did not involve any interventions or procedures that required ethical approval.

Informed Consent Statement

Informed consent was obtained from all subjects involved in the study.

Data Availability Statement

Data are available upon request.

Conflicts of Interest

The authors declare no conflicts of interest.

References

  1. Jaller, M.; Pahwa, A. Evaluating the environmental impacts of online shopping: A behavioral and transportation approach. Transport. Res. Part D-Transport. Environ. 2020, 80, 15. [Google Scholar] [CrossRef]
  2. SPB. Ti Insight Forecast Says Global Parcel Market Size Grows 9.2% This Year. Available online: https://www.spb.gov.cn/gjyzj/c200007/202408/c5d964def579416f8cf0cd97aaa3d0ba.shtml (accessed on 24 March 2025).
  3. SPB. Global Express Development Report. Available online: http://www.spbdrc.org.cn/yzfzyjzx/c100010/202311/2dfe90054ff4494597b3d3de76448a1f.shtml (accessed on 24 March 2025).
  4. Barthelmes, L.; Görgülü, M.E.; Kagerbauer, M.; Vortisch, P. Data collection for microscopic modelling of urban parcel transport to and from establishments—Empirical insights into city logistics in the region of Karlsruhe, Germany. J. Urban Mobil. 2024, 6, 8. [Google Scholar] [CrossRef]
  5. Kim, S.-J.; Lim, H.; Park, M. Analysing the cost efficiency of parcel distribution networks with changes in demand. Int. J. Urban Sci. 2014, 18, 416–429. [Google Scholar] [CrossRef]
  6. Lim, H.; Shiode, N. The impact of online shopping demand on physical distribution networks: A simulation approach. Int. J. Phys. Distrib. Logist. Manag. 2011, 41, 732–749. [Google Scholar] [CrossRef]
  7. Aljohani, K.; Thompson, R.G. Impacts of logistics sprawl on the urban environment and logistics: Taxonomy and review of literature. J. Transp. Geogr. 2016, 57, 255–263. [Google Scholar] [CrossRef]
  8. Veenstra, M.; Roodbergen, K.J.; Coelho, L.C.; Zhu, S.X. A simultaneous facility location and vehicle routing problem arising in health care logistics in the Netherlands. Eur. J. Oper. Res. 2018, 268, 703–715. [Google Scholar] [CrossRef]
  9. Zhuang, Y.F.; Huang, R. Design and Implementation of Terminal Logistics Distribution System Based on IOS Platform. In Proceedings of the International Conference on Electronic Information Technology and Computer Engineering (EITCE), Beijing Normal Univ, Zhuhai, China, 23–24 September 2017. [Google Scholar]
  10. Seghezzi, A.; Siragusa, C.; Mangiaracina, R. Parcel lockers vs. home delivery: A model to compare last-mile delivery cost in urban and rural areas. Int. J. Phys. Distrib. Logist. Manag. 2022, 52, 213–237. [Google Scholar] [CrossRef]
  11. Kim, J.; Kim, M.; Choi, J.; Trivedi, M. Offline social interactions and online shopping demand: Does the degree of social interactions matter? J. Bus. Res. 2019, 99, 373–381. [Google Scholar] [CrossRef]
  12. Reiffer, A.S.; Kuebler, J.; Kagerbauer, M.; Vortisch, P. Agent-based model of last-mile parcel deliveries and travel demand incorporating online shopping behavior. Res. Transp. Econ. 2023, 102, 101368. [Google Scholar] [CrossRef]
  13. Wang, J.J.; Xiao, Z.P. Co-evolution between etailing and parcel express industry and its geographical imprints: The case of China. J. Transp. Geogr. 2015, 46, 20–34. [Google Scholar] [CrossRef]
  14. Hou, J.W.; Elliott, K. Mobile shopping intensity: Consumer demographics and motivations. J. Retail. Consum. Serv. 2021, 63, 11. [Google Scholar] [CrossRef]
  15. Cheng, C.; Sakai, T.; Alho, A.; Cheah, L.; Ben-Akiva, M. Exploring the Relationship between Locational and Household Characteristics and E-Commerce Home Delivery Demand. Logistics 2021, 5, 29. [Google Scholar] [CrossRef]
  16. de Sousa, L.T.M.; de Oliveira, L.K.; dos Santos, J.L., Jr.; Bertoncini, B.V.; Isler, C.A.; Larranaga, A.M. Influence of neighborhood characteristics on e-commerce deliveries: The case of Belo Horizonte, Brazil. Res. Transp. Econ. 2023, 100, 12. [Google Scholar] [CrossRef]
  17. Oliveira, L.K.; Sousa, L.T.M.; Santos, J.L., Jr.; Bracarense, L. Spatial fragment parcel deliveries landscape in a global south city: The case of Belo Horizonte, Brazil. Transp. Res. Part A-Policy Pract. 2025, 199, 104571. [Google Scholar] [CrossRef]
  18. Shin, N.; Lim, H.; Kim, Y.J. Modeling spatial dimensions of parcel delivery demand and its determinants. Int. J. Logist.-Res. Appl. 2023, 26, 17. [Google Scholar] [CrossRef]
  19. Shao, R.; Derudder, B.; Witlox, F. The geography of e-shopping in China: On the role of physical and virtual accessibility. J. Retail. Consum. Serv. 2022, 64, 10. [Google Scholar] [CrossRef]
  20. Farag, S.; Weltevreden, J.; van Rietbergen, T.; Dijst, M.T.; van Oort, F. E-shopping in the Netherlands: Does geography matter? Environ. Plan. B-Plan. Des. 2006, 33, 59–74. [Google Scholar] [CrossRef]
  21. Rotem-Mindali, O. E-tail versus retail: The effects on shopping related travel empirical evidence from Israel. Transp. Policy 2010, 17, 312–322. [Google Scholar] [CrossRef]
  22. Beckers, J.; Cardenas, I.; Verhetsel, A. Identifying the geography of online shopping adoption in Belgium. J. Retail. Consum. Serv. 2018, 45, 33–41. [Google Scholar] [CrossRef]
  23. Petcharat, T.; Jattamart, A.; Leelasantitham, A. A conceptual model to imply a negative innovation assessment framework on consumer behaviors through the electronic business platforms. J. Retail. Consum. Serv. 2023, 74, 20. [Google Scholar] [CrossRef]
  24. Davari, A.; Iyer, P.; Rokonuzzaman, M. Identifying the determinants of online retail patronage: A perceived risk perspective. J. Retail. Consum. Serv. 2016, 33, 186–193. [Google Scholar] [CrossRef]
  25. Cao, X.Y.; Chen, Q.; Choo, S.H. Geographic Distribution of E-Shopping Application of Structural Equation Models in the Twin Cities of Minnesota. Transp. Res. Rec. 2013, 2383, 18–26. [Google Scholar] [CrossRef]
  26. Clarke, G.; Christopher, T.; Birkin, M. The emerging geography of e-commerce in British retailing. Reg. Stud. Reg. Sci. 2015, 2, 371–391. [Google Scholar] [CrossRef]
  27. Ren, F.; Kwan, M.P. The impact of geographic context on e-shopping behavior. Environ. Plan. B-Plan. Des. 2009, 36, 262–278. [Google Scholar] [CrossRef]
  28. Loo, B.P.Y.; Wang, B. Factors associated with home-based e-working and e-shopping in Nanjing, China. Transportation 2018, 45, 365–384. [Google Scholar] [CrossRef]
  29. Etminani-Ghasrodashti, R.; Hamidi, S. Online shopping as a substitute or complement to in-store shopping trips in Iran? Cities 2020, 103, 16. [Google Scholar] [CrossRef]
  30. GSB. Bulletin of the Seventh National Population Census of Guangzhou Municipality. Available online: https://tjj.gz.gov.cn/zzfwzq/tjgb/content/post_8543052.html (accessed on 24 March 2025).
  31. GMPA. Guangzhou Postal Industry Development Statistics Bulletin 2021. Available online: http://gd.spb.gov.cn/gdsyzglj/c106014/c106030/c106036/202205/79ba2af477454cbabc795453d6c4e56d.shtml (accessed on 24 March 2025).
  32. GSB. Market Advantages of Good Toughness and Resilience—Analysis of the Current Situation, Problems and Countermeasures of Guangzhou Billion Dollar Market Development in the “13th Five-Year Plan” Period. Available online: https://tjj.gz.gov.cn/zzfwzq/sjjd/content/post_8763121.html (accessed on 24 March 2025).
  33. Yuan, K.; Cheng, X.; Gui, Z.; Li, F.; Wu, H. A quad-tree-based fast and adaptive Kernel Density Estimation algorithm for heat-map generation. Int. J. Geogr. Inf. Sci. 2019, 33, 2455–2476. [Google Scholar] [CrossRef]
  34. Brunsdon, C.; Fotheringham, A.S.; Charlton, M.E. Geographically Weighted Regression: A Method for Exploring Spatial Nonstationarity. Geogr. Anal. 1996, 28, 281–298. [Google Scholar] [CrossRef]
  35. Fotheringham, A.S.; Charlton, M.E.; Brunsdon, C. Geographically Weighted Regression: A Natural Evolution of the Expansion Method for Spatial Data Analysis. Environ. Plan. A 1998, 30, 1905–1927. [Google Scholar] [CrossRef]
  36. Fotheringham, A.S.; Yang, W.; Kang, W. Multiscale Geographically Weighted Regression (MGWR). Ann. Am. Assoc. Geogr. 2017, 107, 1247–1265. [Google Scholar] [CrossRef]
  37. Anderson, W.P.; Chatterjee, L.; Lakshmanan, T.R. E-commerce, Transportation, and Economic Geography. Growth Change 2003, 34, 415–432. [Google Scholar] [CrossRef]
  38. Salmerón, R.; García, C.B.; García, J. Variance Inflation Factor and Condition Number in multiple linear regression. J. Stat. Comput. Simul. 2018, 88, 2365–2384. [Google Scholar] [CrossRef]
  39. Doan, D.A.; Vu, N.H.; Nguyen, P.L.; Dinh, D.X. Vietnamese people’s behavior and future intention to purchase medicines and functional foods on the internet: A cross-sectional study. Sci Rep 2024, 14, 10. [Google Scholar] [CrossRef]
  40. Roos, J.M.; Jansson, M.; Bjerkeli, P.J. Who Are the Online Medication Shoppers? A Market Segmentation of the Swedish Welfare State. J. Theor. Appl. Electron. Commer. Res. 2024, 19, 526–537. [Google Scholar] [CrossRef]
  41. Brunsdon, C.; Fotheringham, A.S.; Charlton, M. Geographically weighted summary statistics—A framework for localised exploratory data analysis. Comput. Environ. Urban Syst. 2002, 26, 501–524. [Google Scholar] [CrossRef]
  42. Tobler, W.R. A Computer Movie Simulating Urban Growth in the Detroit Region. Econ. Geogr. 1970, 46, 234–240. [Google Scholar] [CrossRef]
  43. Milioti, C.; Pramatari, K.; Kelepouri, I. Modelling consumers’ acceptance for the click and collect service. J. Retail. Consum. Serv. 2020, 56, 8. [Google Scholar] [CrossRef]
  44. Ding, Y.; Lu, H.P. The interactions between online shopping and personal activity travel behavior: An analysis with a GPS-based activity travel diary. Transportation 2017, 44, 311–324. [Google Scholar] [CrossRef]
  45. Lee, R.J.; Sener, I.N.; Mokhtarian, P.L.; Handy, S.L. Relationships between the online and in-store shopping frequency of Davis, California residents. Transp. Res. Part A-Policy Pract. 2017, 100, 40–52. [Google Scholar] [CrossRef]
  46. Wang, K.L.; Gao, Y.; Liu, Y.C.; Habib, K.N. Exploring the choice between in-store versus online grocery shopping through an application of Semi-Compensatory Independent Availability Logit (SCIAL) model with latent variables. J. Retail. Consum. Serv. 2023, 71, 17. [Google Scholar] [CrossRef]
  47. Kim, J.; Choi, J.; Chang, S.R.; Trivedi, M. The impact of offline store presence on digital sales: The moderating role of product functionality. J. Retail. Consum. Serv. 2024, 78, 10. [Google Scholar] [CrossRef]
  48. Flavián, C.; Gurrea, R.; Orús, C. Combining channels to make smart purchases: The role of webrooming and showrooming. J. Retail. Consum. Serv. 2020, 52, 11. [Google Scholar] [CrossRef]
Figure 1. Location of Guangzhou, China.
Jtaer 20 00190 g001
Figure 2. Illustration of conceptual framework.
Jtaer 20 00190 g002
Figure 3. Spatial distribution of e-commerce demand obtained using KDE.
Jtaer 20 00190 g003
Figure 4. Spatial distributions of MGWR regression coefficients for population attributes and industrial development: (a) population density; (b) quantity of population with higher education; (c) density of Taobao villages; (d) density of wholesale businesses.
Jtaer 20 00190 g004
Figure 5. Spatial distributions of MGWR regression coefficients for logistics and the density of commercial facilities: (a) density of express service points; (b) density of convenience stores; (c) density of supermarkets; (d) density of shopping malls.
Jtaer 20 00190 g005
Table 1. Summary of previous studies on e-commerce demand.
Research PerspectiveData SourceDriving FactorsAnalytical MethodsReference
Online
shopping
behavior
2014 Online Shopping Index (OSI) by Alibaba GroupSocioeconomic: urban administrative level, Internet penetration level, age, educational level, income levelGeneral Spatial Model (SAC) includes both the spatial lag term and the spatial error term[19]
Built environment: number of shopping centers, number of buses, number of express delivery points
Online
shopping
behavior
Dutch e-commerce survey (1996–2001)Socioeconomic: gender, age, educational level, Internet penetration level, credit card popularity level, family shopping experienceOrdinary Least Squares[20]
Built environment: urbanization level, accessibility of physical stores
Online
shopping
behavior
Face-to-face survey in Tel Aviv metropolitan areaSocioeconomic: gender, age, educational level, member of family, income level, the number of cars owned by the family, reasons for Internet shopping, Internet penetration level, enjoy shoppingOrdinal Logit Model[21]
Online
shopping
behavior
Survey Monkey’s online shopper panelSocioeconomic: age, educational level, income, number and frequency of mobile purchases, annual mobile purchase expenditure amountLinear Regression Model[14]
Online
shopping
behavior
E-commerce in Belgium 2016 questionnaire by ComeosSocioeconomic: age, educational level, incomeLogistic Regression Model[22]
Built environment: urbanization level
Online
shopping
behavior
Questionnaires from 384 online shopping platform usersBehavioral: online purchasing habits, loss avoidance, transition costs, uncertainty cost, sunk cost, social norms, information search, evaluation of alternative solutions, negative intent recognition, uncertain purchasing behavior, negative purchasing behavior, negative recommendationsStructural Equation Model [23]
Online
shopping
behavior
Online self-administered survey by OualtricsBehavioral: product portfolio, product quality, price transparency, website convenience, service quality, security issues, online retail discountsPartial Least Squares Structural Equation Modeling[24]
Online
shopping
behavior
Shopping survey (December 2008–January 2009)Socioeconomic: age, income, family vehicle ownership status, number of household employees, shopping behavior, Internet experience, shopping attitudeStructural Equation Model[25]
Built environment: offline shopping accessibility
Online
shopping
behavior
Acxiom’s Research Opinion PollSocioeconomic: age, income, family vehicle ownership status, family size, Internet accessBinary Logistic Regression Model[26]
Built environment: urbanization level, offline shopping accessibility
Online
shopping
behavior
Internet diary survey (April 2003)Socioeconomic: age, gender, income; educational level, weekly working hours, Internet use level, population density, proportion of white raceLogistic Regression Model[27]
Built environment: the number of shopping opportunities during travel time, shopping opportunity area during travel time
Online
shopping
behavior
Household survey in Nanjing (July–August 2015)Socioeconomic: age; income, educational level, usage of smartphones, daily Internet usage timeJoint Binary Logit Regression[28]
Built environment: distance to the workplace, distance to the nearest subway station, distance to the nearest shopping center
Online
shopping
behavior
Household survey in Shiraz, IranSocioeconomic: income, educational level, work situation, driver’s license status, offline shopping frequency, online shopping frequency, Internet use experienceStructural Equation Model[29]
Built environment: land use diversity, offline shopping and transportation methods, offline shopping locations, proportion of connection nodes, intersection density, employment density, residential density, the distance from home to the nearest store, the distance from home to the nearest bus stop, residential location
Parcel
delivery
Logistics company waybill data (2019–2022)Socioeconomic: socioeconomic income, nonresident real estate transactionsMoran’s I and bivariate Moran’s I[17]
Built environment: density of commercial facilities, diversity of commercial facilities, per capita parcel delivery and opportunities achievable within 15 min under walking distance and socioeconomic conditions, per capita package delivery and opportunities achievable within 30 min under public transportation distance and socioeconomic conditions
Parcel
delivery
Logistics company waybill data (2019–2021)Socioeconomic: income, family sizeNegative Binomial Regression Model[16]
Built environment: number of offline retail stores, community area
Parcel
delivery
Logistics company waybill data (February–April 2019)Socioeconomic: population density, average family size, average household income, average age of household heads, average vehicle ownership rateLinear Regression Model[15]
Built environment: average age of residential buildings, accessibility of commercial complexes, accessibility of public transportation
Parcel
delivery
CJ Logistics parcel delivery OD data (June 2014)Socioeconomic: single occupancy rate, gender, age, daytime population size, GDPSpatial Durbin Error Model[18]
Built environment: proportion of residential areas, proportion of commercial areas, apartment ratio, retail area ratio
Table 2. Typical waybill data from ZTO Express.
Waybill NumberDateTimeProgress
78XXXXXXXXXX2811 November 202312:02:30[Guangzhou Wanjia, Guangdong Province][Guangzhou] Guangzhou Wanjia has been collected
11 November 202320:23:48[Guangzhou Transfer Center, Guangdong Province][Guangzhou] The Guangzhou Express has arrived at the Guangzhou Transfer Center
11 November 202320:29:38[Guangzhou Transfer Center, Guangdong Province][Guangzhou] The package has been sent to Guangzhou Tonghe
12 November 20231:04:23[Guangzhou Tonghe, Guangdong Province][Guangzhou] The package has arrived at Tonghe, Guangzhou
12 November 202310:12:25[Guangzhou Tonghe, Guangdong Province][Guangzhou] The salesperson from Guangzhou Tonghe is currently delivering for the second time
12 November 202315:37:04[Guangzhou Baiyun Dabi West Road Branch of Express Supermarket, Guangdong Province] The package has been temporarily placed at the Guangzhou Baiyun Dabi West Road branch of the express supermarket, please pick up the package promptly.
13 November 202314:11:58[Guangzhou Baiyun Dabi West Road Branch of Express Supermarket, Guangdong Province][Guangzhou] Your package has been signed for
Table 3. Descriptive statistics of variables.
VariableMeanStd. Dev.MinMax
Density of e-commerce demand (parcels/m2)0.4150.4550.00012.337
Density of population (persons/m2)174.062191.0650.614975.420
Quantity of population with higher education (persons)28,945.83522,079.4631034119,755
Density of Taobao villages (villages/m2)0.00030.00100.007
Density of wholesale businesses (points/m2)5.6138.7790.00144.855
Density of bus stops (stops/m2)0.0450.04100.195
Density of subway stations (stations/m2)0.0090.01300.062
Density of express service points (points/m2)0.0730.0730.000040.458
Density of convenience stores (stores/m2)0.1650.14500.774
Density of supermarkets (stores/m2)0.0300.03100.221
Density of shopping malls (malls/m2)0.0040.01000.098
Table 4. Summary statistics of the global OLS model.
DimensionVariableModel 1Model 2Model 3Model 4Model 5VIF
Intercept 0.169 *0.6510.1740.0360.463
Population attributesDensity of population0.000 ***0.000 ***0.000 ***0.000 ***0.000 ***3.313
Quantity of population with higher education0.000 ***0.000 ***0.000 ***0.000 ***0.000 ***1.108
Industrial developmentDensity of Taobao villages 0.000 ***0.000 ***0.000 ***0.000 ***1.141
Density of wholesale businesses 0.1140.018 **0.015 **0.080 **2.102
Transportation accessibilityDensity of bus stops 0.6220.8880.3365.052
Density of subway stations 0.1280.1130.1131.878
Density of logistics facilitiesDensity of express service points 0.073 *0.002 ***1.889
Density of commercial facilities Density of convenience stores 0.2855.115
Density of supermarkets 0.031 **5.560
Density of shopping malls 0.000 ***2.423
No. of Obs. 176176176176176
Adjusted R2 0.8540.8620.8670.8690.889
Notes: *** p < 0.01; ** p < 0.05; * p < 0.10.
Table 5. Comparison of the goodness-of-fit measures for the global and local models.
CriterionOLSGWRMGWR
Adjusted R20.8890.8890.896
AICc−148.900128.493126.923
Table 6. Multiscale bandwidth for the GWR and MGWR local models.
CriterionVariableGWRMGWR
Intercept 138175
Population attributesPopulation density138175
Quantity of population with higher education13893
Quantity of population without higher education138175
Industrial developmentDensity of Taobao villages138175
Density of wholesale businesses138175
Transportation accessibilityDensity of bus stops138175
Density of subway stations138175
Density of logistics facilities Density of express service points138175
Density of commercial facilitiesDensity of convenience stores138175
Density of supermarkets138112
Density of shopping malls138175
Table 7. Summary of OLS and MGWR regression results.
DimensionVariableOLSMeanSTDMinMedianMax
Intercept 0.4630.0580.0020.0520.0590.062
Population attributesPopulation density0.000 ***0.9530.0020.9520.9520.960
Quantity of population with higher education0.000 ***0.1360.0730.0140.1410.265
Industrial developmentDensity of Taobao villages0.000 ***−0.0670.001−0.071−0.067−0.067
Density of wholesale businesses0.080 *−0.0920.002−0.093−0.093−0.085
Transportation accessibilityDensity of bus stops0.366−0.0670.002−0.069−0.068−0.061
Density of subway stations0.1130.0540.0020.0520.0530.062
Density of logistics facilitiesDensity of express service points0.002 ***0.0890.0010.0870.0890.093
Density of commercial facilitiesDensity of convenience stores0.2850.1200.0040.1160.1190.137
Density of supermarkets0.031 **−0.2610.076−0.341−0.298−0.128
Density of shopping malls0.000 ***0.2400.0020.2370.2390.249
OLSMeanSTDMinMedianMax
Notes: *** p < 0.01; ** p < 0.05; * p < 0.10.
Disclaimer/Publisher’s Note: The statements, opinions and data contained in all publications are solely those of the individual author(s) and contributor(s) and not of MDPI and/or the editor(s). MDPI and/or the editor(s) disclaim responsibility for any injury to people or property resulting from any ideas, methods, instructions or products referred to in the content.

