Appendix B. Proof of Corollary 1–4
In
Appendix B, we mainly compare the profits of the supplier under different strategies through difference analysis to provide proofs for Corollary 1 to Corollary 4. In
Appendix B.1, we compare the profits of the supplier under the AA strategy and the RA strategy; in
Appendix B.2, we analyze the profits of the supplier under the AA strategy and the AR strategy; in
Appendix B.3, we compare the profits of the supplier under the AA strategy and the RR strategy; finally, in
Appendix B.4, we compare the profits of the supplier under the AR strategy and the RR strategy. These comparisons are all calculated using the difference method. In addition, through the analysis in
Appendix B.1, we found that for the supplier, the RA strategy is always inferior to the AA strategy. Therefore, in the subsequent comparisons, we only focus on the profits of the supplier under the AA strategy and the other two strategies.
Appendix B.1. Proof of Corollary 1
Appendix B.2. Proof of Corollary 2
.
Let , we find that , so is increasing monotonically with c in . Substituting and into , we find that and . There is such that , we find that, is decreasing monotonically with c in , and increasing monotonically with c in .
Substituting , and into , we have , and . If , then , otherwise . There is such that . If (1) or (2) and , then , otherwise .
So, if (1) or (2) and , then , otherwise .
Appendix B.3. Proof of Corollary 3
Let , we find that , so is increasing monotonically with c in . Substituting and into , we find that and . There is such that , we find that, is decreasing monotonically with c in , and increasing monotonically with c in .
Substituting , and into , we find that, if , then ; otherwise . If , then ; otherwise . If , then ; otherwise . There is such that . If (1) or (2) and or (3) and , then ; and otherwise.
So, if (1) or (2) and or (3) and , then ; and otherwise.
Appendix B.4. Proof of Corollary 4
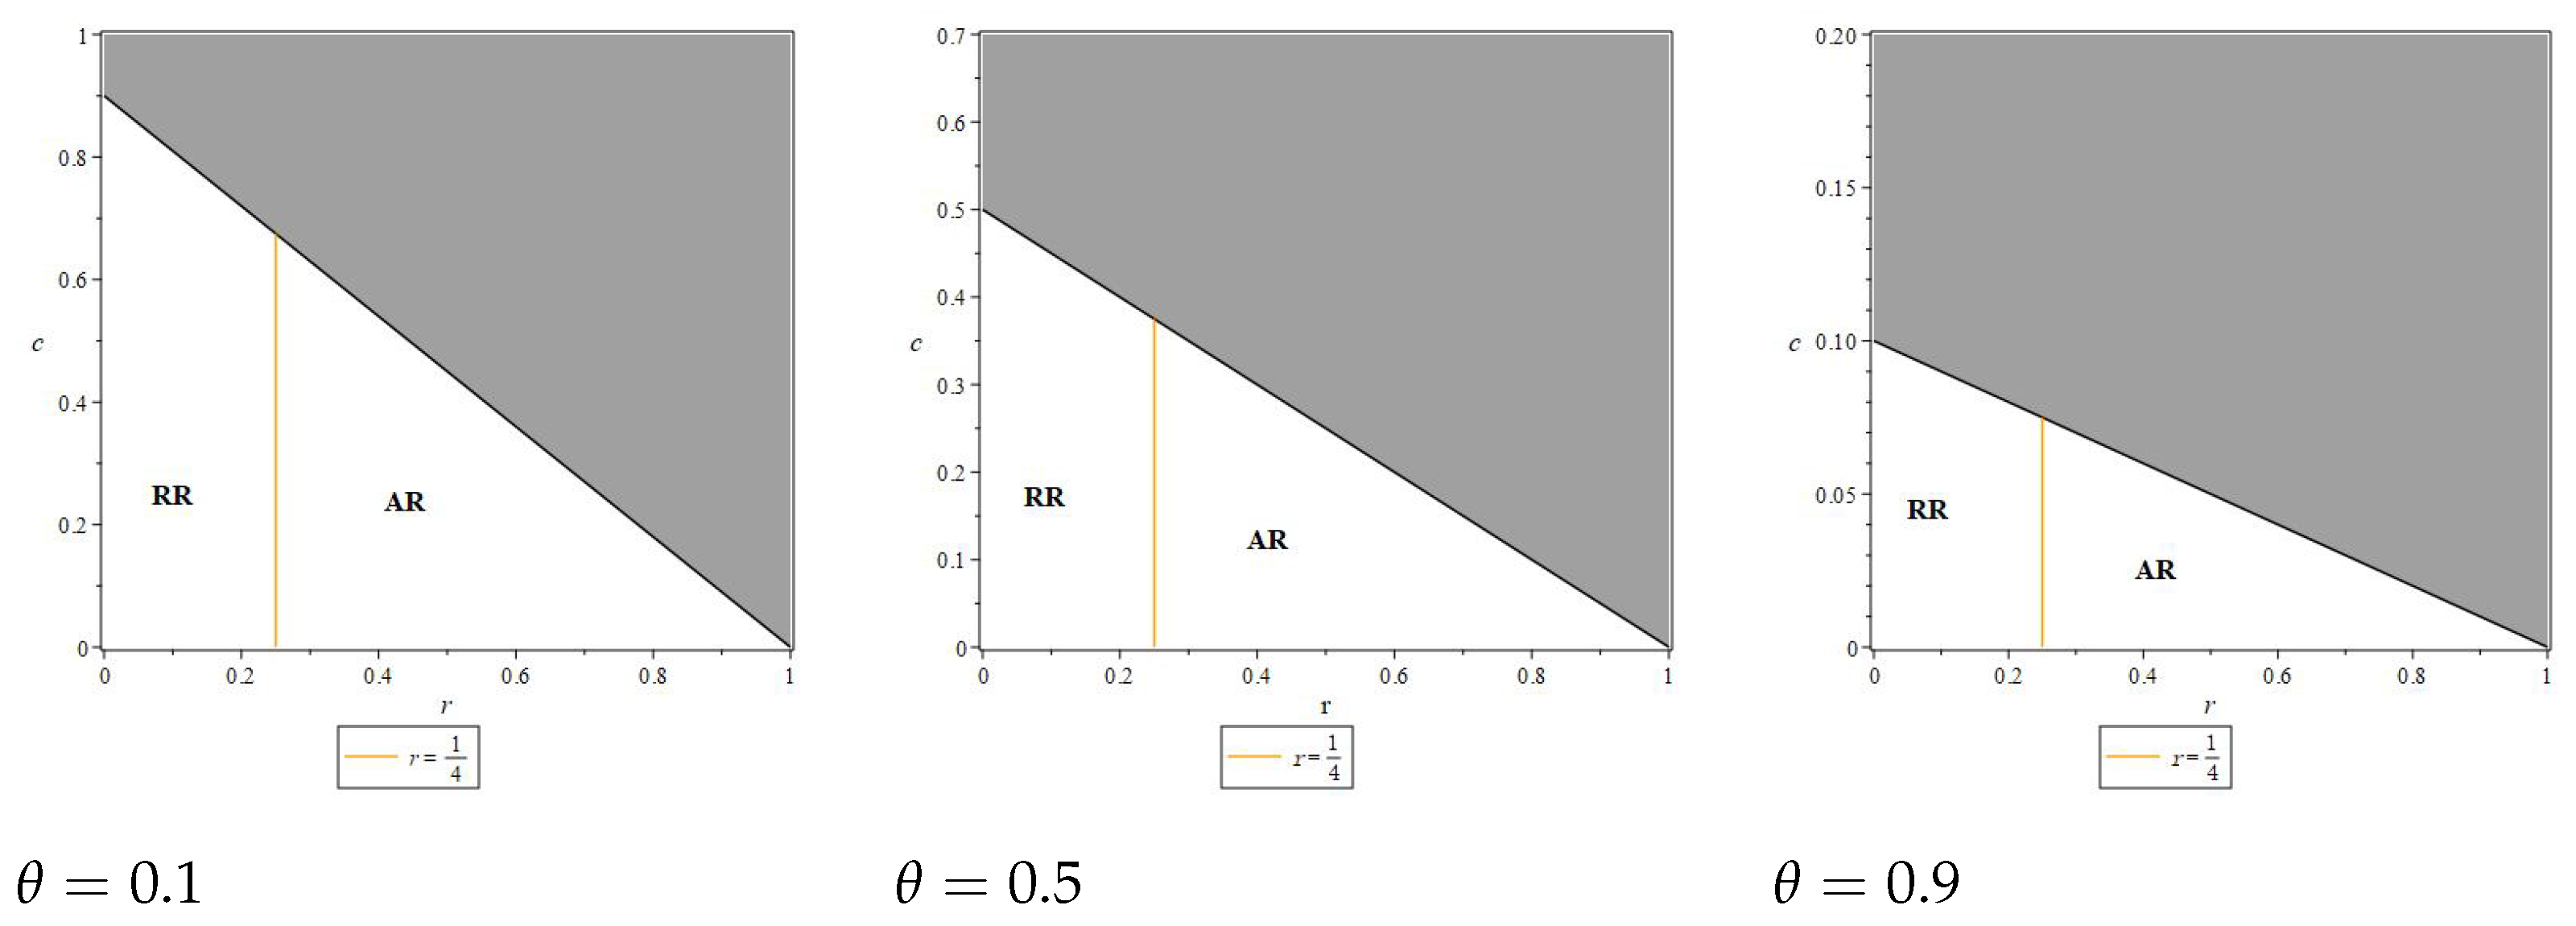
. If , then , and otherwise.
Appendix C. Proof of Corollary 5–8
In
Appendix C, we mainly compare the profits of the platform under different strategies through difference analysis to provide proofs for Corollary 5 to Corollary 8. In
Appendix C.1, we compare the profits of the platform under the RA strategy and the AAstrategy; in
Appendix C.2, we analyze the profits of the platform under the RA strategy and the AR strategy; in
Appendix C.3, we compare the profits of the platform under the RA strategy and the RR strategy; finally, in
Appendix C.4, we compare the profits of the platform under the AR strategy and the RR strategy. These comparisons are all calculated using the difference method. In addition, through the analysis in
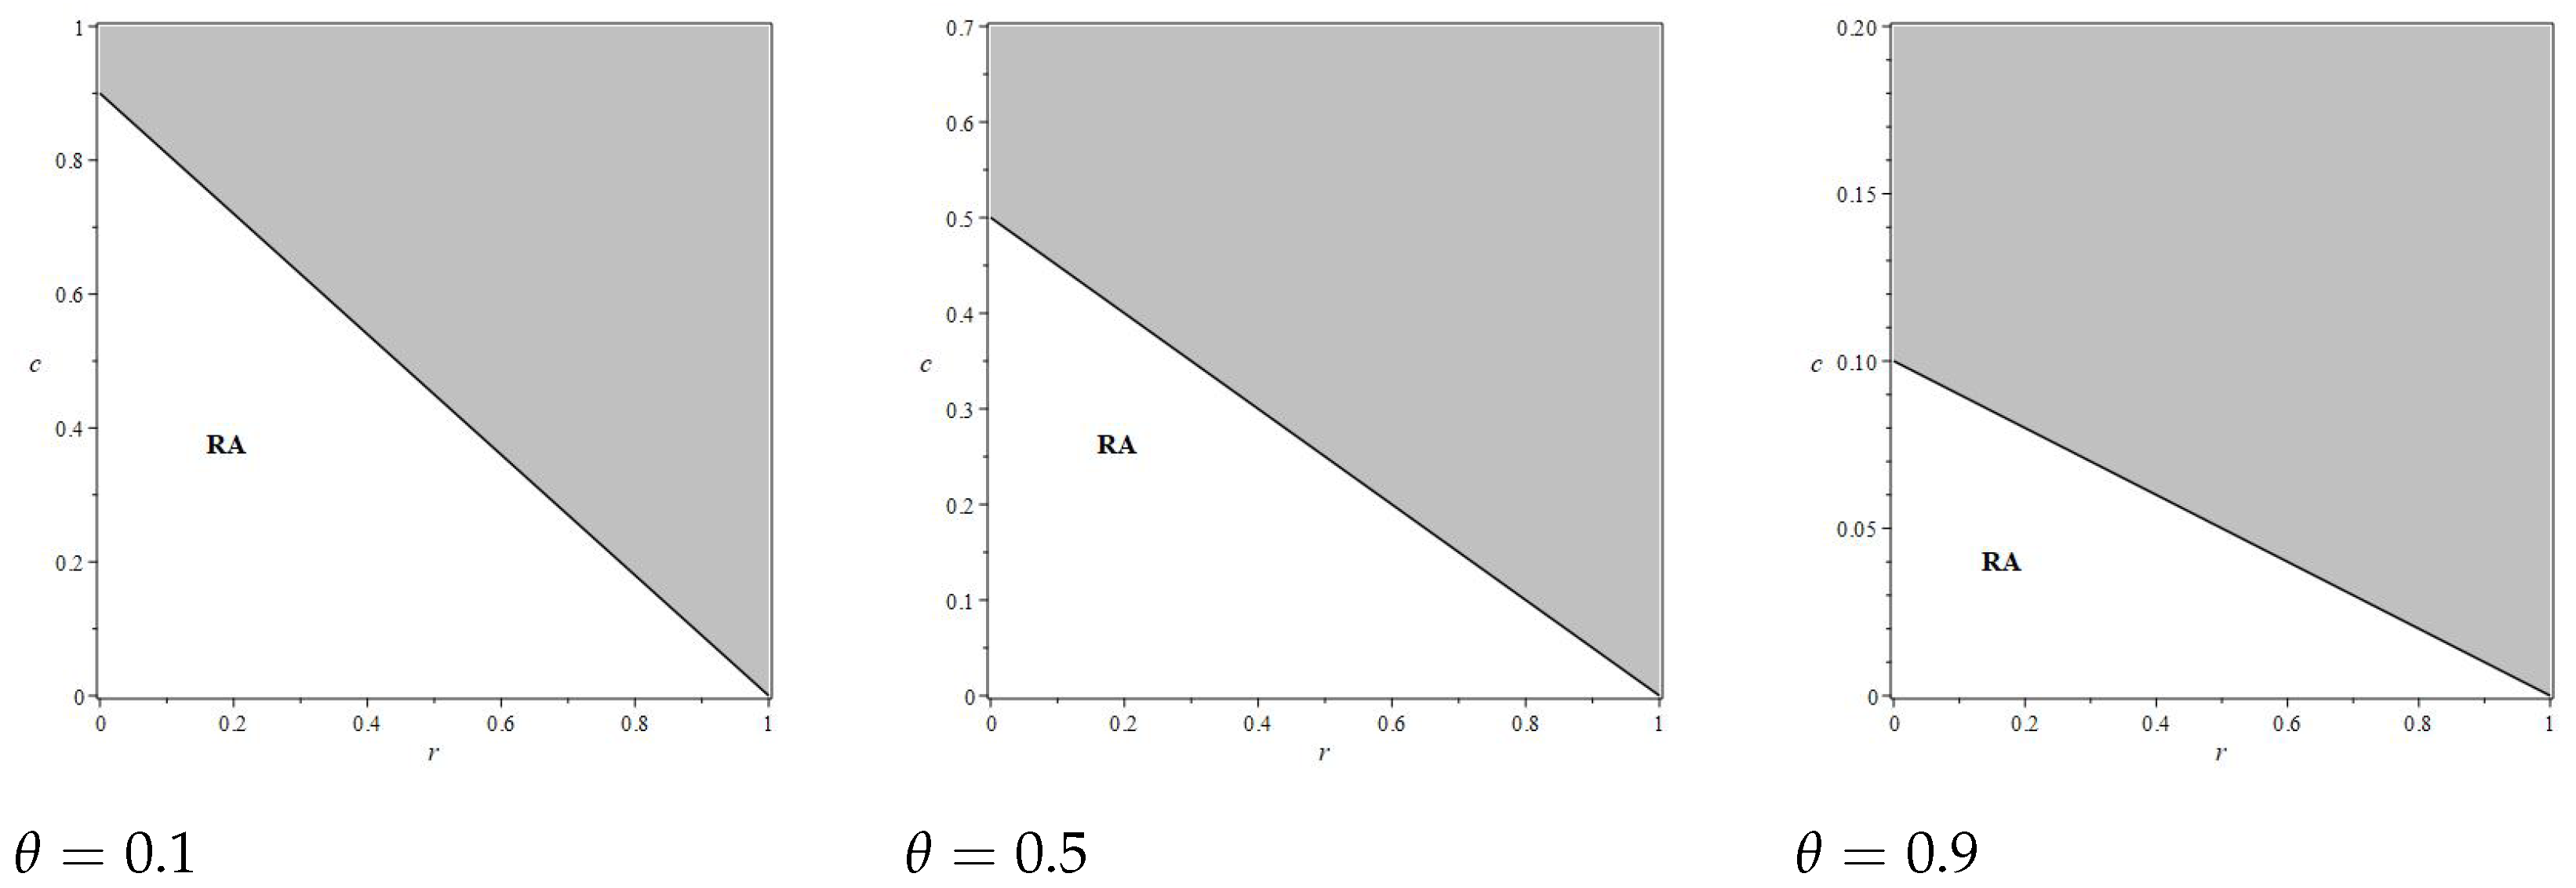
Appendix C.1, we found that for the platform, the AA strategy is always inferior to the RA strategy. Therefore, in the subsequent comparisons, we only focus on the profits of the platform under the RA strategy and the other two strategies.
Appendix C.1. Proof of Corollary 5
Appendix C.2. Proof of Corollary 6
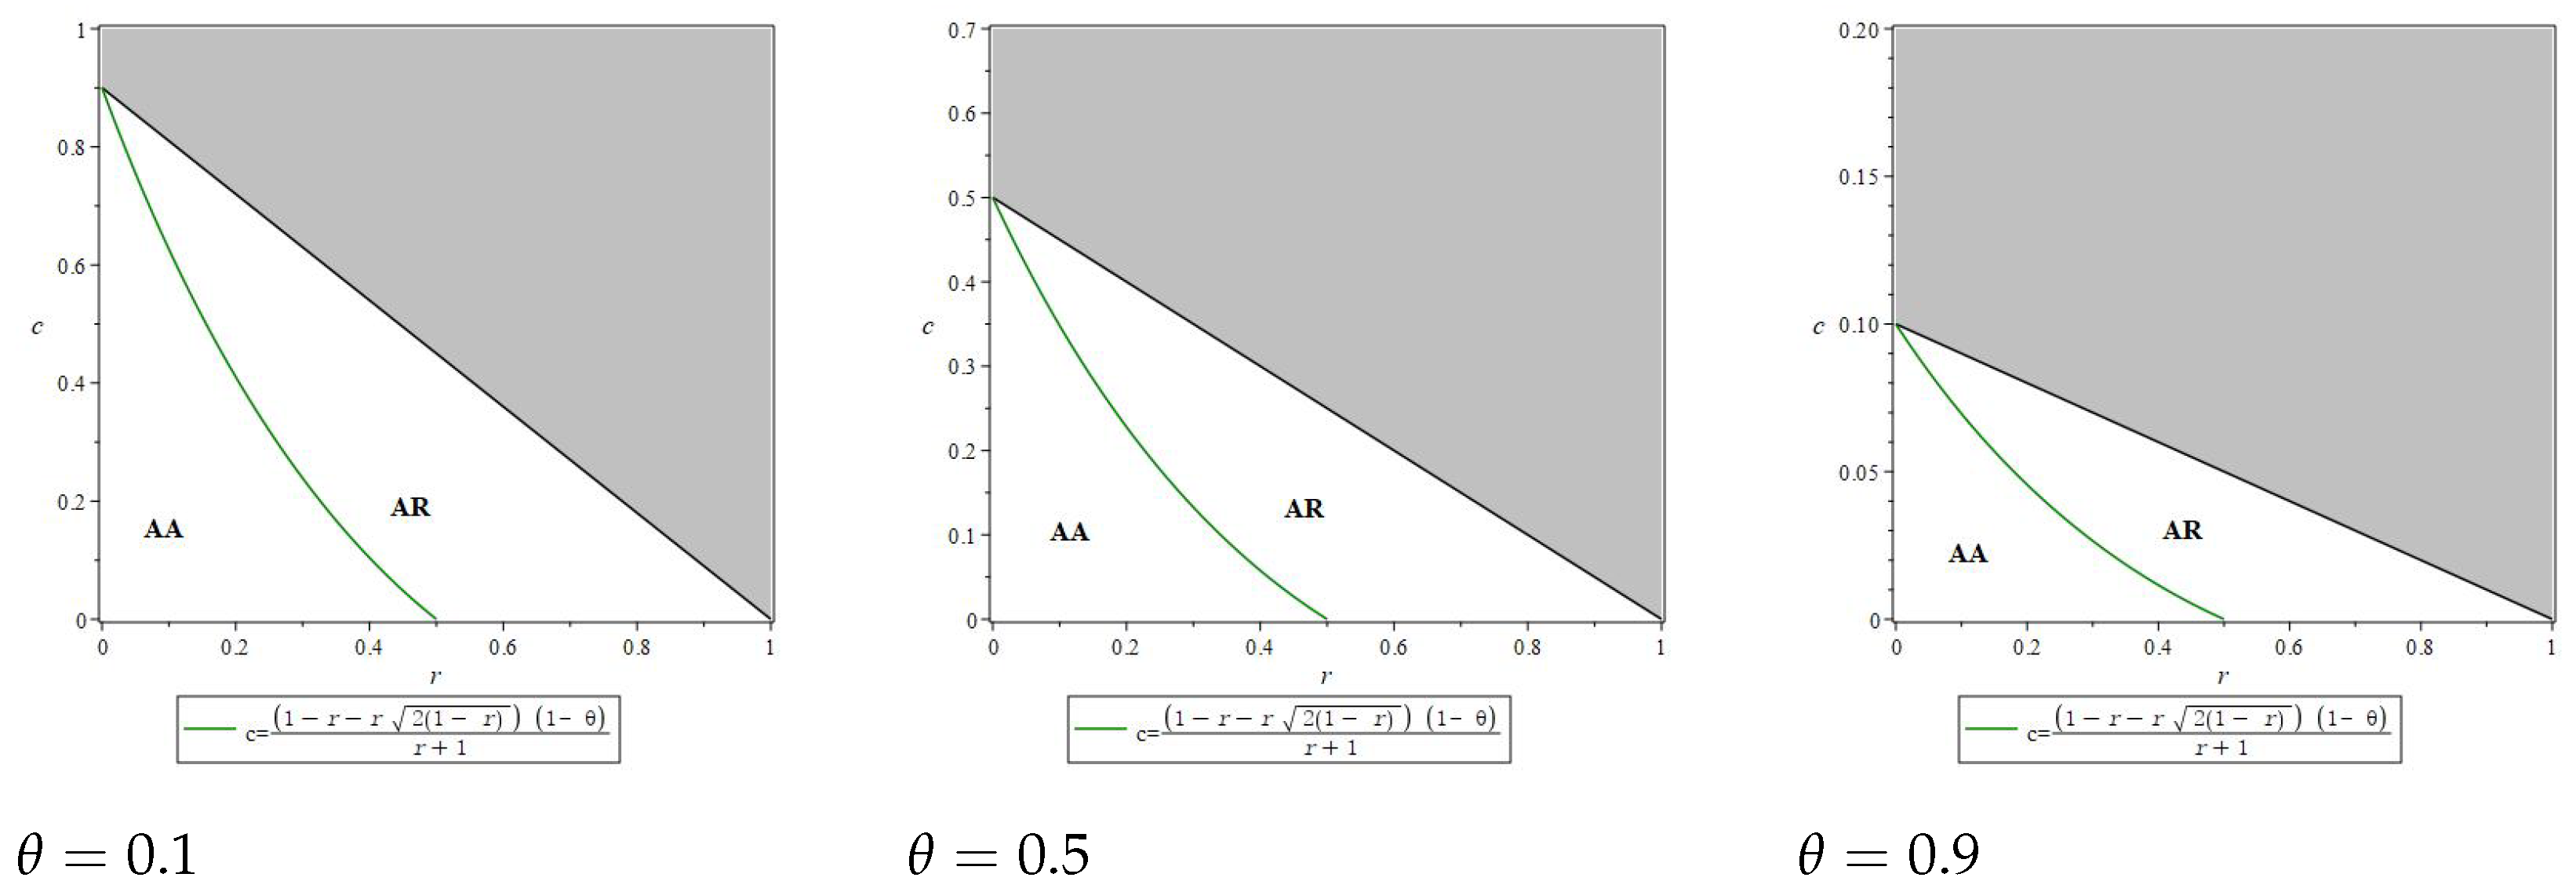
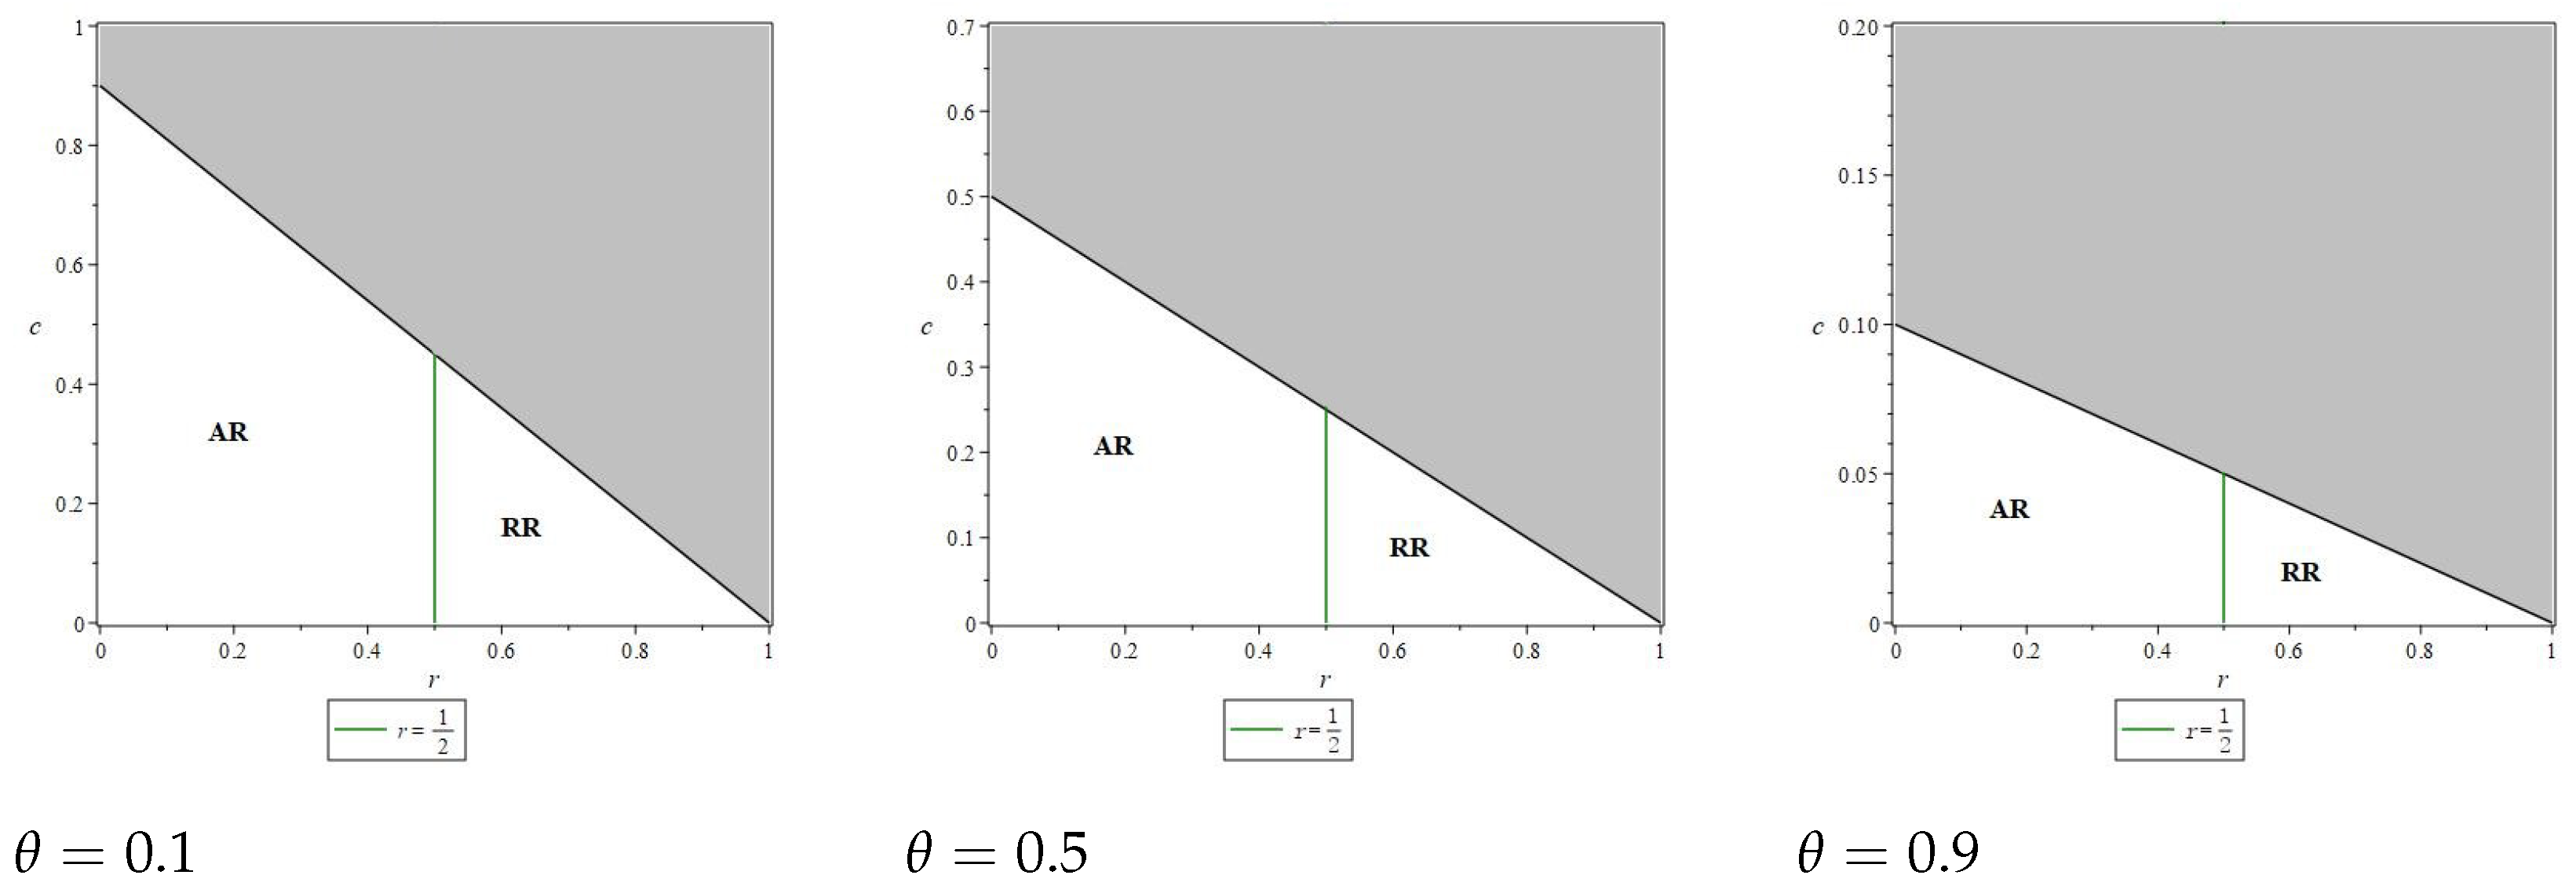
Let , we find that , so is decreasing monotonically with c in . Substituting and into , we find that and . If , then , otherwise . We find that, if , then is increasing monotonically with c in , otherwise, is increasing monotonically with c in and decreasing monotonically with c in .
Substituting , and into , we have , and . If , then , otherwise . If , then , otherwise . There is such that . When , if (1) or (2) and , then , otherwise . When , if (1) and or (2) and , then ; otherwise .
So, when , if (1) or (2) and , then , otherwise . When , if (1) and or (2) and , , otherwise .
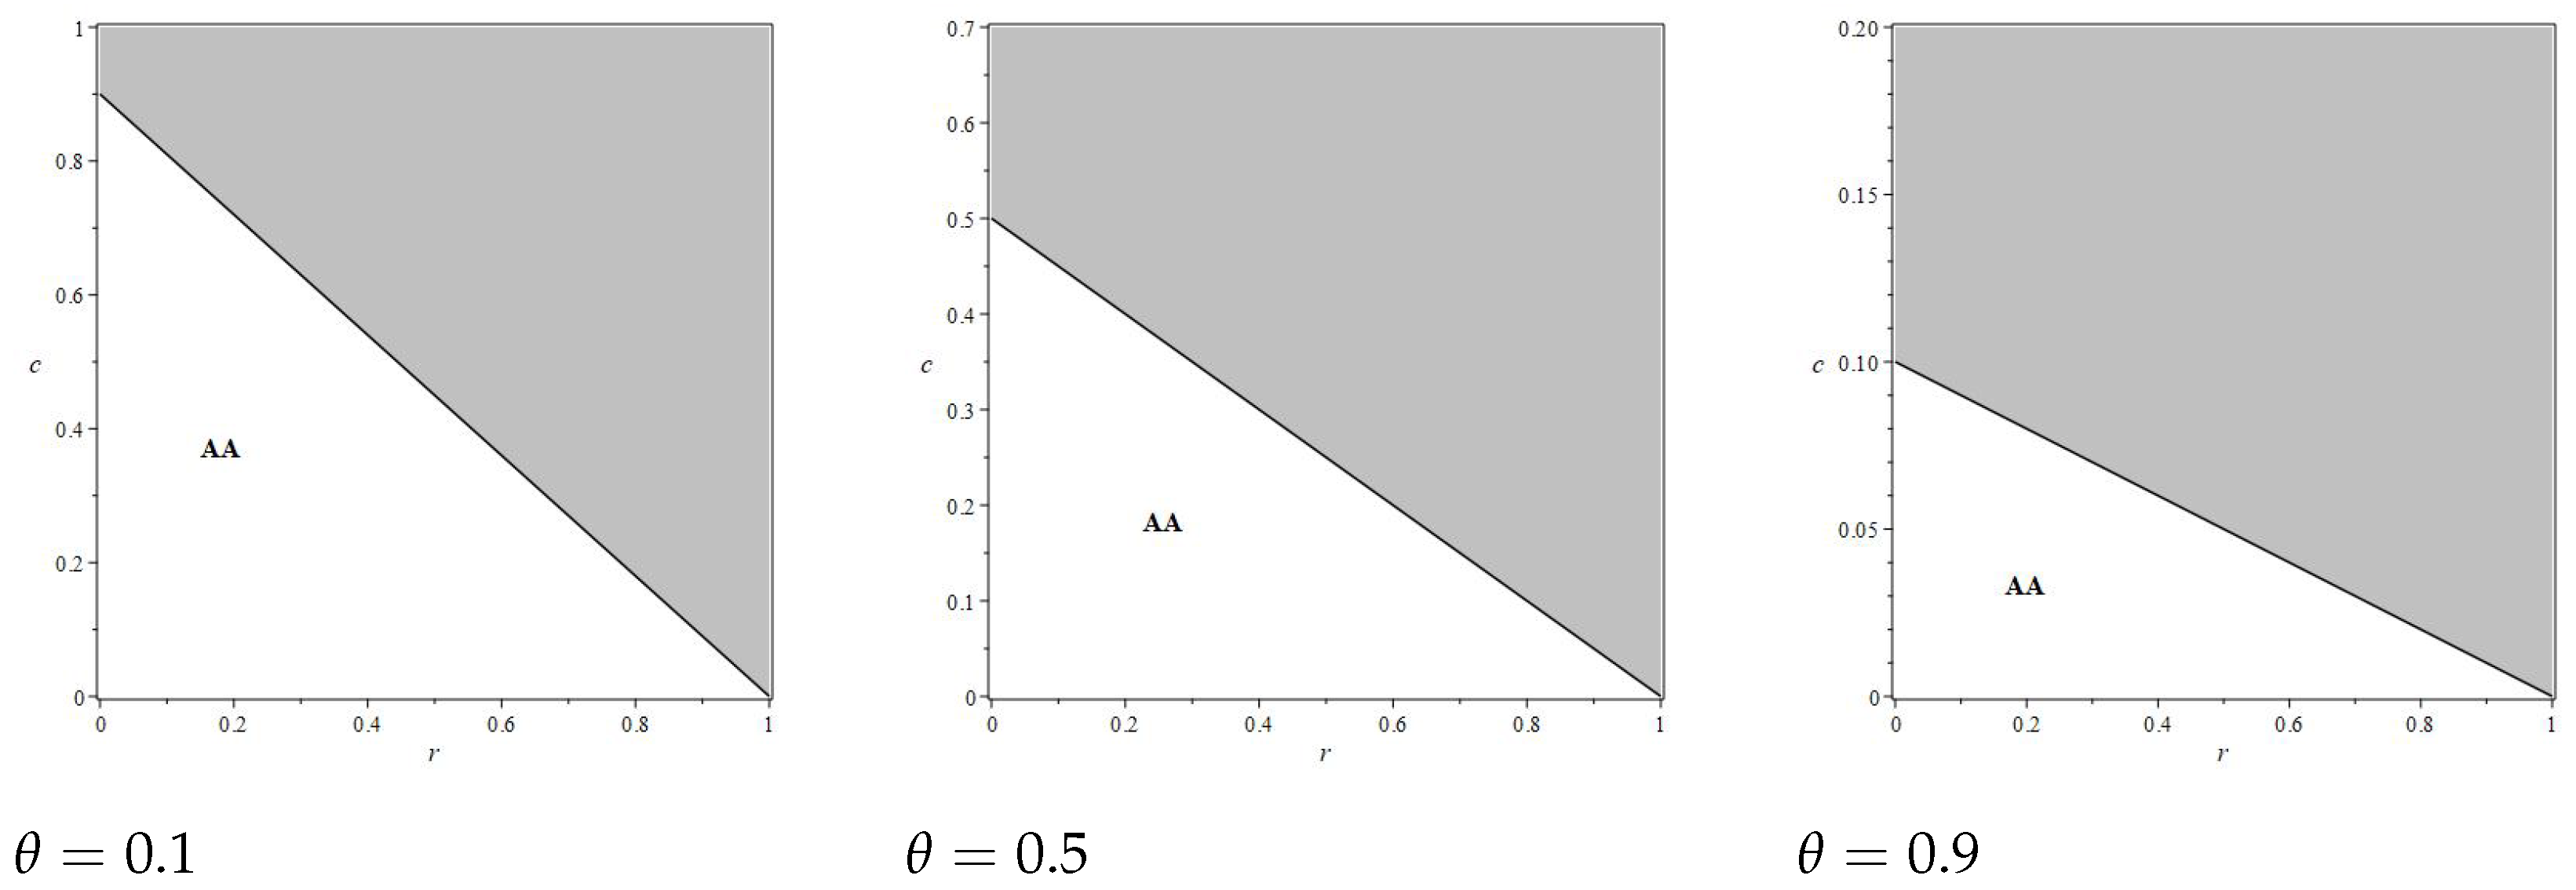
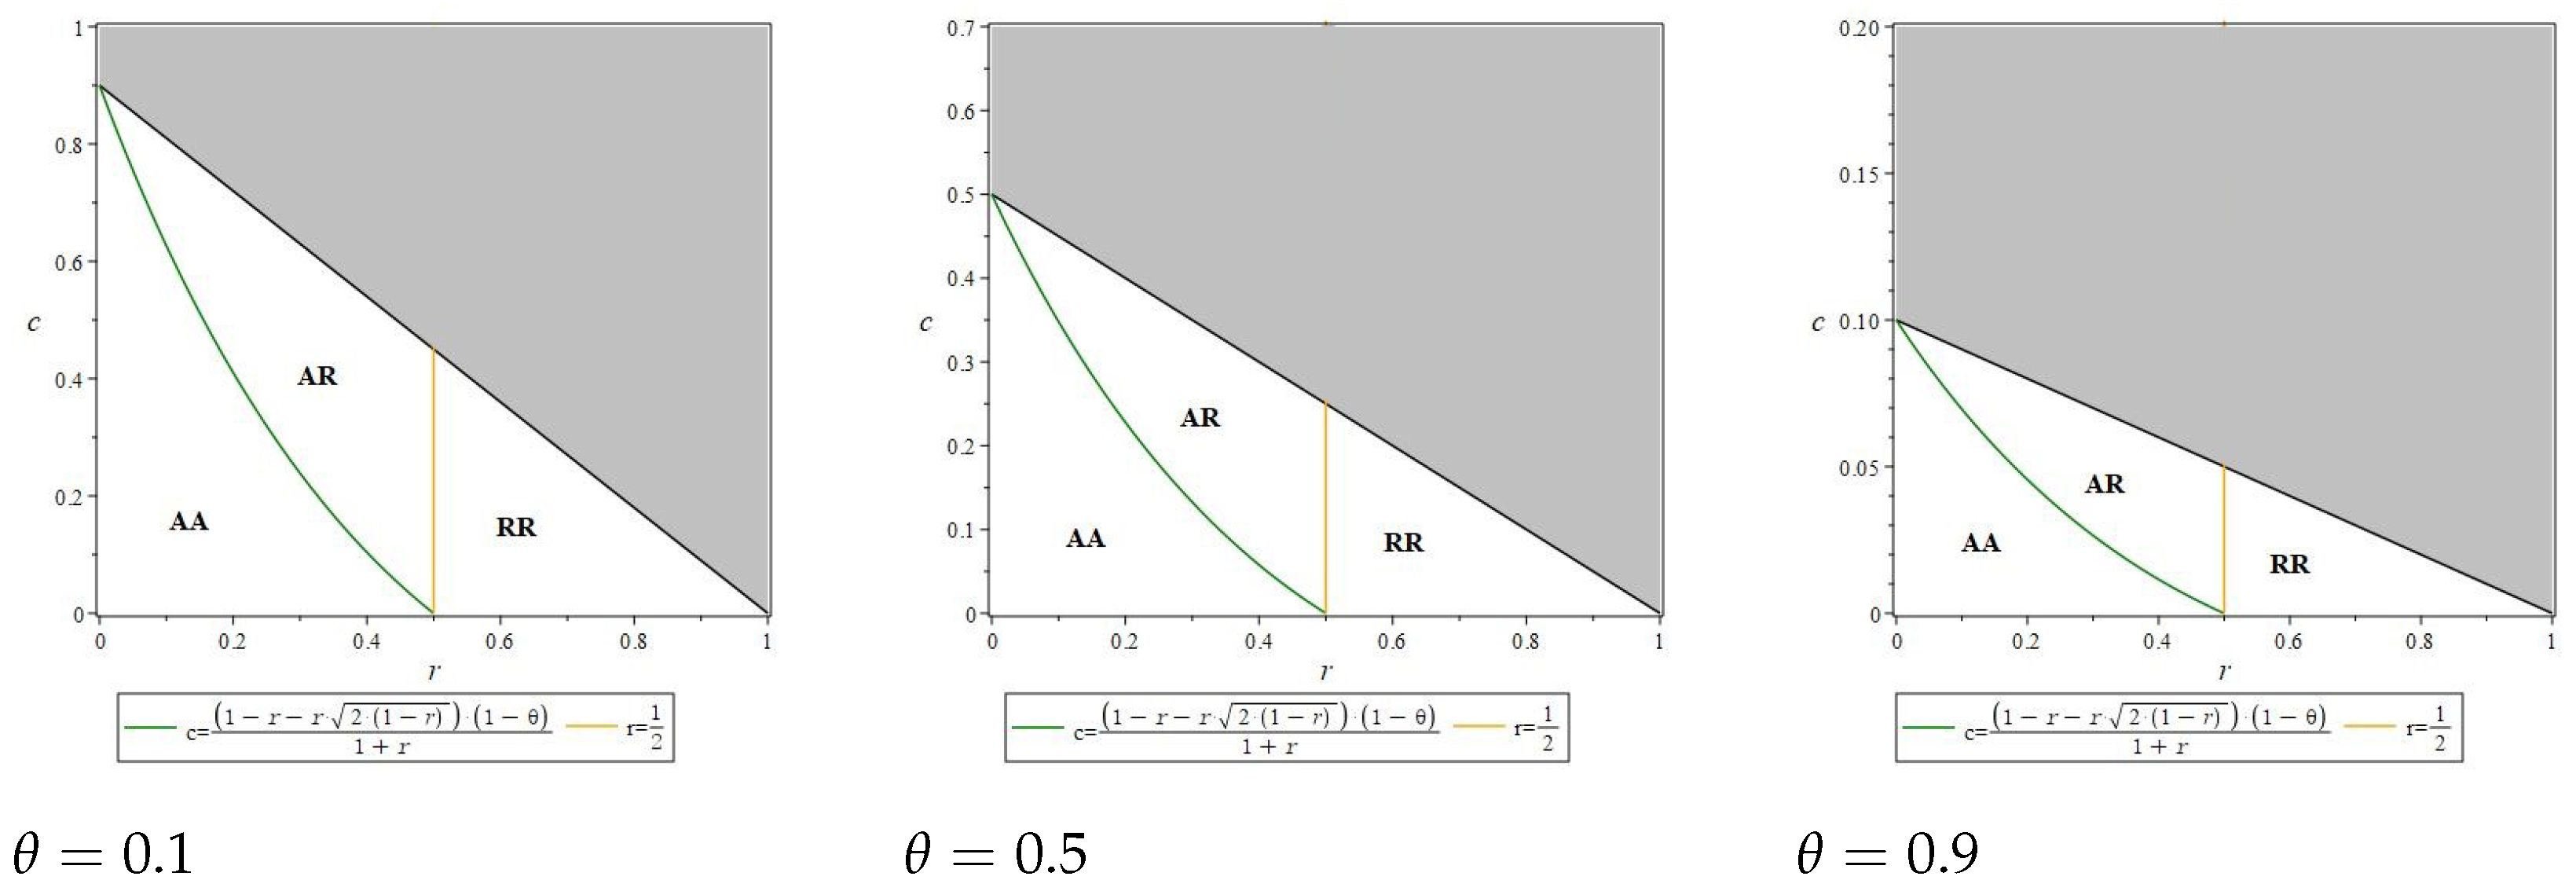
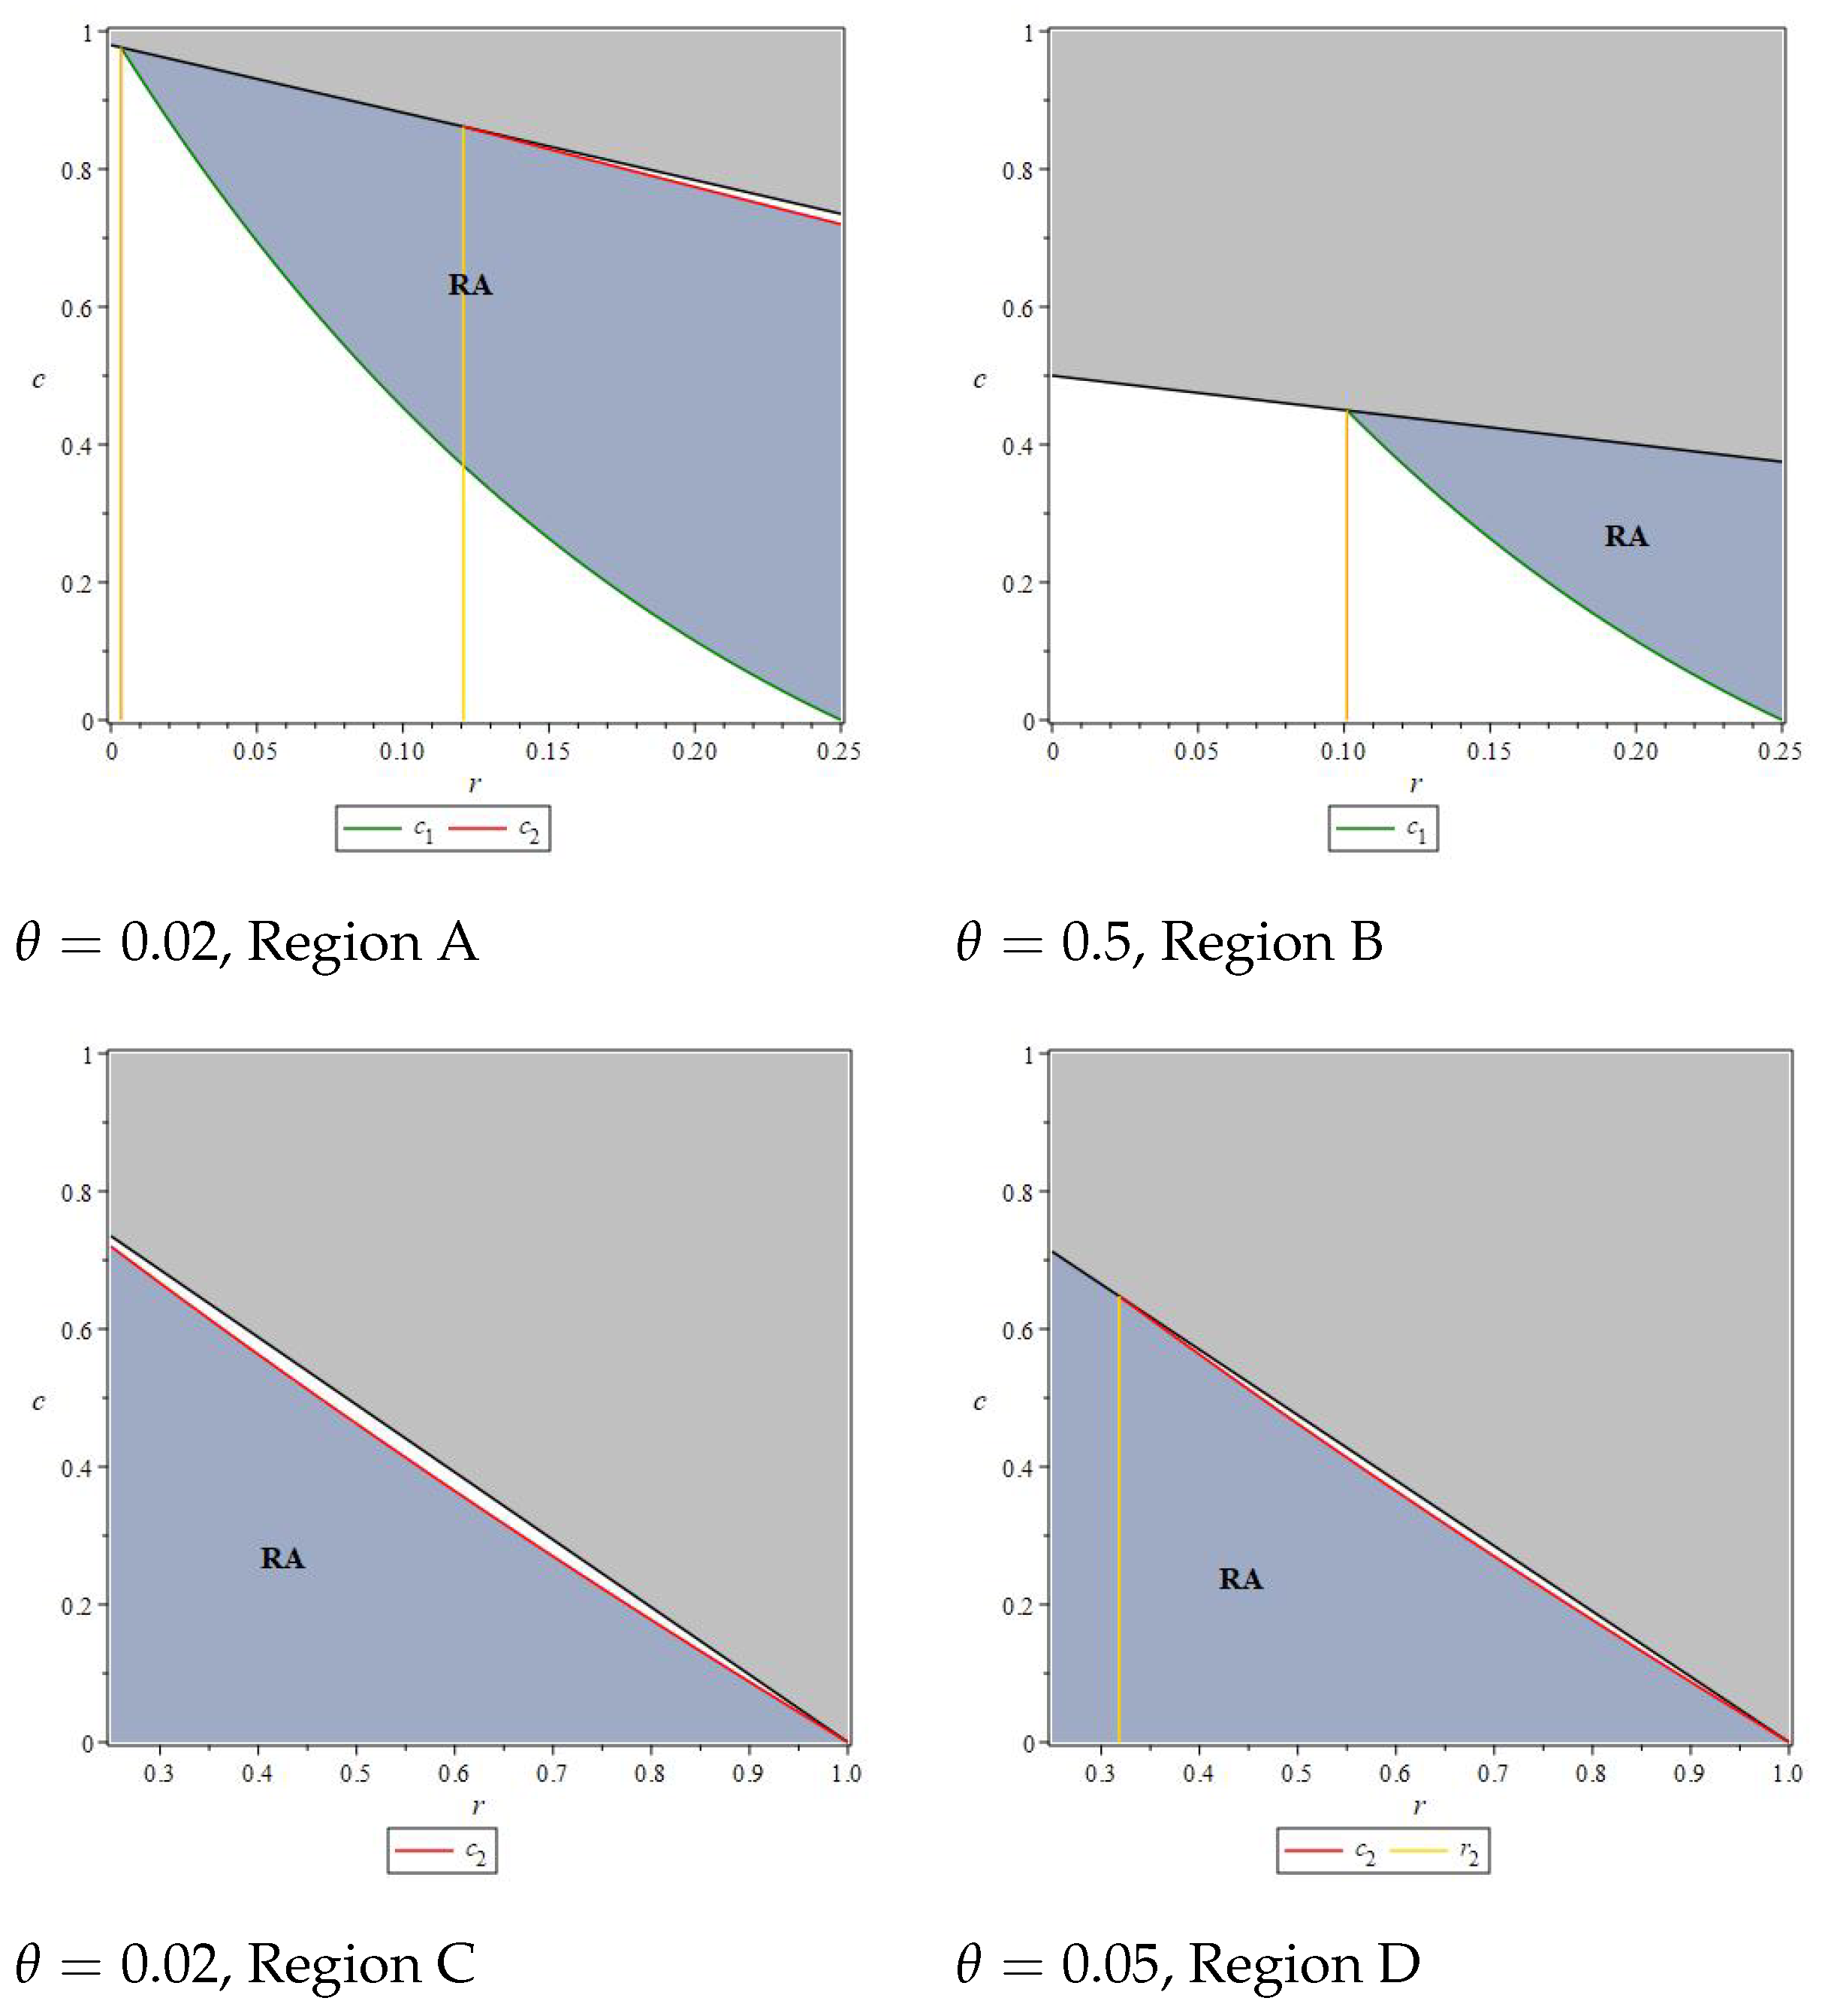
To facilitate the analysis of the differences in mode preferences between suppliers and e-commerce platforms, we transformed the results to obtain a more detailed comparison.
(a). In Region A (, ). If (1) and , (2) and , then , otherwise .
(b). In Region B (, ). If , then , otherwise .
(c). In Region C (, ). If , then , otherwise .
(d). In Region D (, ). If (1) , (2) and , then , otherwise .
(e). In Region E (, ), .
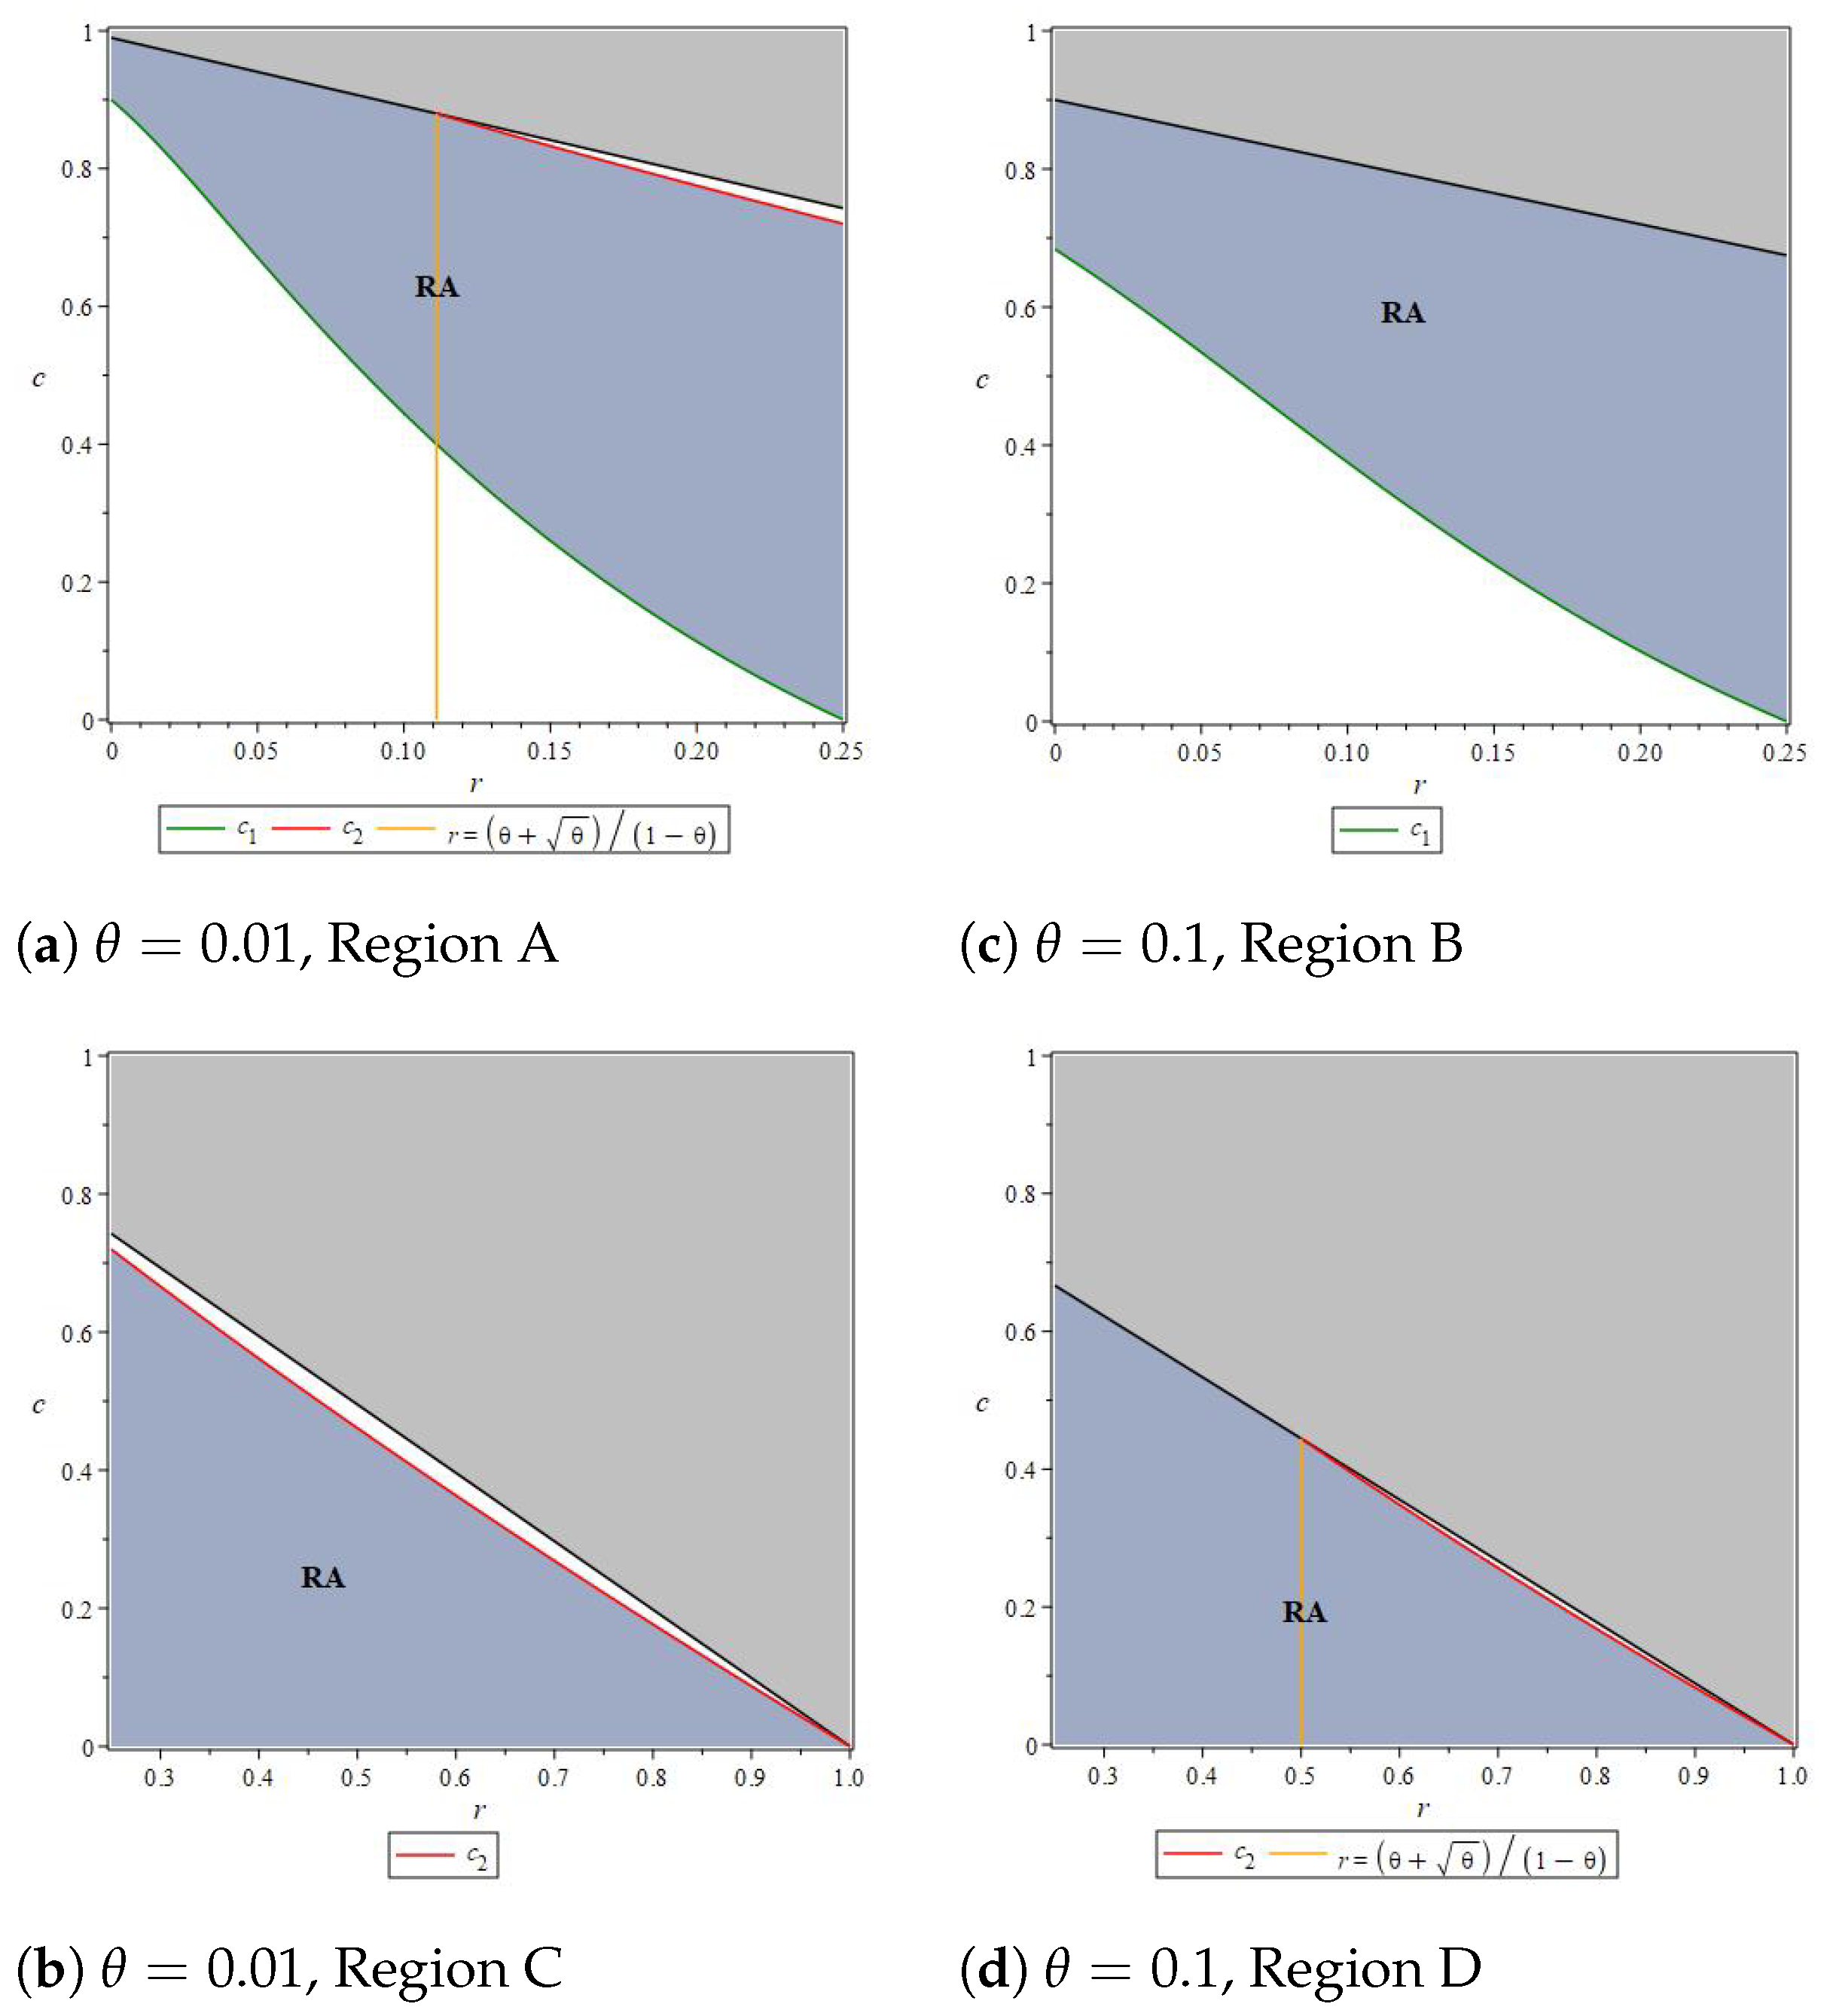
Appendix C.3. Proof of Corollary 7
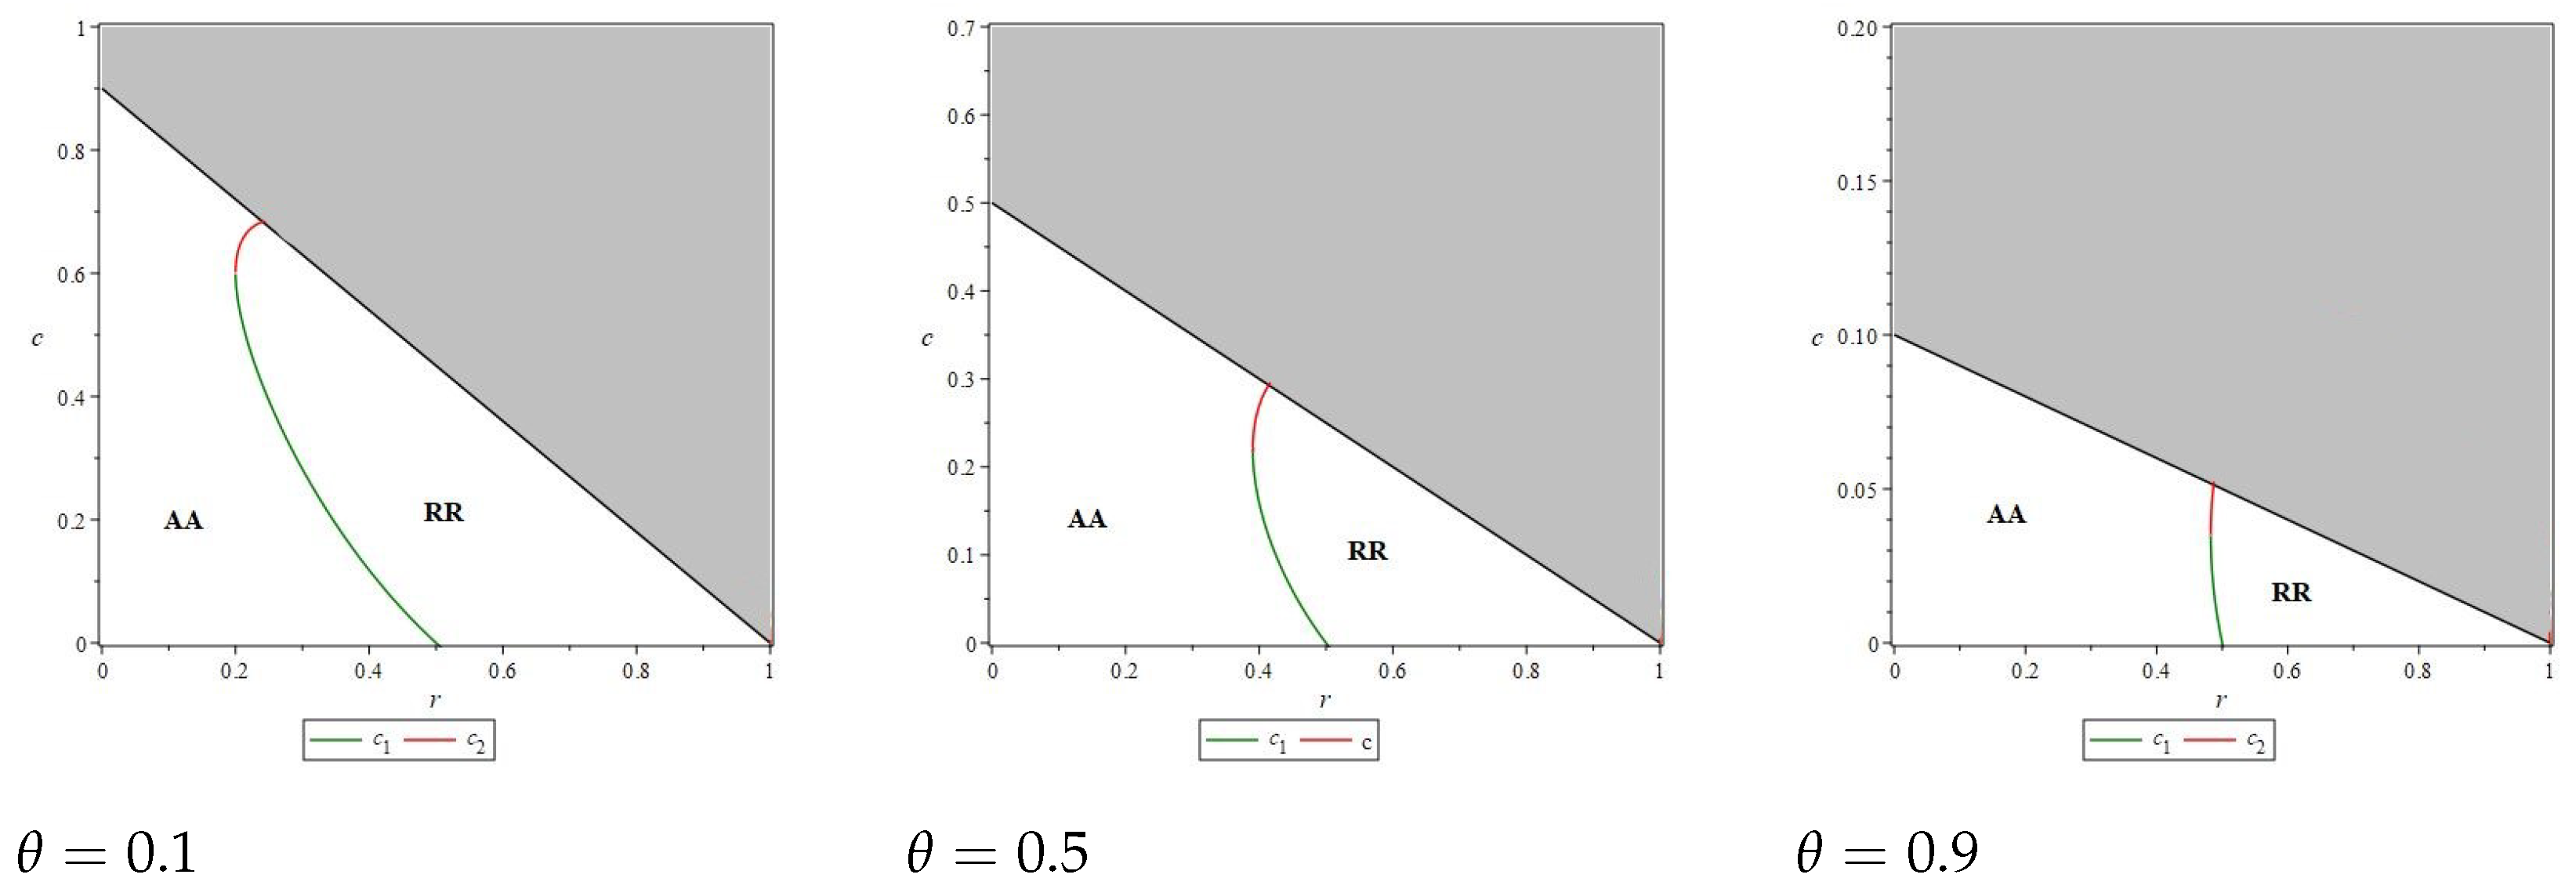
Let , we have . is decreasing monotonically with c in . Substituting and into , we find that and . If , then , otherwise . We find that, if , then is increasing monotonically with c in , otherwise, is increasing monotonically with c in and decreasing monotonically with c in .
Substituting , and into , we have , and . If , then , otherwise . If and , then , otherwise .
There is such that . When , if (1) or (2) and , then , otherwise . When , if (1) and and or (2) and , then , otherwise .
So, when , if (1) or (2) and , then ; otherwise . When , if (1) and and or (2) and , then , otherwise .
To facilitate the analysis of the differences in mode preferences between suppliers and e-commerce platforms, we transformed the results to obtain a more detailed comparison.
(a). In Region A (, ). If (1) and , (2) and , then , otherwise .
(b). In Region B (, ). If and , then , otherwise .
(c). In Region C (, ). If , then , otherwise .
(d). In Region D (, ). If (1) , (2) and , then , otherwise .
(e). In Region E (, ), .
Appendix C.4. Proof of Corollary 8
. If , then , otherwise .
Appendix D. Extension
In the basic model, we examine a supply chain consisting of one supplier and one platform. In the expanded model, we introduce a competitive supplier (CS), who competes in the market with the original supplier. This competitive supplier offers NG products and sells them through the platform as an agent, engaging in quantity competition with the original supplier. The assumptions regarding consumer preferences for MIG products and NG products remain consistent between the expanded and basic models. Therefore, we utilize the same demand function as in the basic model. The demand for both MIG and NG products as follows:
Based on the aforementioned demand function, we can deduce the inverse demand functions for MIG products and NG products as follows:
where the
represents the demand for NG products from the original supplier, while
indicates the demand for NG products from the competitive supplier. We assume that the original supplier and the competitive supplier engage in quantity competition in the market. Therefore, the sequence of decisions for events are as follows: First, the original supplier determines the wholesale price of the product and the sales quantity under the reselling mode. Next, the platform decides on the quantity of products to be wholesaled from the original supplier. Finally, both the original supplier and the competitive supplier determine the sales quantities of the products under the agency mode. To ensure that all variables are positive, the feasible region for the relevant parameters is defined as follows:
or
.
Solution and Analysis of Extension
In this section, we outline the objective functions for the original supplier, the competitive supplier, and the e-commerce platform as they adopt different strategies, along with their corresponding optimal decisions. Since the competitive supplier consistently employs the agency mode to sell NG products, the subsequent descriptions of various scenarios primarily focus on the sales mode choices of the original supplier.
AR: Distributing NG products via the agency mode, while MIG products are offered via the reselling mode. The objective functions of suppliers and the e-commerce platform are as follows:
The best solutions are detailed below:
The profits of of suppliers and the e-commerce platform are detailed below:
RA: Distributing NG products via the reselling mode, while MIG products are offered via the agency mode. The objective functions of suppliers and the e-commerce platform are as follows:
The best solutions are detailed below:
The profits of of suppliers and the e-commerce platform are detailed below:
AA:NG and MIG products are offered via the agency mode. The objective functions of suppliers and e-commerce platforms are as follows:
The best solutions are detailed below:
The profits of of suppliers and e-commerce platforms are detailed below:
RR: NG and MIG products are offered via the reselling mode. The objective functions of suppliers and e-commerce platforms are as follows:
The best solutions are detailed below:
The profits of of suppliers and e-commerce platforms are detailed below:
By substituting the solved variables into the inverse demand function, we can determine the retail and wholesale prices of products under different conditions. Through comparison, we find that under certain conditions, even in the presence of a competitive supplier, employing different sales methods for various products can still alleviate the double marginalization effect.
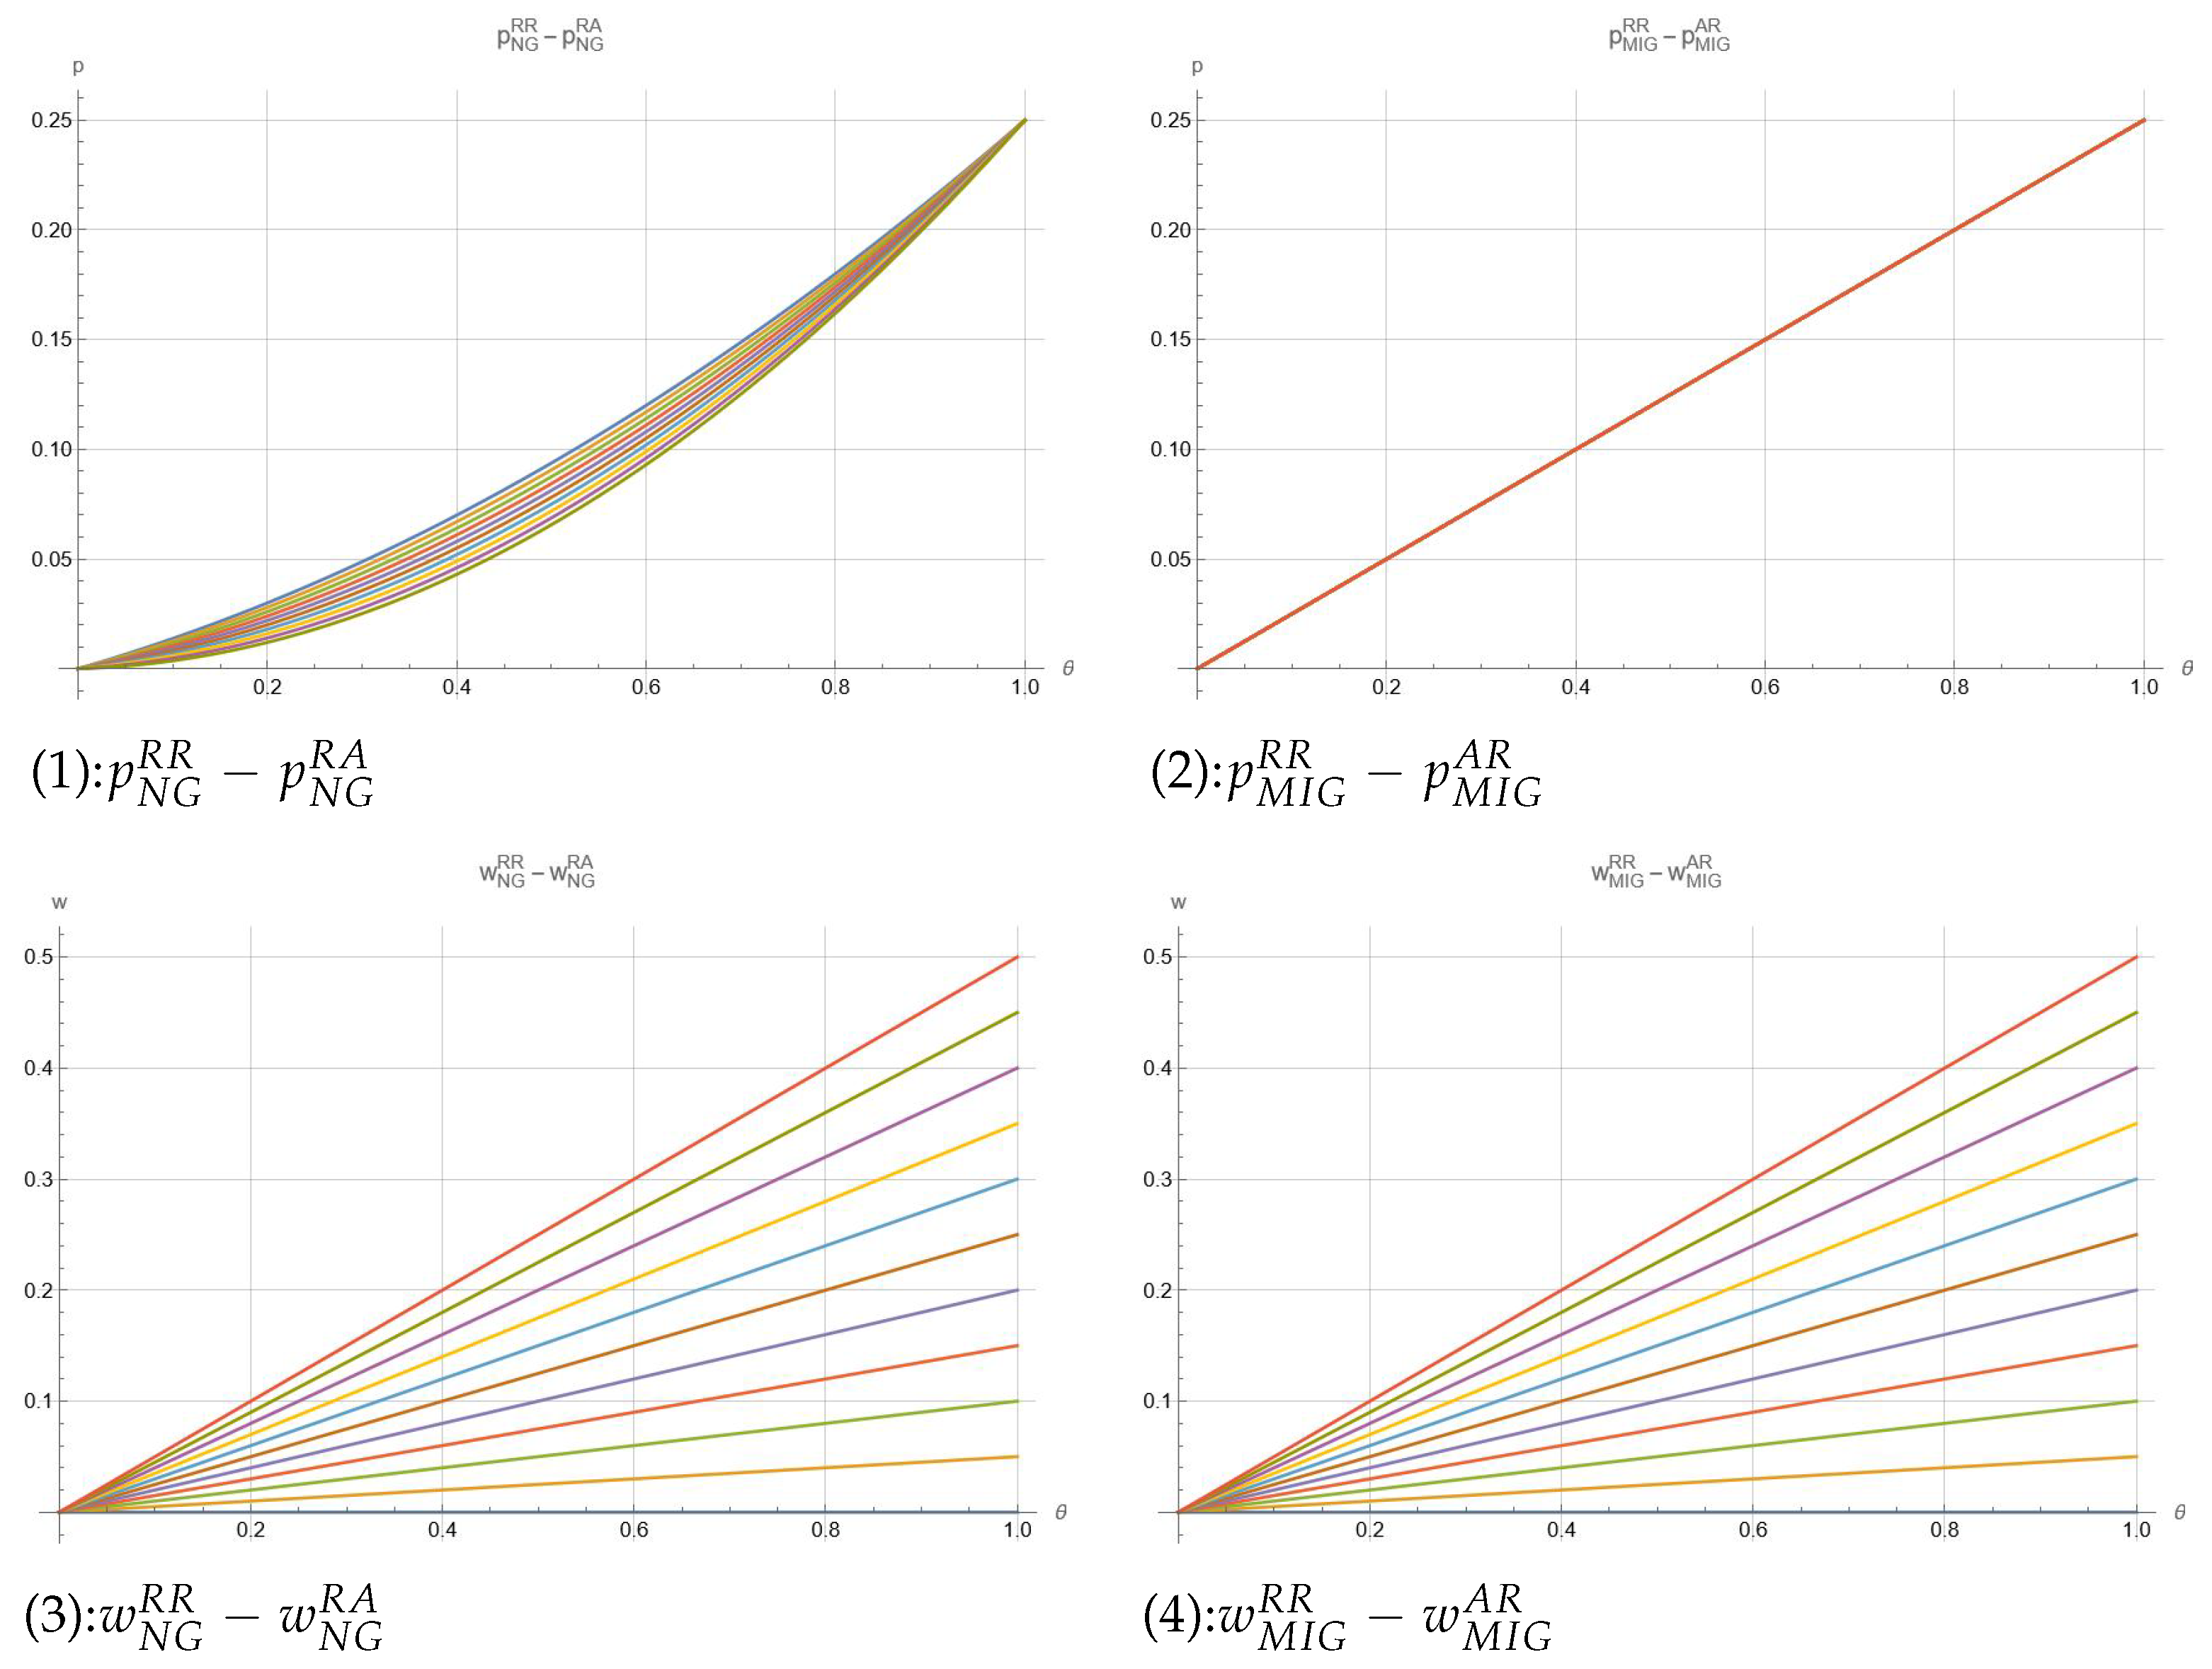
Lemma A1. , (Region I: ).
Lemma A1 suggests that in Region I, when MIG and NG products are originally distributed via the reselling mode, transitioning one of them to the agency mode results in a decline in the wholesale price of the other product. The underlying economic mechanism remains consistent with the baseline model: selling through the same mode entails purely vertical competition, whereas employing distinct modes introduces both vertical and horizontal competitive dynamics. In such cases, suppliers are likely to adopt strategic pricing adjustments to encourage e-commerce platform partners to uphold their procurement agreements.
Lemma A2. , (Region I: ).
Lemma A2 shows that in region I, when MIG and NG products are originally distributed through the reselling mode, transitioning one of the products to the agency mode leads to a decrease in the retail price of the other product in the reselling mode. The decrease in retail price is because the shift from the dual-reselling mode to the reselling + agency mode changes the competitive dynamics between the two product types. When one product moves to the agency mode, it creates price pressure that is passed on to the products that remain in the reselling mode, ultimately benefiting consumers through lower retail prices. These results further confirm that adopting different modes for MIG and NG products can effectively alleviate the challenges of dual marginalization, thereby improving overall supply chain efficiency.
According to the results of this model, we found that under some conditions in a competitive environment, we still observed the same trend as in previous studies. Therefore, the findings of this study also hold true within a certain range in a competitive environment.


