Article

Analysis of Service Quality in Smart Running Applications Using Big Data Text Mining Techniques

Department of Sports Science Convergence, College of Arts, Dongguk University, Seoul 04620, Republic of Korea
*
Author to whom correspondence should be addressed.
J. Theor. Appl. Electron. Commer. Res. 2024, 19(4), 3352-3369; https://doi.org/10.3390/jtaer19040162
Submission received: 4 September 2024 / Revised: 25 November 2024 / Accepted: 27 November 2024 / Published: 29 November 2024
(This article belongs to the Topic Online User Behavior in the Context of Big Data)

Abstract

:
In the rapidly evolving digital healthcare market, ensuring both the activation of the market and the fulfillment of the product’s social role is essential. This study addresses the service quality of smart running applications by utilizing big data text mining techniques to bridge the gap between user experience and service quality in digital health applications. The research analyzed 264,330 app reviews through sentiment analysis and network analysis, focusing on key service dimensions such as system efficiency, functional fulfillment, system availability, and data privacy. The findings revealed that, while users highly value the functional benefits provided by these applications, there are significant concerns regarding system stability and data privacy. These insights underscore the importance of addressing technical and security issues to enhance user satisfaction and continuous application usage. This study demonstrates the potential of text mining methods in quantifying user experience, offering a robust framework for developing user-centered digital health services. The conclusions emphasize the need for continuous improvement in smart running applications to meet market demands and social expectations, contributing to the broader discourse on the integration of e-commerce and digital health.

1. Introduction

Historically, the health and well-being of the populace were primarily addressed within the public sector, particularly within the domain of public health [1]. However, health is now recognized as a highly valuable personal asset, which has led to the flourishing of various business ventures within the private sector [1]. Unlike in the past, when healthcare services were predominantly curative, proactive health behaviors and preventive medicine have emerged as significant components of the healthcare industry [2]. Among various health activities, running stands out due to its low entry barrier and high efficacy, attracting many participants [3]. According to a 2023 Statista survey on annual outdoor activity participation, 32% of the population engaged in jogging or running, ranking second only to hiking at 44% [4]. This figure has risen consistently, from 23% in 2021, to 27% in 2022, and to 32% in 2023, indicating a steady increase in running and jogging participation [4]. Additionally, post-pandemic, marathon participation has surged, underscoring the widespread popularity of running [4].
As interest in quality of life and the desire to improve health increase, a variety of health-related applications are being offered in the app market. Smart healthcare applications that provide tailored health behavior and exercise coaching, considering individual physical characteristics and lifestyle habits, are emerging as a dominant trend. Unlike general healthcare apps, which focus on static functionalities such as appointment scheduling or medication reminders, these smart health programs emphasize interactive and real-time features, such as personalized coaching, activity tracking, and immediate feedback. These applications cover areas such as training, exercise tracking, dietary management, and personal health information management [5]. Among these, highly advanced smart running apps that provide training coaching programs and utilize GPS and heart rate monitoring functions for running assessment and physiological evaluation are gaining widespread use [6,7]. According to Businessresearchinsight.com, the global running app market size in 2023 was USD 562 million, showing a compound annual growth rate (CAGR) of 14.2% since 2021 [8]. The Nike Run Club app surpassed 10 million downloads on the Google Play Store as of 2024, and Strava recorded 50 million downloads [8].
Despite the rapid growth of the smart running app market, research on the services themselves is relatively scarce. Understanding user experience is crucial for advancing digital healthcare technology in a safer and more effective manner [9]. Past research has focused on technological capabilities and functionalities, but to form a broad user base and ensure continuous use, exploring consumer experiences and identifying service experience elements is essential [10]. Existing studies have predominantly focused on the technical performance, efficiency, and effectiveness of fitness apps [10], investigating relationships such as user experience, continuous usage intention, and satisfaction using the Technology Acceptance Model (TAM) [10,11]. For the developed technology to stabilize in the market, it is necessary to segment the types of technology and understand the actual user experiences. Thus, narrowing the research scope from the broad category of healthcare apps to the recently developed smart health programs in application form can fill the gaps in previous studies and provide meaningful information from a practical perspective.
There has often been a gap between the introduction of new technologies and user experience. This gap can hinder the dissemination and popularization of the technology, without sufficient information on accessibility and user experience. While research on general health applications has provided foundational insights, it often remains at a broad level that does not address the specific characteristics and challenges of recent smart health programs such as smart running applications. These applications, categorized as health-promoting behaviors, carry inherent risks; improper use can lead to injuries and potentially endanger life. The interactive nature of these applications for users underscores the importance of quantifying real user experiences for effective service management. Previous studies indicate that the usability and utility of healthcare applications significantly impact user satisfaction [12], which in turn contributes to continuous application use and health improvement [12]. However, these studies frequently lack a focus on the direct VOC (Voice of the Customer) such as actual user reviews, and do not consider the particular context and service quality aspects relevant to smart running applications. Therefore, many researchers advocate for the quantification of large-scale user review data and the use of structured service evaluation frameworks to gain deeper insights into specific user experiences [12,13].
This study aims to identify the key factors of service quality by compiling all user review data from 28 smart running applications launched on app stores into a big data set and applying text mining and sentiment analysis techniques. Furthermore, we evaluate the service quality index based on derived factors to assess the strengths and weaknesses of running apps currently used in the market. Analyzing service quality using text mining techniques is an effective method to systematically assess user reviews and feedback, thereby clearly identifying the strengths and weaknesses of the application [14]. Unlike traditional research that relies on survey-based data collection, this study uses user-generated data from web sources, which reflects authentic user experiences without researcher intervention. This approach transforms unstructured data into structured insights and applies big data analysis techniques, making it particularly valuable for understanding user satisfaction, expectations, disappointments, and improvement requests. Through such analysis, this study provides a systematic analysis of the service quality of smart healthcare applications, contributing foundational data for related research and enhancing the understanding of digital intervention effects in the healthcare field. Practically, it offers actionable insights for application developers and service providers to improve user-centered services, thereby promoting user satisfaction and continuous use.

2. Theocratical Background

2.1. Mobile Analytics in Sports and Health Applications

Today, mobile applications (apps) are becoming an increasingly important part of our lives, especially in the sports and health sectors. These apps provide significant benefits through various functionalities such as recording exercise data, setting health goals, and offering personalized exercise plans. Mobile devices like smartphones, tablets, and smartwatches run these apps using a specific operating system (OS) such as Android, iOS, or Windows Phone OS. Most apps are available for download online from app stores like the Apple Store, Google Play, and the Amazon App Store. According to Statista, as of June 2017, there were five million apps available for download from the Apple Store and Google Play alone [15]. App stores also provide opportunities for users to comment on and rate apps, giving valuable feedback to developers and other users [15].
Mobile analytics can generally be divided into two types: mobile web analytics and app analytics. Mobile web analytics aims to capture the characteristics, actions, and behaviors of visitors to a mobile company’s website [16]. This is very similar to traditional website analytics, which collect and analyze various user data such as page views, clicks, demographic information, and device-specific data [16]. Nowadays, it is crucial for all company websites to be mobile-friendly. If a company fails to create a mobile-compatible website environment, it risks losing customers and business [17].
Mobile app analytics focuses on understanding and analyzing the characteristics, actions, and behaviors of mobile app users [16]. Today, most organizations, whether large corporations or small businesses, use mobile apps to drive sales, enhance brand loyalty, and enable purchases with just a few swipes. In the sports and health sectors, through mobile apps on their smartphones, customers engage in various health management activities, such as planning workouts, receiving real-time feedback, and analyzing their exercise data [13]. Their experiences within the app are also recorded. Therefore, companies need to thoroughly understand customer characteristics by analyzing feedback left by users to gain a competitive advantage. In this context, this study focuses specifically on mobile app analytics using text mining techniques.
Mobile analytics plays a particularly significant role in the sports and health sectors. Healthcare and fitness apps greatly enhance user experience by providing personalized exercise plans, real-time feedback, and post-exercise analysis features [11,13]. For example, smart running coaching apps help users systematically manage their exercise data, thereby fostering an environment conducive to health improvement [7]. These apps analyze users’ exercise habits, preferences, and feedback to promote continuous use and increase user satisfaction [7]. Previous research indicates that the usability and utility of healthcare apps significantly impact user satisfaction, which in turn contributes to continuous app use and health improvement [9]. For instance, a study conducted on the Nike Run Club app demonstrated that personalized coaching and real-time feedback significantly increased user engagement and satisfaction, leading to improved health outcomes [18]. Another research on the Strava app found that social features, such as sharing exercise achievements and participating in challenges, enhanced user motivation and adherence to regular exercise routines [19].
Therefore, this study aims to analyze user reviews of smart healthcare running apps using big data text mining techniques to identify the key factors of service quality. This analysis will provide practical insights for developing user-centered smart running apps, offering actionable guidelines that can enhance user satisfaction and promote continuous use. Ultimately, this will contribute to the advancement and widespread adoption of smart healthcare running apps.

2.2. Sports Application User Experience and Text Mining Research

As discussed earlier, the role of mobile applications in the sports and health sectors is becoming increasingly significant. Sports applications offer users numerous benefits through various functionalities such as recording exercise data, setting health goals, and providing personalized exercise plans [20]. These apps play a crucial role in helping users systematically manage their exercise data, thereby fostering an environment conducive to health improvement [20].
Recently, text mining has emerged as a crucial tool for analyzing user experiences in sports and health applications [21,22]. Text mining deals with extracting and analyzing business insights from textual elements like comments, reviews, tweets, and blog posts [22]. Additionally, sentiment analysis modules are used to structure unstructured data to understand user sentiments or identify new themes and topics [22]. Organizations utilize text mining techniques to extract hidden valuable meanings, patterns, and structures from user-generated reviews for business intelligence purposes [14]. For instance, text analytics are beneficial for quickly and accurately understanding emotions and sentiments expressed in online channels related to a brand or a new product launch [17]. Text analytics has evolved into a well-established field rooted in various domains, including data mining, machine learning, natural language processing, knowledge management, and information retrieval [22]. Through natural language processing and machine learning technologies, text mining can extract, analyze, and interpret hidden business insights from the unstructured textual elements of social media content or online reviews [23].
Sentiment analysis, another application of text mining, focuses on the automatic extraction of positive or negative comments from text data [24]. Since text often contains a mix of positive and negative sentiments, it is generally useful to identify the polarity (positive, negative, or neutral) and the intensity expressed [24]. Sentiment analysis can scan and monitor online information to identify important situations, major problems, and new events [25]. The most commonly used sentiment analysis algorithms include SVM (Support Vector Machine), Naive Bayes, Maximum Entropy, and Matrix Factorization, and these classify text as positive or negative [24]. As the amount and value of online texts have grown substantially, researchers’ interest in sentiment analysis has increased. Shoppers regularly read posted reviews before choosing a product, hotel, or restaurant, and better reviews help generate higher profits [26].
The application of data mining techniques in sports has expanded significantly, offering new insights and improving various aspects of sports management and performance. For instance, Rossi et al. [27] focused on using data mining techniques to predict and prevent injuries in athletes by analyzing historical injury data and training load metrics, underscoring the importance of data-driven approaches in athlete health management. Additionally, Kennedy et al. [28] examined the use of text mining to analyze social media interactions among sports fans, providing insights into fan engagement and reactions to various events, which are pivotal for sports marketing and fan relationship management. Furthermore, Constantinou and Fenton [29] applied Bayesian networks to predict football match outcomes, illustrating the growing sophistication of predictive analytics in sports by integrating various data sources to develop robust predictive models.
As mentioned above, many studies in various service management fields have measured service quality using sentiment analysis, but there has been little research measuring the service quality of sports applications through sentiment analysis. Understanding the user experience of sports and healthcare apps is crucial. By analyzing textual data, such as user reviews, we can evaluate the quality of services these apps provide and identify areas for improvement to better meet user needs and expectations. This, in turn, enables smart healthcare and fitness apps to offer more effective personalized services, increasing user engagement and satisfaction. In conclusion, this study aims to deeply analyze the user experience of sports applications through text mining techniques, and propose methods for evaluating service quality based on this analysis. This will provide valuable insights for user-centered service improvements, contributing significantly to the development and dissemination of sports and healthcare apps and optimizing user experiences.

2.3. Sports Application Service Quality
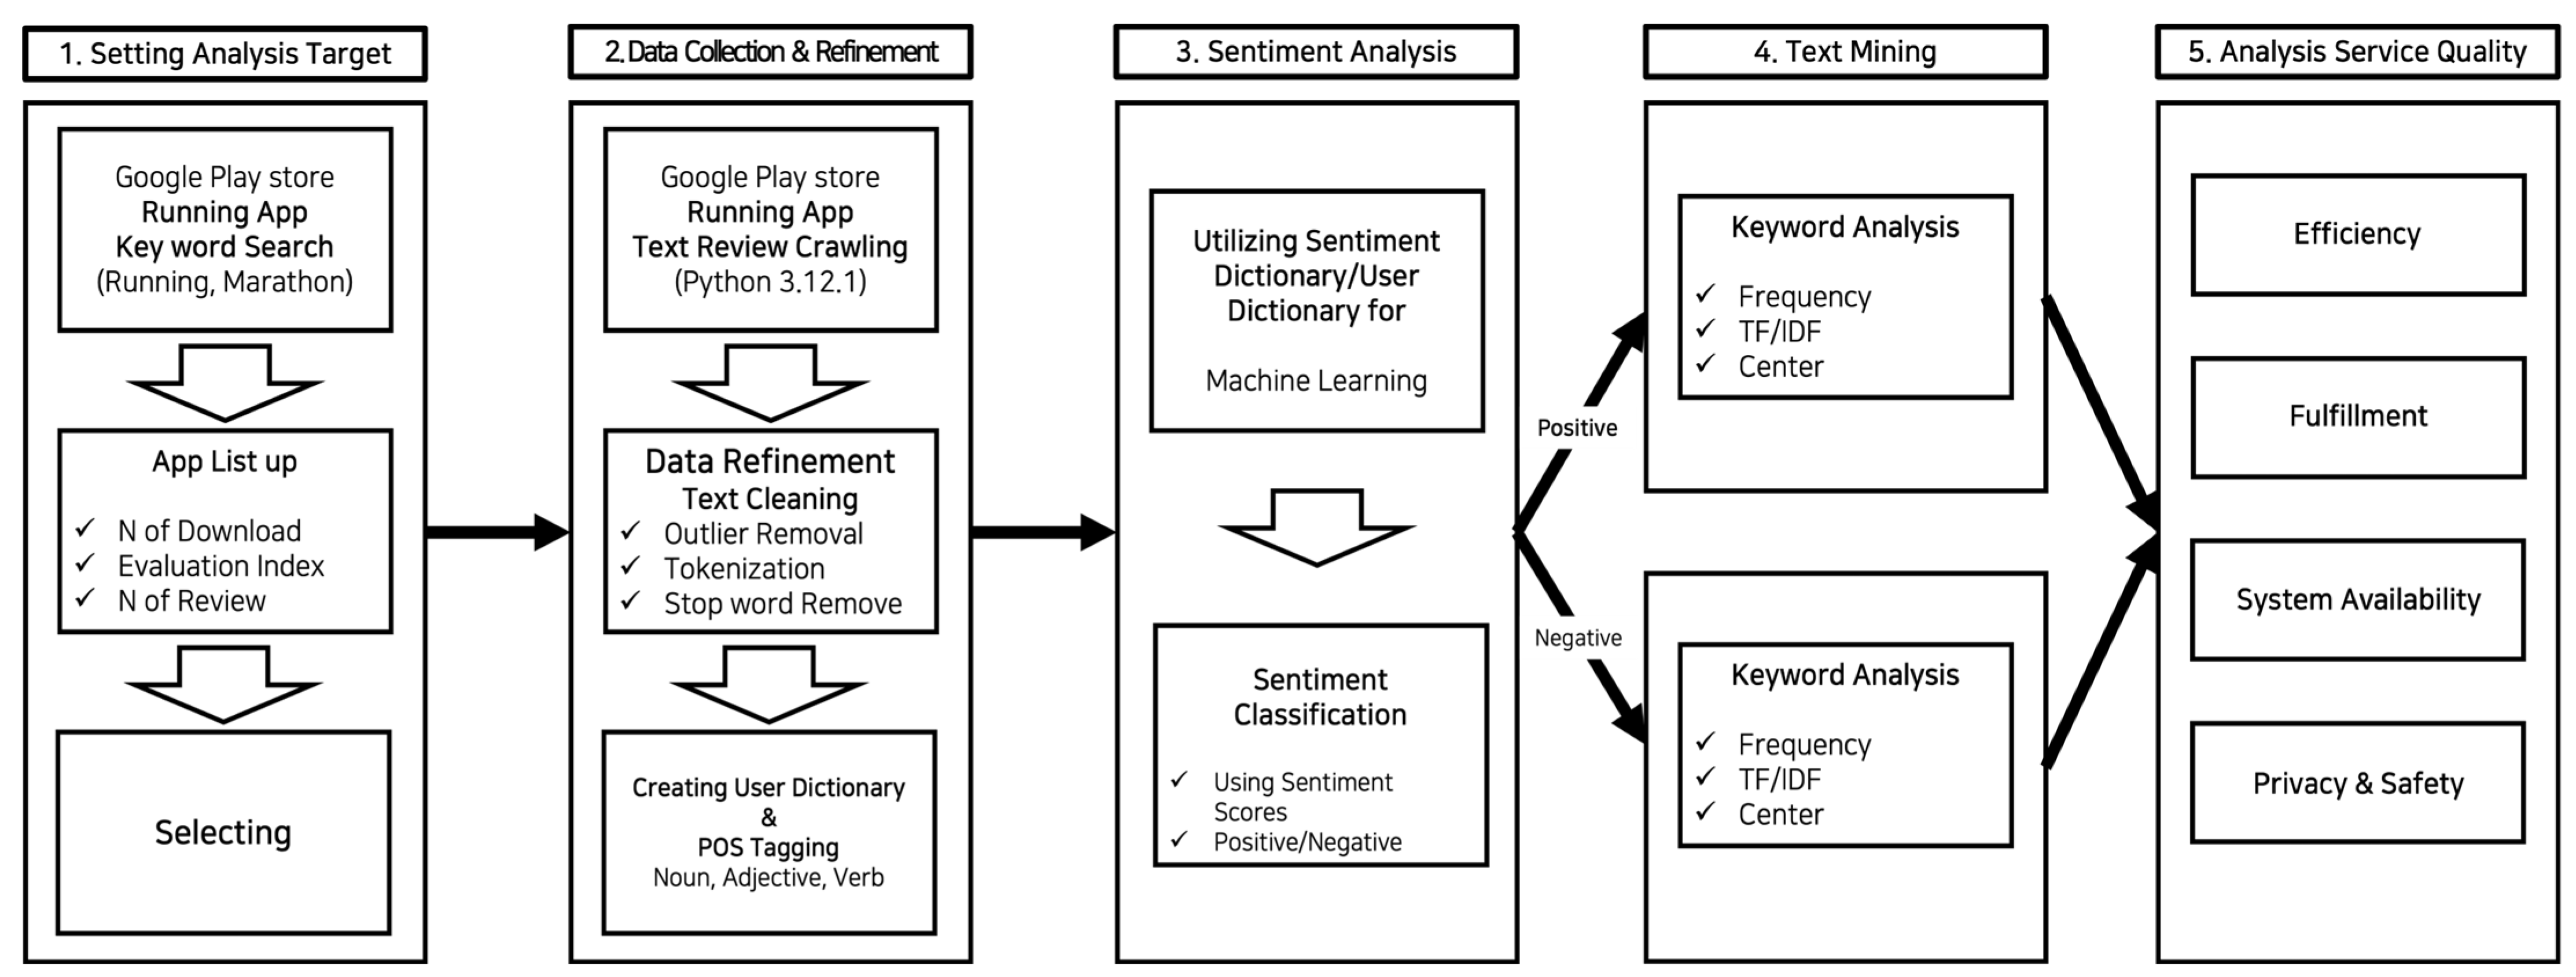
In the service industry, where experiences are sold to consumers, perceived quality is a crucial factor in management and marketing. Over time, various models have been proposed to quantify service quality. One of the most notable models is the SERVQUAL model introduced by Parasuraman et al. [30]. According to this model, perceived quality can be measured across five dimensions: tangibility, reliability, responsiveness, assurance, and empathy. Santos [31] has evaluated this model as a fundamental tool for measuring perceived quality from the consumer’s perspective. However, more recent research suggests that these early conceptual models need to be diversified and adapted according to the changing service environments and specific service contexts. In particular, the quality perceived by consumers in the digitized mobile service industry creates a vastly different environment compared to that in the past [32]. This is because a virtual environment is now established where customers interact with technology instead of people, and the type of service provided varies significantly depending on the purpose and environment in which devices or programs are used [32].
To adapt to the changes in service quality measurement in the digital environment, service quality evaluation models have also begun to evolve. Notably, Parasuraman et al. [33] improved the previously proposed SERVQUAL model and developed the E-S-QUAL model, a multi-item e-service quality scale. Initially, E-S-QUAL was primarily used as a scale to evaluate the service quality of e-commerce websites. The basic E-S-QUAL scale consists of 22 items across four dimensions: efficiency, fulfillment, system availability, and privacy [33]. This model specifically measures how effectively, efficiently, and reliably a website delivers services. With the advancement of mobile technology, service quality in the m-commerce environment has been increasingly measured, leading to the expanded use of E-S-QUAL. For instance, Huang and Lin et al. [32] developed five dimensions to measure m-commerce service quality: contact, fulfillment, privacy, efficiency, and responsiveness. This model has been utilized in various mobile service environments to assess service quality with a focus on consumer experiences [32].
The subject of this study, mobile fitness/sports coaching services, falls under the category of experience goods as educational and informational service content [34]. Sports applications offer significant benefits to users through various functionalities, such as recording exercise data, setting health goals, and providing personalized workout plans. In the mobile sports and health sector, information on the service quality perceived by users plays a critical role in optimizing user experience and encouraging continuous engagement [34]. Fitness training or sports coaching requires specialized knowledge in sports science and pedagogical expertise tailored to physical education [34,35]. Despite this, existing research has primarily focused on studying service satisfaction using traditional service quality evaluation scales or mobile service quality evaluation models. Additionally, these studies have predominantly relied on structured surveys rather than actual user experience data [36]. In a systematic review of mobile health app usability and quality rating scales, Azad-Khaneghah et al. [36] found that the majority of mobile health application service quality assessments utilize the E-S-QUAL model, which fails to adequately reflect the technical specificities of the healthcare sector [37]. Furthermore, a significant limitation of these studies is their focus on measuring service quality through surveys, which are time-consuming, costly, and lack the accuracy and immediacy required for effective management. Consequently, these survey-based methods do not support prompt and proactive decision-making.
In other words, to address the limitations of past research, it is necessary to conduct studies on measuring the service quality of sports and health applications by focusing on the characteristics of service quality as perceived through physical changes or sensations in mobile services such as healthcare, fitness training, and sports training. Additionally, more empirical research should be conducted using data-driven approaches that leverage actual user experiences or voice of customer.
Recent advancements in machine learning and natural language processing technologies have made it possible to complement traditional service quality measurements by utilizing customer online reviews, thus addressing some of the limitations of past research in other fields. In particular, there has been an increasing number of studies applying sentiment analysis to measure service quality in service sectors [38], hotel service [37,39]. Therefore, this study aims to build a big data set of actual smart running application reviews, refine the data using natural language processing and sentiment analysis techniques, and evaluate service quality scores based on the four dimensions of healthcare app service quality proposed in previous studies like that of Azad-Khaneghah et al. [36]. Ultimately, this approach seeks to overcome the limitations of traditional survey-based measurement methods by analyzing user reviews through machine learning and natural language processing, thereby proposing a more accurate service quality evaluation method that reflects user experiences. This will significantly contribute to the development of sports and health apps and enhance user satisfaction.

3. Research Method

This study aims to measure the quality of smart running applications that record and coach individuals’ running activities by collecting review text data and utilizing sentiment analysis and keyword analysis. The evaluation of user experiences and service quality through review texts can be considered a Critical Incident Technique (CIT), which analyzes service attributes by leveraging memorable experiences recalled by actual users. Many UX (user experience) research studies have utilized this approach [37,38,39]. In particular, this study further incorporates various techniques, including big data analysis, text mining, sentiment analysis, and service quality score measurement. The specific procedure of this study followed a five-step process, as illustrated in Figure 1.

3.1. Setting Analysis Target

In the first step, all smart running applications listed on the Google Play Store were assembled, using keywords such as running, marathon, health, training, and home training. Based on this search, the main applications for review collection were selected. As shown in Table 1, a total of 17 applications were initially chosen as targets for data collection. These applications were selected because they had significant usage periods and download numbers, sufficient to represent smart running applications. Additionally, each application had accumulated over 10,000 review entries in the past year. A comprehensive scan of all existing smart running applications was performed and, from these, reviews of actively used applications were selected based on user engagement and popularity. This approach ensured the inclusion of high-quality learning data capable of delivering meaningful insights into user experiences.

3.2. Data Collection and Refinement

In the second step, we accessed the Google Play Store review pages for the applications selected in the previous step and crawled the reviews posted over the past six months (from 1 September 2023 to 28 February 2024). To execute the crawling, we used Python 13.12.1 and employed the Selenium module for dynamic crawling. Text data that contained fewer than five characters, consisted only of exclamations and emojis, or included profanity were excluded from the analysis, and tokenized data was stored in the database. As of 8 April 2024, a total of 254,231 reviews that had been posted on the Google Play Store for the 17 selected applications over the past six months were set as the target for analysis and stored in the database. After filtering out 90,678 reviews that had fewer than five characters, consisted only of exclamations and emojis, or contained profanity, 163,553 reviews were retained for analysis. This second step allowed for the identification of frequently occurring words, as well as the construction of the overall network relationships between words within the entire dataset.

3.3. Sentiment Analysis

In the third step, as a preliminary stage for evaluating service quality, sentiment analysis of the reviews was conducted. The reviews were categorized into three levels: positive, negative, and neutral. Neutral reviews were excluded from the service quality analysis. The Korean text sentiment analysis used in this study employed a supervised machine learning method based on training data to calculate the degree of subjectivity in the text and the polarity of sentiment (positive/negative). Specifically, the analysis was performed using the TEXTOM software (Version 5.0), which utilizes a machine learning technique with a Bayesian classifier for sentiment analysis. The sentiment dictionary embedded in TEXTOM, along with a sentiment dictionary developed for this study, was used as the base training data. Seventy percent of the collected data was used for training, and the remaining 30% was used as test data. The polarity of the sentiment in the review text data was classified as positive or negative, and the accuracy of the model was tested using the Naive Bayes algorithm. The F-score, which is the harmonic mean of precision and recall, was calculated, and a score of 70% or higher was considered adequate for a social science approach [40]. To further enhance the reliability of the data, an inter-coder reliability test was conducted. A sample of 500 reviews was provided to three coders, who manually classified the sentiment as positive or negative. After verifying the consistency among the coders for all measurements, a data matrix was created, and the agreement level was calculated using Fleiss’ Kappa statistic to ensure it was at an appropriate level. Fleiss’ Kappa, which measures the agreement among three or more coders, ranges from −1 to 1, where a score of 0.61 or higher is considered good agreement, and a score of 0.81 or higher indicates very high agreement [41].

3.4. Text Mining—Service Quality Dimension

In the fourth step, text mining analysis was conducted separately on the classified positive and negative reviews. Text mining is an analytical method used to extract and refine words from unstructured textual data through natural language processing and morphological analysis. This method is employed to identify word frequency, word similarity, and co-occurrence frequency between words [42]. In this study, the text mining program Textom, which is specialized in text analysis, was used.
The refined data from the previous steps underwent several analyses using Textom, including word frequency analysis, annual keyword N-gram analysis, and centrality index analysis using TF-IDF (Term Frequency–Inverse Document Frequency). Specifically, the results of the simple frequency analysis were used to calculate the frequency of each word, and the top 100 words were visualized through a word cloud to provide an intuitive understanding of the data content. The N-gram analysis was performed to examine the co-occurrence and density between the main topic keywords and related keywords, calculating the co-occurrence frequency and directionality of the two keywords. The TF-IDF analysis provided a value indicating how important a specific word is within a particular document, taking into account the importance weighting across the entire set of documents. This allowed for a comprehensive understanding of the characteristics of both positive and negative review data.

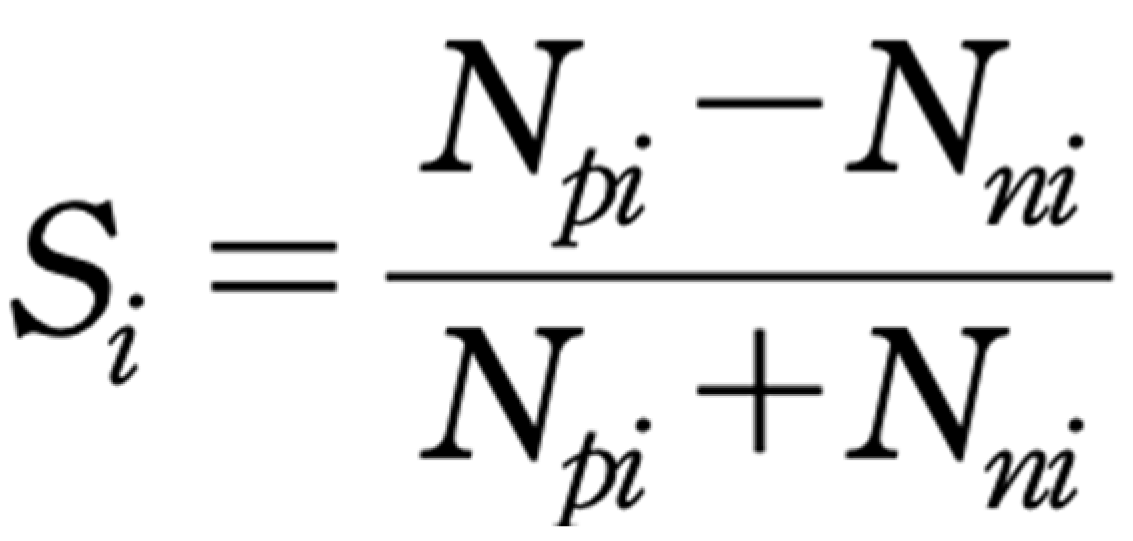
3.5. Service Quality Dimension Score

In the fifth step, to derive scores based on detailed service quality dimensions, the positive and negative datasets were classified according to the service quality evaluation domains and then scored. First, to separate the datasets, the refined positive and negative datasets were categorized into four service quality evaluation domains, and keyword network clustering analysis was performed to reclassify the data. Specifically, the service quality evaluation domains utilized the four dimensions of online application service quality measurement proposed in studies related to the E-S-QUAL model [36,38,39]: efficiency, fulfillment, system availability, and privacy. After creating a word distance similarity matrix, the clustering method was applied to group words with the closest distances. The four service quality evaluation domains mentioned above were theoretically applied in the process of distinguishing and labeling the clusters.
While the traditional SERVQUAL and E-S-QUAL models have been pivotal in measuring service quality, recent research highlights the limitations of these survey-based approaches in capturing real-time user feedback. For instance, Azad-Khaneghah et al. [36] pointed out that these conventional methods often lack the immediacy and richness provided by analyzing large-scale user-generated data. Liu et al. [38] further demonstrated that sentiment analysis allows researchers to understand user perceptions with greater precision and speed, bridging the gap between static survey data and dynamic user experiences. This aligns with Duan et al. [43], who showcased the effectiveness of using sentiment analysis to quantify service quality through actual user reviews. Therefore, while rooted in traditional service quality frameworks, this study’s approach modernizes these models by incorporating sentiment-based text analysis to derive more actionable insights.
Finally, the service quality scores for the classified data were derived using Figure 2. The service quality scores derived in Figure 2 were chosen based on their ability to effectively quantify user sentiment through text data, aligning with methodologies supported by prior research [36,38,43]. Specifically, this formula, initially utilized by Duan et al. [43], is grounded in sentiment analysis techniques that measure the proportion of positive and negative reviews to reflect service quality comprehensively. This approach is consistent with the findings of Azad-Khaneghah et al. [36], who highlighted the limitations of traditional survey-based quality measurements, emphasizing the importance of data-driven methods. Furthermore, Liu et al. [38] demonstrated that sentiment-based analysis allows for more immediate and precise feedback compared to conventional models. By integrating this formula, the study aimed to align with these modern, data-centric practices, ensuring that the results accurately capture the Voice of the Customer for strategic insights.
Here, Si represents the service quality score in dimension “i”, Npi represents the number of positive documents in dimension “i”, and Nni represents the number of negative documents in dimension “i”. The service quality score is calculated by comparing the difference between the positive and negative review counts and normalizing this difference by the total number of reviews. This method ensures that the score ranges from −1 to +1, where a positive score indicates that positive feedback predominates, signaling user satisfaction, while a negative score suggests that negative feedback is more prevalent, pointing to user dissatisfaction.
For instance, if a particular dimension “i” has 100 positive reviews and 50 negative reviews, the score will be positive, reflecting the stronger presence of positive sentiment. Conversely, if dimension “i” has 30 positive reviews and 70 negative reviews, the resulting score will be negative, indicating a higher level of dissatisfaction in that service area. This calculation helps balance the sentiment impact, offering a comprehensive view of user feedback and aiding in identifying areas for potential improvement.

4. Results

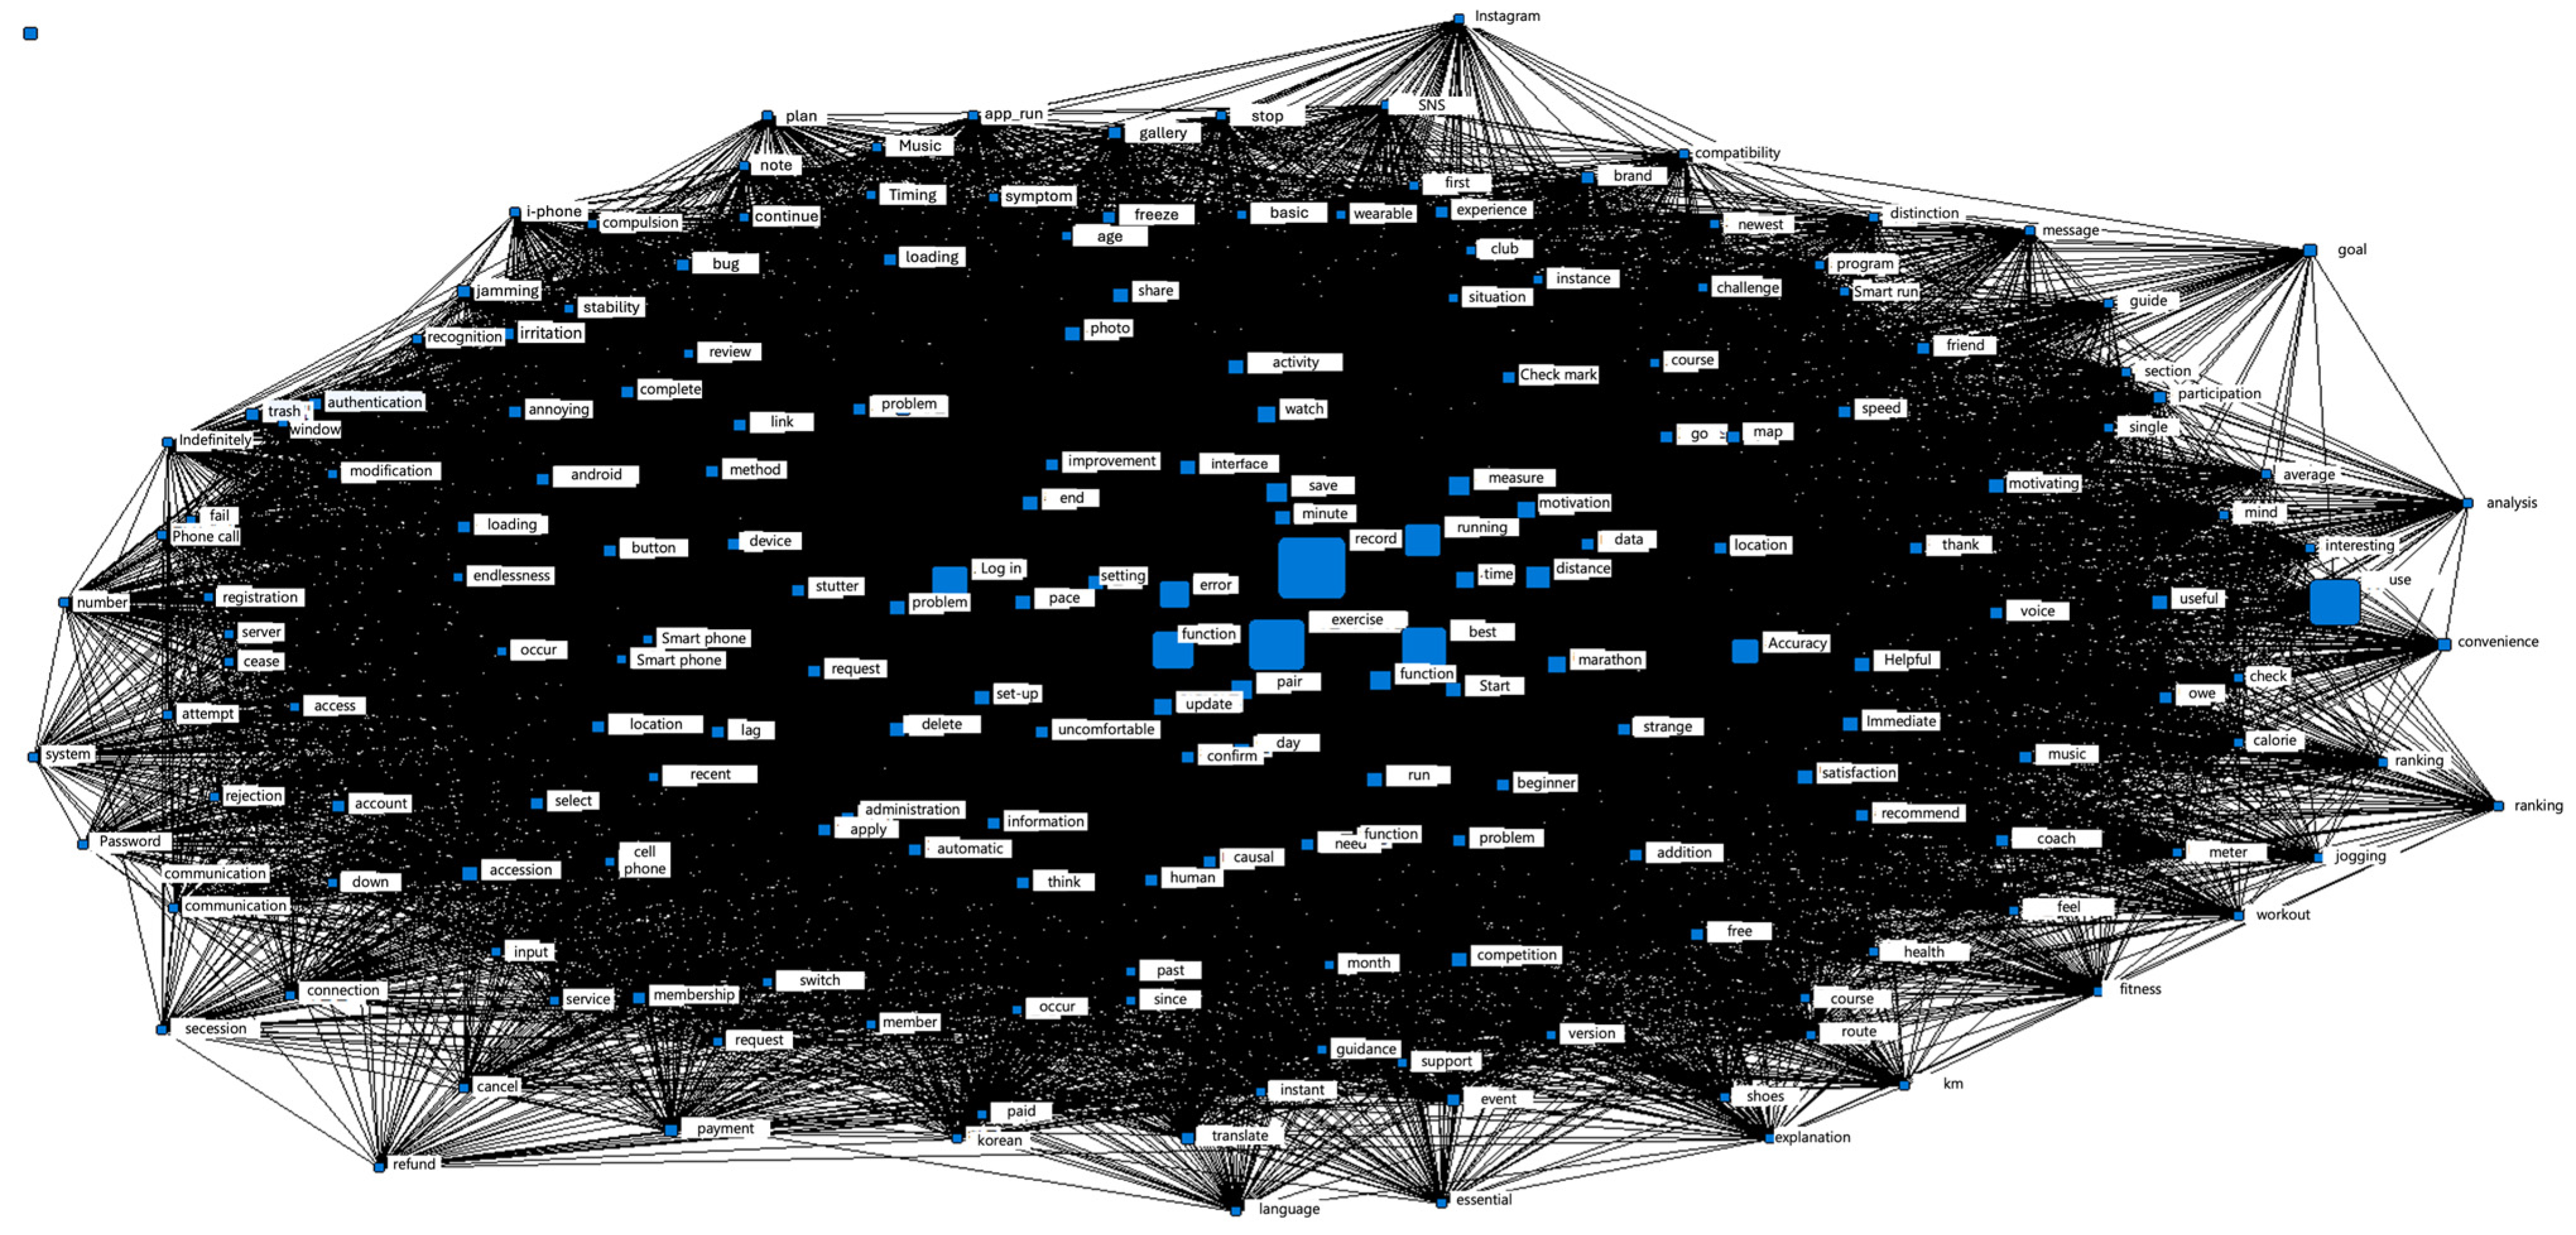
4.1. Term Frequency and Network Analysis

From the 264,330 noun phrases analyzed from the app reviews, 100 words with a length of two or more characters and a TF-IDF (Term Frequency–Inverse Document Frequency) score of 0.5 or higher were extracted and are summarized in Table 2. This dataset excludes words that directly express sentiment, such as “good” or “bad”, and instead focuses on words that reflect user experience and functional aspects of the app.
The frequency analysis reveals that the most frequently mentioned word was “record”, with a total of 11,491 mentions. This indicates that the feature of recording exercise data is highly valued by users of the smart running application, and it is consistently utilized. The frequency of the word “record” reflects that one of the core values provided by the app to its users is the ability to track and log their exercise data. Other frequently mentioned words included “exercise” (9431 mentions), “use” (7992 mentions), and “running” (7218 mentions), which demonstrate that the app is widely used as a primary tool for supporting users’ exercise and running activities. These words highlight the key elements that users consider important when planning and executing their exercise routines through the app, as well as when reviewing the outcomes.
Furthermore, words such as “error” (5961 mentions), “login” (6154 mentions), “distance” (4823 mentions), and “measurement” (3416 mentions) were also commonly mentioned. The high frequency of the word “error” suggests that there is a significant amount of user dissatisfaction regarding technical issues encountered during app usage. This indicates a need for improvements in the app’s stability and reliability, as these issues can decrease user satisfaction and hinder continued usage. The high frequency of the words “login” and “measurement” is also noteworthy, as these reflect key experiential factors that users prioritize when accessing the app and utilizing its various features. Feedback related to issues during the login process or to the accuracy of the measurement function can significantly impact the overall quality of the user experience. Figure 3 visually represents the frequency of word occurrences and their relationships

4.2. Sentiment Analysis Result

The sentiment analysis of the final 163,553 review texts revealed that 36.71% (60,040 reviews) of users expressed positive sentiments, while 43.29% (70,802 reviews) expressed negative sentiments. This indicates that users of the 17 smart running applications tended to leave more negative reviews than positive ones. It suggests that the review pages are often used as platforms for customers to voice their complaints. Additionally, to assess how well the sentiment polarity was classified, we calculated the accuracy, precision, recall, and F-score. The accuracy was found to be 87.5% and the recall was high at 86%, but the precision was relatively low at 61%. Nevertheless, the F-score, calculated using the formula F-Score = 2 × (Precision × Recall)/(Precision + Recall), was 71.37, which exceeds the generally accepted threshold of 70% for social science research [40]. Furthermore, the inter-coder reliability test, conducted to enhance the data’s reliability, showed a high Fleiss’ Kappa value of 0.78. The positive and negative review data classified through sentiment analysis were subsequently used as the analysis data set for the service quality measurement conducted later.

4.3. Service Quality Review Text Mining Analysis

The keyword groups for each service quality dimension and examples of review comments are presented in Table 3. Among the 100 most frequently mentioned words collected through data mining, words with high centrality and an Eigenvector Centrality value of over 0.5 were grouped accordingly. As mentioned earlier, the four dimensions of service quality evaluation scales proposed in prior research were referenced for this grouping: App System Efficiency, Function-Related Fulfillment, System Availability, and Data Privacy. Table 3 presents the keywords and representative review examples for each of these dimensions.
Firstly, App System Efficiency measures how quickly and reliably a smart running application operates. It includes the app’s response speed, stability, and user interface convenience, assessing how smoothly users can record their workouts or receive feedback—an essential factor in evaluating the user experience. In this dimension, users positively evaluated the app’s fast speed and intuitive UI, but there were complaints about slow response times and errors in data storage. Positive reviews frequently mentioned keywords such as “fast speed”, “convenience”, and “auto-save”, reflecting high ratings for the app’s efficiency and user-friendliness. On the other hand, negative reviews frequently cited issues like “lag”, “errors”, and “functional faults”, indicating user dissatisfaction with the app’s reliability and stability.
The second dimension, Function-Related Fulfillment, assesses how well the application’s features meet user expectations. For a smart running app, this includes the effectiveness of personalized training programs, workout data analysis, and goal-setting features. In this dimension, users appreciated the coaching functionalities and the utility of workout record management, but issues like integration errors and inconvenient voice guidance were highlighted as problems. Positive reviews showed that users were particularly satisfied with features such as “free guide”, “goal setting”, “GPS”, and “training provision”, which met their fitness and training needs. However, negative reviews frequently mentioned dissatisfaction with issues such as “noise”, “training errors”, “inappropriate guidance”, “slow timing”, and “inaccurate metrics”, indicating problems with inaccurate training or metric information.
The third dimension, System Availability, refers to how reliably the application can be accessed when needed. This dimension is particularly related to the app’s server stability and its ability to provide continuous service, which is crucial for real-time information access, feedback during workouts, and the secure storage of data. In this dimension, positive feedback focused on keywords such as “stable service” and “always connected”, suggesting that users highly value the app’s stability and connectivity. However, negative feedback frequently mentioned problems such as “unable to connect” and “server down”, pointing out serious issues with the app’s availability.
Finally, the Data Privacy dimension reflects how well a smart running application protects users’ personal information. This includes maintaining security when handling sensitive data such as workout records and personal health information, which is essential for building user trust. The analysis showed that the importance of personal data protection was emphasized in this dimension, with user complaints about frequent login requests and security vulnerabilities. Keywords like “protection of personal information” and “security features” appeared frequently in positive reviews, showing that users had a favorable perception of the app’s security and privacy protection functions. However, negative reviews were dominated by concerns such as “data leakage” and “security vulnerabilities”, reflecting users’ concerns about the app’s ability to safeguard their personal information.

4.4. Service Quality Score Measurement

To derive the service quality scores for each detailed service dimension, the positive and negative datasets were classified according to the service quality evaluation areas, and scores were calculated for each area based on the number of reviews (Table 4). The classification was conducted by separating the positive and negative datasets and then categorizing them into four service quality evaluation areas. WordNet 2.1 was utilized to systematically expand synonyms and related terms of the key keywords for each dimension, and this expanded list was used to automatically classify the entire review data.
The analysis results showed that, out of a total of 65,240 reviews, 27,058 (41.5%) were positive, while 38,182 (58.5%) were negative. This indicates that users of the analyzed smart running applications left more negative than positive reviews overall. When examining the total number of reviews by area, it was found that users were most concerned with the “App System Efficiency” and “Function-Related Fulfillment” dimensions. In the “App System Efficiency” area, a total of 34,695 reviews (approximately 21.21% of all reviews) were collected while, in the “Function-Related Fulfillment” area, 41,360 reviews (about 25.28%) were collected. This suggests that users are most interested in the system efficiency and the degree to which the functions provided by the smart running applications meet their needs. In contrast, there were relatively fewer reviews on “System Availability” and “Data Privacy”, with 33,733 (about 20.63%) and 21,054 (about 12.87%) reviews, respectively, indicating lower user concern about system accessibility and data protection issues.
When looking at the proportion of positive and negative reviews by area, “Function-Related Fulfillment” had significantly more positive reviews (27,058) than negative ones (14,302), suggesting that users are generally satisfied with the functions provided by the applications. On the other hand, in the “App System Efficiency” area, there were slightly more negative reviews (18,633) than positive ones (16,062), indicating some user dissatisfaction with the system’s efficiency, such as response speed and stability. For “System Availability” and “Data Privacy”, negative reviews (24,667 and 13,200, respectively) far exceeded positive ones (9066 and 7854, respectively). The high proportion of negative reviews for “System Availability” suggests that users have serious complaints about server stability and connection issues. Similarly, the large number of negative reviews for “Data Privacy” indicates user concerns about issues related to personal data protection. The high level of positive feedback on “Function-Related Fulfillment” suggests that functional fulfillment greatly contributes to user satisfaction, while the low positive ratios for “System Availability” and “Data Privacy” imply a need for improvement in these two areas.
To go beyond simply the proportion of positive and negative reviews, service scores for each dimension were calculated to more clearly evaluate the specific complaint elements and user experiences indicated in the review content. Even if the number of positive reviews exceeds the number of negative ones, the service score may still be low if it reflects specific issues within that dimension. The analysis of service scores revealed that, among the four service quality dimensions, “Function-Related Fulfillment” recorded the highest score (0.3084), while “System Availability” and “Data Privacy” showed the lowest scores at −0.4625 and −0.2539, respectively. The service score for “App System Efficiency” was moderate at −0.0741, reflecting mixed user evaluations of app efficiency. The analysis of service scores plays a crucial role in understanding the quality of each dimension, indicating that scores closer to 0 generally mean a balance between positive and negative sentiments, while scores closer to a positive value suggest a predominance of positive evaluations. Therefore, these results help to clearly identify key areas in need of service improvement, suggesting that user satisfaction is likely to remain low unless issues in “System Availability” and “Data Privacy” are addressed.

5. Discussion

This study aims to deeply analyze user experiences with smart running applications through text mining and sentiment analysis, and subsequently evaluate service quality based on these insights. Such research holds significant potential to contribute to the development of user-centered services in the digital healthcare market by quantifying user experiences and extracting actionable insights. As discussed in the introduction and theoretical background, the usability of healthcare applications is directly linked to user satisfaction, which in turn contributes to the continued use of the application and overall health improvement. However, previous studies often failed to incorporate Voice of the Customer (VOC) data, such as actual user reviews, or did not consider the specific characteristics of particular application types. In response, this study leveraged big data text mining techniques to quantify unstructured data from real user reviews, thereby assessing user experiences and service quality in the smart running application market. In this section, the discussion centers on the four main research findings, exploring their academic and practical implications, along with the study’s limitations and suggestions for future research.
First, the term frequency and network analysis results identified specific features that users predominantly focus on in running applications. By analyzing 264,330 noun phrases within app reviews, the most frequently mentioned word was “record”, cited 11,491 times, indicating that data recording plays a central role in the user experience of smart running apps. The ability to track and log exercise data is a core value provided by these applications, underscoring the importance of accurate and reliable data recording features. Previous research has reported that tracking functionalities in fitness applications are a primary motivation for users and are directly related to user satisfaction [6,35]. Additionally, the frequent mention of related terms such as “distance” (4823 mentions), “save” (3823 mentions), and “measure” (3416 mentions) illustrates that users primarily use smart running applications to manage and improve their exercise routines.
However, the analysis also revealed significant user dissatisfaction related to the technical aspects of the apps. The word “error” was mentioned 5961 times, reflecting widespread frustration with technical issues encountered by users. While core features such as data recording are valued, technical problems may prevent users from fully benefiting from the app, thereby compromising the overall user experience. This finding is consistent with other studies in the field of mobile application usability [38], which emphasize the importance of technical stability in user satisfaction and retention. Furthermore, terms like “login” (6154 mentions), “inconvenience” (2486 mentions), and “display” (2006 mentions), which were frequently mentioned in close association with “error”, highlight the critical role of a smooth user interface experience and accurate functionality, as issues in these areas can lead to significant user dissatisfaction.
Secondly, the sentiment analysis and service quality text mining results provide important insights into the core elements of the user experience with smart running applications. The sentiment analysis revealed that 43.29% of the 163,553 reviews were negative, surpassing the 36.71% that were positive. This suggests that users often use review pages to voice their complaints which, from a research perspective, can be viewed positively as it provides valuable data for analysis. Negative feedback, in particular, can be leveraged as an opportunity for service improvement, and offers critical clues for a deeper analysis of user experiences. This indicates that the findings of this study have significant practical implications. Additionally, the sentiment analysis yielded an accuracy of 87.5% and an F-score of 71.37, both exceeding generally accepted thresholds in social science research, supporting the reliability of sentiment analysis as a method for quantifying user experiences and evaluating service quality. Consequently, applying such analysis methods in various fields may allow for the quantitative analysis of user experiences, which are often difficult to capture using traditional survey methods. Therefore, the results and methodologies of this study offer valuable insights both academically and practically.
Thirdly, the text mining analysis offers a detailed view of user experiences across the four major dimensions of service quality: App System Efficiency, Function-Related Fulfillment, System Availability, and Data Privacy. In the App System Efficiency dimension, users positively evaluated the apps’ fast speeds and intuitive UIs but expressed dissatisfaction with delayed response times and data storage errors. This aligns with the key factors emphasized in the Technology Acceptance Model (TAM), such as ease of use, connection speed, and interface usability, which play a crucial role in user satisfaction and dissatisfaction. In the Function-Related Fulfillment dimension, the analysis revealed the causes of user satisfaction and dissatisfaction with the features provided in fitness training programs. Users were particularly satisfied with personalized training plans, motivational messages based on their past records, and coaching messages, while non-scientific training methods, inconvenient voice functions, noise, malfunctions, and feature conflicts were identified as major sources of discomfort. The System Availability and Data Privacy dimensions highlighted more general issues, with server instability and access problems being prominent in the System Availability dimension, and strong demands for personal data protection in the Data Privacy dimension. Delays in access, which are crucial in smart running applications where real-time information access and feedback are important, can negatively impact users’ stable and continuous usage, and concerns about data leakage and security vulnerabilities can lead to users discontinuing the app if their sensitive information is not adequately protected. Particularly for fitness apps that handle sensitive information like location and physical data, these concerns are even more critical. Thus, the analysis confirms that stable system usage is a key factor in building user trust, as with other types of applications.
Finally, the service quality score measurement results derived from this study provide various insights by quantifying user satisfaction across different dimensions of service quality in smart running applications. Specifically, quantifying unstructured textual data into service quality dimensions and using this to clearly evaluate user experiences enables the identification of areas for service improvement with greater clarity by providing numerically comparable data. This approach is also significant in that it addresses the limitations of traditional qualitative analysis. Upon closer examination, the highest score was recorded in the “Function-Related Fulfillment” dimension (0.3084), indicating general user satisfaction with the functional benefits provided by the application. Conversely, the low scores in the “System Availability” (−0.4625) and “Data Privacy” (−0.2539) dimensions suggest serious user dissatisfaction in these two areas. This indicates that, while users are generally satisfied with the coaching, exercise record management, and goal-setting functions offered by the application, there is significant concern regarding personal data protection, as evidenced by the substantial level of dissatisfaction.

6. Conclusions

The comprehensive conclusion of this study highlights the critical importance of quantitatively analyzing user experiences in evaluating the service quality of smart running applications. However, this study has several limitations. First, the research data is based on reviews collected at a specific point in time, which may not fully reflect the potential changes in user experience over time. Second, the study relies on the subjective experiences of review authors, which may not represent the experiences of all users. These limitations could be addressed in future research by collecting data across various time points and analyzing a broader range of user samples. Future research should aim to overcome these limitations by conducting more comprehensive user experience analyses. For instance, research incorporating real-time data collection and analysis techniques would be beneficial to continuously monitor changes in user experience. Additionally, comparative analyses of various types of digital healthcare applications could identify user needs specific to particular application types. Such follow-up research would provide crucial foundational data for developing user-centered services in the digital healthcare market and contribute to the advancement of not only smart running applications but also a wide range of healthcare services.

Author Contributions

Conceptualization, J.K.; methodology, J.K.; software, J.K.; validation, J.K.; formal analysis, J.K.; investigation, J.K.; resources, J.K.; data curation, J.K.; writing—original draft preparation, J.K.; writing—review and editing, J.K.; visualization, J.K.; supervision, J.C.; project administration, J.K.; funding acquisition, J.C. All authors have read and agreed to the published version of the manuscript.

Funding

This research was funded by Samsung Digital Health Team. The APC was funded by Samsung Digital Health Team.

Institutional Review Board Statement

Not applicable. This study did not involve humans.

Informed Consent Statement

Not applicable. This study did not involve humans.

Data Availability Statement

The data presented in this study are available on request from the corresponding author.

Conflicts of Interest

The authors declare no conflicts of interest.

References

  1. Smith, S.L.; Parashar, R.; Nanda, S.; Shiffman, J.; Shroff, Z.C.; Shawar, Y.R.; Hamunakwadi, D.L. Shifting patterns and competing explanations for infectious disease priority in global health agenda setting arenas. Health Policy Plan. 2024, czae035. [Google Scholar] [CrossRef]
  2. Thompson, W.R.; Sallis, R.; Joy, E.; Jaworski, C.A.; Stuhr, R.M.; Trilk, J.L. Exercise is medicine. Am. J. Lifestyle Med. 2020, 14, 511–523. [Google Scholar] [CrossRef]
  3. Janssen, M.; Walravens, R.; Thibaut, E.; Scheerder, J.; Brombacher, A.; Vos, S. Understanding different types of recreational runners and how they use running-related technology. Int. J. Environ. Res. Public Health 2020, 17, 2276. [Google Scholar] [CrossRef] [PubMed]
  4. Statista. Running and Jogging. Available online: https://www.statista.com/topics/1743/running-and-jogging/ (accessed on 10 May 2024).
  5. Beinema, T.; op den Akker, H.; van Velsen, L.; Hermens, H. Tailoring coaching strategies to users’ motivation in a multi-agent health coaching application. Comput. Hum. Behav. 2021, 121, 106787. [Google Scholar] [CrossRef]
  6. Adwinda, C.P.; Pradono, S. Developing an android-based running application. J. Crit. Rev. 2020, 7, 851–857. [Google Scholar] [CrossRef]
  7. Bauer, C.; Kratschmar, A. Designing a music-controlled running application: A sports science and psychological perspective. In Proceedings of the 33rd Annual ACM Conference Extended Abstracts on Human Factors in Computing Systems, Seoul, Republic of Korea, 18–23 April 2015; pp. 1379–1384. [Google Scholar] [CrossRef]
  8. Business Research Insights. Running Apps Market. Available online: https://www.businessresearchinsights.com/ko/market-reports/running-apps-market-103263 (accessed on 8 March 2024).
  9. Dhurup, M.; Singh, C.; Surujlal, J. Application of the health, and fitness service quality scale (HAFSQ) in determining the relationship among service quality, satisfaction and loyalty in the service industry. Afr. J. Phys. Health Educ. Recreat. Dance 2006, 12, 238–251. [Google Scholar] [CrossRef]
  10. Endeshaw, B. Healthcare service quality-measurement models: A review. J. Health Res. 2021, 35, 106–117. [Google Scholar] [CrossRef]
  11. Cho, H.; Chi, C.; Chiu, W. Understanding sustained usage of health and fitness apps: Incorporating the technology acceptance model with the investment model. Technol. Soc. 2020, 63, 101429. [Google Scholar] [CrossRef]
  12. Mival, O.; Benyon, D. User experience (UX) design for medical personnel and patients. In Requirements Engineering for Digital Health; Springer: Cham, Switzerland, 2014; pp. 117–131. [Google Scholar]
  13. Omaghomi, T.T.; Elufioye, O.A.; Akomolafe, O.; Anyanwu, E.C.; Daraojimba, A.I. Health apps and patient engagement: A review of effectiveness and user experience. World J. Adv. Res. Rev. 2024, 21, 432–440. [Google Scholar] [CrossRef]
  14. Zhang, Y.; Chen, M.; Liu, L. A review on text mining. In Proceedings of the 2015 6th IEEE International Conference on Software Engineering and Service Science (ICSESS), Beijing, China, 23–25 September 2015; pp. 681–685. [Google Scholar] [CrossRef]
  15. Sällberg, H.; Wang, S.; Numminen, E. The combinatory role of online ratings and reviews in mobile app downloads: An empirical investigation of gaming and productivity apps from their initial app store launch. J. Mark. Anal. 2023, 11, 426–442. [Google Scholar] [CrossRef]
  16. Yazti, D.Z.; Krishnaswamy, S. Mobile big data analytics: Research, practice, and opportunities. In Proceedings of the 2014 IEEE 15th International Conference on Mobile Data Management, Brisbane, Australia, 15–18 July 2014; pp. 1–2. [Google Scholar] [CrossRef]
  17. Jayaram, D.; Manrai, A.K.; Manrai, L.A. Effective use of marketing technology in Eastern Europe: Web analytics, social media, customer analytics, digital campaigns and mobile applications. J. Econ. Financ. Adm. Sci. 2015, 20, 118–132. [Google Scholar] [CrossRef]
  18. Hollister, G. Out of Nowhere: The Inside Story of How Nike Marketed the Culture of Running; Meyer & Meyer Sport: Maidenhead, UK, 2008. [Google Scholar]
  19. Russell, H.C.; Potts, C.; Nelson, E. “If It’s not on Strava it Didn’t Happen”: Perceived Psychosocial Implications of Strava Use in Collegiate Club Runners. Recreat. Sports J. 2023, 47, 15–25. [Google Scholar] [CrossRef]
  20. Peart, D.J.; Balsalobre-Fernández, C.; Shaw, M.P. Use of mobile applications to collect data in sport, health, and exercise science: A narrative review. J. Strength Cond. Res. 2019, 33, 1167–1177. [Google Scholar] [CrossRef] [PubMed]
  21. Wang, S.; Wang, S. Status Analysis and Future Development Planning of Fitness APP Based on Intelligent Word Frequency Analysis. J. Electr. Comput. Eng. 2022, 2022, 5190979. [Google Scholar] [CrossRef]
  22. Wen, P.; Chen, M. A new analysis method for user reviews of mobile fitness apps. In Proceedings of the Human-Computer Interaction. Human Values and Quality of Life: Thematic Area, HCI 2020, Held as Part of the 22nd International Conference, HCII 2020, Copenhagen, Denmark, 19–24 July 2020; Proceedings, Part III. Springer: Cham, Switzerland, 2020; pp. 188–199. [Google Scholar] [CrossRef]
  23. Usai, A.; Pironti, M.; Mital, M.; Aouina Mejri, C. Knowledge discovery out of text data: A systematic review via text mining. J. Knowl. Manag. 2018, 22, 1471–1488. [Google Scholar] [CrossRef]
  24. Pang, B.; Lee, L. Opinion mining and sentiment analysis. Found. Trends Inf. Retr. 2008, 2, 1–135. [Google Scholar] [CrossRef]
  25. Rambocas, M.; Pacheco, B.G. Online sentiment analysis in marketing research: A review. J. Res. Interact. Mark. 2018, 12, 146–163. [Google Scholar] [CrossRef]
  26. Luca, M. Reviews, reputation, and revenue: The case of Yelp.com. Harvard Bus. Sch. NOM Unit Work. Pap. 2016. 12-016. [Google Scholar] [CrossRef]
  27. Rossi, A.; Pappalardo, L.; Cintia, P.; Iaia, F.M.; Fernández, J.; Medina, D. Effective injury forecasting in soccer with GPS training data and machine learning. PLoS ONE 2018, 13, e0201264. [Google Scholar] [CrossRef] [PubMed]
  28. Kennedy, H.; Kunkel, T.; Funk, D.C. Using predictive analytics to measure effectiveness of social media engagement: A digital measurement perspective. Sport Mark. Q. 2021, 30, 265–277. [Google Scholar] [CrossRef]
  29. Constantinou, A.C.; Fenton, N.E. Determining the level of ability of football teams by dynamic ratings based on the relative discrepancies in scores between adversaries. J. Quant. Anal. Sports 2013, 9, 37–50. [Google Scholar] [CrossRef]
  30. Parasuraman, A.; Zeithaml, V.A.; Berry, L.L. Servqual: A multiple-item scale for measuring consumer perc. J. Retail. 1988, 64, 12. [Google Scholar]
  31. Santos, J. E-service quality: A model of virtual service quality dimensions. Manag. Serv. Qual. 2003, 13, 233–246. [Google Scholar] [CrossRef]
  32. Huang, E.Y.; Lin, S.W.; Fan, Y.C. MS-QUAL: Mobile service quality measurement. Electron. Commer. Res. Appl. 2015, 14, 126–142. [Google Scholar] [CrossRef]
  33. Parasuraman, A.; Zeithaml, V.A.; Malhotra, A. ES-QUAL: A multiple-item scale for assessing electronic service quality. J. Serv. Res. 2005, 7, 213–233. [Google Scholar] [CrossRef]
  34. Liu, Y.; Shen, Y.; Sun, S. The Influence of User Perceived Value of Sports APP on Platform Commodity Purchase. In Proceedings of the Digital Health and Medical Analytics: Second International Conference, DHA 2020, Beijing, China, 25 July 2020; Revised Selected Papers. Springer: Singapore, 2021; pp. 96–117. [Google Scholar]
  35. Janssen, M.; Scheerder, J.; Thibaut, E.; Brombacher, A.; Vos, S. Who uses running apps and sports watches? Determinants and consumer profiles of event runners’ usage of running-related smartphone applications and sports watches. PLoS ONE 2017, 12, e0181167. [Google Scholar] [CrossRef] [PubMed]
  36. Azad-Khaneghah, P.; Neubauer, N.; Miguel Cruz, A.; Liu, L. Mobile health app usability and quality rating scales: A systematic review. Disabil. Rehabil. Assist. Technol. 2021, 16, 712–721. [Google Scholar] [CrossRef] [PubMed]
  37. Martin-Domingo, L.; Martín, J.C.; Mandsberg, G. Social media as a resource for sentiment analysis of airport service quality (ASQ). J. Air Transp. Manag. 2019, 78, 106–115. [Google Scholar] [CrossRef]
  38. Jain, P.K.; Pamula, R.; Srivastava, G. A systematic literature review on machine learning applications for consumer sentiment analysis using online reviews. Comput. Sci. Rev. 2021, 41, 100413. [Google Scholar] [CrossRef]
  39. Luo, J.M.; Vu, H.Q.; Li, G.; Law, R. Understanding service attributes of robot hotels: A sentiment analysis of customer online reviews. Int. J. Hosp. Manag. 2021, 98, 103032. [Google Scholar] [CrossRef]
  40. Kiritchenko, S.; Zhu, X.; Mohammad, S.M. Sentiment analysis of short informal texts. J. Artif. Intell. Res. 2014, 50, 723–762. [Google Scholar] [CrossRef]
  41. Landis, J.R.; Koch, G.G. The measurement of observer agreement for categorical data. Biometrics 1977, 33, 159–174. [Google Scholar] [CrossRef]
  42. Lee, S.; Song, J.; Kim, Y. An empirical comparison of four text mining methods. J. Comput. Inf. Syst. 2010, 51, 1–10. [Google Scholar]
  43. Duan, W.; Cao, Q.; Yu, Y.; Levy, S. Mining online user-generated content: Using sentiment analysis technique to study hotel service quality. In Proceedings of the 46th Hawaii International Conference on System Sciences, Wailea/Maui, HI, USA, 7–10 January 2013; pp. 3119–3128. [Google Scholar] [CrossRef]
Figure 1. Service quality measurement process using text mining.
Jtaer 19 00162 g001
Figure 2. Service quality score formula.
Jtaer 19 00162 g002
Figure 3. Word network visualization from text mining analysis.
Jtaer 19 00162 g003
Table 1. List of applications analyzed in this study.
NameNumber of Users
(in 10,000 s)
RatingN of Reviews
(in 1000 s)
1Running–Jogging Tracker5004.76408
2Start Running
Running for Beginners
1004.91009
3RunDay1004.71487
4Tranggle1004.4948
5ASICS Run keeper10004.58475
6FITAPP1004.31548
7GPS Running Cycling and Fitness5004.86068
8Just Run: Zero to 5 K105125
9Leap Map Runner10004.812,475
10Nike Run Club10003.921,079
11Pacer Pedometer10004.85871
12PUMATRAC Run, Train, Fitness1004.61040
13Strava50004.360,377
14Under Armour MapMyRun10004.87475
15Wahoo1004.81456
16Polar Flow5003.96238
17Garmin Connect10004.721,475
Table 2. Term frequency.
RankWordFrequencyRankWordFrequency
1Record11,49151Display2006
2Exercise943152Gallery1824
3Use799253Thanks2260
4Running721854Data1881
5Login615455Resolve1941
6Error596156Pace1947
7Best525257Information2272
8Distance482358Participate2121
9Function389759Competition2246
10Save382360Automatic1779
11Sync360361Button2218
12Measure341662Speed1774
13Motivation324663Recommend2244
14Running310764Certification2259
15Time341865Friend1994
16Update321266Android1848
17Watch342067Middle2090
18Accuracy269368Phone1920
19Sign up295369Location1800
20End257270Map1786
21Photo244471One2178
22Delete289072Loading1843
23Screen266073Person1997
24Install260874Bug1684
25Marathon279675Run1770
26Running266076Because1745
27Settings234377Convenient1924
28Start270378Thanks1908
29Useful275079First1978
30Help256880Add2010
31Share251681Payment1748
32Satisfaction219782Frozen2025
33Grant241983Free2040
34Edit239884Thought1861
35Problem257385Selection2005
36Activity213986Music1816
37Logout249387Voice1707
38Request237288Occur1631
39Confirm225289Coach1645
40Improvement248690Member1864
41Need208391Account1820
42Infinite Loading219192Stop1699
43Use217993After1698
44Inconvenience222994Method1623
45Manage229695Complete1826
46Strange198596Annoying1828
47Lag211697Trash1661
48Possible224198Complete2013
49Connect206899Challenge1941
50Display2063100Error1864
Table 3. Definitions and keywords for service quality.
DimensionKeywordExample Comment
App System
Efficiency
fast speed, quick updates, ease of use, intuitive UI, automatic, map, location, slow response time, complex interface, delayed updates, lack of features, integration issues, crash, error[P] “The records and other summaries are well-organized, making it easy to view. The intuitive UI and quick updates make it convenient to check how far I’ve run, how many calories I’ve burned, and my location on the map.”
[P] “I tried it for the first time today, and it’s really convenient and accurate, providing fast speed and automatic voice notifications for speed by section, distance covered, route, and calories burned.”
[N] “After finishing a run, errors frequently occur when trying to save the record, leading to the app crashing, the data not being saved, or the map and previous activities being lost, highlighting integration issues and slow response time.”
[N] “It’s extremely frustrating when, after running hard, the app’s delayed updates and slow response time result in errors while saving my running records. The app’s reliability is low, with crashes and a complex interface making it not worth using due to the lack of essential features.”
Function-Related
Fulfillment
coaching, appropriate guidance, good functionality, integration, marathon preparation, exercise goals, exercise records, coaching, noise, voice guidance, GPS[P] “It really helps me pace myself and improve my records! The coaching feature provides appropriate guidance, and the challenges keep me motivated to continue, making it feel like completing quests in a game.”
[P] “After installing this app and starting to run without any plan, now, 8 months later, I can comfortably run 7–8 km regardless of my condition. The exercise records and route history are great for marathon preparation and tracking my progress.”
[N] “I’m unable to set up my own exercise goals or coaching plan. When I input my current status and press complete, the integration fails, and an error occurs. Even after retrying, it just keeps repeating the process endlessly.”
[N] “It would be nice to have the option to turn off voice guidance. I always use the app for running, even when I’m walking, but there are times when the voice becomes too noisy and distracting.”
System
Availability
stable performance, high availability, no downtime, system operation, accuracy, distance, measurement, time, storage, technical issues, server instability
system downtime, instability, errors, data loss, interruption
[P] “It’s free, and the exercise records are detailed, which is really great. The app offers stable performance with high availability, making it enjoyable to track my progress day by day. I highly recommend everyone download this useful app and work out hard. Sincere thanks to the developers. Thank you.:)”
[P] “It measures running data, including distance and time, in real-time with complete accuracy. Also, since the records are reliably saved, I can easily compare before and after to evaluate my performance and improve in my next run. Very good.”
[N] “It frequently experiences system downtime, leading to lags and slowdowns. Tracking often stops when running other apps, which points to system instability. Despite these technical issues, I continue using it due to its clean interface.”
[N] “I’ve saved 500 km of running records over the past two years, but when I logged in today after suddenly being logged out, everything was reset...!!! This data loss due to server instability is unacceptable!!!”
Data
Privacy
protection, security, privacy, screen record, login, logout, personal data information, personal data, leaks, vulnerabilities, invasion, deletion, hacking[P] “I love that I can save my running records with photos, creating great memories while ensuring my personal data is securely stored. My personal exercise journal is coming together, making this app even more precious to me.”
[P] “I’m using it well. Once, the data didn’t load and the screen froze, so I deleted and reinstalled the app, and my records were still protected and intact. It’s good.”
[N] “It’s frustrating that the app requires logging in every time I enter. I keep using it because I don’t want to lose my personal data, but the login process feels like an invasion of privacy. I’m also amazed at the incredibly slow response to security vulnerabilities, despite numerous complaints in the past.”
[N] “I logged in with my friend’s account once, and all of my friend’s personal information remained on the app. It makes me uncomfortable to think that my data could be vulnerable to leaks or hacking. The app should ensure that personal information is fully deleted after logging out, especially when using a different device.”
Table 4. Frequency of reviews and service quality scores for each dimension.
DimensionNumber of
Positive
Reviews
Number of
Negative
Reviews
Service Quality Score
App System Efficiency16,06218,633−0.0741
Function-Related Fulfillment27,05814,3020.3084
System Availability906624,667−0.4625
Data Privacy785413,200−0.2539
Disclaimer/Publisher’s Note: The statements, opinions and data contained in all publications are solely those of the individual author(s) and contributor(s) and not of MDPI and/or the editor(s). MDPI and/or the editor(s) disclaim responsibility for any injury to people or property resulting from any ideas, methods, instructions or products referred to in the content.

