
Order Distribution and Routing Optimization for Takeout Delivery under Drone–Rider Joint Delivery Mode


Abstract
1. Introduction
2. Literature Review
2.1. Order Distribution Intended Freight Distribution in an Urban Area
2.2. Takeout Delivery
2.3. Drone Delivery
3. Problem Description and Model Establishment
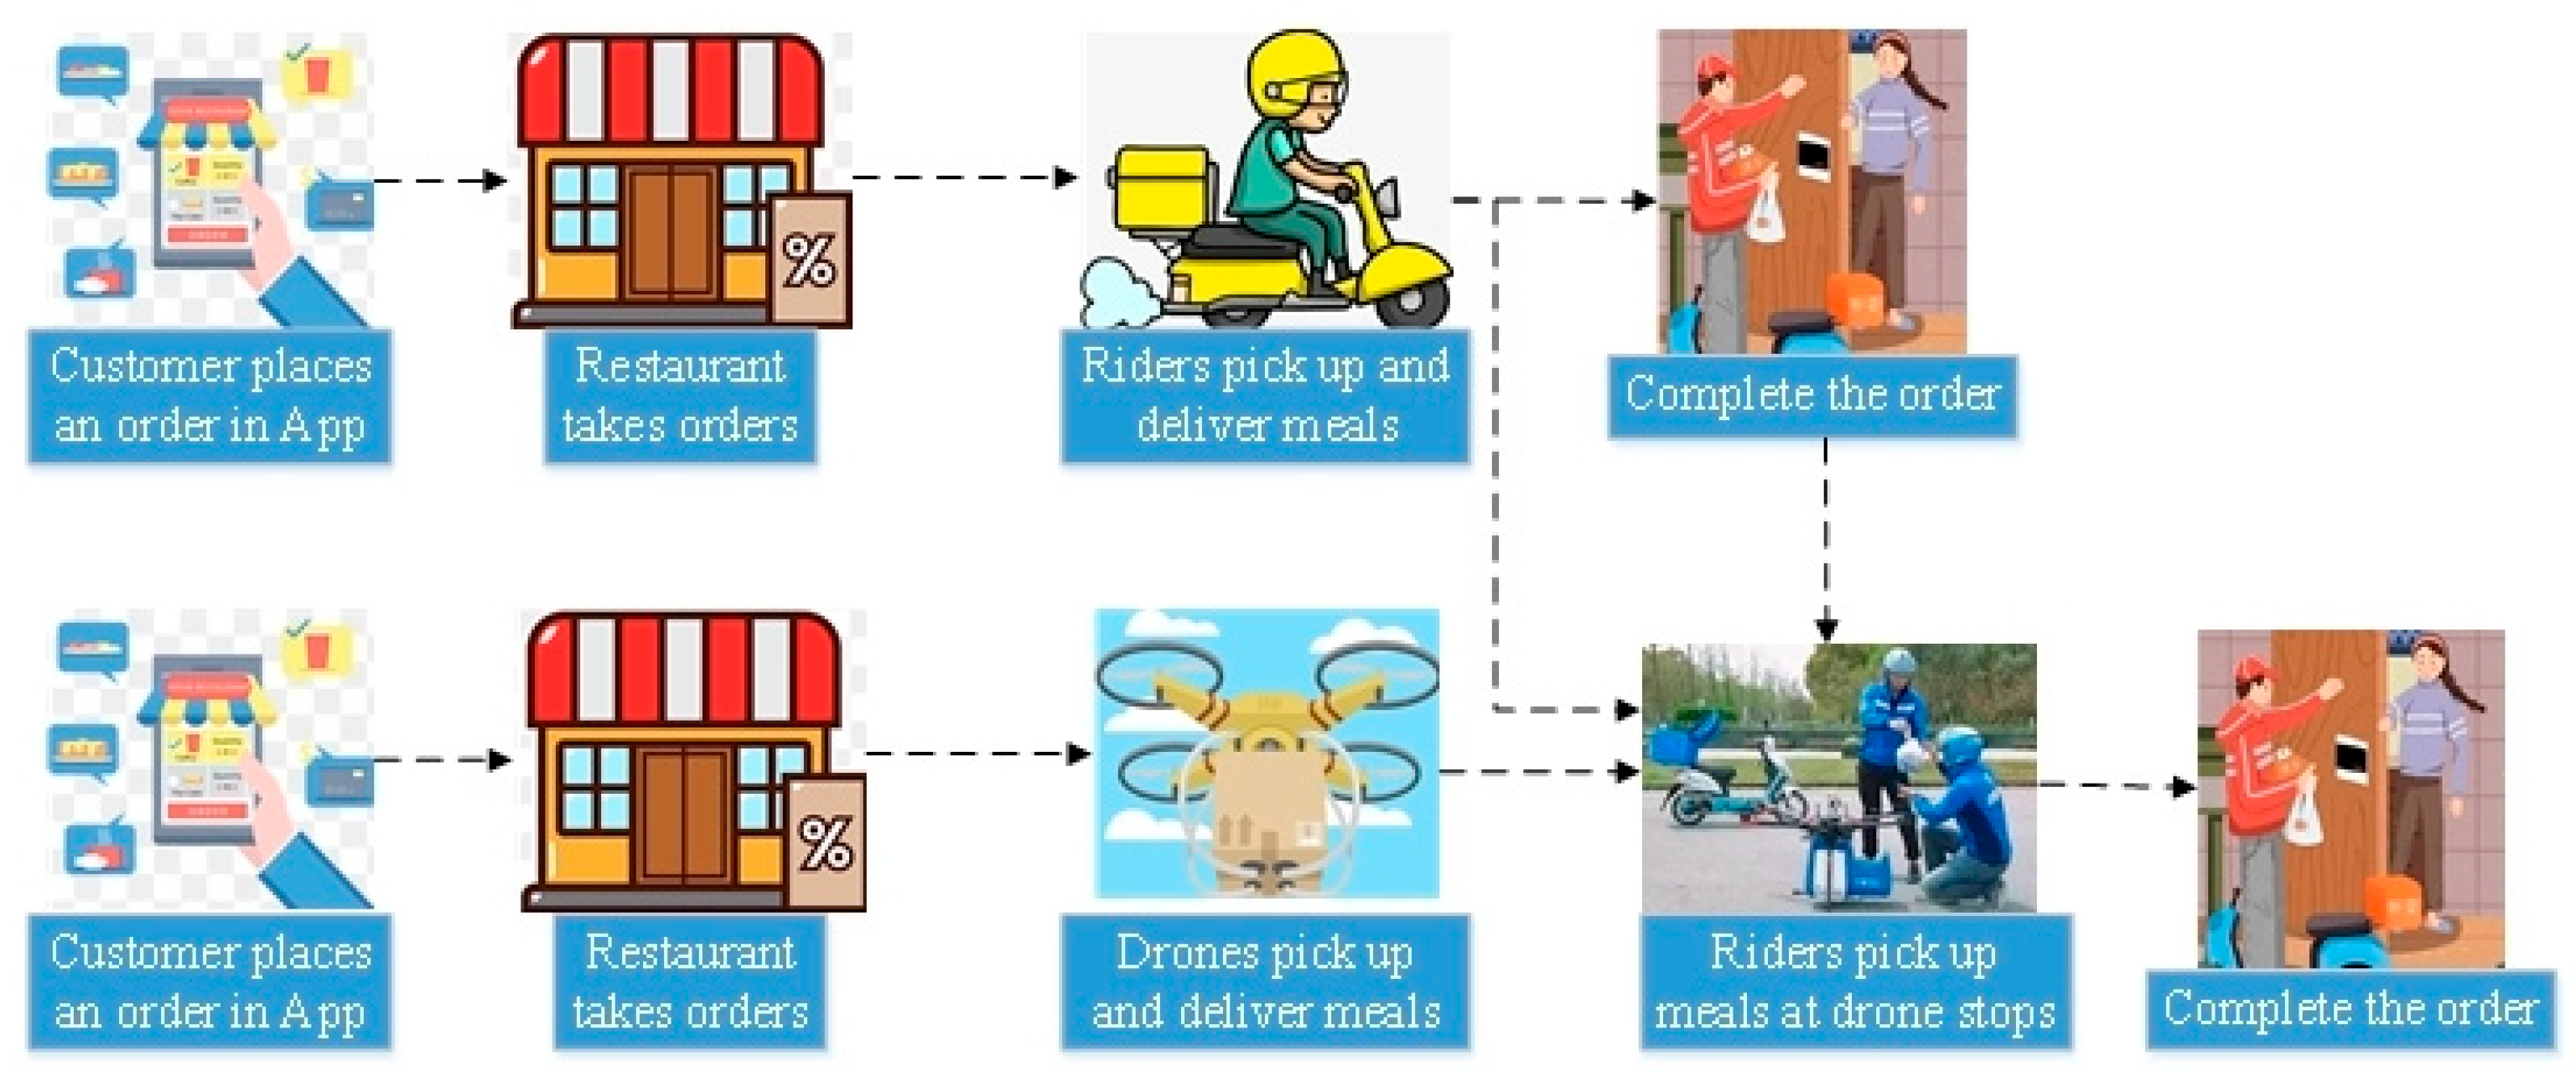
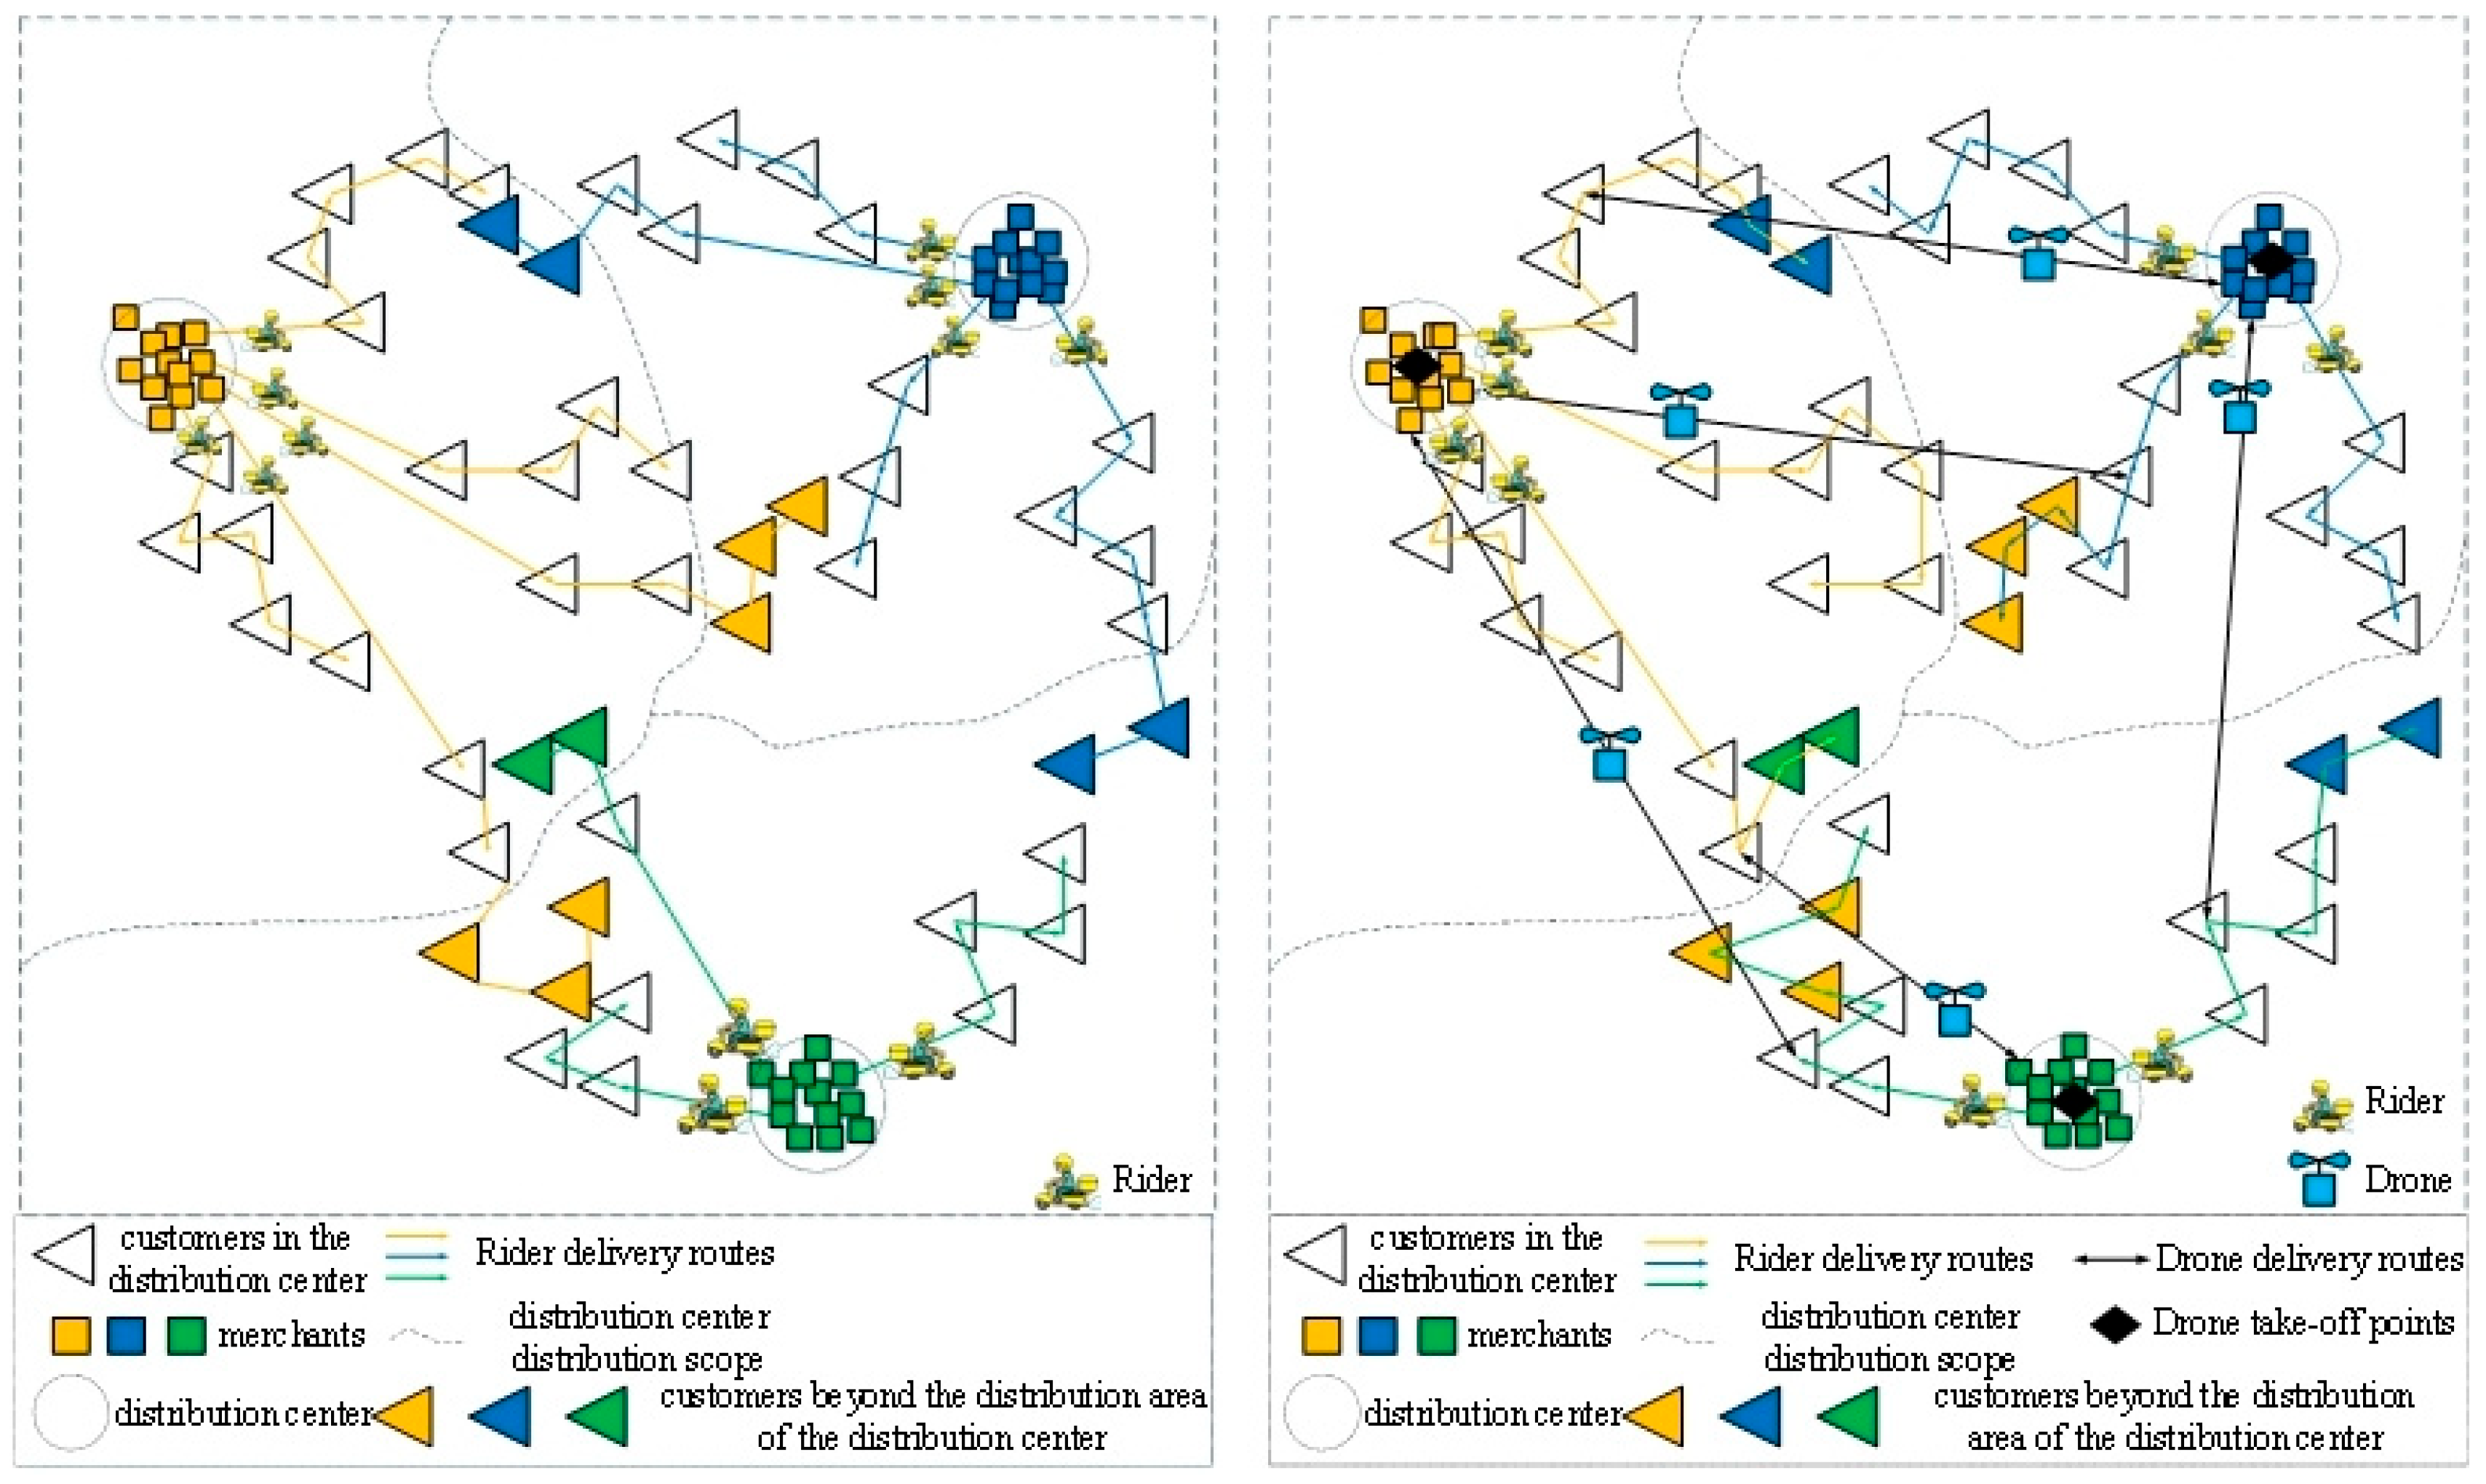
3.1. Problem Description
3.2. Assumptions
- (1)
- Rider delivery capacity is the same and there is no constraint on the maximum mileage traveled, regardless of the electric vehicle’s range. There is a certain service time for the rider to pick up and deliver the goods, and the time is set to a fixed value.
- (2)
- A one-to-one correspondence is assumed between merchant points and customer points. Multiple customers placing orders with the same merchant are set to multiple merchant points with the same coordinates. If the same customer places orders with multiple merchants, it will be set as multiple customer points with the same coordinates.
- (3)
- Electric vehicles and drones travel at a constant speed.
- (4)
- In the delivery process, the weather, accidents, and other circumstances are not considered, and the delivery can be carried out normally.
3.3. Model Establishment
3.3.1. Model Notation Definition
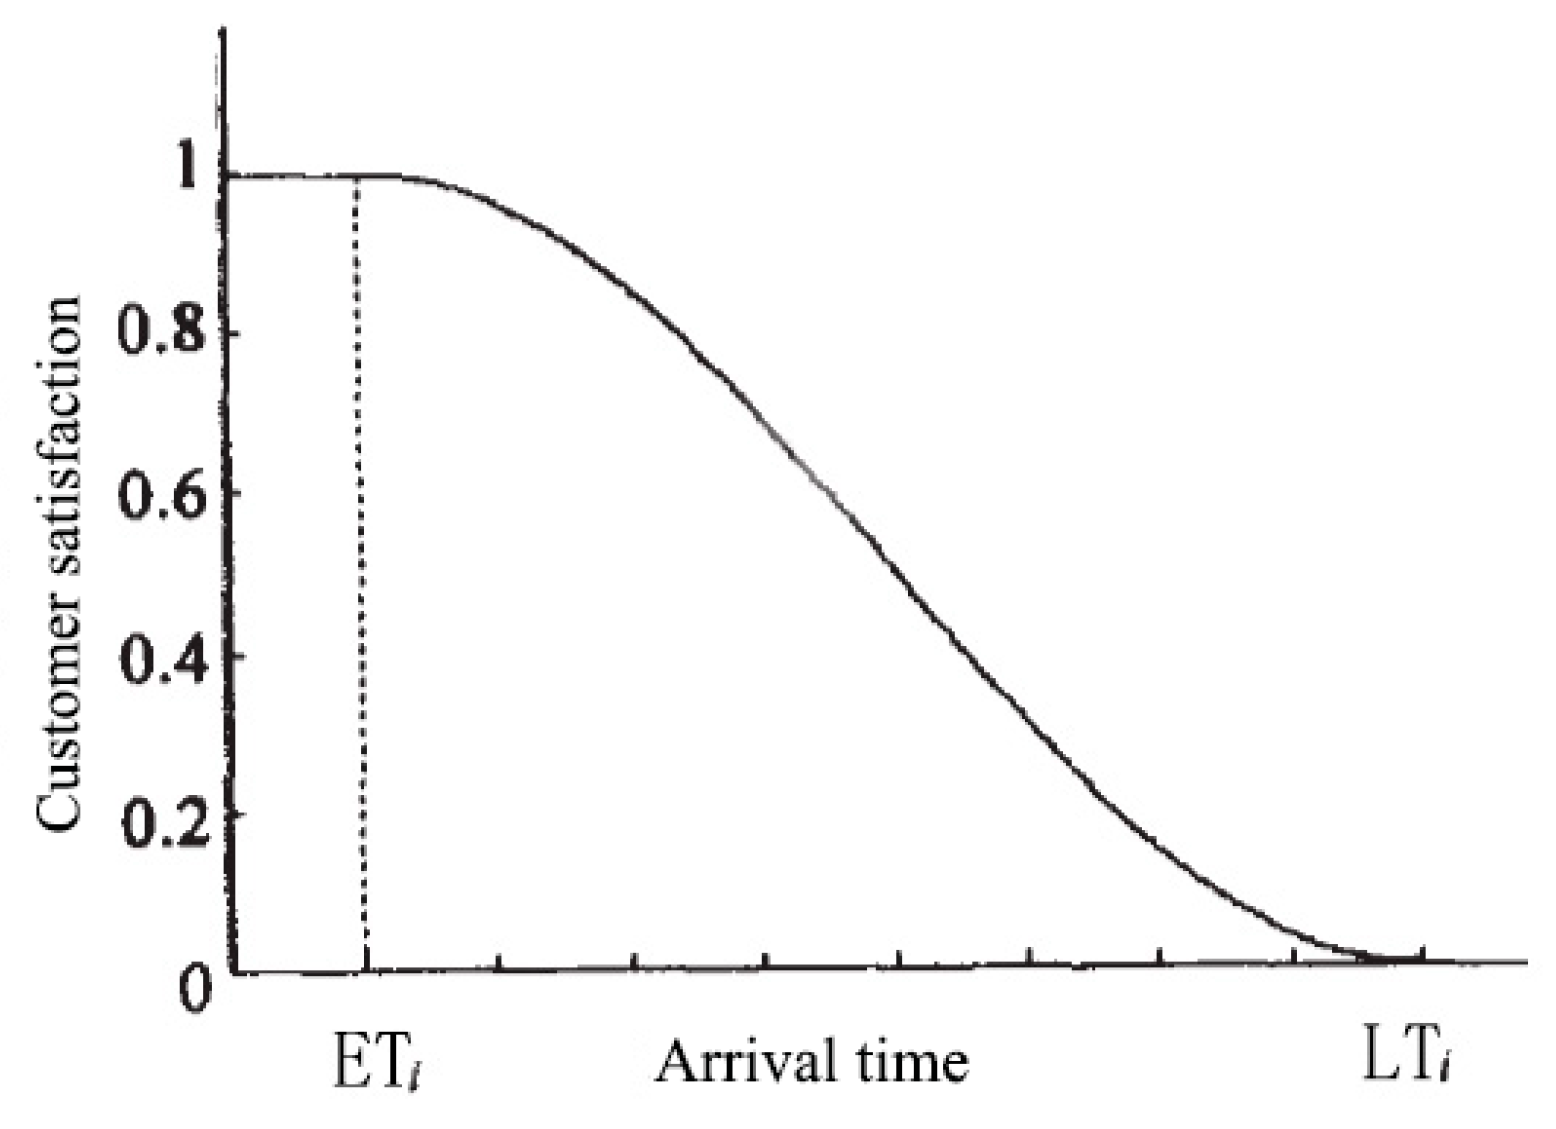
3.3.2. Customer Satisfaction Function
3.3.3. Drone Energy Consumption
3.3.4. Multi-Objective Optimization Model
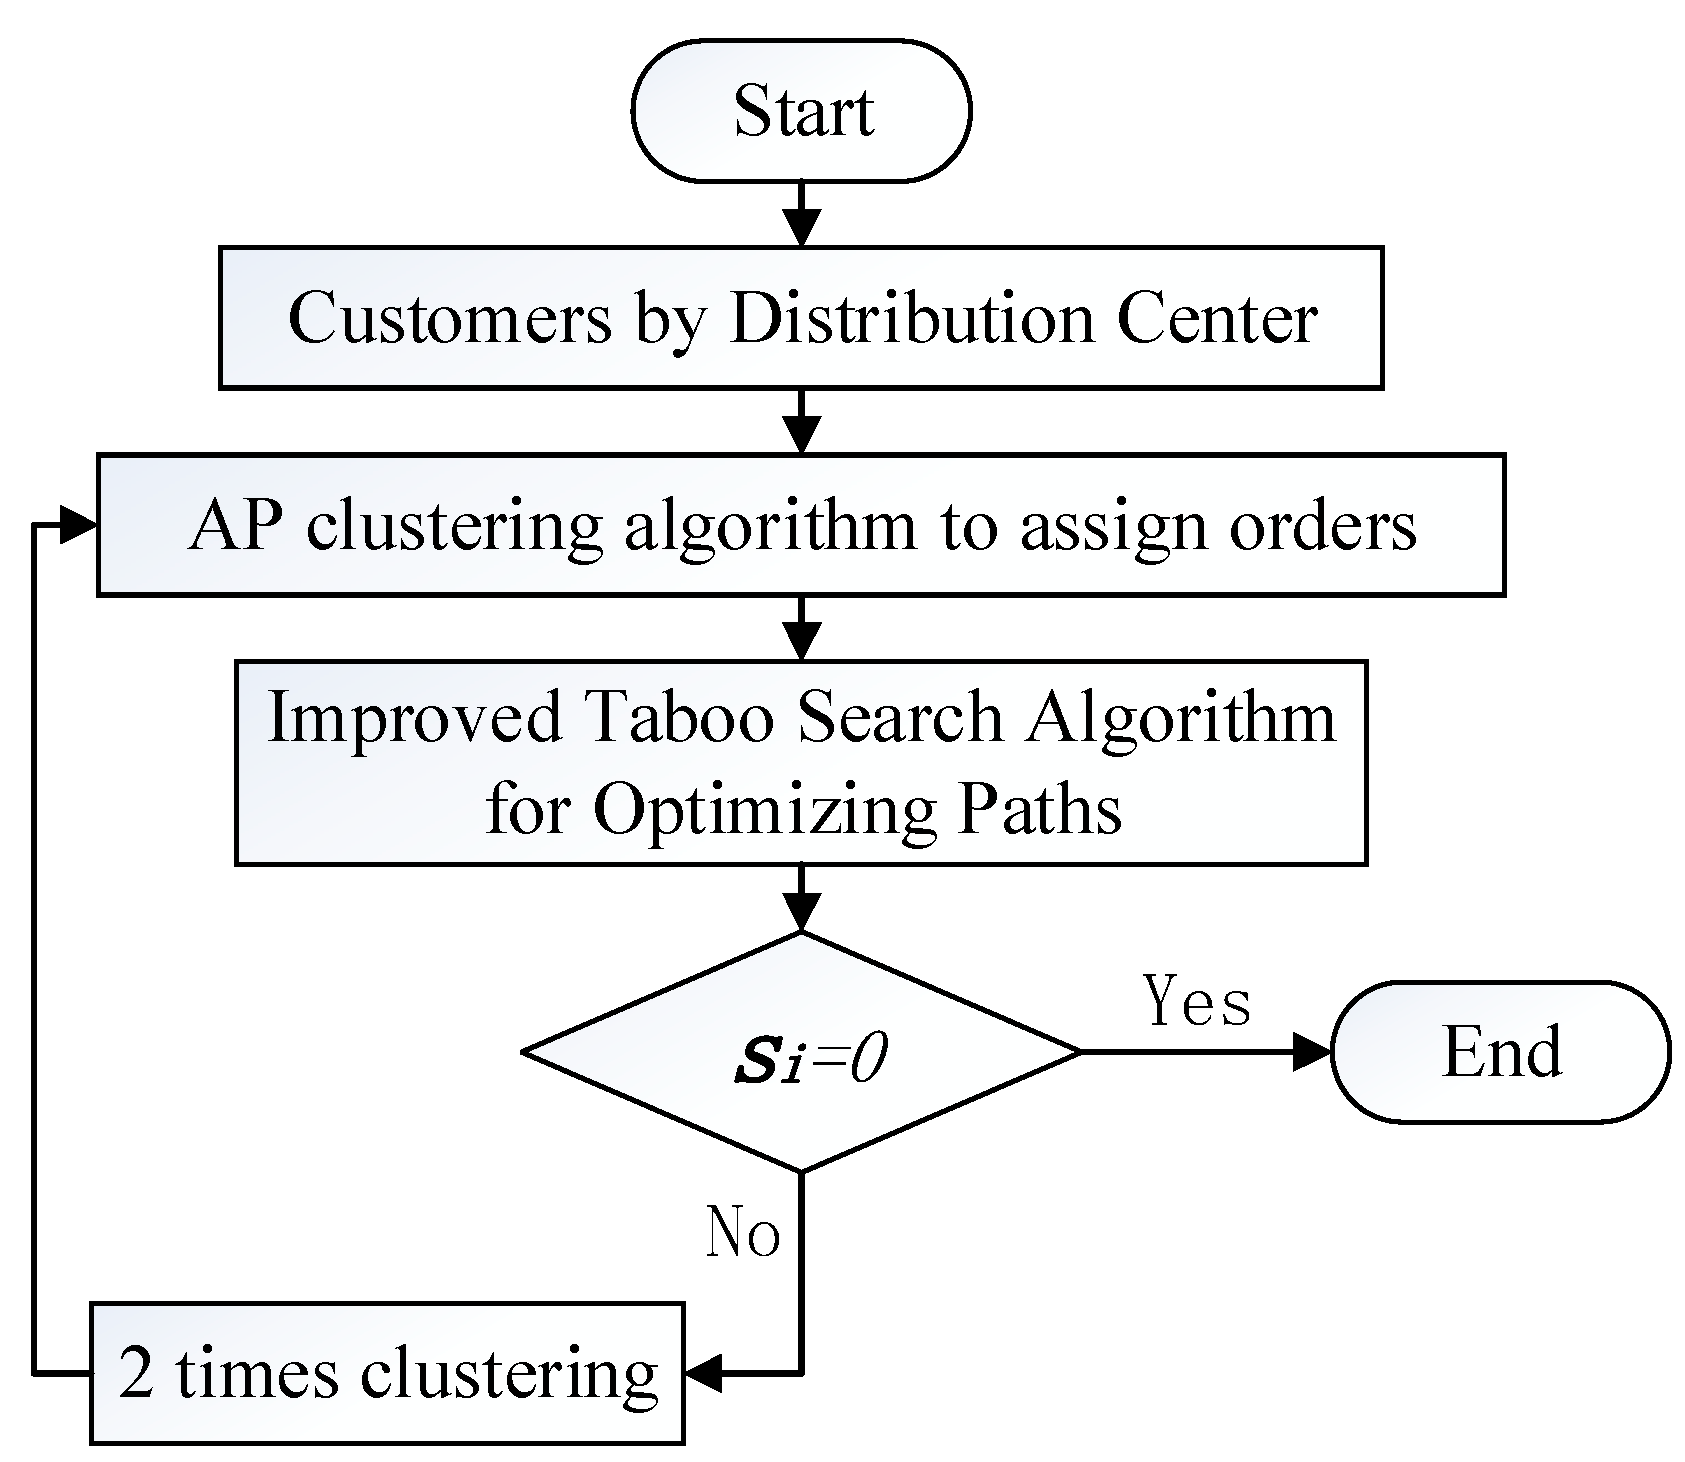
4. Two-Stage Heuristic Algorithm
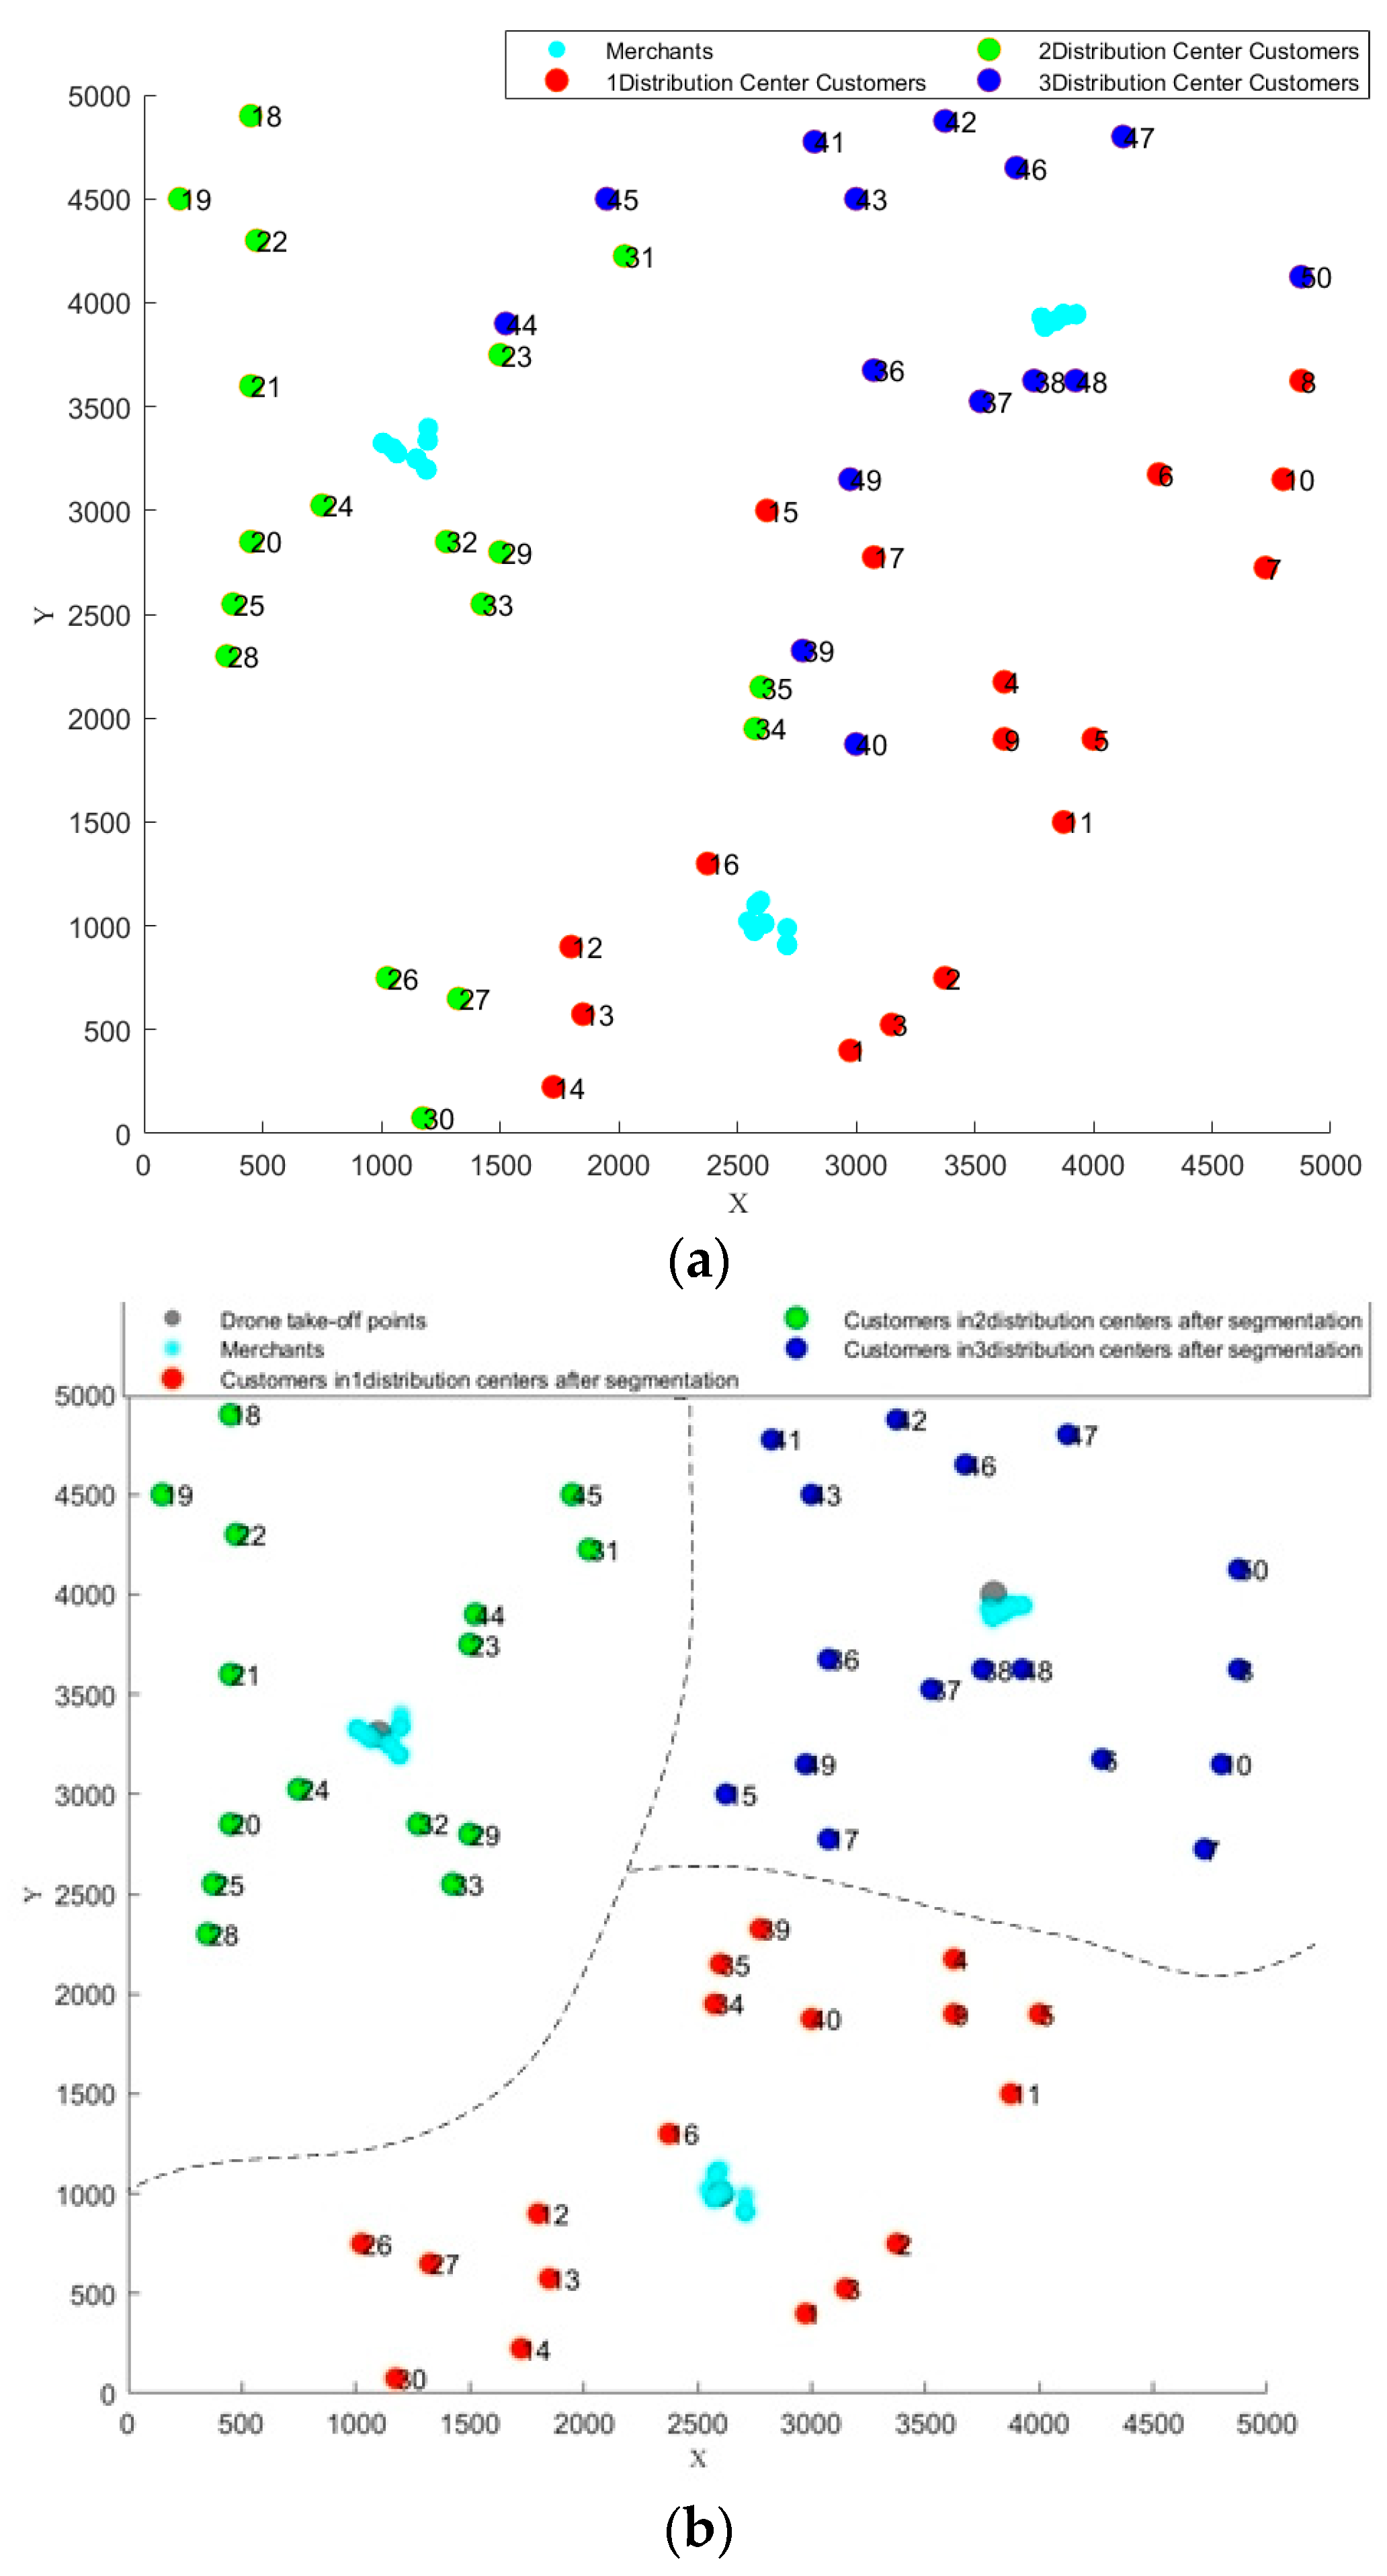
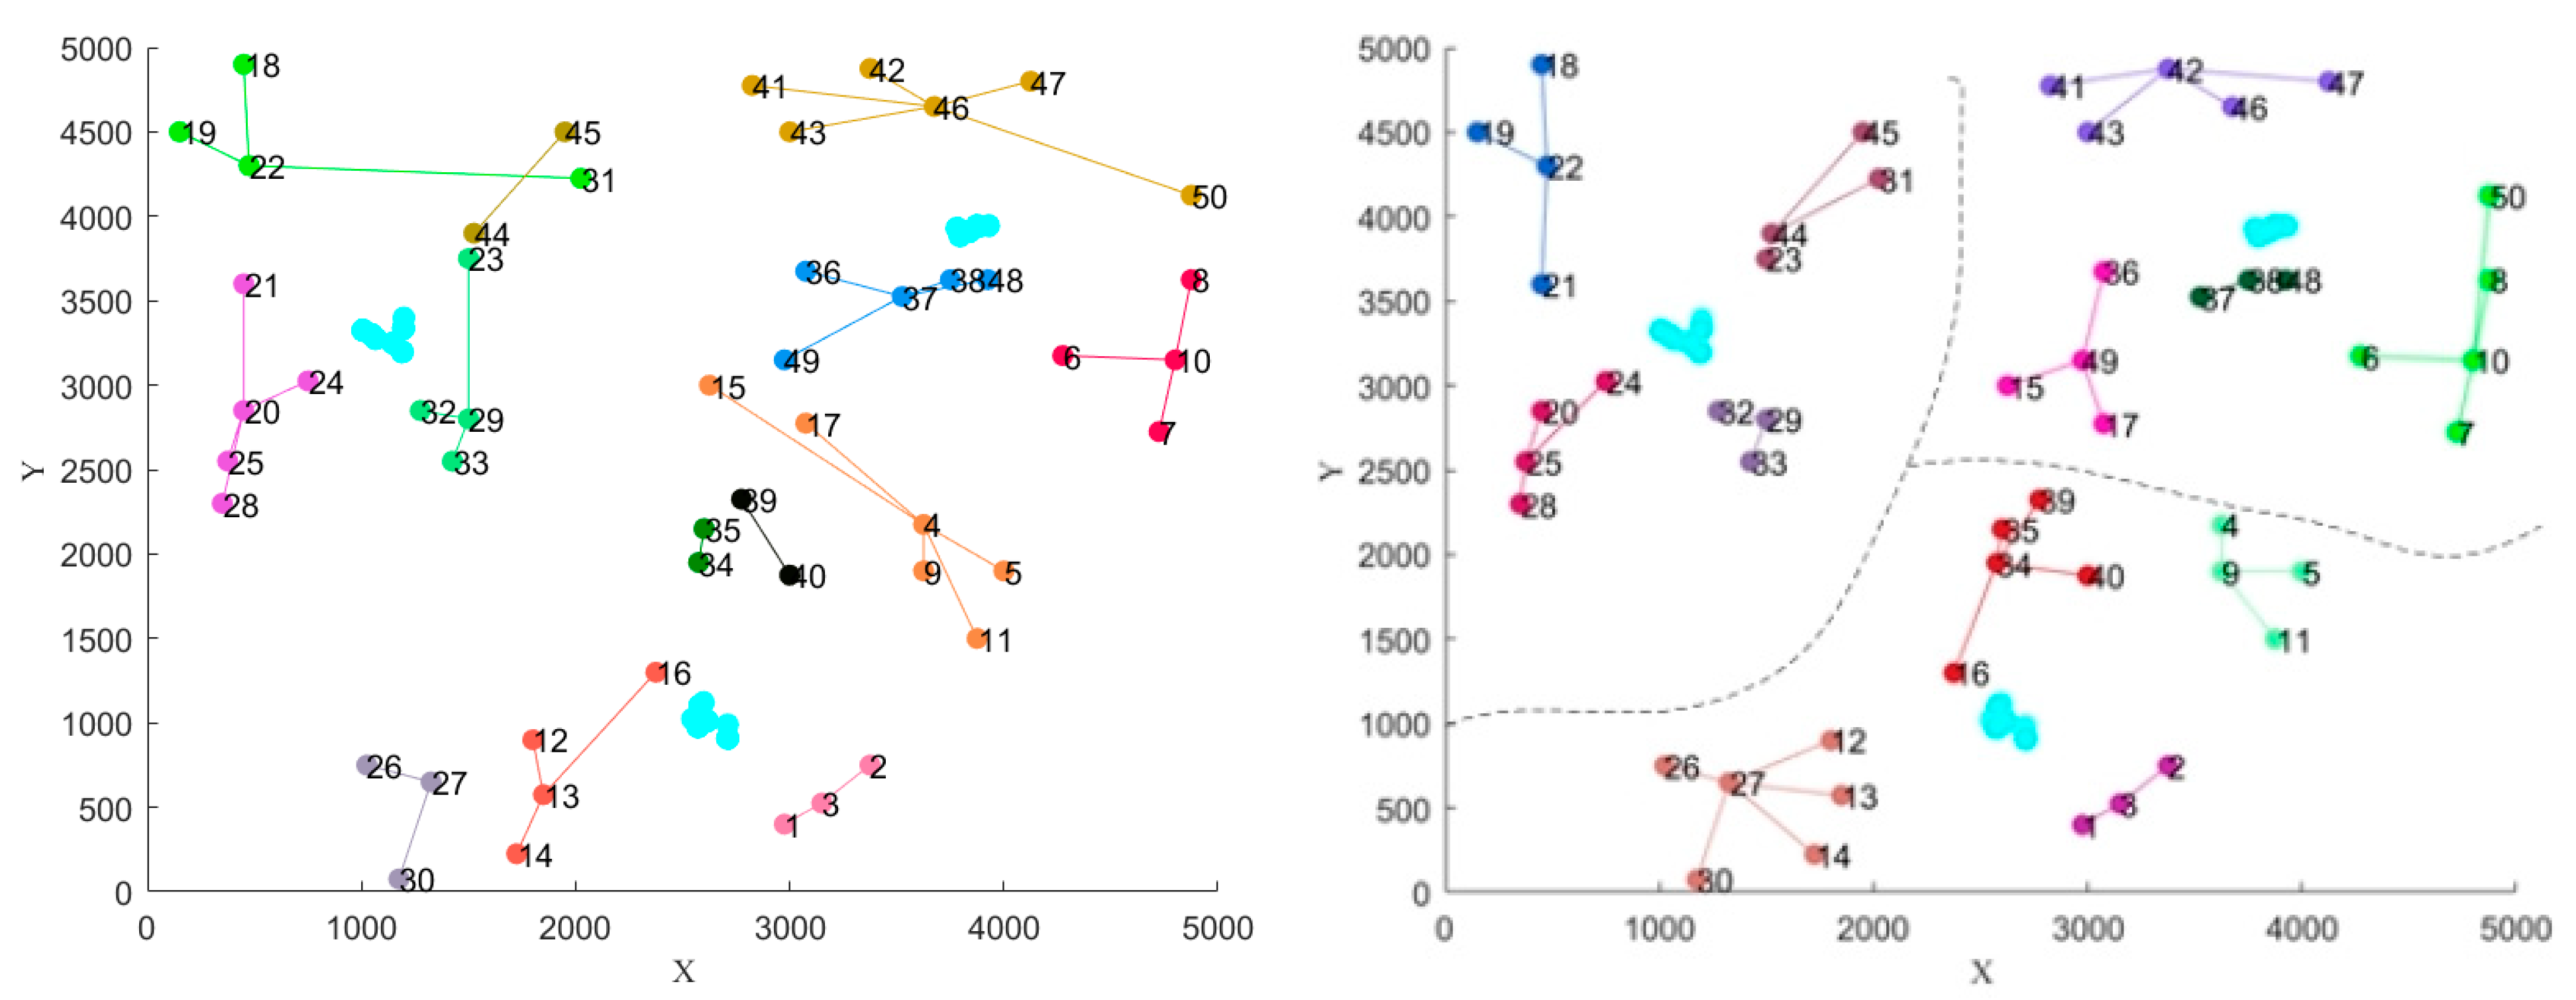
4.1. In the First Stage: AP Clustering Algorithm
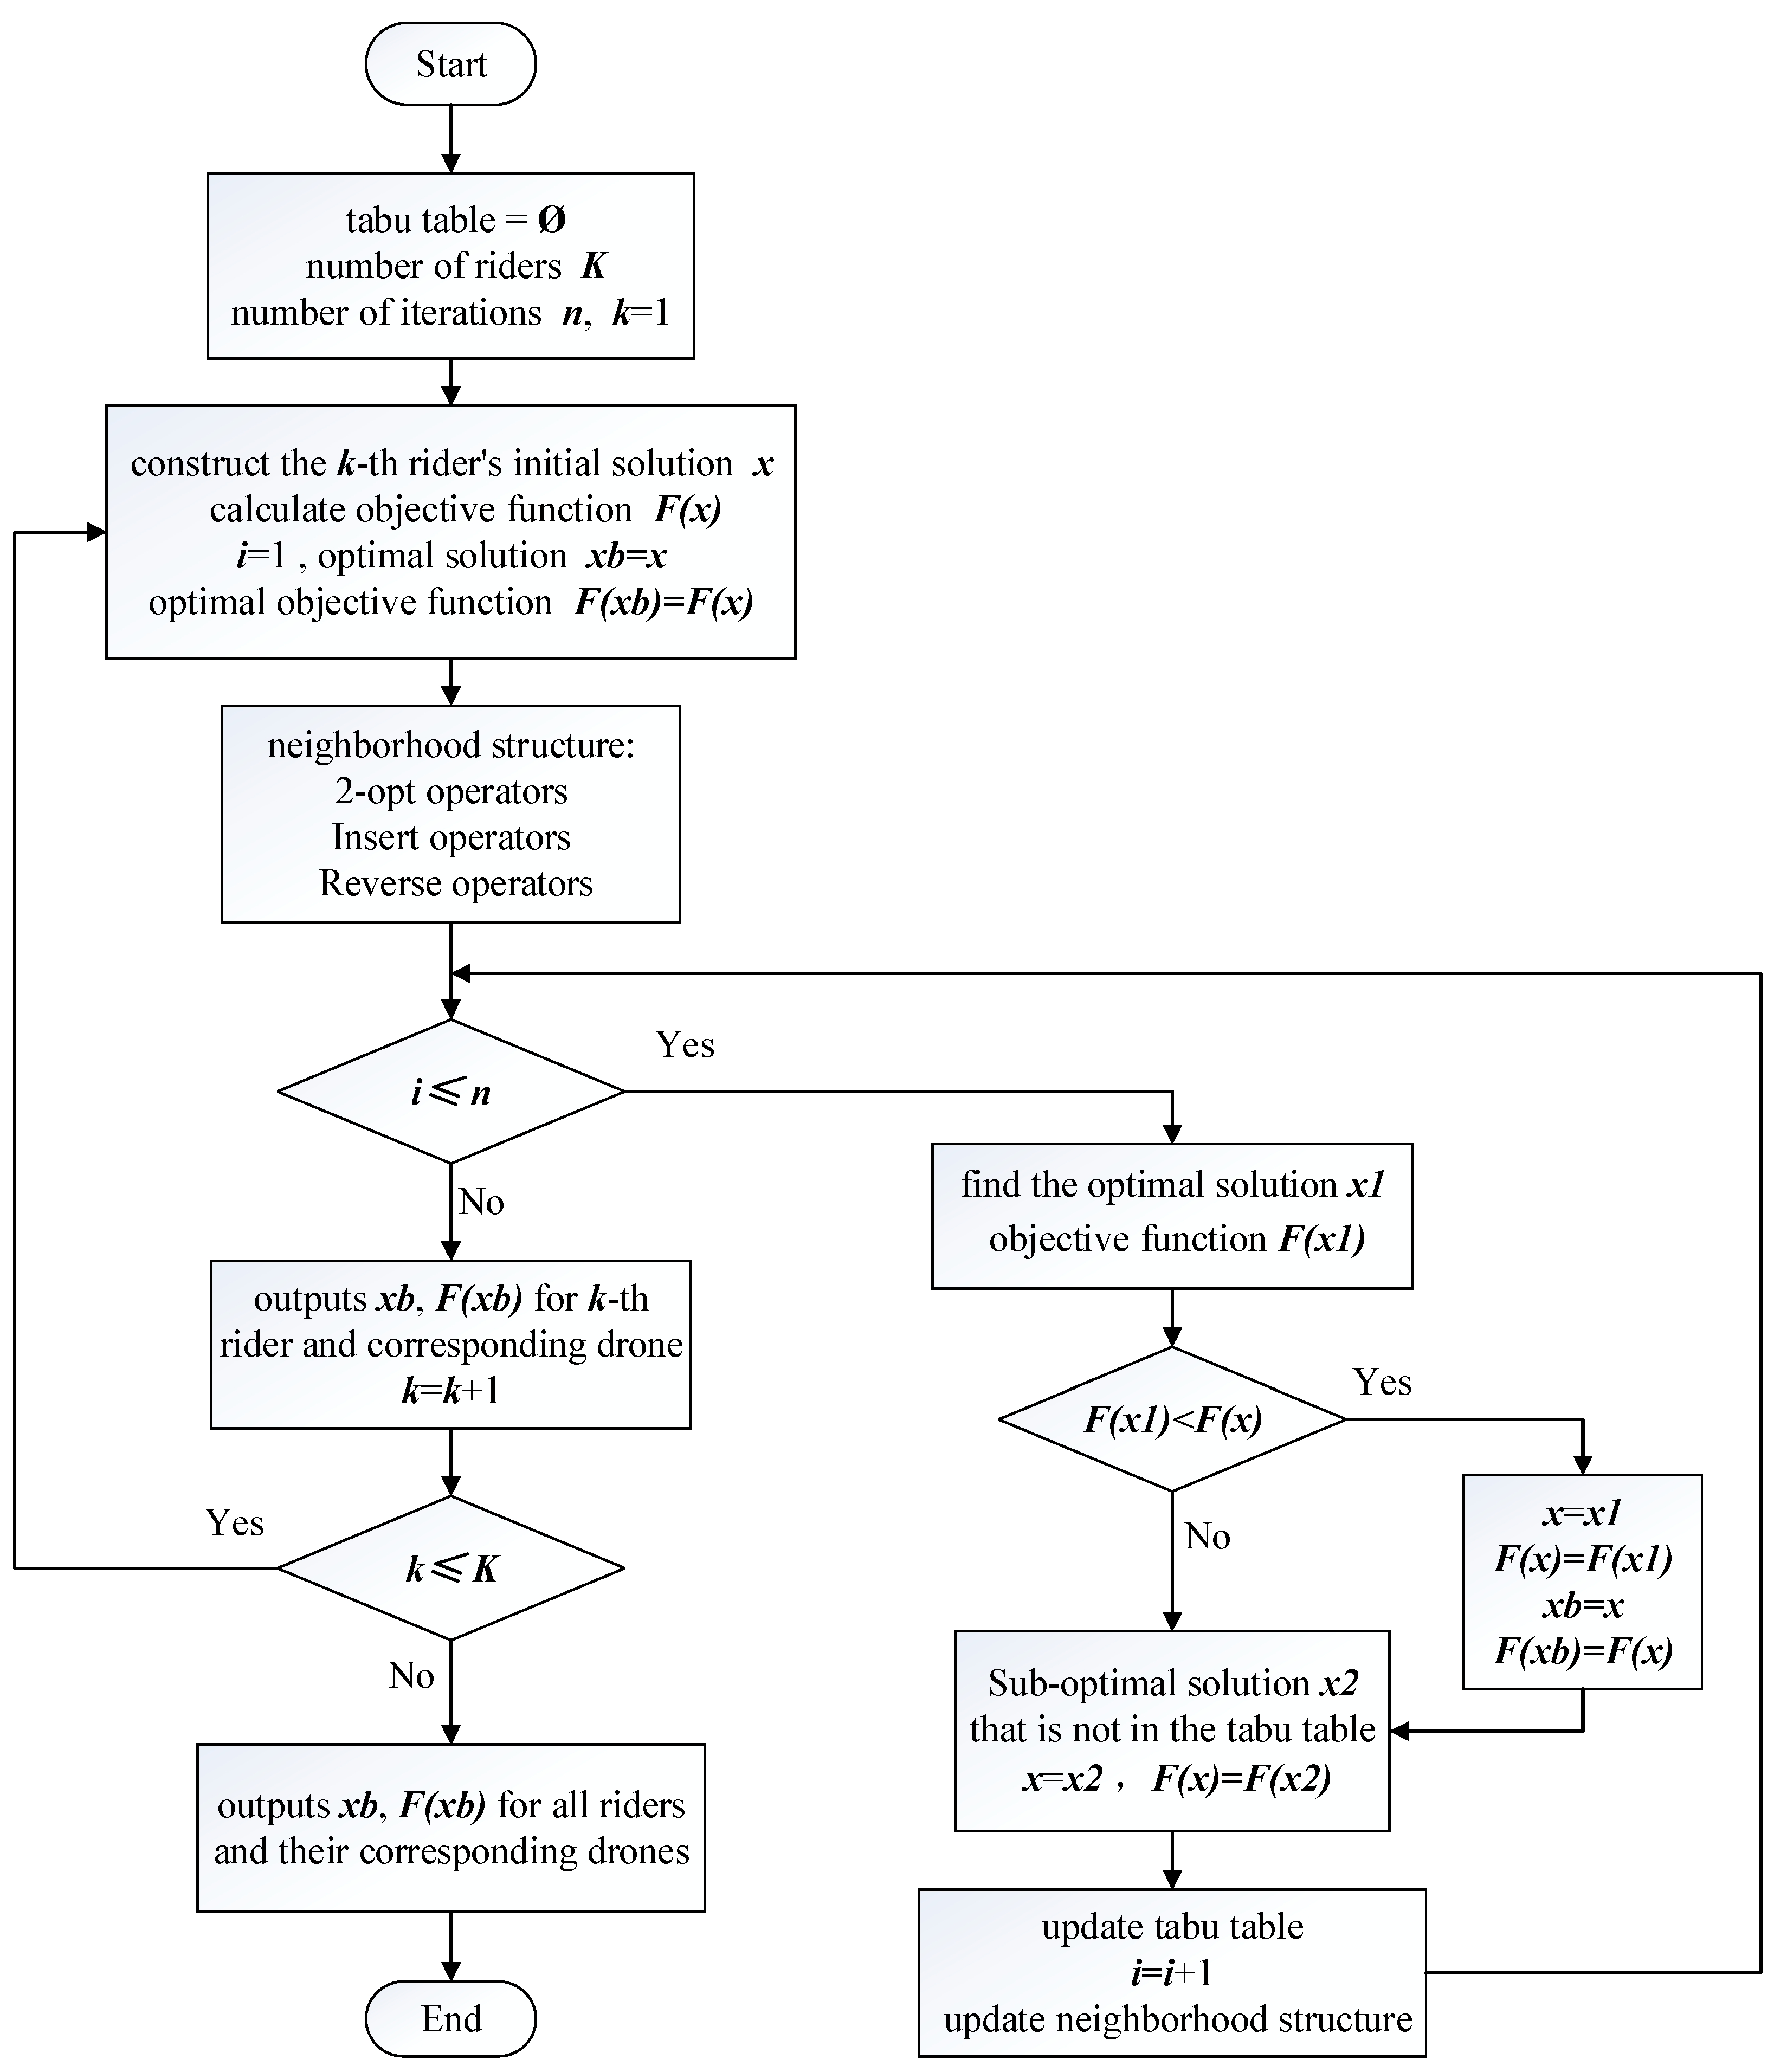
4.2. In the Second Stage: Improved Tabu Search Algorithm
- (a)
- Generate initial solution
- (b)
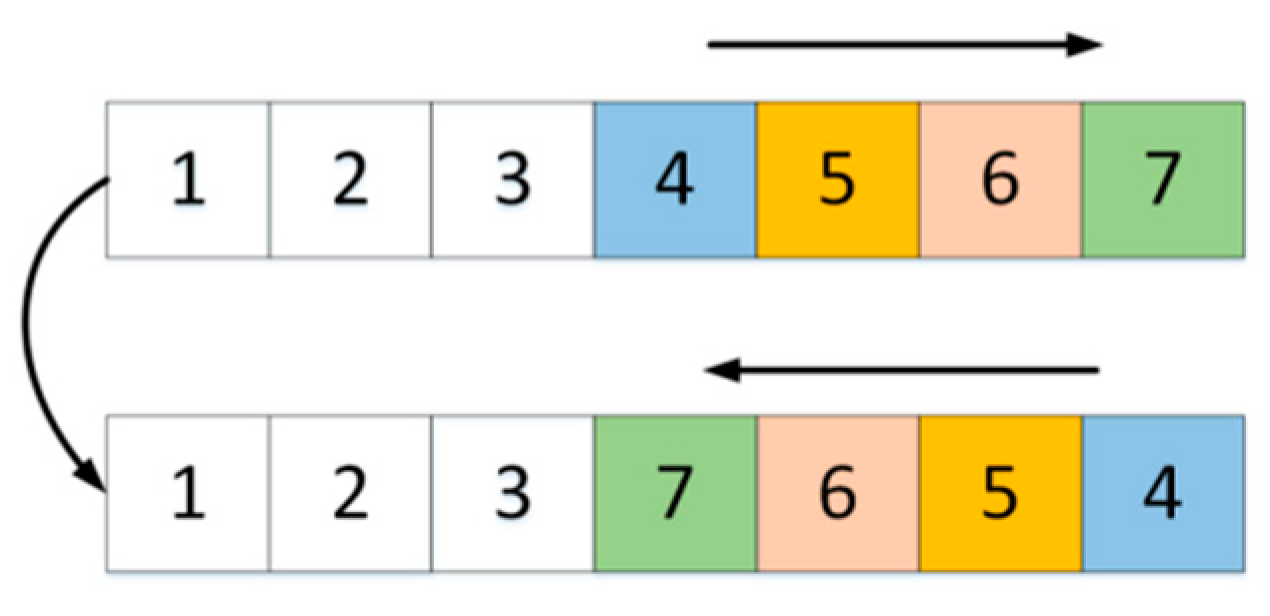
- Neighborhood structure
- (c)
- Length of tabu table
- (d)
- Fitness function
- (e)
- Stop guidelines
4.3. Two Times Clustering
5. Simulation Experiment and Result Analysis
5.1. Data Sources and Experimental Settings
5.2. Comparison of Experimental Results
5.2.1. Comparison of the Two Modes
5.2.2. Comparison of Different Instances
5.3. Damping Factor λ
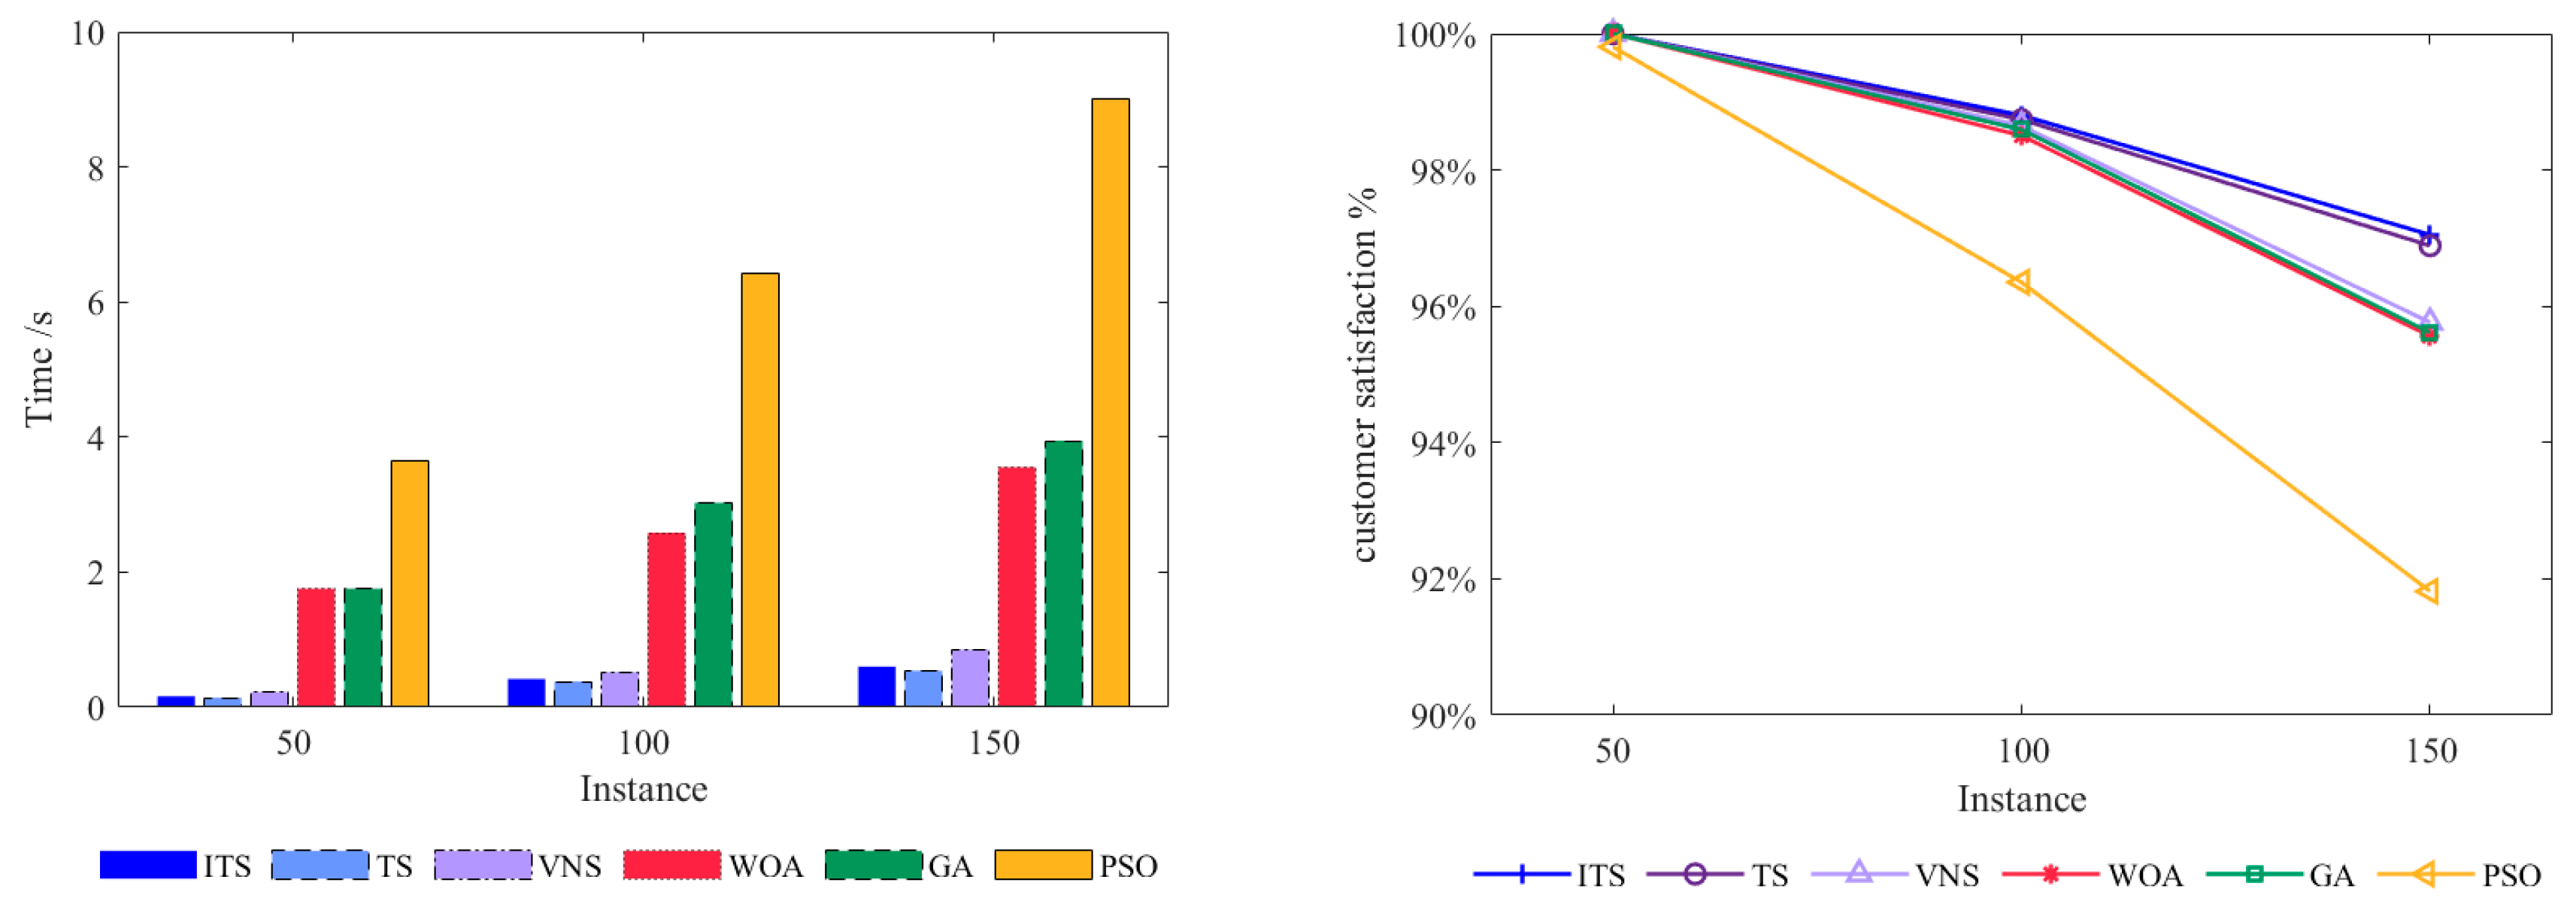
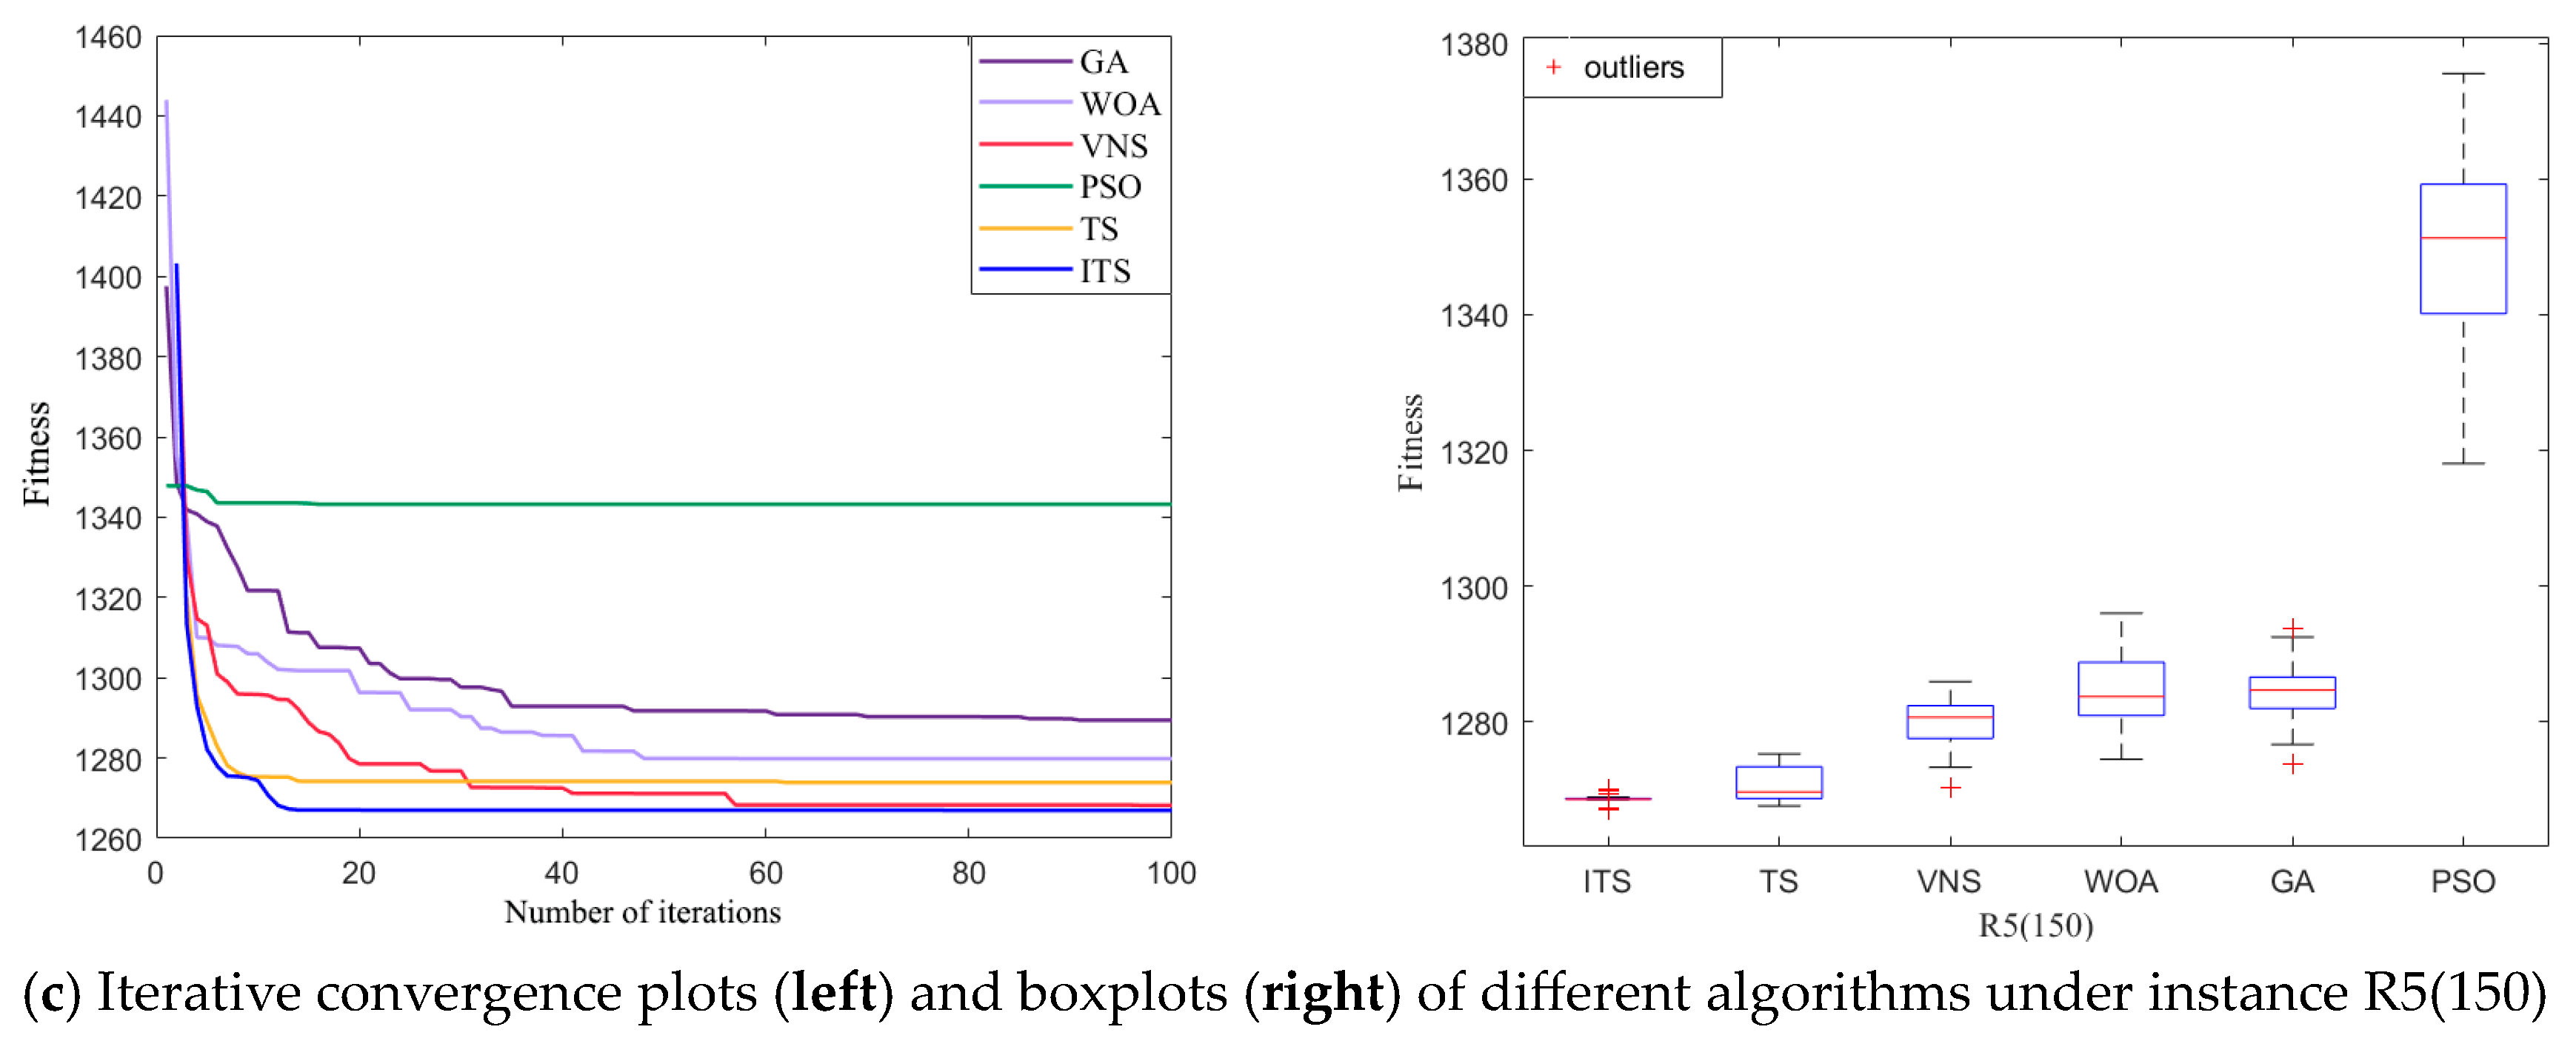
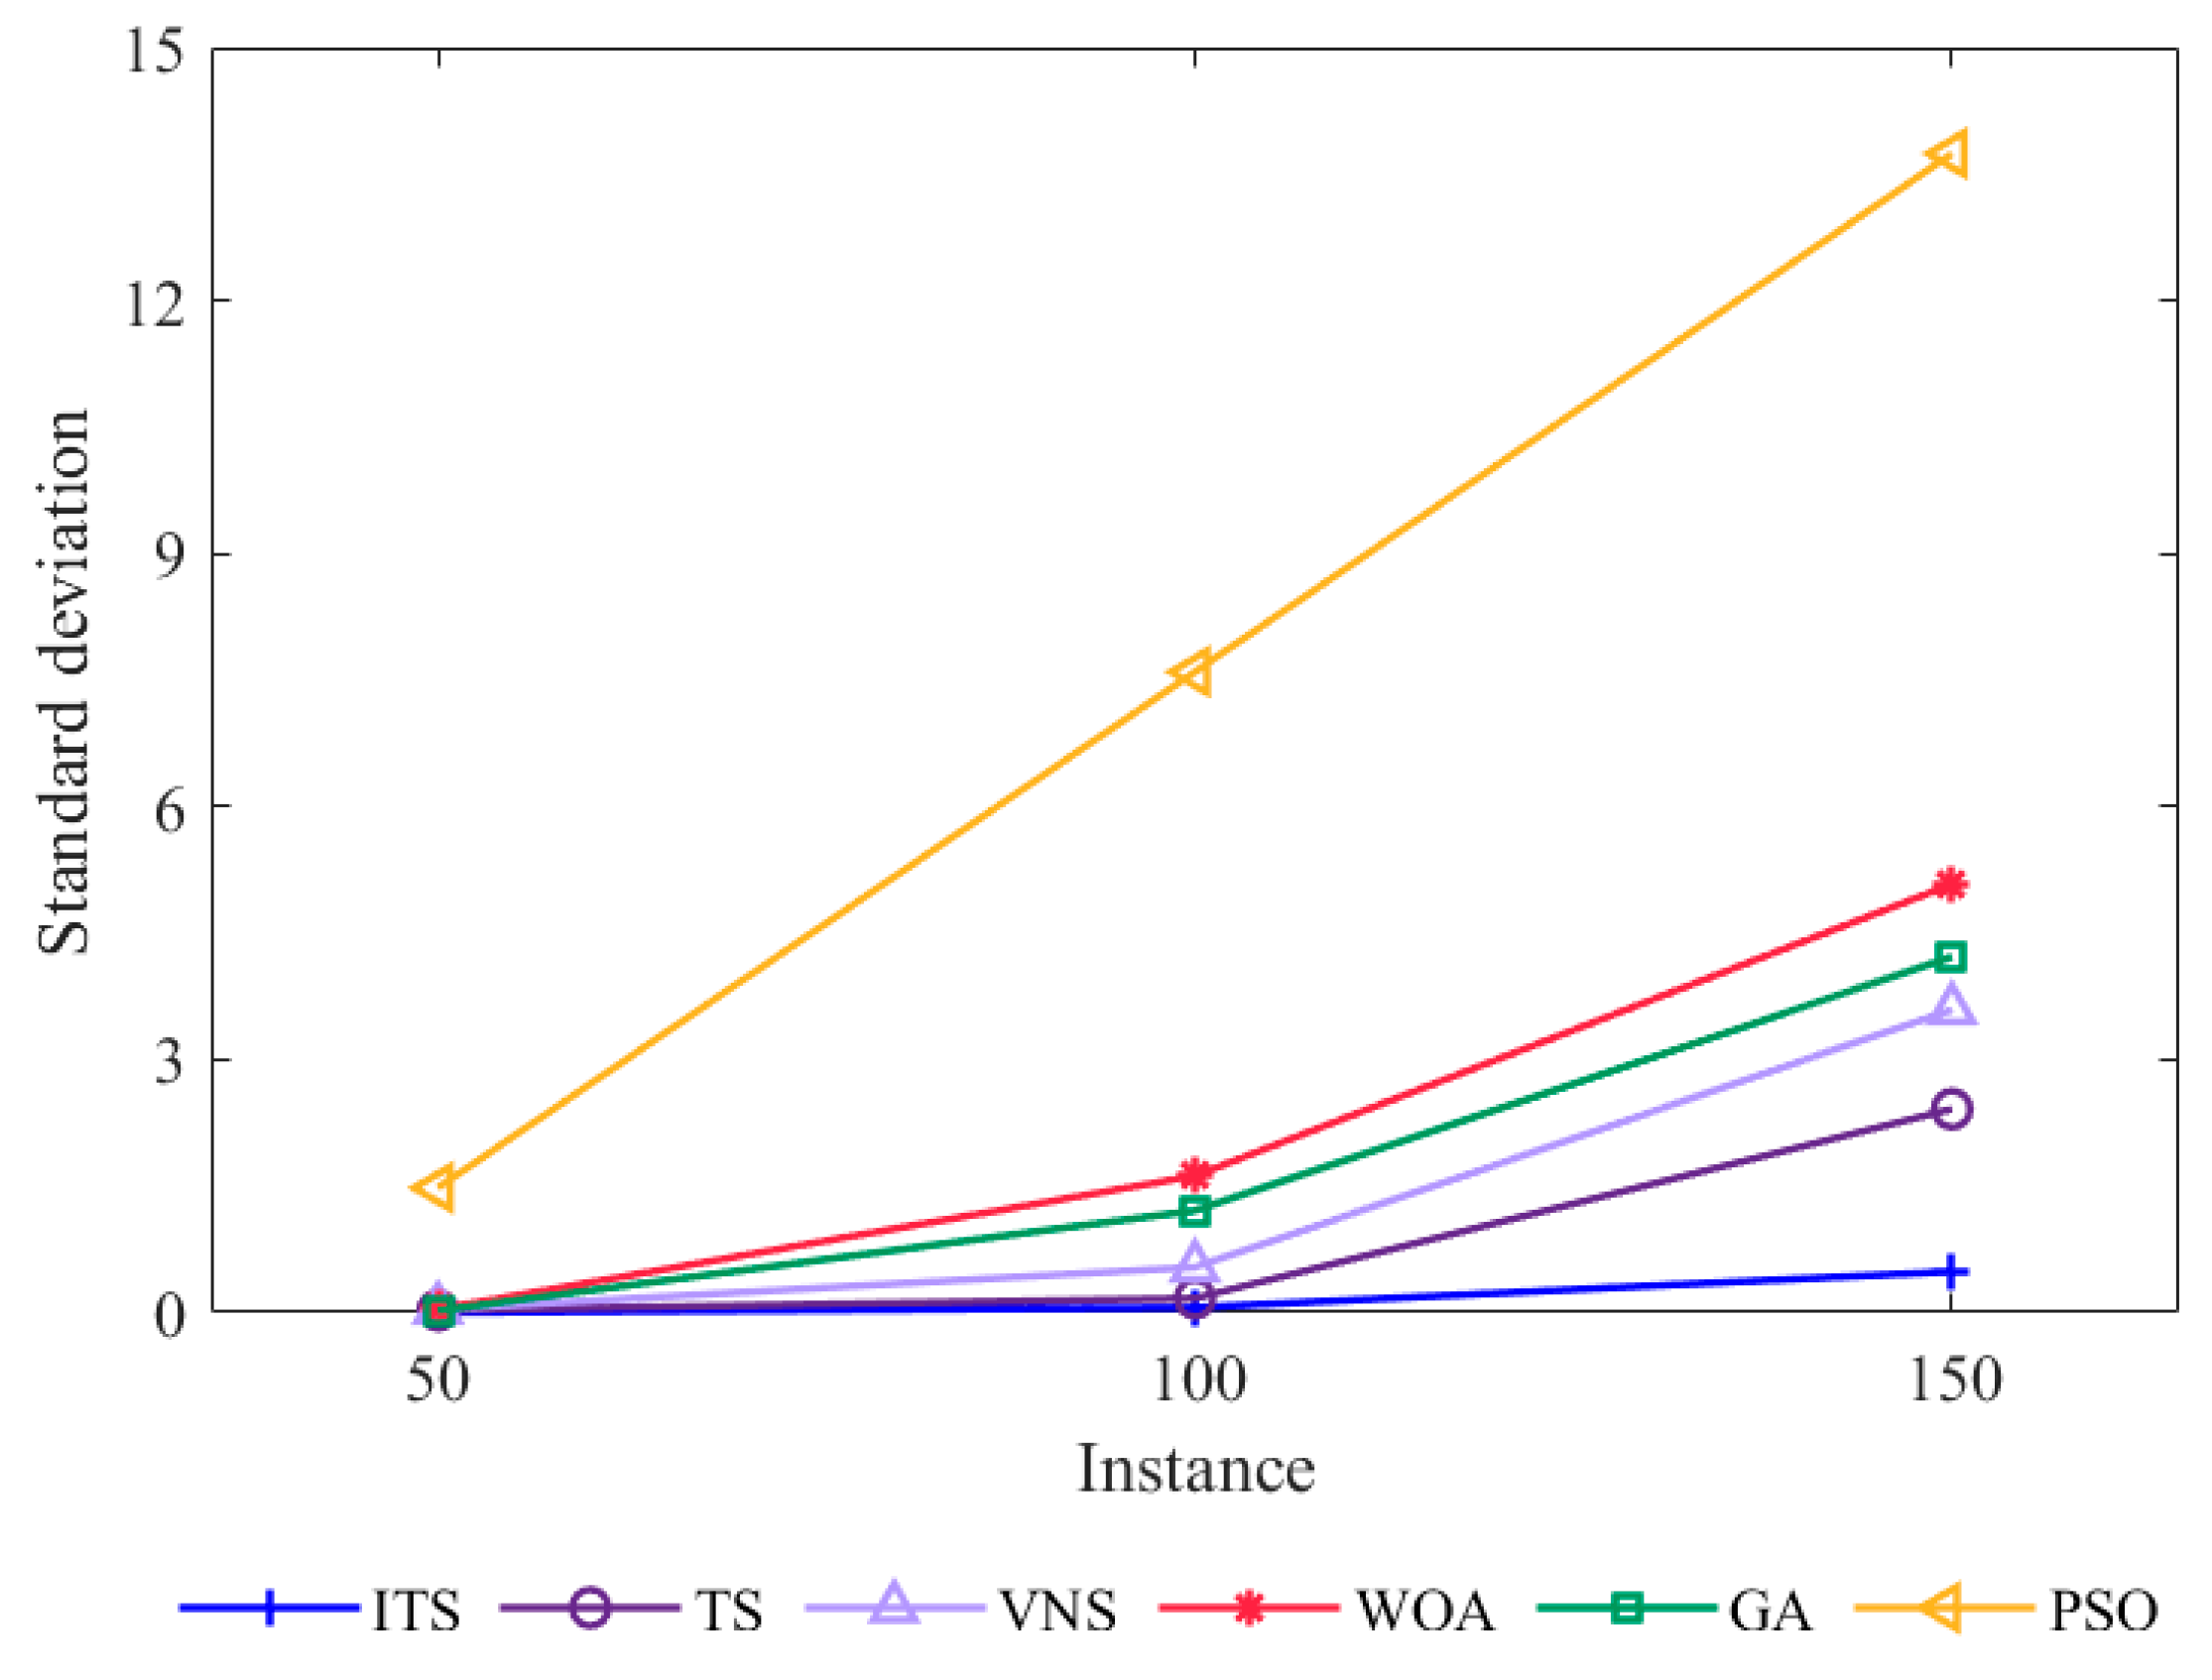
5.4. Algorithm Performance Comparison
6. Conclusions
- (1)
- Starting from the actual situation, we consider the collaboration of multiple distribution centers to make the service scope of merchants wider and at the same time satisfy the customers’ requirements on order delivery time. Through the study of order allocation and delivery route optimization problems, the platform reduces the distribution cost and gains profit while attracting more customers, in line with reality.
- (2)
- We propose the mode of drone–rider joint delivery and compare it with the traditional delivery mode. The analysis concludes that the mode can effectively reduce the number of riders used, reduce the transportation cost, and improve customer satisfaction.
- (3)
- The effectiveness of the algorithm proposed in this paper is verified through experimental cases. The value of the damping factor λ in the AP clustering algorithm plays an important role in the solution of the model, so the running results are optimized by debugging its assignment. As the size of the case increases, the running results of ITS have better stability compared to other algorithms.
Author Contributions
Funding
Institutional Review Board Statement
Informed Consent Statement
Data Availability Statement
Acknowledgments
Conflicts of Interest
References
- Wang, Z.; Neitzel, R.L.; Zheng, W.; Wang, D.; Xue, X.; Jiang, G. Road safety situation of electric bike riders: A cross-sectional study in courier and take-out food delivery population. Traffic Inj. Prev. 2021, 22, 564–569. [Google Scholar] [CrossRef] [PubMed]
- Jeong, H.Y.; Song, B.D.; Lee, S. The Flying Warehouse Delivery System: A Quantitative Approach for the Optimal Operation Policy of Airborne Fulfillment Center. IEEE Trans. Intell. Transp. Syst. 2020, 22, 1–10. [Google Scholar] [CrossRef]
- Jiao, T.; Li, X.; Meng, L. Effect of geographical distribution of online customer on operational decisions for take-out service retailers—Empirical analysis based on order data from Ele.me. China Soft Sci. 2020, 351, 122–133. [Google Scholar]
- Luo, J.; Tang, J.; Yu, Q.; Wu, Z. The division of O2O takeaway business zone and discovery of customer demand distribution law. Chin. J. Manag. Sci. 2023, 31, 58–68. [Google Scholar]
- Firdausiyah, N.; Taniguchi, E.; Qureshi, A.G. Modeling city logistics using adaptive dynamic programming based multi-agent simulation. Transp. Res. Part E Logist. Transp. Rev. 2019, 125, 74–96. [Google Scholar] [CrossRef]
- Ortiz-Astorquiza, C.; Cordeau, J.F.; Frejinger, E. The locomotive assignment problem with distributed power at the Canadian national railway company. Transp. Sci. 2021, 55, 510–531. [Google Scholar] [CrossRef]
- Jiang, C.; Xu, J.; Li, S.; Zhang, X.; Wu, Y. The Order Allocation Problem and the Algorithm of Network Freight Platform under the Constraint of Carbon Tax Policy. Int. J. Environ. Res. Public Health 2022, 19, 10993. [Google Scholar] [CrossRef] [PubMed]
- Azad, T.; Rahman, H.F.; Chakrabortty, R.K.; Ryan, M.J. Optimization of integrated production scheduling and vehicle routing problem with batch delivery to multiple customers in supply chain. Memetic Comp. 2022, 14, 355–376. [Google Scholar] [CrossRef]
- Taillard, E.D. A linearithmic heuristic for the travelling salesman problem. Eur. J. Oper. Res. 2022, 297, 442–450. [Google Scholar] [CrossRef]
- Yu, B.; Shan, W.; Sheu, J.-B.; Diabat, A. Branch-and-price for a combined order selection and distribution problem in online community group-buying of perishable products. Transp. Res. Part B Methodol. 2022, 158, 341–373. [Google Scholar] [CrossRef]
- Battaglia, G.; Musolino, G.; Vitetta, A. Freight Demand Distribution in a Suburban Area: Calibration of an Acquisition Model with Floating Car Data. J. Adv. Transp. 2022, 2022, 1535090. [Google Scholar] [CrossRef]
- Abdollahi, M.; Yang, X.; Nasri, M.I.; Fairbank, M. Demand management in time-slotted last-mile delivery via dynamic routing with forecast orders. Eur. J. Oper. Res. 2023, 309, 704–718. [Google Scholar] [CrossRef]
- Zhen, L.; Wu, J.; Laporte, G.; Tan, Z. Heterogeneous instant delivery orders scheduling and routing problem. Comput. Oper. Res. 2023, 157, 0305–0548. [Google Scholar] [CrossRef]
- Diabat, A.; Bianchessi, N.; Archetti, C. On the zero-inventory-ordering policy in the inventory routing problem. Eur. J. Oper. Res. 2024, 312, 1024–1038. [Google Scholar] [CrossRef]
- Derigs, U.; Döhmer, T. Indirect search for the vehicle routing problem with pickup and delivery and time windows. OR Spectr. 2008, 30, 149–165. [Google Scholar] [CrossRef]
- Psarafis, H. A dynamic programming solution to the single vehicle many-to-many immediate request dial-a-ride problem. Transp. Sci. 1980, 14, 130–154. [Google Scholar] [CrossRef]
- Dumas, Y.; Desrosiers, J.; Soumis, F. The pickup and delivery problem with time windows. Eur. J. Oper. Res. 1991, 54, 7–22. [Google Scholar] [CrossRef]
- Bent, R.; Van Hentenryck, P. A two-stage hybrid algorithm for pickup and delivery vehicle routing problems with time windows. Comput. Oper. Res. 2006, 33, 875–893. [Google Scholar] [CrossRef]
- Wassan, N.A.; Wassan, A.H.; Nagy, G. A reactive tabu search algorithm for the vehicle routing problem with simultaneous pickups and deliveries. J. Comb. Optim. 2008, 15, 368–386. [Google Scholar] [CrossRef]
- Gmira, M.; Gendreau, M.; Lodi, A.; Potvin, J.Y. Managing in real-time a vehicle routing plan with time-dependent travel times on a road network. Transp. Res. Part C Emerg. Technol. 2021, 132, 103379. [Google Scholar] [CrossRef]
- Bi, H.; Lu, F.; Duan, S.; Huang, M.; Zhu, J.; Liu, M. Two-Level Principal-Agent Model for Schedule Risk Control of IT Outsourcing Project Based on Genetic Algorithm. Eng. Appl. Artif. Intell. 2020, 91, 1–28. [Google Scholar] [CrossRef]
- Goodarzi, A.H.; Tavakkoli-Moghaddam, R.; Amini, A. A new bi-objective vehicle routing-scheduling problem with cross-docking: Mathematical model and algorithms. Comput. Ind. Eng. 2020, 149, 1–18. [Google Scholar] [CrossRef]
- Wang, C.; Zhao, F.; Mu, D.; Sutherland, J.W. A parallel simulated annealing method for the vehicle routing problem with simultaneous pickup-delivery and time windows. Comput. Ind. Eng 2015, 83, 111–122. [Google Scholar] [CrossRef]
- Vincent, F.Y.; Jewpanya, P.; Redi, A.P.; Tsao, Y.C. Adaptive neighborhood simulated annealing for the heterogeneous fleet vehicle routing problem with multiple cross-docks. Comput. Oper. Res. 2021, 129, 1–19. [Google Scholar]
- Gajpal, Y.; Abad, P. An ant colony system (ACS) for vehicle routing problem with simultaneous delivery and pickup. Comput. Oper. Res. 2009, 36, 3215–3223. [Google Scholar] [CrossRef]
- Bülent, Ç. A new saving-based ant algorithm for the Vehicle Routing Problem with Simultaneous Pickup and Delivery. Expert Syst. Appl. 2010, 37, 6809–6817. [Google Scholar]
- Wu, H.; Gao, Y. An Ant Colony Optimization Based on Local Search for the Vehicle Routing Problem with Simultaneous Pickup-delivery and Time Window. Appl. Soft Comput. 2023, 139, 110203. [Google Scholar] [CrossRef]
- Wen, H.; Wang, S.X.; Lu, F.Q.; Feng, M.; Wang, L.Z.; Xiong, J.K.; Si, M.C. Colony search optimization algorithm using global optimization. J. Supercomput. 2022, 78, 6567–6611. [Google Scholar] [CrossRef]
- Yan, T.; Lu, F.; Wang, S.; Wang, L.; Bi, H. A hybrid metaheuristic algorithm for the multi-objective location-routing problem in the early post-disaster stage. J. Ind. Manag. Optim. 2022, 19, 1547–5816. [Google Scholar] [CrossRef]
- Lu, F.; Chen, W.; Feng, W.; Bi, H. 4PL routing problem using hybrid beetle swarm optimization. Soft Comput. 2023, 27, 17011–17024. [Google Scholar] [CrossRef]
- Lu, F.; Feng, W.; Gao, M.; Bi, H.; Wang, S. The Fourth-Party Logistics Routing Problem Using Ant Colony System-Improved Grey Wolf Optimization. J. Adv. Transp. 2020, 2020, 8831746. [Google Scholar] [CrossRef]
- Zhou, H.; Qin, H.; Zhang, Z.; Li, J. Two-echelon vehicle routing problem with time windows and simultaneous pickup and delivery. Soft Comput. 2022, 26, 3345–3360. [Google Scholar] [CrossRef]
- Song, W.; Yuan, S.; Yang, Y.; He, C. A Study of Community Group Purchasing Vehicle Routing Problems Considering Service Time Windows. Sustainability 2022, 14, 6968. [Google Scholar] [CrossRef]
- Schyns, M. An ant colony system for responsive dynamic vehicle routing. Eur. J. Oper. Res. 2015, 245, 704–718. [Google Scholar] [CrossRef]
- Sun, B.; Yang, Y.; Shi, J.; Zheng, L. Dynamic Pick-Up and Delivery Optimization With Multiple Dynamic Events in Real-World Environment. IEEE Access 2019, 7, 146209–146220. [Google Scholar] [CrossRef]
- Cui, S.; Sun, Q.; Zhang, Q. A Time-Dependent Vehicle Routing Problem for Instant Delivery Based on Memetic Algorithm. Comput. Intell. Neurosci. 2022, 2022, 5099008. [Google Scholar] [CrossRef] [PubMed]
- Bi, H.; Zhu, X.; Lu, F.; Huang, M. The Meal Delivery Routing Problem in E-commerce Platforms under the Shared Logistics Mode. J. Theor. Appl. Electron. Commer. Res. 2023, 18, 1799–1819. [Google Scholar] [CrossRef]
- Tang, C.; Liu, C.; Li, C. Research on delivery problem based on two-stage multi-objective optimization for takeout riders. J. Ind. Manag. Optim. 2023, 19, 7881–7919. [Google Scholar] [CrossRef]
- Kuo, R.J.; Wibowo, B.S.; Zulvia, F.E. Application of a fuzzy ant colony system to solve the dynamic vehicle routing problem with uncertain service time. Appl. Math. Model. 2016, 40, 9990–10001. [Google Scholar] [CrossRef]
- Liu, Y. An optimization-driven dynamic vehicle routing algorithm for on-demand meal delivery using drones. Comput. Oper. Res. 2019, 111, 0305–0548. [Google Scholar] [CrossRef]
- Ulmer, M.W.; Thomas, B.W.; Campbell, A.M.; Woyak, N. The Restaurant Meal Delivery Problem: Dynamic Pickup and Delivery with Deadlines and Random Ready Times. Transp. Sci. 2020, 55, 75–100. [Google Scholar] [CrossRef]
- Fan, H.; Xan, F.; Wang, H. Takeout distribution routes optimization considering order clustering under dynamic demand. J. Syst. Simul. 2023, 35, 396–407. [Google Scholar]
- Zhao, Q.; Lu, F.; Wang, L.; Wang, T. Research on drones and rider joint take-out delivery routing problem. Comput. Eng. Appl. 2022, 58, 269–278. [Google Scholar]
- Li, J.; Yang, S.; Pan, W.; Xu, Z.; Wei, B. Meal delivery routing optimization with order allocation strategy based on transfer stations for instant logistics services. IET Intell. Transp. Syst. 2022, 16, 1108–1126. [Google Scholar] [CrossRef]
- Dorling, K.; Heinrichs, J.; Messier, G.G.; Magierowski, S. Vehicle Routing Problems for Drone Delivery. IEEE Trans. Syst. Man Cybern. Syst. 2017, 47, 70–85. [Google Scholar] [CrossRef]
- Cheng, C.; Adulyasak, Y.; Rousseau, L.M. Drone routing with energy function: Formulation and exact algorithm. Transp. Res. Part B Methodol. 2020, 139, 364–387. [Google Scholar] [CrossRef]
- Song, B.D.; Park, K.; Kim, J. Persistent UAV delivery logistics: MILP formulation and efficient heuristic. Comput. Ind. Eng. 2018, 120, 418–428. [Google Scholar] [CrossRef]
- Wang, D.; Hu, P.; Du, J.; Zhou, P.; Deng, T.; Hu, M. Routing and scheduling for hybrid truck-drone collaborative parcel delivery with independent and truck-carried drones. IEEE Internet Things J. 2019, 6, 10483–10495. [Google Scholar] [CrossRef]
- Felix, T.; Udo, B. A branch-and-cut algorithm for the vehicle routing problem with drones. Transp. Res. Part B Methodol. 2021, 144, 174–203. [Google Scholar]
- Kuo, R.J.; Lu, S.H.; Lai, P.Y.; Mara, S.T.W. Vehicle routing problem with drones considering time windows. Expert Syst. Appl. 2022, 191, 1–18. [Google Scholar] [CrossRef]
- Salama, M.R.; Srinivas, S. Collaborative truck multi-drone routing and scheduling problem: Package delivery with flexible launch and recovery sites. Transp. Res. Part E 2022, 164, 1–21. [Google Scholar] [CrossRef]
- Mulumba, T.; Diabat, A. Optimization of the drone-assisted pickup and delivery problem. Transp. Res. Part E Logist. Transp. Rev. 2024, 181, 1366–5545. [Google Scholar] [CrossRef]
- Feng, W.; Lu, F.; Wang, S.; Bi, H.; Wang, L. Research on Unmanned aerial vehicles delivery route planning considering charging facilities. Control. Eng. 2022, 31, 1–10. [Google Scholar]
- Frey, B.J.; Dueck, D. Clustering by passing messages between data points. Science 2007, 315, 972–976. [Google Scholar] [CrossRef]
- Lu, F.; Yan, T.; Bi, H.; Feng, M.; Wang, S.; Huang, M. A bilevel whale optimization algorithm for risk management scheduling of information technology projects considering outsourcing. Knowl. Based Syst. 2022, 235, 1–15. [Google Scholar] [CrossRef]


| Author | Topic | Algorithm | Nature of the Study | Results |
|---|---|---|---|---|
| [5] | order distribution | MAS-ADP based RL | simulation | reducing environmental emissions |
| [7] | order distribution | 0-1 integer programming algorithm | case study | reduce carbon emissions |
| [10] | order distribution | branch-and-price algorithm | real data | reduce product losses revenue increased |
| [8] | order distribution | genetic algorithm | benchmark | reduce the overall cost of tardiness and batch distribution |
| [12] | order distribution | dynamic pricing fixed routing forecast approach | case study | reduce delivery cost |
| [14] | order distribution | branch-and-cut algorithms | benchmark IRP instances | reduce the total cost of the distribution plan |
| [19,20,32] | PDVRPTW | tabu search | case study benchmark | reduce travel time |
| [21,22] | PDVRPTW takeout delivery | genetic algorithm | case study | reduce total operational cost |
| [23,24] | PDVRPTW | simulated annealing | benchmark case | reduce total delivery cost |
| [25,26,27,33,34] | PDVRPTW takeout delivery | ant colony algorithm | VRP benchmark case | reduce total distance improve responsiveness |
| [35] | dynamics takeout delivery | TS, ALNS dynamic insertion method | real data | reduce delivery cost |
| [35,38,43,44] | takeout delivery | large-scale neighborhood search algorithm and genetic algorithm | case study | reduce delivery cost reduce working hours and delivery distance |
| [39] | dynamics takeout delivery | fuzzy ant colony system | benchmark case | increase number of customer service and reduce average customer waiting time |
| [41] | dynamics takeout delivery | anticipatory customer assignment policy | real data | reduce delivery of tardiness |
| [42] | dynamics takeout delivery | variable neighborhood search algorithm | case study | reduce delivery time and average travel distance |
| [48] | drone delivery | hybrid truck–drone delivery algorithm | case study | reduce delivery cost |
| [49] | drone delivery | branch cutting algorithm | case study | reduce delivery cost and timeout penalty |
| [50,51] | drone delivery | hybrid simulated annealing, variable neighborhood search | case study | reduce delivery completion time |
| [52] | drone delivery | Clarke–Wright savings heuristic | case study | reduce operational costs |
| This paper | order distribution takeout delivery drone delivery | two-stage heuristic algorithm | benchmark case | reduce delivery cost and improve customer satisfaction |
| Notation | Notation Definition | Notation | Notation Definition |
|---|---|---|---|
| I | Set of customers I = {1, 2…n} | vp | Rider speed |
| J | Set of merchants J = Jk + Ja = {n + 1, n + 2… 2n}, Jk rider is in charge, Ja drone is in charge | [ETi, LTi] | Customer i time window restrictions: ETi, expected arrival time; LTi, latest acceptable arrival time |
| O | Set of drone take-off points O = {1,2…o} | vu | Drone speed |
| K | Set of riders K = {1,2…k} | cp1 | Rider fixed costs |
| A | Set of drones A = {1, 2…a} | cu1 | Drone fixed costs |
| V | Set of rider service points V = I∪Jk | cp2 | Rider unit ride cost |
| G | Set of drone stops G = {1, 2…g}, G⊂I | cu2 | Drone unit travel cost |
| dij | The distance from node i to node j | Wumax | Maximum cargo capacity of the drone |
| Distance from node i to node j for drone a | Wkmax | Maximum cargo capacity of electric vehicles | |
| tik | Time the rider arrives at node i | tia | Time taken by the drone to arrive at node i |
| qki | Takeout weight for order i accepted by rider k | qai | Takeout weight for order i accepted by drone a |
| tf | Merchant meal preparation time | ts | Customer service time |
| tikm | Rider K walks through m nodes to reach the time of customer point i | rij | If customer node i needs merchant node j’s meal, rij = 1; otherwise, rij = 0 |
| xkij | Decision variable: if rider k goes from node i to node j, xkij = 1; otherwise, xkij = 0. | xaij | Decision variable: if the drone a goes from node i to node j, xaij = 1; otherwise, xaij = 0. |
| Parameter | Parameter Description | Parameter | Parameter Description |
|---|---|---|---|
| Qamax | maximum power of drone | mb | drone battery weight |
| μ | battery safety factor | ratio of drone rise and drag | |
| mt | drone unladen weight | η | energy transfer efficiency |
| c | electricity costs |
| Parameter Description | Parameter | Value | Parameter Description | Parameter | Value |
|---|---|---|---|---|---|
| Rider speed | vp | 25 km/h | Drone speed | vu | 57.6 km/h |
| Rider fixed costs | cp1 | 50 RMB | Drone fixed costs | cu1 | 10 RMB |
| Rider unit ride cost | cp2 | 0.2 RMB/km | Drone unit travel cost | cu2 | 0.3 RMB/km |
| Maximum cargo capacity of electric vehicles | Wkmax | 50 kg | Maximum cargo capacity of drone | Wumax | 5 kg |
| Merchant meal preparation time | tf | 5 min | Drone unladen weight and battery weight | mt + mb | 10.1 kg |
| Customer service time | ts | 3 min | Electricity costs | c | 0.66 RMB/kW |
| Battery safety factor | μ | 1.25 | Energy transfer efficiency | η | 0.66 |
| Ratio of drone rise and drag | 3.5 | Acceleration due to gravity | g | 9.8 kg/N | |
| Penalty cost 1 | ω1 | 0.5 | Penalty cost 2 | ω2 | 1 |
| Number | X | Y |
|---|---|---|
| 1 | 2600 | 1000 |
| 2 | 1100 | 3300 |
| 3 | 3800 | 4000 |
| Distribution Center | Number | Merchant Coordinates | Customer Coordinates | ET | LT | Weight |
|---|---|---|---|---|---|---|
| 1 | 1 | (2710, 908) | (2975, 400) | 19 | 29 | 1.2 |
| 2 | (2614, 1012) | (3375, 750) | 21 | 31 | 0.7 | |
| 3 | (2545, 1023) | (3150, 525) | 20 | 30 | 0.6 | |
| … | … | … | … | … | … | |
| 16 | (2572, 977) | (2375, 1300) | 13 | 23 | 1.1 | |
| 17 | (2614, 1012) | (3075, 2775) | 40 | 50 | 0.7 | |
| 2 | 18 | (1198, 3398) | (450, 4900) | 40 | 50 | 1.2 |
| 19 | (1148, 3249) | (150, 4500) | 36 | 46 | 0.6 | |
| 20 | (1191, 3197) | (450, 2850) | 21 | 31 | 1.3 | |
| … | … | … | … | … | … | |
| 34 | (1196, 3337) | (2575, 1950) | 40 | 50 | 1.1 | |
| 35 | (1048, 3299) | (2600, 2150) | 40 | 50 | 1.4 | |
| 3 | 36 | (3874, 3945) | (3075, 3675) | 21 | 31 | 0.9 |
| 37 | (3928, 3944) | (3525, 3525) | 16 | 26 | 0.7 | |
| 38 | (3840, 3912) | (3750, 3625) | 13 | 23 | 0.8 | |
| … | … | … | … | … | … | |
| 49 | (3874, 3945) | (2975, 3150) | 29 | 39 | 1.4 | |
| 50 | (3840, 3912) | (4875, 4125) | 27 | 37 | 0.9 |
| R1(50) | Traditional Rider Delivery | Drone–Rider Joint Delivery |
|---|---|---|
| Meal delivery costs | 663.3786 | 644.4304 |
| Penalty costs | 5.6816 | 0 |
| Overall customer satisfaction | 98.0074% | 100.0000% |
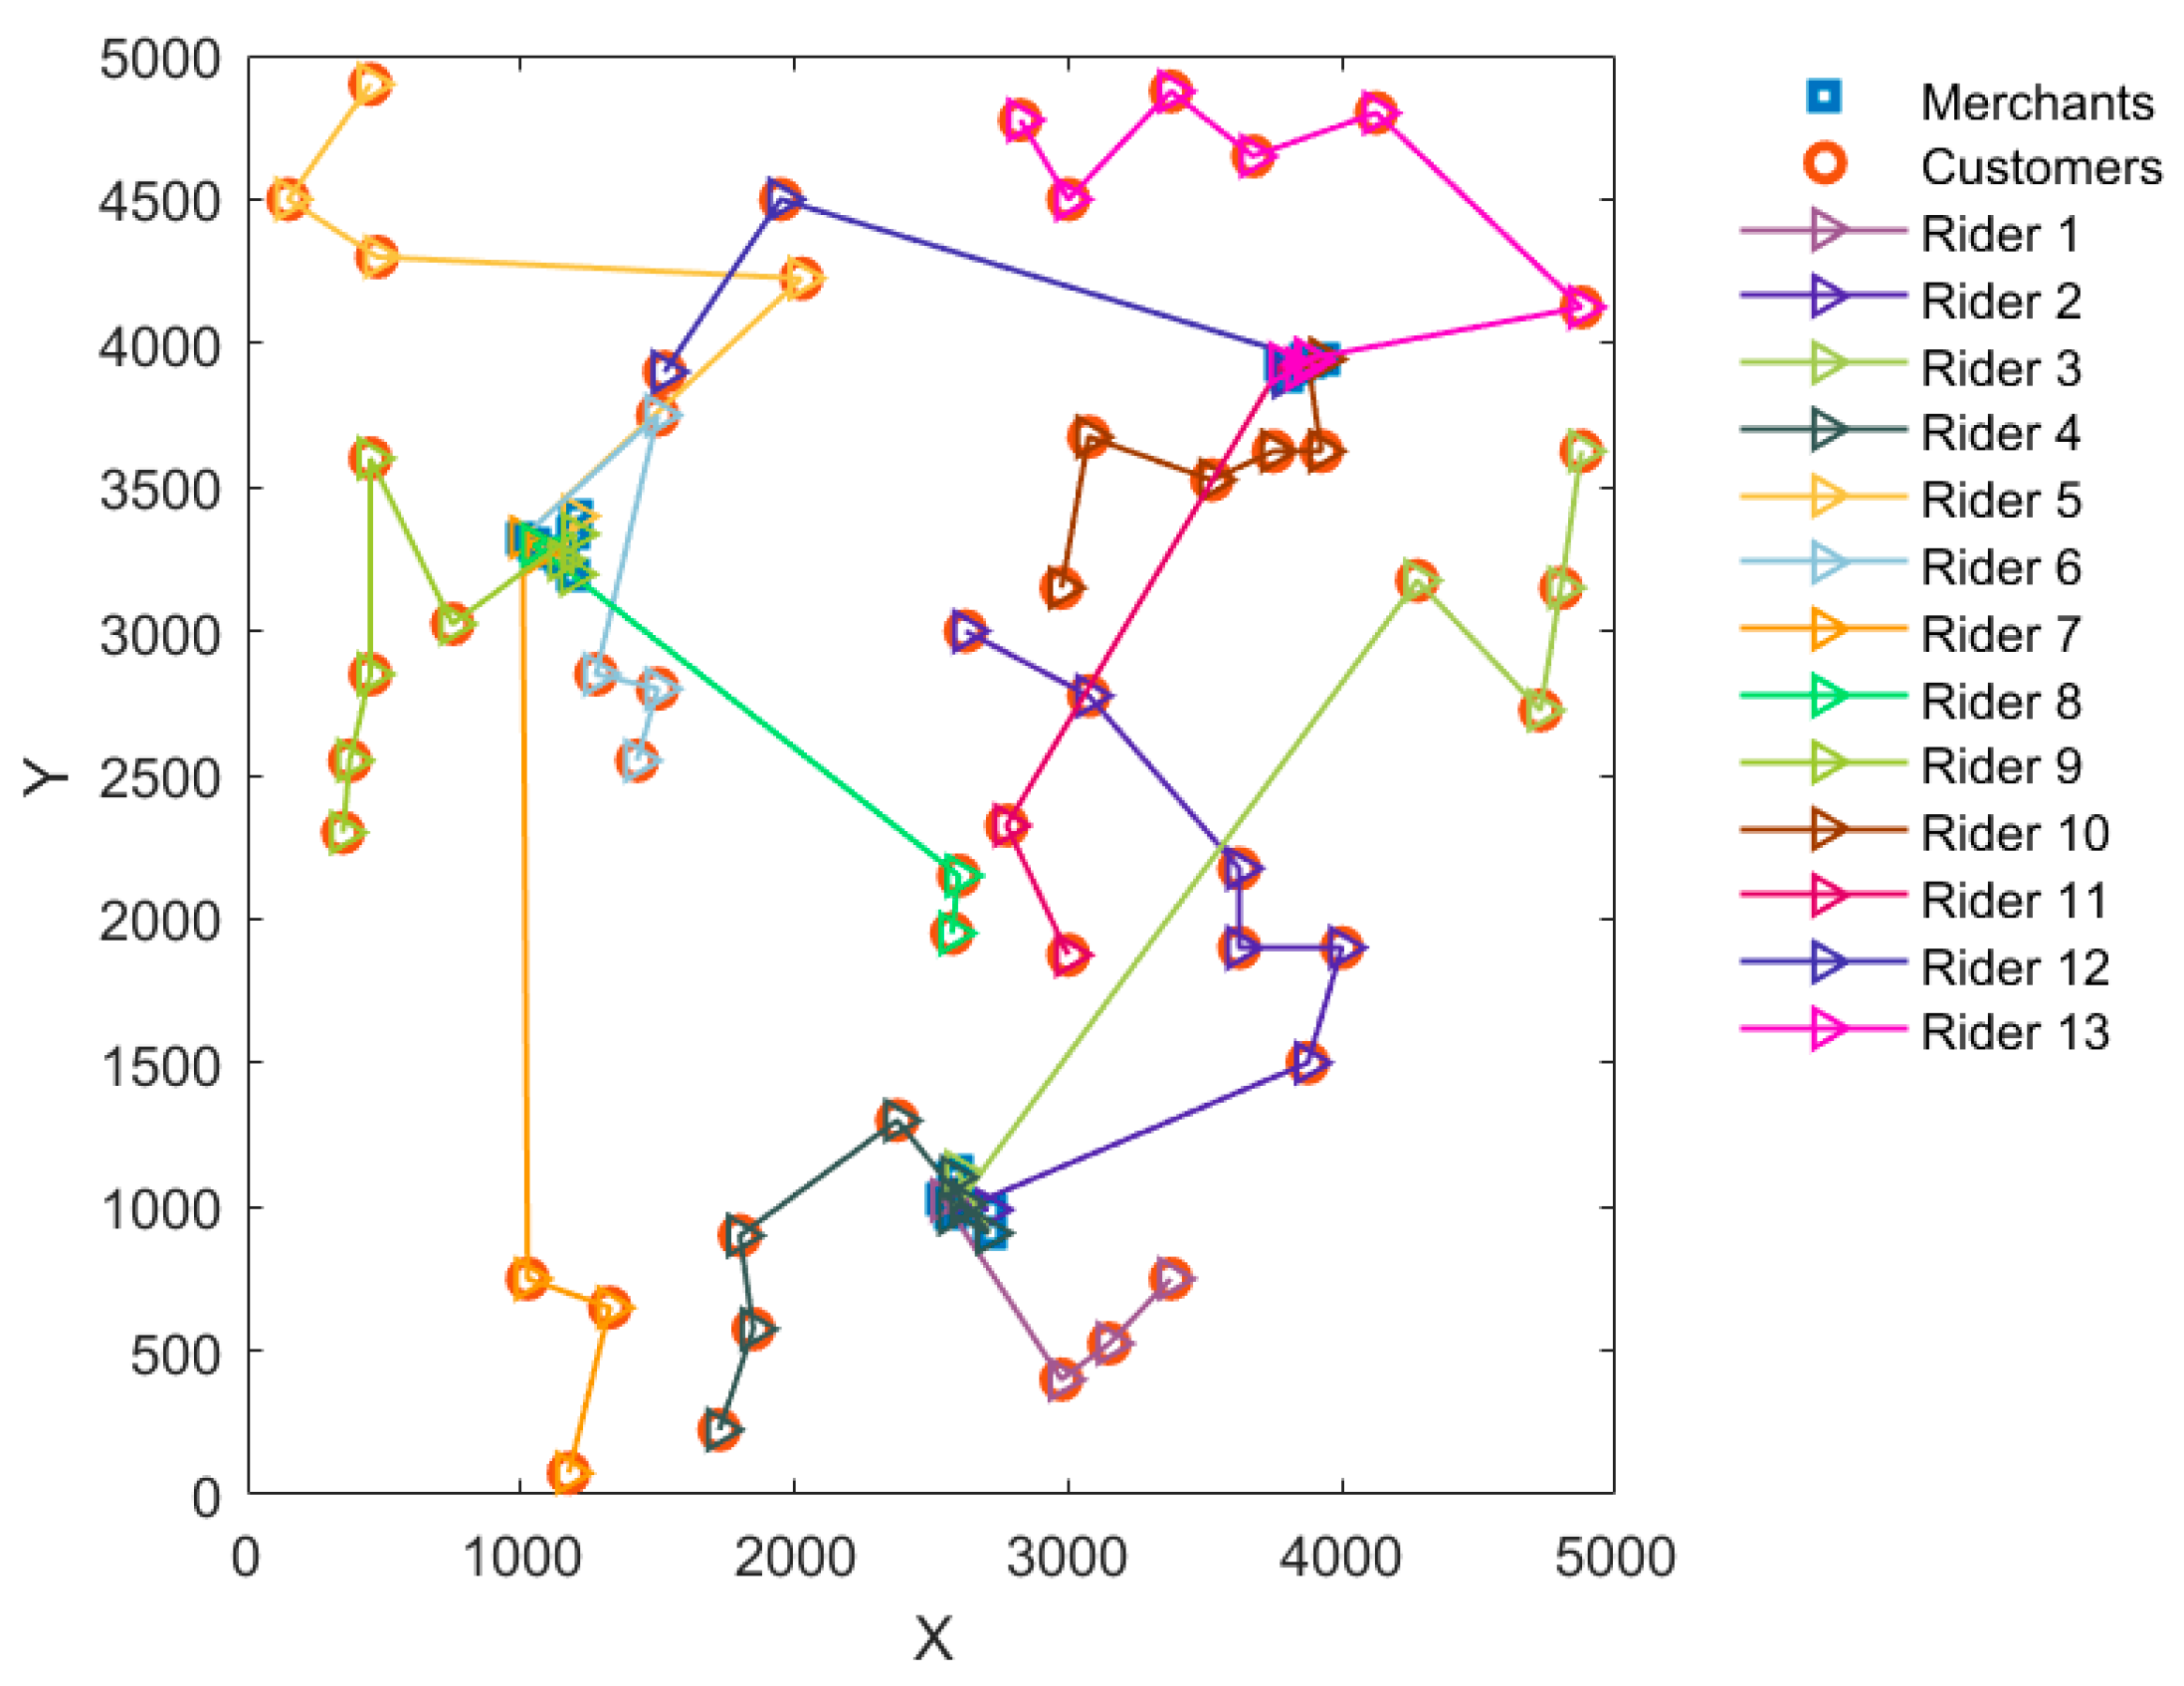
| Number of riders | 13 | 12 |
| Number | Rider Delivery | Drone–Rider Joint Delivery | Number | Rider Delivery | Drone–Rider Joint Delivery |
|---|---|---|---|---|---|
| 1 | 1-3-2 | 1-3-2 | 8 | 35-34 | 23-(44)-31-45 |
| 2 | 11-5-9-4-17-15 | 11-5-9-4 | 9 | 23-29-33-32 | 50-(10)-7-6-8 |
| 3 | 6-7-10-8 | 12-13-14-(27)-26-30 | 10 | 48-37-36-38-49 | 48-38-37 |
| 4 | 16-12-13-14 | 16-(34)-35-39-40 | 11 | 39-40 | 47-46-42-43-41 |
| 5 | 31-22-19-18 | 21-22-19-18 | 12 | 45-44 | 36-(49)-15-17 |
| 6 | 24-21-20-25-28 | 24-20-25-28 | 13 | 43-46-42-50-47-41 | |
| 7 | 26-27-30 | 32-29-33 |
| Order Volume | R1(50) | R2(75) | R3(100) | R4(125) | R5(150) | |
|---|---|---|---|---|---|---|
| Traditional rider delivery | meal delivery costs | 663.3786 | 869.6576 | 1230.3801 | 1401.7971 | 1529.8870 |
| penalty costs | 5.6816 | 9.4473 | 15.8378 | 32.5861 | 60.1637 | |
| overall customer satisfaction | 98.0074% | 98.2671% | 97.4499% | 95.7050% | 92.6097% | |
| number of riders | 13 | 17 | 24 | 27 | 29 | |
| Drone–rider joint delivery | meal delivery costs | 644.4304 | 758.0905 | 973.609 | 1151.9947 | 1266.9962 |
| penalty costs | 0 | 6.6695 | 7.8468 | 20.3476 | 26.0462 | |
| overall customer satisfaction | 100.0000% | 98.9841% | 98.8018% | 97.5074% | 97.1342% | |
| number of riders | 12 | 12 | 13 | 18 | 23 | |
| Damping Factor λ | Rider Delivery | Drone–Rider Joint Delivery | ||||
|---|---|---|---|---|---|---|
| Meal Delivery Costs | Overall Customer Satisfaction | Number of Riders | Meal Delivery Costs | Overall Customer Satisfaction | Number of Riders | |
| 0.1 | ——— | ——— | ||||
| 0.2 | 1158.1949 | 99.9994% | 23 | 646.9576 | 99.9930% | 12 |
| 0.3 | 663.3786 | 98.0074% | 13 | 644.4304 | 100.0000% | 12 |
| 0.4 | 709.1361 | 99.8250% | 14 | 644.4304 | 100.0000% | 12 |
| 0.5 | 709.1361 | 99.8250% | 14 | 644.6047 | 99.9994% | 12 |
| 0.6 | 663.3786 | 98.0074% | 13 | 644.6047 | 99.9994% | 12 |
| 0.7 | 663.3786 | 98.0074% | 13 | 644.6047 | 99.9994% | 12 |
| 0.8 | 663.3786 | 98.0074% | 13 | 644.6047 | 99.9994% | 12 |
| 0.9 | 663.3786 | 98.0074% | 13 | 644.6047 | 99.9994% | 12 |
| Case | Algorithm | Optimal Value | Worst Value | Average Value | Standard Deviation | Time/s | Average Customer Satisfaction |
|---|---|---|---|---|---|---|---|
| R1 50 | ITS | 644.43 | 644.44 | 644.43 | 0.0014 | 0.1618 | 100.000% |
| TS | 644.43 | 644.50 | 644.45 | 0.0281 | 0.1410 | 100.000% | |
| VNS | 644.43 | 644.59 | 644.50 | 0.0408 | 0.2234 | 100.000% | |
| WOA | 644.43 | 644.61 | 644.48 | 0.0401 | 1.7562 | 100.000% | |
| GA | 644.43 | 644.50 | 644.45 | 0.0257 | 1.7563 | 100.000% | |
| PSO | 644.43 | 651.38 | 645.41 | 1.4804 | 3.6469 | 99.806% | |
| R3 100 | ITS | 973.61 | 973.92 | 973.63 | 0.0603 | 0.4176 | 98.802% |
| TS | 973.61 | 974.81 | 973.71 | 0.2610 | 0.3791 | 98.739% | |
| VNS | 973.69 | 975.99 | 975.22 | 0.5385 | 0.5207 | 98.647% | |
| WOA | 973.63 | 979.84 | 975.81 | 1.6217 | 2.5825 | 98.504% | |
| GA | 973.80 | 979.19 | 975.28 | 1.2092 | 3.0271 | 98.592% | |
| PSO | 982.93 | 1010.65 | 996.87 | 7.5983 | 6.4289 | 96.352% | |
| R5 150 | ITS | 1267.00 | 1270.14 | 1268.59 | 0.4864 | 0.5997 | 97.049% |
| TS | 1267.57 | 1275.25 | 1270.60 | 2.4134 | 0.5422 | 96.889% | |
| VNS | 1270.26 | 1285.90 | 1279.90 | 3.5920 | 0.8537 | 95.763% | |
| WOA | 1274.47 | 1295.97 | 1284.31 | 5.0797 | 3.5512 | 95.562% | |
| GA | 1273.71 | 1293.69 | 1284.39 | 4.2174 | 3.9468 | 95.612% | |
| PSO | 1318.06 | 1375.57 | 1349.24 | 13.7427 | 9.0076 | 91.816% |
Disclaimer/Publisher’s Note: The statements, opinions and data contained in all publications are solely those of the individual author(s) and contributor(s) and not of MDPI and/or the editor(s). MDPI and/or the editor(s) disclaim responsibility for any injury to people or property resulting from any ideas, methods, instructions or products referred to in the content. |
© 2024 by the authors. Licensee MDPI, Basel, Switzerland. This article is an open access article distributed under the terms and conditions of the Creative Commons Attribution (CC BY) license (https://creativecommons.org/licenses/by/4.0/).
Share and Cite
Lu, F.; Jiang, R.; Bi, H.; Gao, Z. Order Distribution and Routing Optimization for Takeout Delivery under Drone–Rider Joint Delivery Mode. J. Theor. Appl. Electron. Commer. Res. 2024, 19, 774-796. https://doi.org/10.3390/jtaer19020041
Lu F, Jiang R, Bi H, Gao Z. Order Distribution and Routing Optimization for Takeout Delivery under Drone–Rider Joint Delivery Mode. Journal of Theoretical and Applied Electronic Commerce Research. 2024; 19(2):774-796. https://doi.org/10.3390/jtaer19020041
Chicago/Turabian StyleLu, Fuqiang, Runxue Jiang, Hualing Bi, and Zhiyuan Gao. 2024. "Order Distribution and Routing Optimization for Takeout Delivery under Drone–Rider Joint Delivery Mode" Journal of Theoretical and Applied Electronic Commerce Research 19, no. 2: 774-796. https://doi.org/10.3390/jtaer19020041
APA StyleLu, F., Jiang, R., Bi, H., & Gao, Z. (2024). Order Distribution and Routing Optimization for Takeout Delivery under Drone–Rider Joint Delivery Mode. Journal of Theoretical and Applied Electronic Commerce Research, 19(2), 774-796. https://doi.org/10.3390/jtaer19020041