Article

Enhancing the Prediction of Stock Market Movement Using Neutrosophic-Logic-Based Sentiment Analysis

by
Bassant A. Abdelfattah
1,
Saad M. Darwish
1,* and
Saleh M. Elkaffas
2
1
Department of Information Technology, Institute of Graduate Studies and Research, Alexandria University, 163 Horreya Avenue, El-Shatby, Alexandria 21526, Egypt
2
Department of Information Systems, Arab Academy for Science and Technology, Alexandria 1029, Egypt
*
Author to whom correspondence should be addressed.
J. Theor. Appl. Electron. Commer. Res. 2024, 19(1), 116-134; https://doi.org/10.3390/jtaer19010007
Submission received: 26 October 2023 / Revised: 27 December 2023 / Accepted: 9 January 2024 / Published: 12 January 2024

Abstract

:
Social media platforms have allowed many people to publicly express and disseminate their opinions. A topic of considerable interest among researchers is the impact of social media on predicting the stock market. Positive or negative feedback about a company or service can potentially impact its stock price. Nevertheless, the prediction of stock market movement using sentiment analysis (SA) encounters hurdles stemming from the imprecisions observed in SA techniques demonstrated in prior studies, which overlook the uncertainty inherent in the data and consequently directly undermine the credibility of stock market indicators. In this paper, we proposed a novel model to enhance the prediction of stock market movements using SA by improving the process of SA using neutrosophic logic (NL), which accurately classifies tweets by handling uncertain and indeterminate data. For the prediction model, we use the result of sentiment analysis and historical stock market data as input for a deep learning algorithm called long short-term memory (LSTM) to predict the stock movement after a specific number of days. The results of this study demonstrated a predictive accuracy that surpasses the accuracy rate of previous studies in predicting stock price fluctuations when using the same dataset.

1. Introduction

Predicting the stock market is an intricate challenge for investors, financial analysts, and researchers owing to its pivotal role in the global economy and its profound influence on individuals’ lives [1,2]. Consequently, researchers have made extensive endeavors to improve stock market prediction through the utilization of various theories and employing machine learning methods or statistical modeling relying on diverse data sources [3]. The majority of previous studies have primarily relied on utilizing historical stock market data from platforms like Yahoo Finance. However, this approach poses significant limitations and shortcomings. It often fails to incorporate crucial hidden factors such as economic indicators, political events, investor sentiment, and market psychology [4,5]. As a result, this approach has exhibited considerable inaccuracy when attempting to forecast stock prices [6]. Thus, it is crucial to consider a wider range of factors and integrate alternative data sources such as Facebook, Twitter, now known as X, and news to improve the performance of stock market predictions [2].
Recently, the pervasive adoption of social media has facilitated the widespread dissemination of user experiences and feedback. This emerging trend has prompted researchers to investigate the utilization of social media as a valuable source for analyzing human sentiment concerning stock prices and capturing public opinions regarding specific companies or organizations. The incorporation of social media data into predictive models offers promising prospects for enhancing the accuracy and efficacy of stock market predictions [7].
Several research studies have primarily concentrated on examining the influence of sentiment analysis (SA) on stock market forecasting. However, these studies often overlook the presence of uncertainty or indeterminate data, which can significantly impact the accuracy of SA results. Neglecting such uncertainties can consequently affect the reliability and effectiveness of stock market predictions [
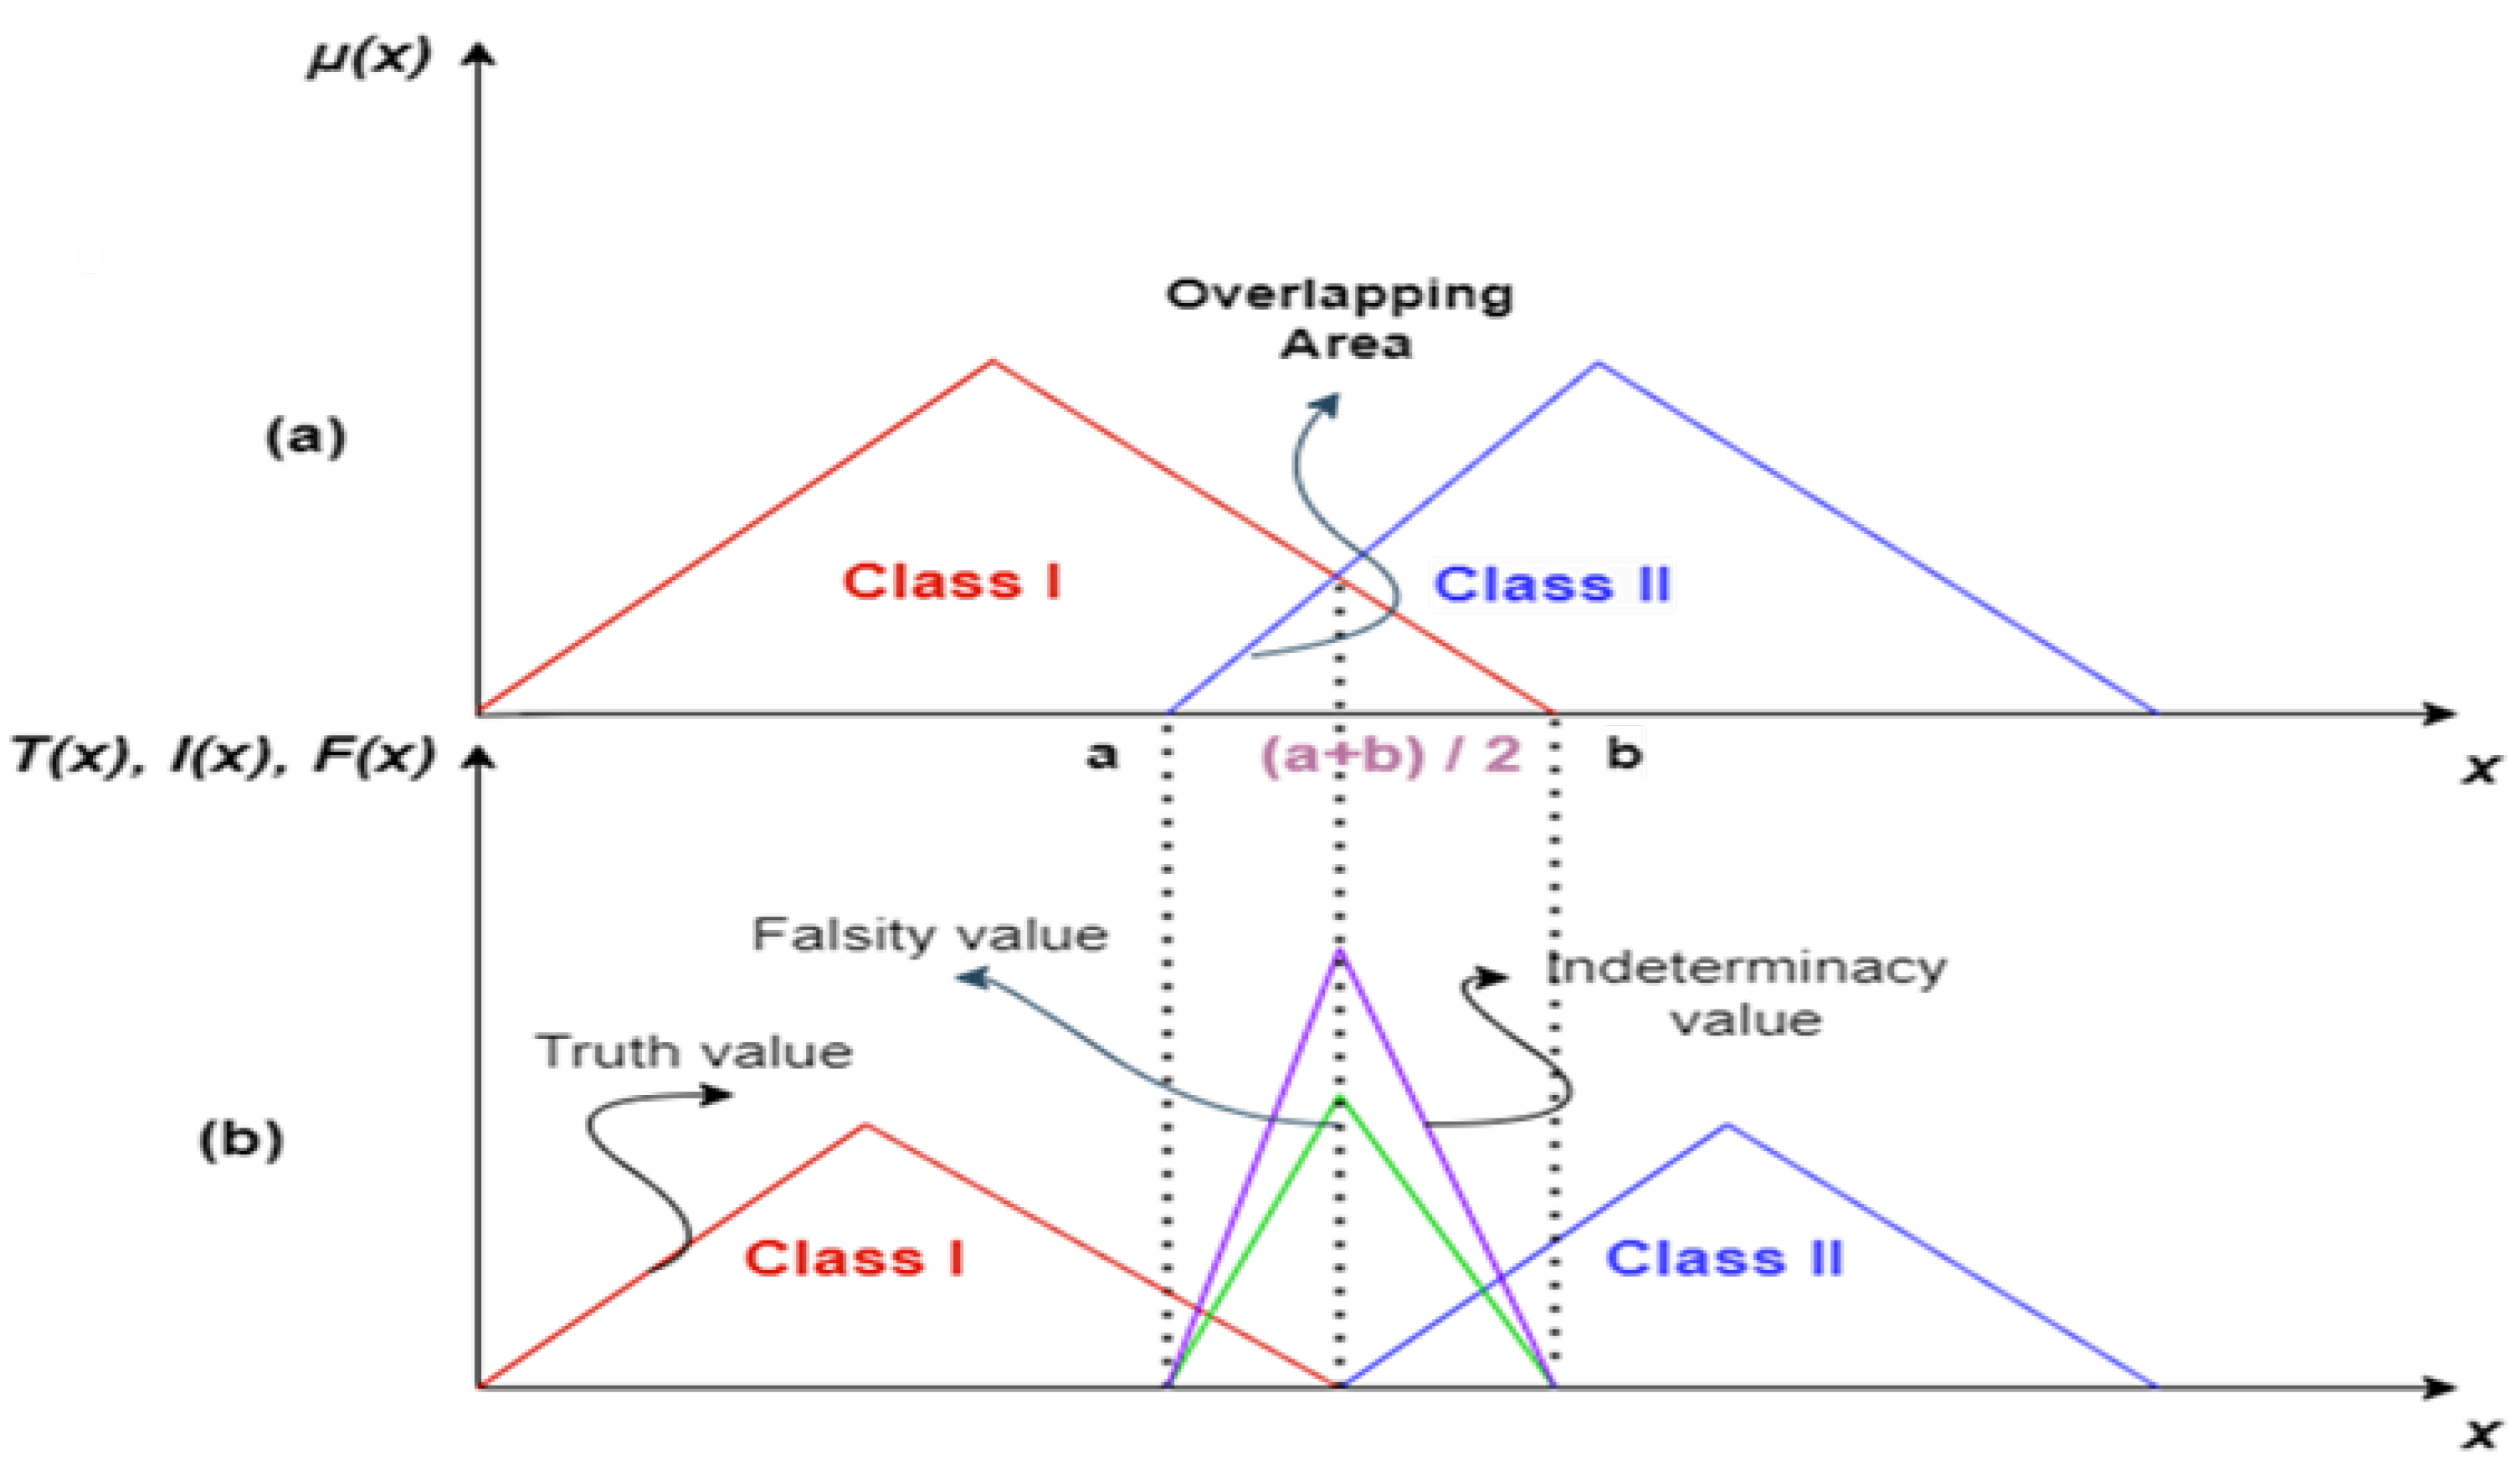
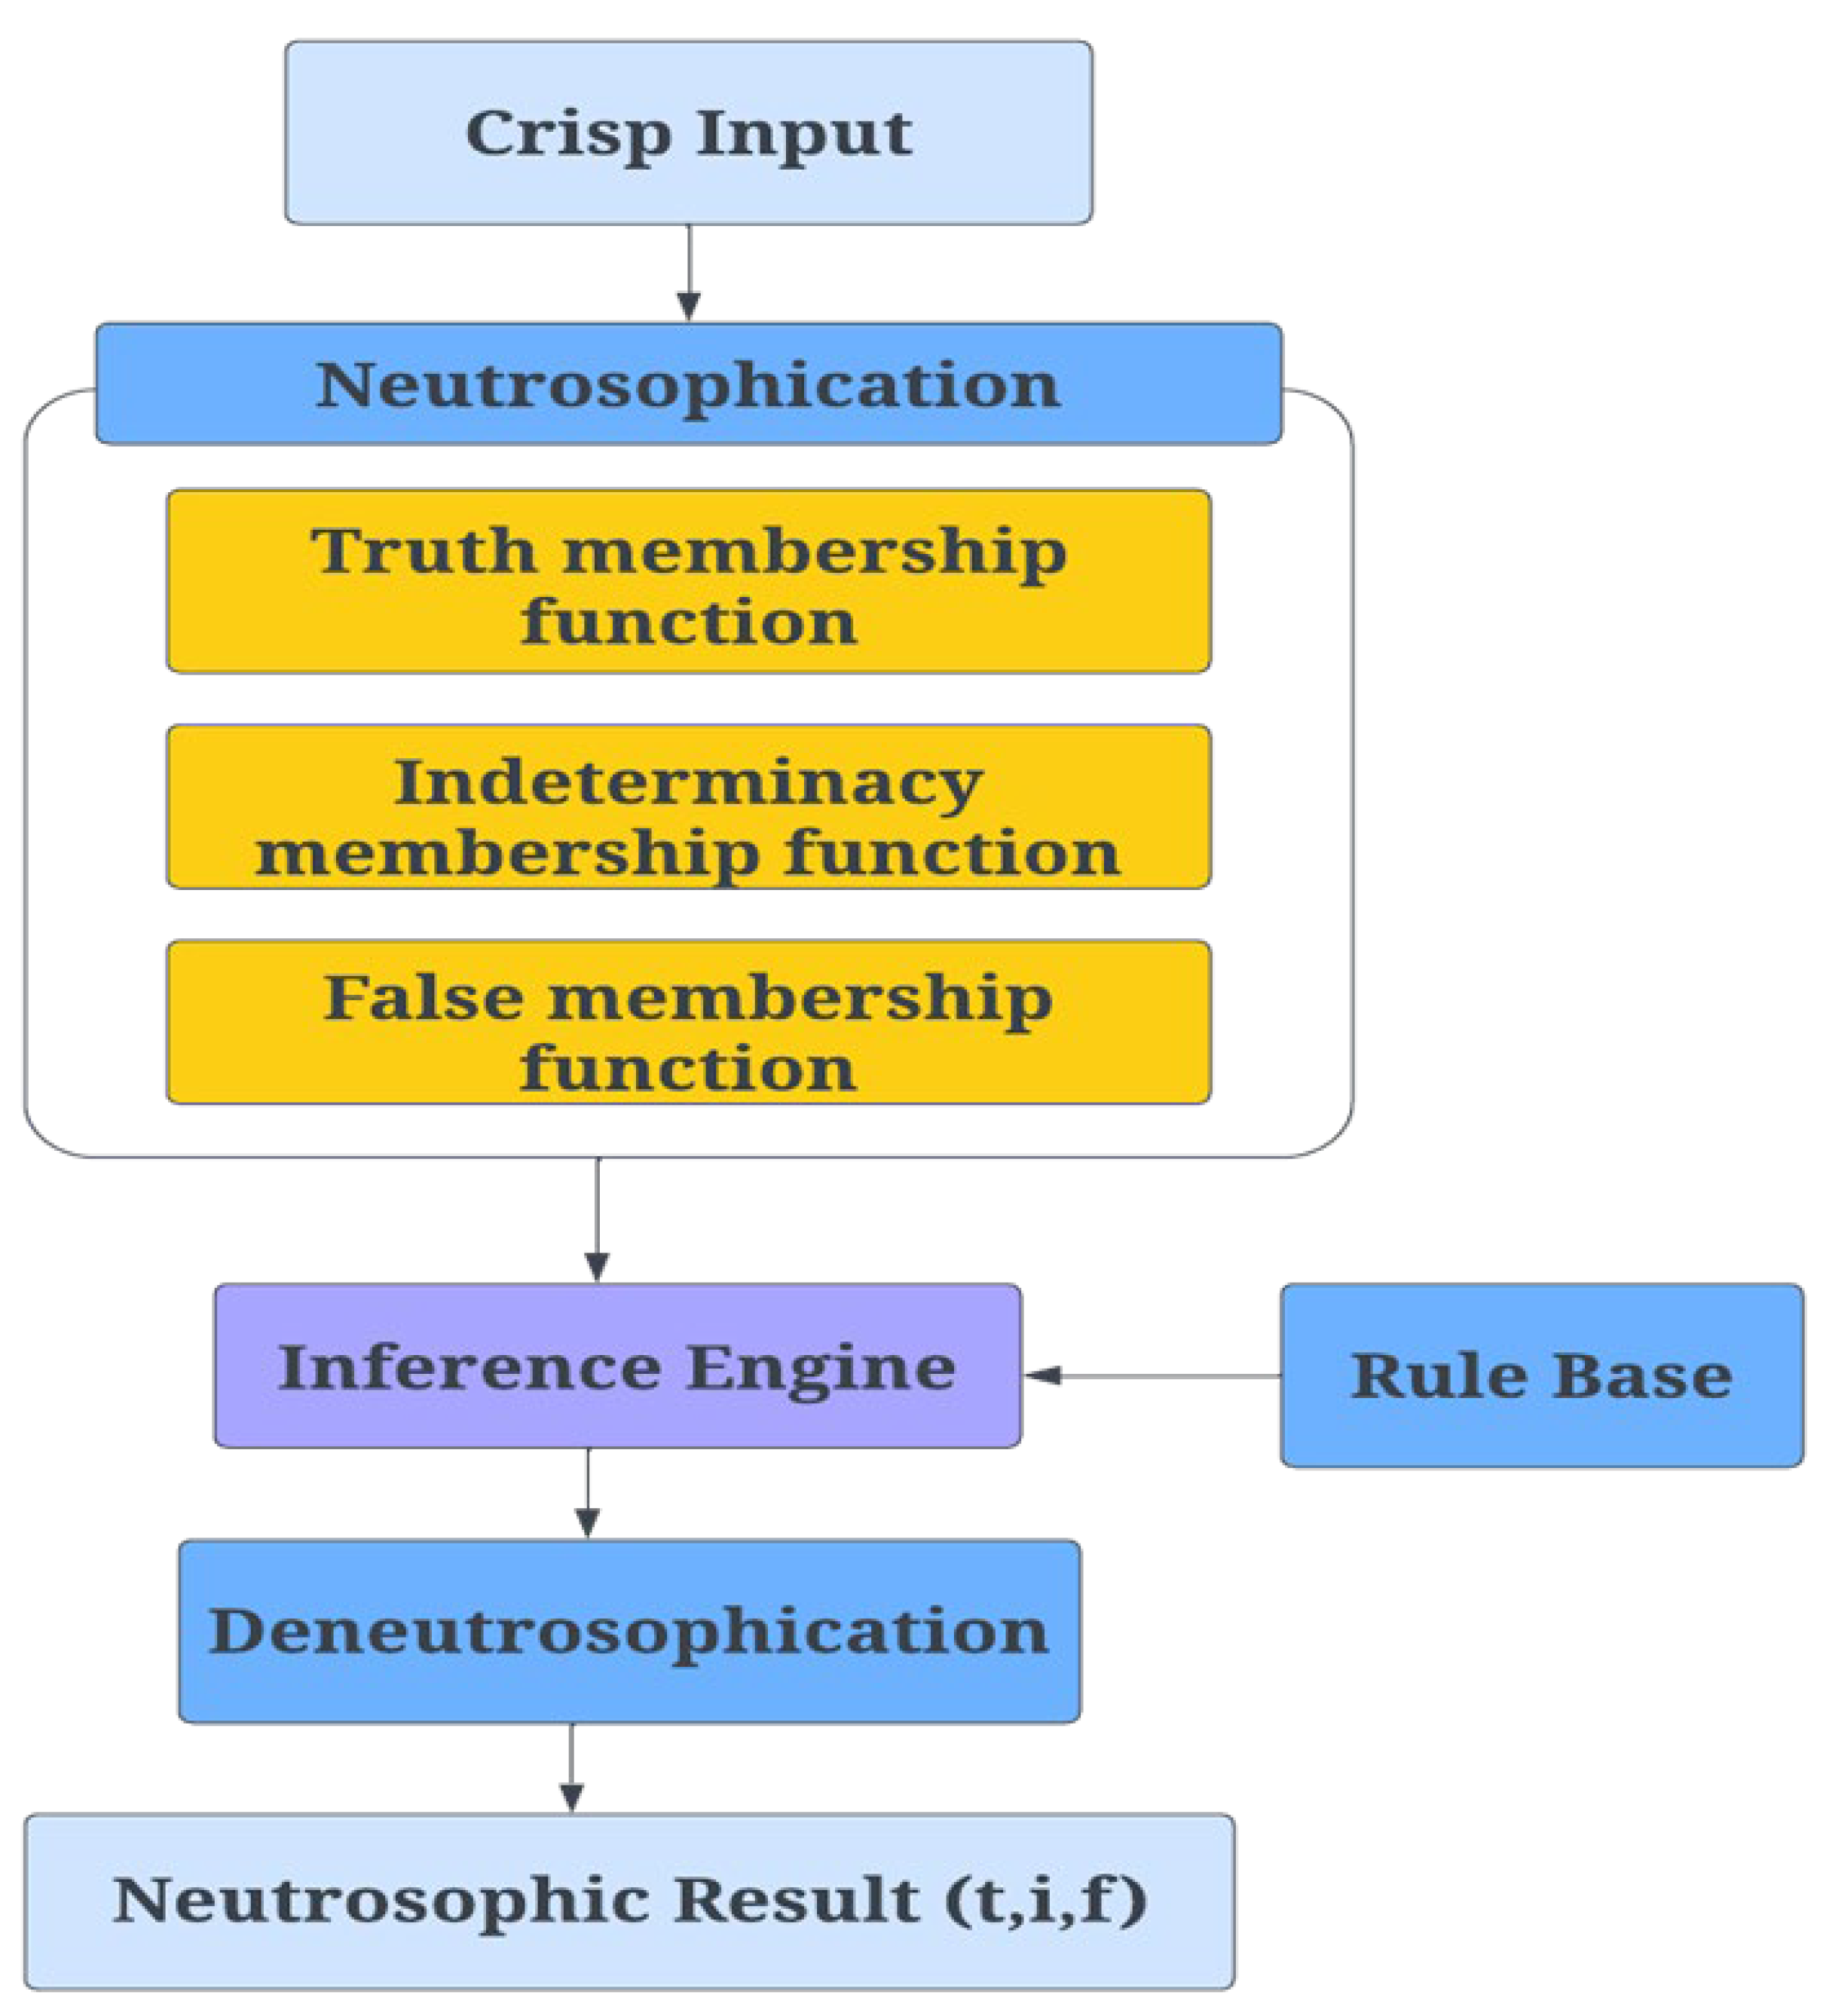
8]. The neutrosophic concept, representing a broader perspective of fuzzy logic [9], has been introduced to tackle uncertainty and indeterminacy. It revolves around three membership functions, namely truth, indeterminacy, and falsity. These functions play a crucial role in representing and analyzing ambiguous and uncertain information [10,11].

1.1. Problem Statement

The financial market is an extremely complex domain, with the primary objective of accurately predicting stock movements. This precision is of the utmost importance as it directly influences the confidence of investors in their critical decisions regarding buying, holding, or selling stocks amid the inherent risks in the market. Predicting stock price movements remains a challenge despite extensive research efforts in forecasting using historical data and social media data reflecting user opinions about stocks and companies. However, it often lacks challenges, especially regarding the uncertainty in social media data, particularly the use of ambiguous words and multiple meanings. The presence of uncertainty in the data results in an inaccurate classification of the tweets, consequently leading to an inaccurate predictive model.

1.2. Motivation

The ability to accurately predict stock market movements has enormous benefits for investors and financial institutions. It can guide the investment decision-making process regarding buying or selling shares in response to price fluctuations. This can, in addition to reducing risk, promote financial stability and market efficiency. The stock market exhibits considerable volatility as it is influenced by various factors, including the impact of opinions and perceptions expressed on social media by users. However, one of the challenges of using social media is that data are sometimes uncertain and ambiguous. This motivates our research, which aims to improve stock movement prediction results by improving sentiment analysis results to tackle the challenge of data uncertainty in social media. This research will cover in detail how to detect data uncertainty and ambiguous opinions and how to resolve them using NL.

1.3. Contribution

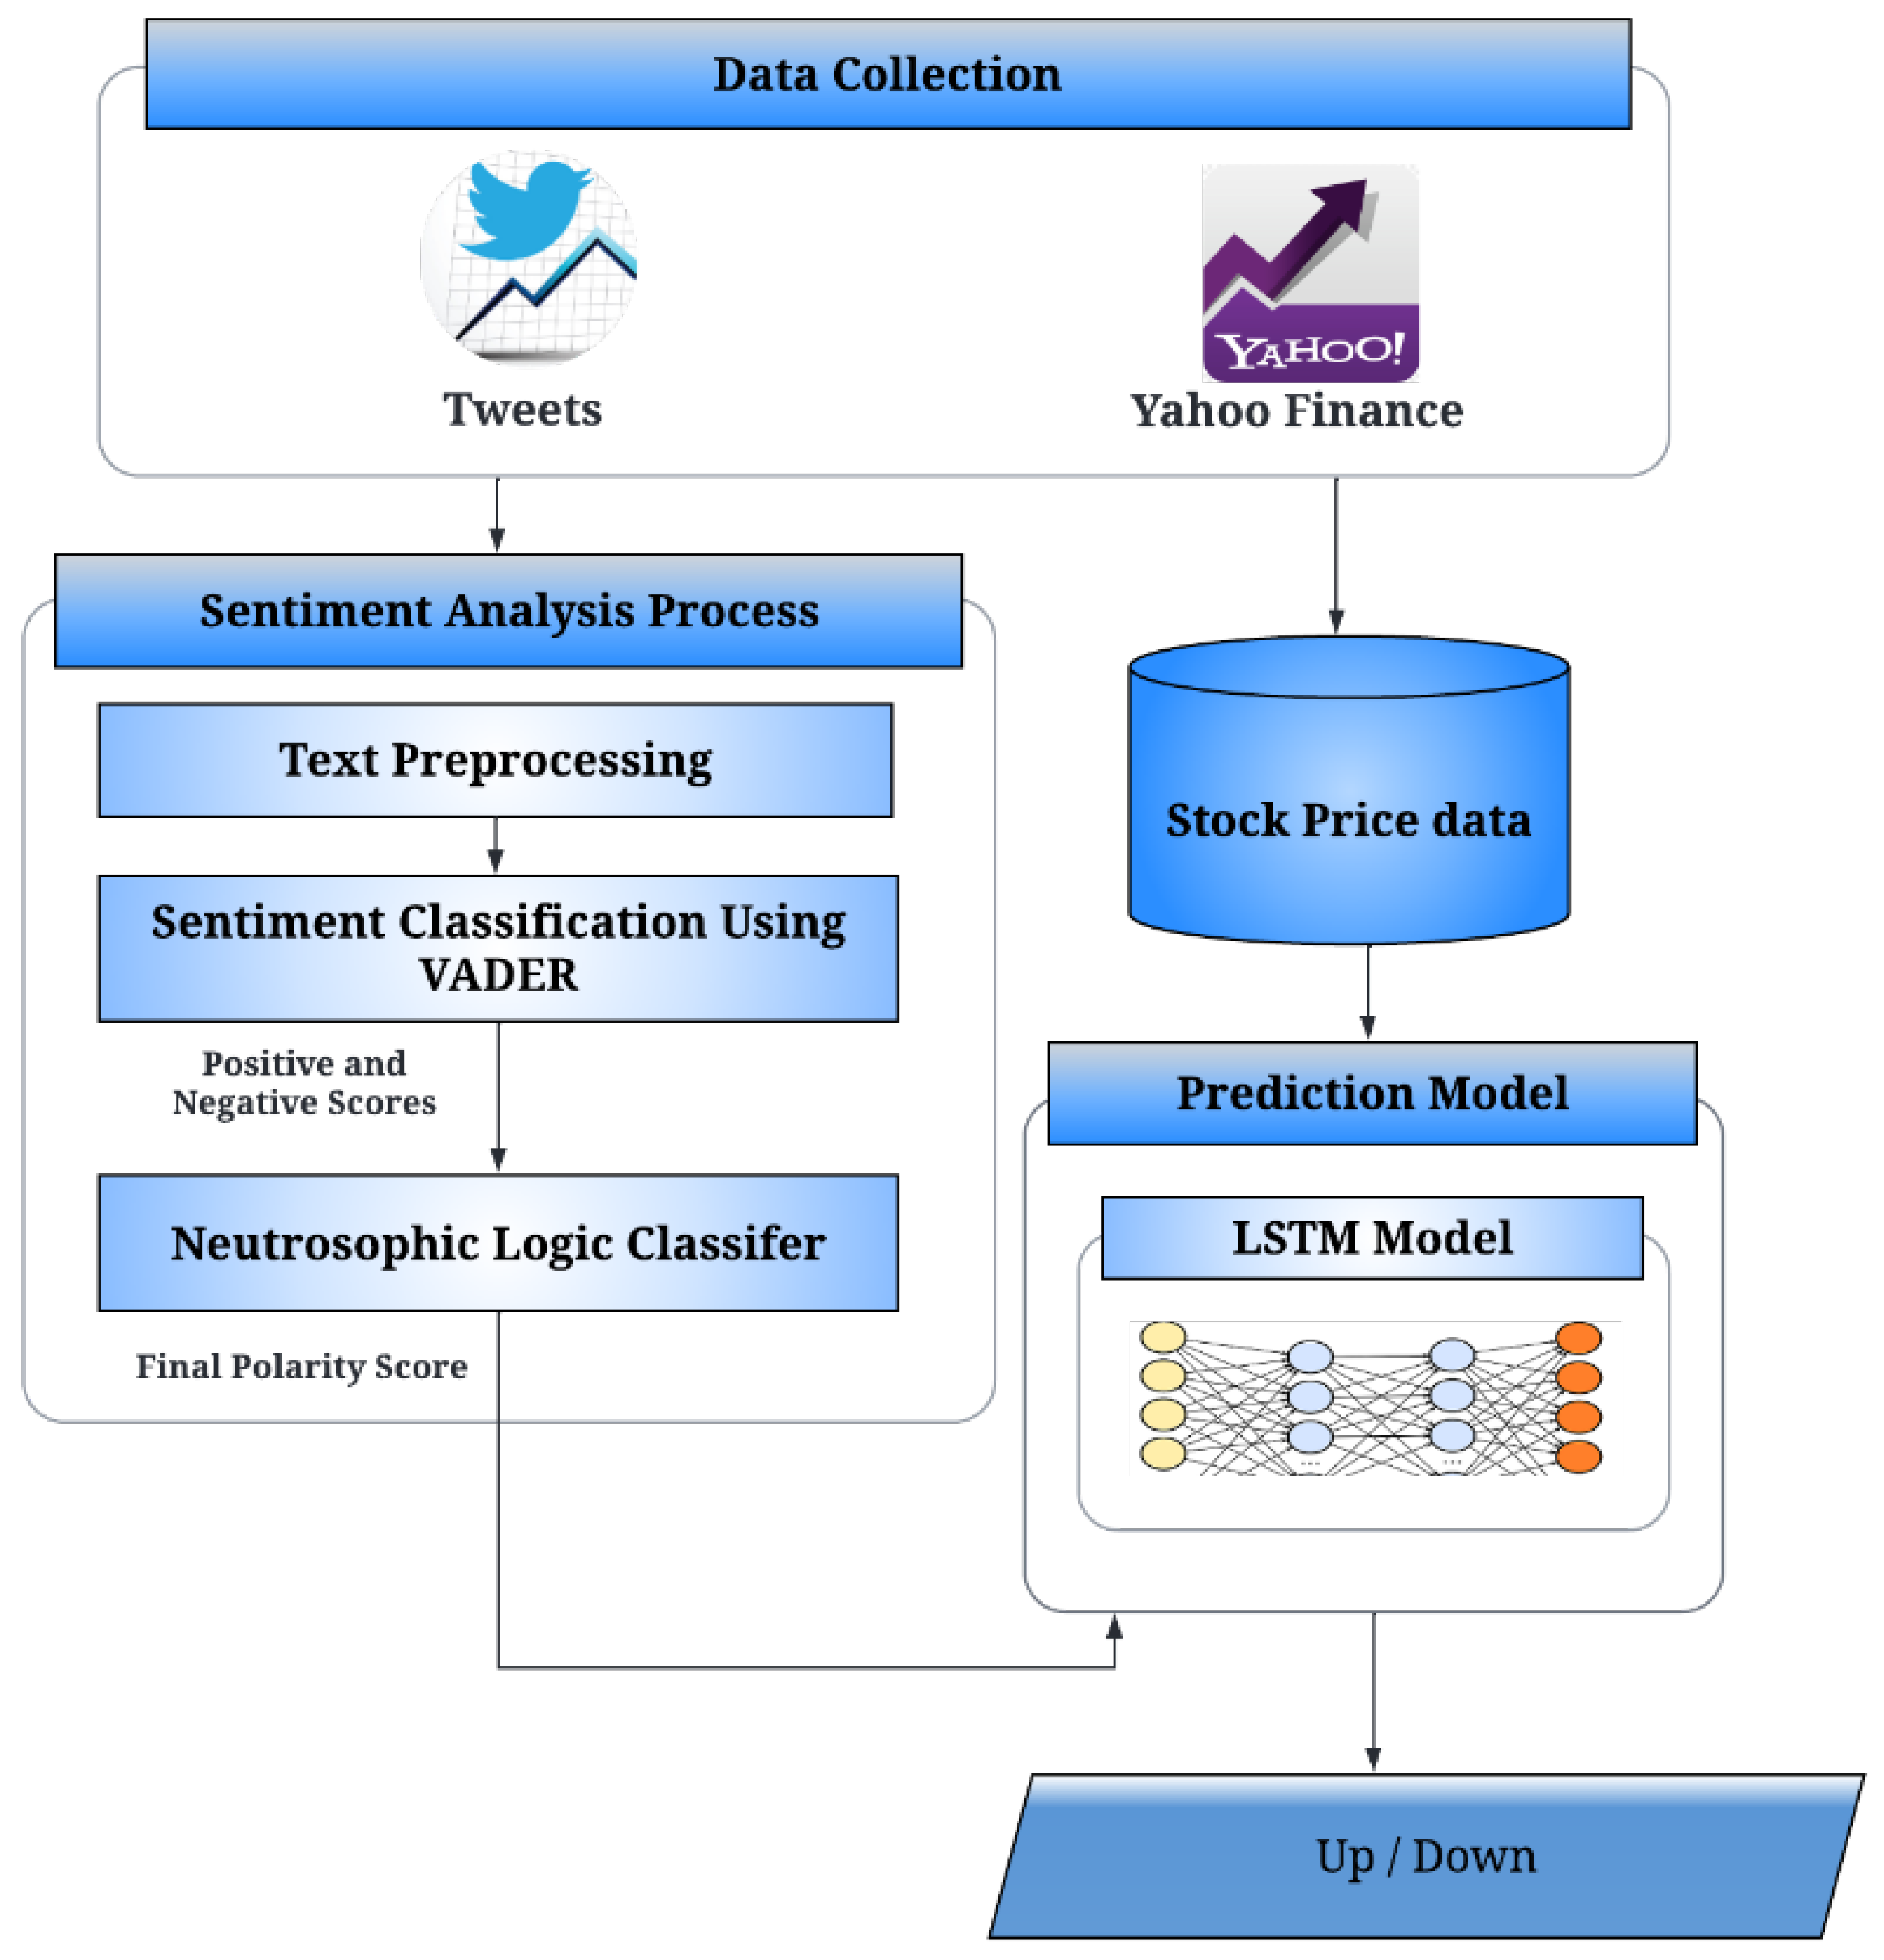
The objectives of this paper are to enhance the accuracy of stock market movement prediction by integrating SA of public opinion from Twitter, and historical stock market data. This enhancement will be achieved by improving the sentiment analysis results, specifically designed to handle the uncertain and ambiguous data gathered from Twitter, about various companies and people’s viewpoints regarding them. To address this challenge, we employ neutrosophic logic (NL) [
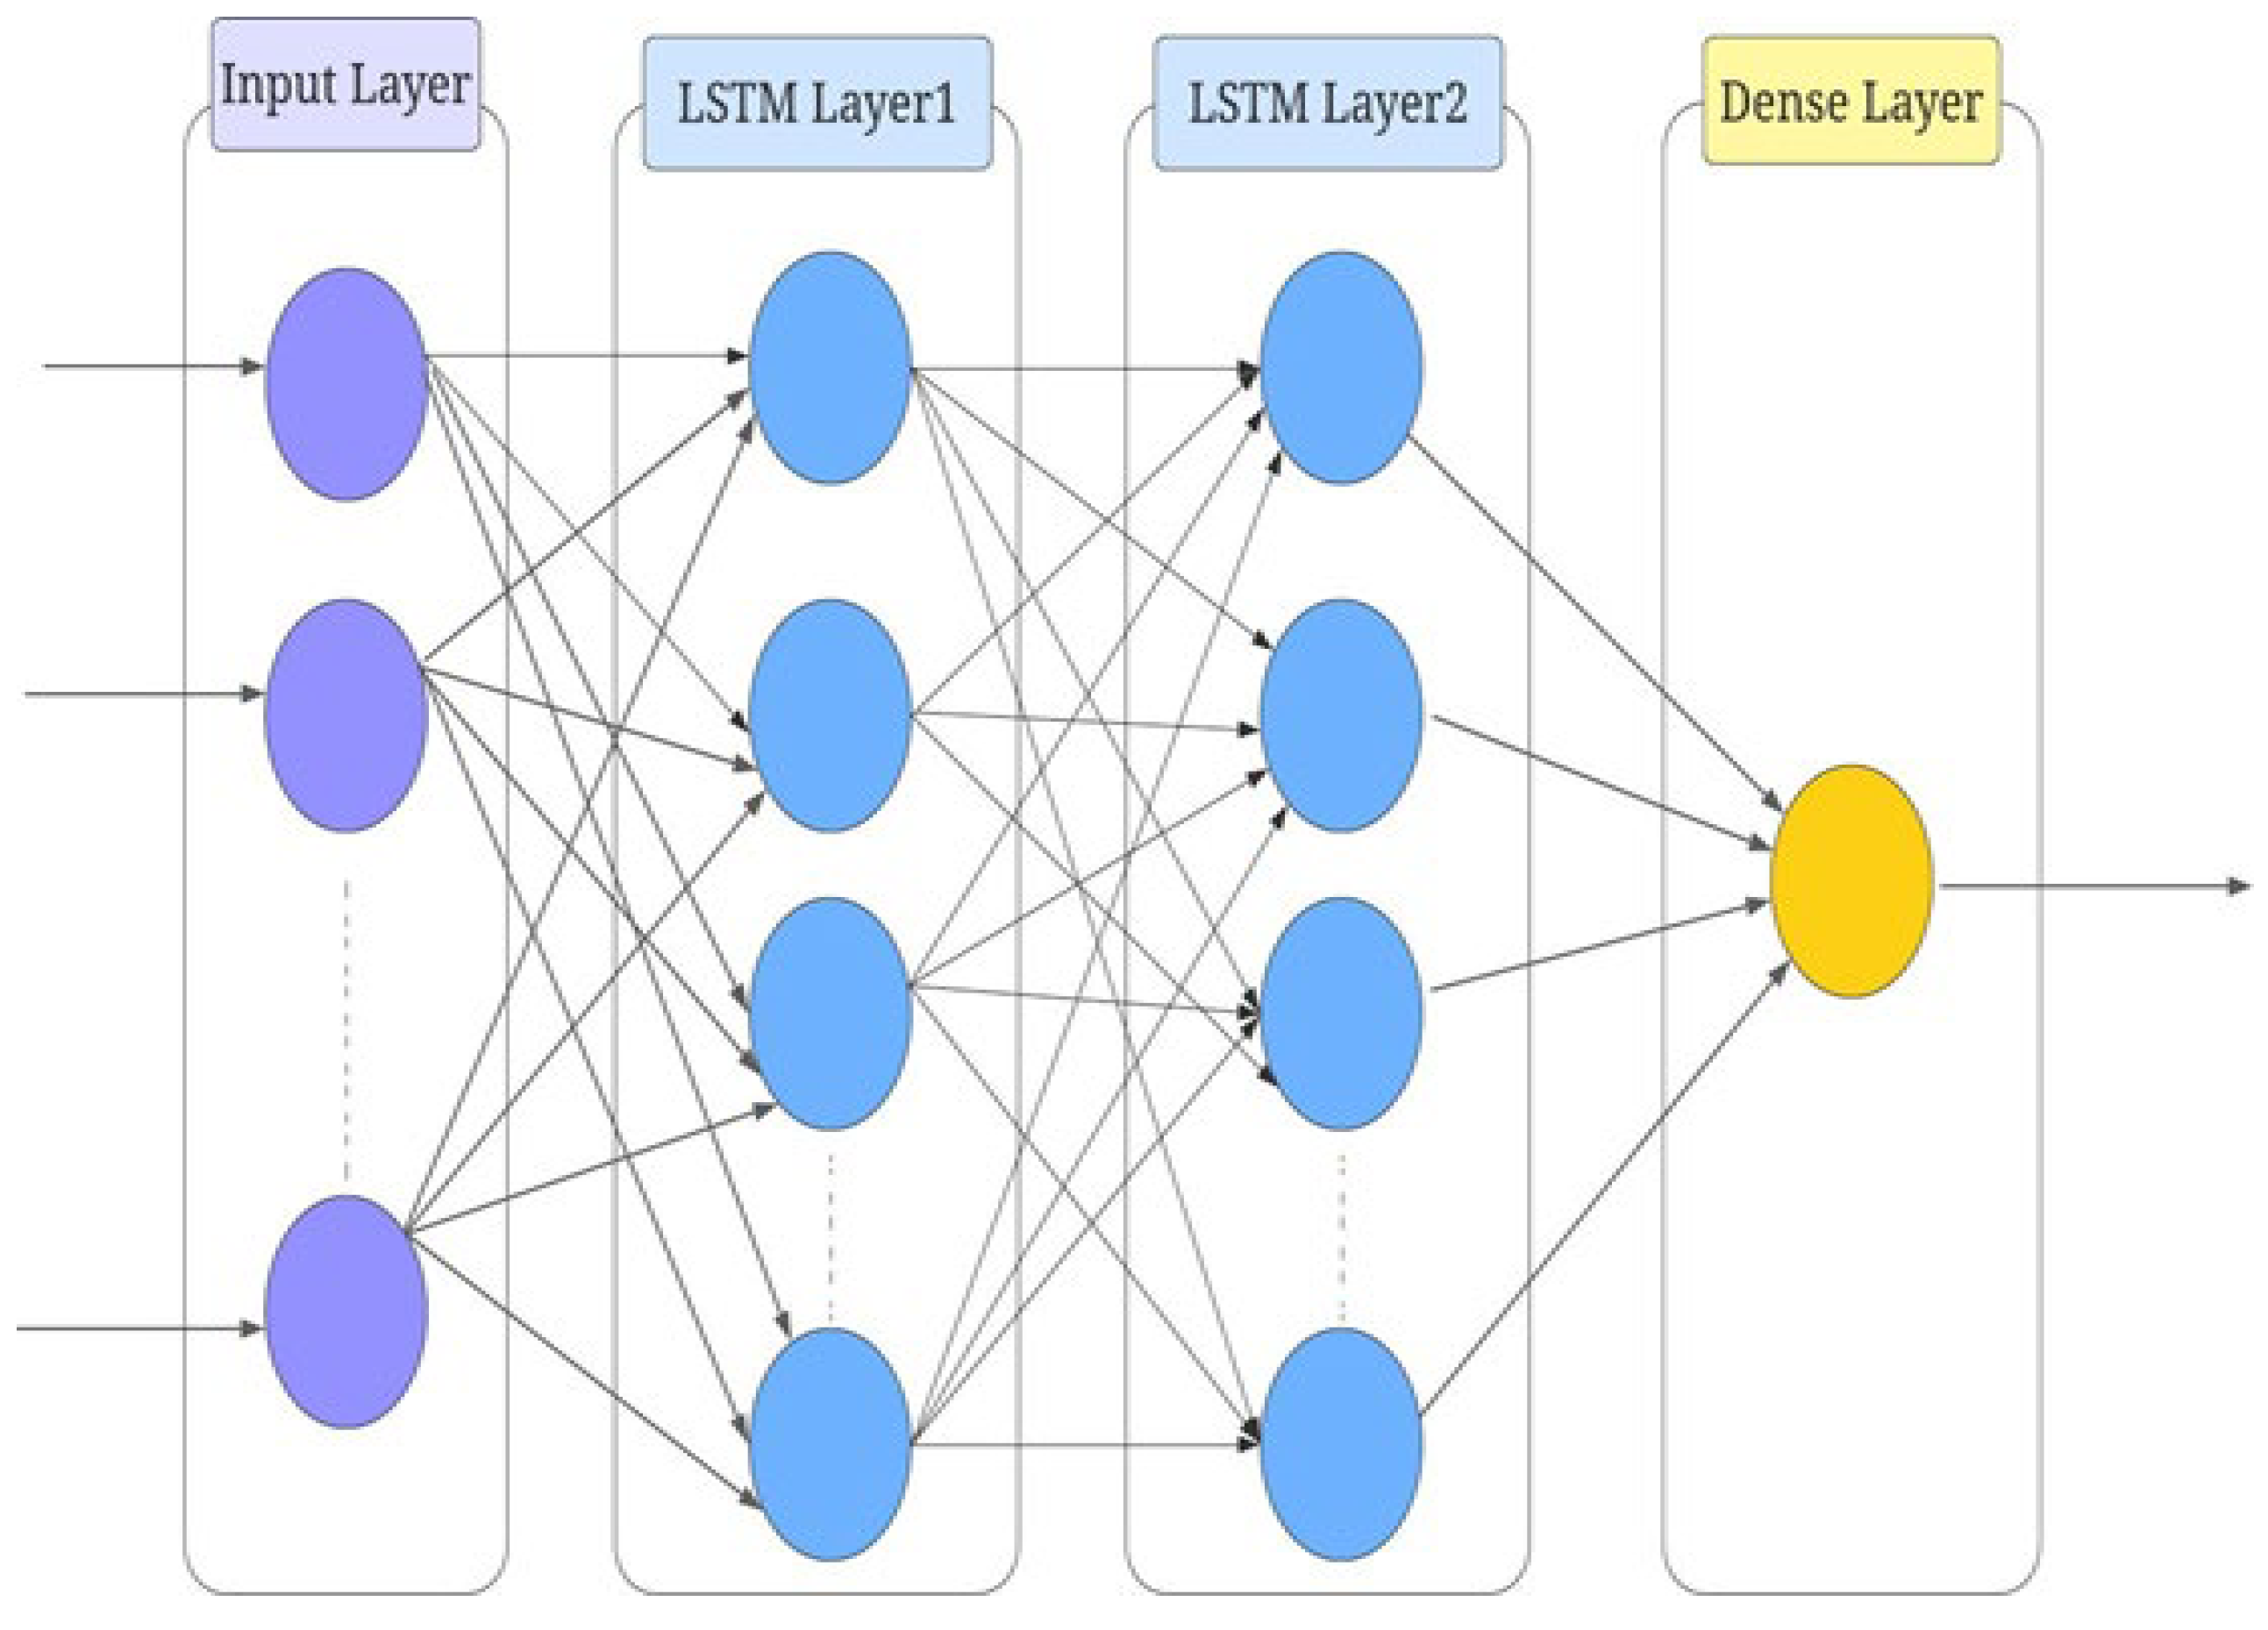
12]. Furthermore, the output of sentiment analysis, alongside historical stock market data collected from Yahoo Finance, is incorporated into a model known as long short-term memory (LSTM) with the utmost accuracy to forecast the stock market movement. LSTM was chosen due to its capability to retain information over extended periods and demonstrate efficiency as a predictive model [13]. The core contributions of this paper are as follows:
  • Proposal of a sentiment classifier based on NL to handle the ambiguity and uncertainty present in the data collected from Twitter, particularly concerning individuals’ viewpoints regarding companies and stocks.
  • Proposal of an enhanced prediction model that integrates the outcomes of sentiment classification and historical stock market data through the utilization of the LSTM model.
  • The proposed model utilizes a benchmark dataset known as StockNet [14] to evaluate the efficiency of our proposed model compared to the other models.
The results of this study yielded a predictive accuracy of 78.48% in anticipating fluctuations in stock prices when utilizing the StockNet dataset [14]. Furthermore, this achievement surpassed the accuracy rate of prior studies that employed the same dataset.
The rest of this paper is structured as follows: Section 2 describes the related works of stock market prediction and NL. Section 3 focuses on the proposed model in detail. Section 4 illustrates the experimental results. The conclusion and future work are reported in Section 5.

2. Related Work

Predicting stock price trends has consistently captivated the interest of researchers, prompting investigations using various methodologies. Past endeavors in this field can be classified into two approaches: the analytical approach and the sentiment analysis approach. Within the analytical approach, the focus is on gathering historical stock data from various financial sources like Yahoo Finance and Google Finance. Conversely, the sentiment analysis approach is centered around users’ reviews related to a specific stock or company, which are shared on diverse online platforms such as Facebook and Twitter [15]. This section provides a comprehensive literature review that primarily focuses on previous studies adopting the sentiment analysis approach. Moreover, we examine the influence of different techniques employed to enhance the accuracy of stock market forecasting and elucidate the correlation between stock market prices and social media or financial news [16]. In 2016, Pagolu et al. [17] tried to determine a correlation between the stock prices of Microsoft and public sentiments in tweets about that company to forecast the stock price for the next day. Two different methods, namely Word2vec and N-gram, were employed to calculate the polarity of each tweet. The accuracy of the polarity classification was approximately 70%, and the correlation between stock prices and sentiment was approximately 71.82%. However, it is worth noting that their study was limited by a small dataset comprising only 3216 tweets used for training the model.
In 2018, Xu et al. [14] suggested a deep generative approach, known as StockNet, for predicting stock market movement employing Twitter data and historical stock prices. This neural network architecture demonstrated a superior performance compared to prior works and incorporated recurrent, continuous latent variables to enhance the handling of randomness. However, the achieved accuracy was limited to approximately 58.23% due to the dataset’s limited size. Another significant study in this direction was performed in 2019, where Xu et al. [18] suggested an attention-based LSTM approach that integrated tweets collected from StockTwits, historical data collected from Yahoo Finance, and technical indicators such as Average Directional Movement Index, Simple Moving Average, and Exponential Moving Average to enhance its effectiveness. The study primarily focused on comparing the performance of the attention-based LSTM approach with that of a traditional LSTM. The results of the model outperformed the traditional LSTM, achieving an accuracy rate of approximately 64%. However, it is important to note that this accuracy rate is still deemed insufficient due to the dataset’s limited size, and more stocks and technical indicators need to be collected.
In 2020, Maqsood et al. [19] applied three machine learning algorithms, namely linear regression, support vector regression, and deep learning, to forecast stock market trends for the four primary stocks from the US, Turkey, Pakistan, and Hong Kong and evaluate the efficacy of each model. Each model incorporated Twitter data related to eight significant events to augment the accuracy of stock market predictions. The authors concluded that not all events have a direct influence on stock market prediction. Nevertheless, noteworthy local events possess the potential to impact the effectiveness of prediction algorithms. One of the disadvantages is that it was determined that the sentiment analysis technique (i.e., SentiWordNet) employed in their study was overly simplistic to establish comprehensive conclusions regarding this statement. In the same year, Gupta et al. [20] demonstrated the correlation between daily sentiments extracted from StockTwits and the corresponding daily movement of stock prices. Sentiment analysis was conducted using machine learning methods (SVM, naïve Bayes, and logistic regression) and feature extraction techniques (bigram, bag of words, trigram, LSA, and TF-IDF). The fusion of TF-IDF and logistic regression achieved the highest accuracy, ranging from 75% to 85%. However, one study drawback was that the authors focused only on positive and negative sentiments while disregarding neutral sentiments.
Sawhney et al. [21] suggested a model, known as Multipronged Attention Network for Stock Forecasting (MAN-SF), which concurrently assimilates information from Twitter data, historical stock prices, and inter-stock relations for predicting stock market movement. The model leverages a graph neural network to discern relationships among different stocks, allowing it to acquire insights from correlations and interdependencies that impact stock movements. The authors employed the StockNet dataset and performed a comparative analysis of their model against others utilizing the same dataset. MAN-SF outperforms the strongest baselines, StockNet and Adversarial LSTM, demonstrating its superior performance in stock prediction with an accuracy of approximately 60.8%. Nevertheless, it is crucial to highlight that the accuracy rate was considered inadequate because of the dataset’s limitations.
In 2021, Heiden et al. [13] tried to predict the stock price and investigated the impact of the news on it. They incorporated news sentiment as a feature in an LSTM prediction model, along with historical data. The authors obtained the news from the New York Times and employed a Valence Aware Dictionary and Sentiment Reasoner (VADER) for SA. The results indicated that including news sentiments improves the model’s performance. Furthermore, the model exhibits promising possibilities to predict stock prices for approximately 60 days into the future. One of the disadvantages of the study was the utilization of a limited dataset, potentially leading to less reliable and accurate results.
Ho et al. [22] proposed a novel multi-channel collaborative network architecture for stock trend prediction. This architecture integrates social media sentiment features extracted from Twitter and candlestick chart features derived from the stock’s historical time series data to capture temporal patterns and price dynamics. The network employs two branches, each employing specific deep-learning techniques. A one-dimensional convolutional neural network is utilized for sentiment classification on the extracted social media features, while two-dimensional convolutional neural networks perform image classification on the transformed candlestick chart data. The experimental results indicate a superior performance when compared to single-network models that rely solely on either candlestick charts or sentiment data. Notably, the proposed model achieved a prediction accuracy of 75.38% for Apple stock.
Another study in this area was achieved in 2022, where Fazlija et al. [23] demonstrated the use of financial market sentiment data extracted from news articles to predict fluctuations in the Standard & Poor’s 500 stock market returns using sentiment values. The authors discovered that employing the Bidirectional Encoder Representations from Transformers (BERT) model yielded the highest success rate in sentiment classification. Moreover, they devised a random forest classifier technique for forecasting future price movements of the stock market index. The findings of the study demonstrated the significance of incorporating sentiment scores derived from news articles in forecasting the movement of stock prices. A notable limitation of the study is the omission of news data from all companies included in the stock market index.
Cristescu et al. [24] investigated the potential of SA to enhance the accuracy of the prediction of the stock market price using regression models. VADER was employed for SA based on news articles, and three types of regression models were implemented: cubic, quadratic, and linear regressions. The findings revealed that incorporating SA significantly improved the performance of the nonlinear regression model, evidenced by a superior fit compared to the linear model. Notably, the R-squared value was 0.005 for cubic regression and 0.001 for linear regression, indicating the superior performance of the cubic regression model.
Srijiranon et al. [25] tried to improve the prediction of the stock market by introducing a hybrid model that integrates three techniques: Principal Component Analysis, Empirical Mode Decomposition (EMD), and LSTM employing the incorporation of historical stock market data and the news. They utilized the Financial Bidirectional Encoder Representations from Transformers (FinBERT) for the SA process. The results indicated that the hybrid model demonstrated a superior performance, and the incorporation of news sentiment analysis enhanced the LSTM model’s predictive capabilities.
Koukaras et al. [26] emphasized the significance of SA in the enhancement of stock market prediction by employing StockTwits and Twitter data. The authors integrated SA with machine learning and utilized seven machine learning algorithms, including Logistic Regression, Support Vector Machine, Multilayer Perceptron, k-nearest neighbors, naïve Bayes, Decision Tree, and Random Forest. They performed VADER and TextBlob for SA. The findings revealed that optimal results were achieved when employing VADER incorporating the Support Vector Machine with an F-score of 76.3%.
In 2023, Costola et al. [27] examined the correlation between the stock market and news regarding COVID-19 obtained from the New York Times, Reuters, and MarketWatch news platforms. To conduct SA, the authors employed a BERT model adapted for the financial market domain. The findings of this study revealed a positive relationship between the sentiment score and market returns. However, one limitation of the study is its exclusive focus on three news platforms, neglecting the inclusion of social networks as potential data sources. Nevertheless, none of the aforementioned approaches adequately capture the uncertainties and contradictions present in sentiment data. To tackle the issue of uncertainties in SA, the researchers attempted to leverage NL, aiming to enhance the efficiency of sentiment classification [28,29].
Kandasamy et al. [30] emphasized the presence of indeterminacy in the tweets based on the concept of neutrosophy. A dataset containing tweets related to the #MeToo movement was represented with positive, indeterminate, and negative memberships, forming a Set of Neutrosophic Values (SVNS) through the use of the VADER tool. Subsequently, the tweets were clustered and classified into positive, indeterminate, and negative classes. The K-means algorithm was employed to cluster the tuples into three major clusters, with the largest cluster representing the indeterminate tweets. To enhance the accuracy of predicting indeterminate polarity, the data were classified into eight distinct classes. The authors used training data to develop classifiers based on the Support Vector Machine (SVM), and k-nearest neighbor (k-NN) techniques. The study’s findings revealed that the k-NN demonstrated superior performance compared to SVM in effectively classifying the SVNS values.
Kandasamy et al. [10] introduced a multi-refined neutrosophic set (MRNS), which refined the polarity result into seven classes (i.e., positive, indeterminate, negative, strong positive, indeterminate positive, indeterminate negative, and strong negative). The authors conducted a comparison between MRNS and two other approaches: one utilizing a single-valued neutrosophic set, and the other employing a triple-refined indeterminate neutrosophic set. The results demonstrated that MRNS outperformed the other approaches, providing a superior and more accurate result and effectively handling the inherent indeterminacy present in the data.
Reem et al. [12] introduced an opinion-mining model tailored for social media to tackle the challenges associated with ambiguous opinion classification. The proposed model incorporates social network analysis utilizing the UCINET tool, which is used for analyzing social network data (the University of California at Irvine Network), neural networks to assess the influence levels of users, and a classifier to combine their influence with the polarity of their texts. The authors evaluate the model using three classifiers (i.e., type-1 fuzzy logic, type-2 fuzzy logic, and NL) to handle the uncertainty in the data. The results demonstrated that NL surpasses the other classifiers in accuracy when dealing with data uncertainty. This highlights the effectiveness of NL in enhancing the performance of opinion mining in the realm of social media.

The Need to Extend the Related Work

Despite the existence of numerous studies on stock market prediction using SA, all these studies have demonstrated the influence of news and social media on the stock market. However, these studies primarily relied on traditional SA techniques and did not prioritize improving the SA results to address the challenges of data uncertainty.
In our work, we propose an enhanced model to predict the stock market movement using SA by proposing an advanced SA approach to deal with the ambiguity and uncertainty in the data by integrating a lexicon-based approach (i.e., VADER) with the NL technique. The key strength of NL is the ability to handle uncertainty by employing three membership functions, truth, indeterminacy, and falsity, to capture ambiguity and achieve accurate results closer to reality. To the best of our knowledge, this is the first time the NL technique is employed in the SA process to forecast the stock market movement.

3. Proposed Model

This model aims to enhance the prediction of stock market movements through the fusion of SA scores and historical stock data. This is achieved by improving the result of SA using NL, which can deal with indeterminacy in the data. The use of NL addresses the problem of data ambiguity when the tweet has the potential for two classifications. As a result, it improves the classification of tweets. The proposed model is discussed in the following steps:
  • Proposal of an NL-based model integrated with a lexicon-based approach for calculating the sentiment classification of tweets to deal with uncertainty and ambiguity in the data collected from Twitter related to users’ feedback and opinions about specific stocks and companies.
  • Application of a deep learning algorithm LSTM to predict stock market price by using the result of sentiment score and the real stock price data as features in an LSTM model.
  • Finally, the proposed model uses the integration of the SA score with the historical stock market. Moreover, it holds the distinction of being the first model that uses NL in the SA process to predict stock market movement.
Figure 1 presents the proposed model. The proposed model can be summarized in the following phases:

3.1. Data Collection

We have utilized a benchmark dataset called StockNet inspired by [14,21] which encompasses tweets and historical stock market data related to the stocks of 88 different companies over the period from 1 January 2014 to 1 January 2016. The tweets were obtained from Twitter based on NASDAQ ticker symbols (e.g., $APPL for Apple), while the historical data were collected from Yahoo Finance for the same period.

3.2. Data Pre-Processing

The purpose of this phase is to eliminate noise and irrelevant data from tweets to improve the effectiveness of the SA process. During this phase, several cleaning steps are performed [31]. Firstly, tweets are converted to lowercase. Subsequently, stopwords, punctuation, numbers, re-tweets, links, HTML tags, and special characters such as @ symbols, mentions, and hashtags are removed, ensuring a refined dataset for further analysis.

3.3. Sentiment Analysis Based on Neutrosophic Logic

In this phase, we conduct sentiment classification of the tweets. and address the challenges of uncertainty and ambiguity in the social media data. The presence of uncertainty in the data poses a significant issue in sentiment analysis (SA), potentially resulting in data misclassification. Previous studies showed that both type 1 and type 2 fuzzy logic, as well as NL, can effectively address the uncertainty inherent in the data. Fuzzy logic, whether type 1 or type 2, introduces an overlapping region between classes, leading to ambiguity in the classification. Conversely, NL processing is adept at handling such ambiguity, thereby enhancing the efficiency of the classification process, as illustrated in Figure 2 [12,29,32,33]. Our aim is to enhance the efficiency of classification by using NL with a sentiment lexicon. The purpose of this phase is achieved through the following steps:

3.3.1. Use of Lexicon-Based Approach

This process is concerned with computing the positive and negative scores of each tweet after the preprocessing phase using a lexicon-based sentiment technique (i.e., VADER) based on [34]. VADER is a Natural Language Toolkit (NLTK) Python package that generates four outputs: the scores of positive, negative, neutral, and compound (i.e., the total score of positive, neutral, and negative normalized between −1 and +1) for each text. VADER was selected due to its demonstrated superior performance when compared to other lexicons such as SentiWordNet, and TextBlob [25,33]. Additionally, it can provide positive and negative sentiment scores, which we incorporated into our NL classifier [34]. After applying VADER, only the positive and negative scores are fed into the NL classifier for further analysis.

3.3.2. Neutrosophic-Logic-Rule-Based Classification

The most important part of our work is this phase as it can solve the issue of ambiguity and uncertainty in the data and generate precise results that closely resemble how people interpret the texts. NL is defined by three membership functions (MF): truth membership function, indeterminacy membership function, and falsity membership function [12,32]. The output variables are represented as three components (truth, indeterminacy, and falsity), ensuring that there is no overlap between any two MFs [12]. The block diagram representation of an NL classification system is illustrated in Figure 3. The NL process is achieved in three steps, as follows:
(1)
Neutrosophication
In this phase, the crisp inputs are transformed into neutrosophic sets using three triangular MFs: truth, indeterminate, and falsity. The inputs derived from the previous phase after applying VADER to the tweets include the positive and the negative score (PS and NS, respectively). The two inputs are assigned a value between 0 and 1, each with the levels low (L), moderate (M), and high (H) for the truth component according to Equation (1). Meanwhile, for the indeterminacy according to Equation (2) and falsity components according to Equation (3), the levels are low–moderate (L-M) and moderate–high (M-H) [12,33,35]. The output variable was assigned a value ranging from 0 to 1 with three classes (positive, neutral, and negative) inspired by the work introduced in [34]. Figure 4 illustrates the design of the NL truth MFs of the two inputs, PS and NS, whereas Figure 5 shows the indeterminate MFs, and Figure 6 illustrates the falsity MFs.
T Ã x = α Ã x a 1 a 2 a 1                   ( a 1     x     a 2 ) α Ã                                 ( x = a 2 ) α Ã a 3 x a 3 a 2               ( a 2     x     a 3 ) 0                                           o t h e r w i s e  
I Ã x = a 2 x + θ Ã x a 1 ) ) a 2 a 1 ( a 1     x     a 2 )   θ Ã ( x   =   a 2 ) x a 2 + θ Ã a 3 x ) ) a 3 a 2 ( a 2     x     a 3 )   1 o t h e r w i s e  
F Ã x = a 2 x + β Ã x a 1 ) ) a 2 a 1 ( a 1     x     a 2 )   β Ã ( x   =   a 2 ) x a 2 + β Ã a 3 x ) ) a 3 a 2 ( a 2     x     a 3 )   1 o t h e r w i s e  
where à represents a 1 , a 2 , a 3 ; α à   , θ à   , β à   which is a neutrosophic set, α à   represents the maximum truth membership degree, θ à   indicates the minimum indeterminacy membership degree, and β à represents the minimum falsity membership degree. α à   ,   θ à and β à     ∈ [0, 1]. Additionally, a 1     a 2   a 3 . These assumptions are based on [12,33,35].
(2)
Rule Evaluation
In this phase, IF-THEN rules are produced by combining two inputs (i.e., PS and NS), each with levels. The rules are formulated for all truth, indeterminacy, and falsity inputs and outputs. The rules are inspired by the work carried out in [34]. The antecedent of the NL rules is represented by the inputs, each with three levels (i.e., L, M, H), and joined by the AND operator. Table 1 illustrates a sample of the NL rules.
(3)
Deneutrosophication
In the final phase of our NL model, the neutrosophic output is transformed into a crisp output based on COA (center of the area) [33]. The output is calculated as follows:
C O A = z μ A z μ A z
where z represents the output variable, described in the neutrosophication step, while μ A denotes the aggregated output of the rules. The neutrosophic result is obtained by combining the truth, indeterminacy, and falsity component values and is represented in the triplet format of (T, I, F). If the output falls within the overlapping zone of two membership functions, ambiguity is generated [12]. NL can handle ambiguity by defining a confidence value for the truth component according to Equation (5). If the truth value surpasses the confidence value (i.e., 0.5), the final output is the truth component value and the falsity and indeterminacy components are not significant; otherwise, the ambiguous results are generated [12,29]. Figure 7 illustrates how to determine the confidence value.
i | f =   significant ,     t < 0.5 insignificant ,     t 0.5
where t, i, and f are the truth, indeterminacy, and falsity components, respectively. The final polarity is calculated from the neutrosophic output according to polarity classes in [34]. We have added a new polarity class called Indeterminate to the existing classes (e.g., Positive, Neutral, Negative) that is undecided, and we do not know whether it is negative, positive, or neutral according to Equation (2).

3.4. Prediction Model Using Long Short-Term Memory (LSTM)

This process is the last phase of our work. It is focused on predicting stock market movements by combining the sentiment polarity from the previous phase and historical stock price data obtained from the first phase to be fed into the prediction model. To accomplish this, we employ LSTM, a type of recurrent neural network that enables the preservation of input data information over extended periods [13]. The LSTM model comprises three layers, including an input layer, multiple LSTM layers, and finally, a single dense layer that consolidates the inputs received from the LSTM layer to generate the ultimate prediction value. Figure 8 depicts an LSTM architecture and its three corresponding layers.
The model has two hidden LSTM layers which improve the model’s capacity to abstract information and depict more intricate patterns [13]. Each LSTM layer contains multiple memory cells. The memory cell contains three gates: forget, input, and output. These gates are constituted by the sigmoidal layer, which is crucial in regulating the transmission of information, both entering and exiting the memory cell [36]. The forget gate is responsible for discerning which information should be removed from the cell state. This process is aided by the sigmoid activation function. The forget gate generates an output value within the 0 to 1 range for each element within the prior cell state. An output of 1 indicates the intention to preserve the associated information, whereas an output of 0 signifies the intent to discard that information [37]. This representation of the forget gate is denoted in Equation (6). The input gate oversees the incorporation of new information into the cell state. The sigmoid activation function governs which values will be updated. Meanwhile, the tanh activation function generates a set of new candidate values represented as a vector, which could be added to the state according to Equations (7)–(9). The output gate determines the resulting output for each cell. The output value is determined by the cell’s current state in conjunction with the most recently added data according to Equations (10) and (11) [38].
f t = σ   X t ×   U f +   H t 1 ×   W f
i t = σ   X t ×   U i +   H t 1 ×   W i
C ~ t = tanh X t ×   U c +   H t 1 ×   W c  
  C t = f t ×   c t 1 +   i t ×   C ~ t  
  o t = σ   X t ×   U o +   H t 1 ×   W o
H t = o t × tanh C t  
where σ is the sigmoid function,   X t denotes the input at the current timestamp,   U f   ,   U i   ,     U c   and   U o are the weights of the inputs,   H t 1 represents the previous hidden state, and   W f ,   W i ,   W c and   W o are the weights of the hidden state. The terms f t is the forget gate, i t is the input gate, and o t is the output gate. Moreover, C ~ t stands for the candidate cell state at the current timestamp,   C t represents the cell state at the current timestamp, and   H t denotes the current hidden state.
The input data to the model incorporate a set of parameters, including the adjusted closing price, opening price, highest price, lowest price, volume, and sentiment polarity, which were derived from the prior phase. We performed a binary classification to predict the stock market movement on day d based on the integration of the SA scores with the historical stock market data within a predetermined lag window of D days, encompassing the period [dD, d − 1]. As an illustration, employing a lag window of D = 5 days implies the inclusion of data from the preceding five days [14,21]. The stock market movement is obtained by using the following formula:
m d =   0 , p d c < p d 1 c 1 , p d c p d 1 c
where m d represents the movement on day d, p d c indicates the adjusted closing price on day d, and p d 1 c indicates the adjusted closing price on the previous day. Additionally, 0 represents a downward movement and 1 represents an upward movement.
We evaluated the model’s classification performance using accuracy, and Matthew’s Correlation Coefficient (MCC) as evaluation metrics according to previous studies on stock prediction [14,21]. MCC is calculated as follows:
  M C C = t p t n f p f n   ( t p + f p ) ( t p + f n ) ( t n + f p ) ( t n + f n )
where tp, tn, fp and fn are true positive, true negative, false positive, and false negative, respectively.
To make a trading decision, we evaluated the model’s financial performance using two metrics: cumulative return, which captures the total profit or loss over the test period according to Equation (14); and Sharpe ratio, which assesses the efficacy of an investment relative to its associated risk according to Equation (15) [21,38].
  r e t u r n d = i S p i d p i d 1 p i d 1   ( 1 ) A c t i o n i d 1
where S is the set of all stocks considered in the analysis, p i d refers to the price of a specific stock i on particular day d, and A c t i o n i d 1 indicates the investment action taken for stock i on the previous day (d − 1) with value 0 or 1. Specifically, a value of 0 signifies a long position, indicating the investor purchased the stock on day d − 1 with the anticipation of future price appreciation. Conversely, a value of 1 denotes short position action.
  S h a r p e   R a t i o a = R a R f σ   a
where R a represents the return, R f indicates the risk-free rate, and σ a represents the standard deviation of R a .

4. Experimental Results

In this section, the experimental results and implementation of the proposed model are described. We have implemented our model in Python version 3.8.10. Due to the lack of an NL toolbox, scikit-fuzzy, a Python package for fuzzy logic, was opted for to implement NL by using three fuzzy inference systems to correspond to the truth, indeterminacy, and falsity components, as it was previously indicated in the previous studies that NL could be implemented using the fuzzy toolbox [12,29,32]. Furthermore, we selected the Keras Python library for implementing LSTM.
We utilized the StockNet dataset benchmark for tweets and historical stock market data to train and test our model [14,21]. Our dataset was split into training and testing sets in a ratio of 80:20. We shifted a window of 5 days for constructing input samples. Our LSTM model consists of one input layer, two LSTM layers, and a dense layer. We used the Sigmoid and Tanh as activation functions for the two LSTM layers. We trained the model for 10,000 epochs, using early stopping based on the MCC metric on the validation set to prevent overfitting [14]. We compared our work with the other models that use the same dataset to assess the effectiveness of our model [14,21].

4.1. Comparison of the Effect of Using Sentiment Analysis on the Prediction Model

The primary objective of the first set of experiments is to ascertain whether the sentiment of Twitter data has a significant effect on the performance of our prediction model, which was implemented using LSTM. The model was trained and evaluated on two datasets: one containing only historical stock market data; and the other containing a fusion of historical stock market data and sentiment scores obtained from Twitter related to users’ feedback and opinions about specific stocks and companies, identified by their ticker symbols (e.g., $MSFT for Microsoft). SA was conducted using our NL model. As illustrated in Table 2, our model using sentiments based on NL achieves the highest performance, with an accuracy of 78.48% and an MCC score of 0.587. The results indicate that the model incorporating sentiment features outperforms the model without sentiment across all analyzed stocks, leading to a statistically significant improvement in accuracy. This confirms that the expression of positive or negative feedback by users about a given company on Twitter influences future changes in stock prices. Specifically, when the sentiment score is positive, we observe an increase in stock prices in the following days. This highlights a strong correlation between the public sentiment expressed on Twitter and the subsequent movement of stock prices, emphasizing that to obtain a highly accurate predictive model, a diverse range of data sources is required because using historical stock market data only may have limitations in comprehensively encapsulating all pertinent variables influencing stock prices. In contrast, sentiment data can provide valuable insights into the market that are not readily discernible within conventional financial datasets.

4.2. Comparison between Different Sentiment Analysis Techniques

The second set of experiments was conducted to assess the effectiveness of the machine learning sentiment classifier (i.e., NL model) in the SA process compared to the lexicon-based sentiment classifier used in [26] (i.e., TextBlob in our case) in our prediction model. We aggregated the result of SA with the historical stock market data and fed it into the LSTM model. The results in Table 3 show that SA using NL achieves the highest accuracy of around 78.48% and an MCC score of 0.587. Meanwhile, TextBlob achieves an accuracy, 75%, and an MCC score of 0.5119. The model prediction with NL-based SA yields a better result due to the ability of NL to classify the tweets and assess its ability to handle classification ambiguity because it assigns each instance true, indeterminate, and false values that accurately reflect the possible classifications of that instance. This leads to improved SA results, which, in turn, has a significant impact on the performance of our prediction model.

4.3. Comparison between Different Machine Learning Models

The third set of experiments was conducted to investigate the performance of the prediction model using LSTM compared to other prediction models using different machine learning techniques used in the previous studies such as naïve Bayes, neural networks, and Support Vector Machine [20,26]. The models were trained and evaluated using the same dataset containing a fusion of historical stock market data and sentiment scores. The results in Table 4 show that the LSTM model outperformed the other models in predicting the movement of the stock market. The LSTM model achieved the best result due to its proficiency in capturing long-term dependencies and its capacity to retain and leverage historical information for future predictions, a crucial advantage considering the influence of historical trends and social media sentiment on stock prices.

4.4. Comparison between Different Baseline Models

The fourth set of experiments aimed to ascertain the efficiency of the proposed model in comparison to the below baseline models employed in previous studies using the StockNet dataset.
  • StockNet: a deep generative model employing historical data and twitter data to predict the stock market movement [14].
  • Multipronged Attention Network for Stock Forecasting (MAN-SF): this model employs a joint deep learning architecture that integrates historical data, twitter data, and inter-stock correlations to predict the stock market movement [21].
  • Adversarial Attentive LSTM: a deep learning model comprising four layers, incorporating Adversarial Training to emulate the stochastic nature of the stock price variable during the training process, thereby improving the accuracy of stock market predictions [39,40].
We opted for a black-box approach, utilizing the default configurations of baseline models. As shown in Table 5, our proposed model outperforms the others, exhibiting superior accuracy and MCC scores, while the Adversarial LSTM model achieved the worst performance in accuracy and MCC scores. These results demonstrate that our model is more effective because it factors in both the SA score and the historical stock market data, while the Adversarial LSTM model only uses historical stock market data. This highlights the ability of our model to yield the best result by using NL in SA to handle uncertainty and incomplete data in tweets, a facet not addressed by other models in the SA process. Additionally, our utilization of an LSTM model for stock market prediction, as previously noted, resulted in a notably high level of accuracy.

4.5. Comparison of the Financial Performance

To make a trading decision and assess the financial performance, we conducted a set of experiments to compare our model with other baselines and a benchmark strategy of buy and hold. As shown in Table 6, we compared our model with other models employed in previous studies using the same dataset [14,21]. Our model demonstrated superior performance compared to various established models, exhibiting superior return and Sharpe ratio scores (similar Sharpe ratio score to MAN-SF). These results indicate strong potential for generating excess return and managing risk. Furthermore, the findings underscore the profitability of our model when contrasted with these models that do not incorporate NL in SA process. Furthermore, a comparison was made between our proposed model and the buy-and-hold strategy, as detailed in Table 7. Our proposed model demonstrated a superior performance, surpassing the buy-and-hold strategy in terms of return and Sharpe ratio scores. This suggests the potential of our model to enhance profitability in financial forecasting.

5. Conclusions and Future Work

In this paper, we introduced a stock market movement prediction model that fuses social media data with historical stock price data. Due to the importance of stock market prediction in recent years and the significant influence of social media on it, the problem of data uncertainty and ambiguity in social media decreases the accuracy of SA results, thereby reducing the accuracy of the stock market forecasting model that utilizes SA. Previous studies did not address this problem. Therefore, the main purpose of our work is to enhance the performance of stock movement prediction by improving the SA results of the tweets through the utilization of NL integrated with a lexicon-based approach capable of handling ambiguous, incomplete, and uncertain data collected from Twitter, particularly in relation to individuals’ perspectives on corporations and stocks and companies. Our proposed model demonstrated its advantage by utilizing the StockNet dataset benchmark and comparing it to models that use this dataset. The proposed model feeds the integrated SA scores with historical stock market data into an LSTM model to foresee the stock movement. Notably, our model distinguishes itself as the first to employ NL in the SA process to predict stock market movement. The findings highlight the importance of incorporating social media data into stock market prediction models because it showed superiority in accuracy and MCC score in comparison to the model without the integration of SA. The proposed model outperformed other models that utilized the same dataset by utilizing NL in the SA process to make the results more compatible with human sentiment and using the integration of historical stock market data with SA results as input factors to our prediction model using LSTM, which resulted in a relatively high accuracy, of around 78.48%, and an MCC score of 0.587. Our investigation into the impact of the NL model in SA on prediction performance revealed that it outperformed the model that utilized TextBlob in the SA. Furthermore, we conducted an examination of the efficiency of employing LSTM in our prediction model, finding that it outperforms models using naïve Bayes, neural networks, and Support Vector Machine. In our model, we also measured the performance of our model based on financial metrics by calculating the return and Sharpe ratio to help investors in trading decisions. We compared our model with baselines and the buy-and-hold strategy. The results showed the superiority of our model in return and Sharpe ratio scores, indicating strong potential for generating excess return and managing risk. In the future, we aim to consider the effect of the variety of user profiles, in terms of whether they are experts, investors, qualified, influencers, or students, on the SA results and seek to use other social media platforms’ data, such as Facebook, LinkedIn, and StockTwits. Additionally, we intend to detect and filter out spam tweets and posts to enhance the sentiment classification performance. Moreover, we aim to utilize a larger benchmark dataset in comparison to our dataset.

Author Contributions

Conceptualization, S.M.D. and B.A.A.; methodology, S.M.D.; software, B.A.A.; validation, S.M.D., S.M.E. and B.A.A.; formal analysis, S.M.D.; investigation, S.M.E.; resources, B.A.A.; data curation, B.A.A.; writing—original draft preparation, B.A.A.; writing—review and editing, S.M.D.; visualization, B.A.A.; supervision, S.M.D. and S.M.E.; project administration, S.M.D. and S.M.E. All authors have read and agreed to the published version of the manuscript.

Funding

This research received no external funding.

Institutional Review Board Statement

Not applicable.

Informed Consent Statement

Not applicable.

Data Availability Statement

Data are contained within the article.

Conflicts of Interest

The authors declare no conflicts of interest.

References

  1. Xiao, Q.; Ihnaini, B. Stock trend prediction using sentiment analysis. PeerJ Comput. Sci. 2023, 9, e1293. [Google Scholar] [CrossRef] [PubMed]
  2. Khan, W.; Ghazanfar, M.A.; Azam, M.A.; Karami, A.; Alyoubi, K.H.; Alfakeeh, A.S. Stock market prediction using machine learning classifiers and social media, news. J. Ambient. Intell. Humaniz. Comput. 2020, 13, 3433–3456. [Google Scholar] [CrossRef]
  3. Ruan, Y.; Durresi, A.; Alfantoukh, L. Using Twitter trust network for stock market analysis. Knowl.-Based Syst. 2018, 145, 207–218. [Google Scholar] [CrossRef]
  4. Gumus, A.; Sakar, C.O. Stock Market Prediction by Combining Stock Price Information and Sentiment Analysis. Int. J. Adv. Eng. Pure Sci. 2021, 33, 18–27. [Google Scholar] [CrossRef]
  5. Beg, M.O.; Awan, M.N.; Ali, S.S. Algorithmic Machine Learning for Prediction of Stock Prices. In FinTech as a Disruptive Technology for Financial Institutions; IGI Global: Hershey, PA, USA, 2019; pp. 142–169. [Google Scholar]
  6. Chandola, D.; Mehta, A.; Singh, S.; Tikkiwal, V.A.; Agrawal, H. Forecasting Directional Movement of Stock Prices using Deep Learning. Ann. Data Sci. 2022, 10, 1361–1378. [Google Scholar] [CrossRef]
  7. Mankar, T.; Hotchandani, T.; Madhwani, M.; Chidrawar, A.; Lifna, C.S. Stock market prediction based on social sentiments using machine learning. In Proceedings of the International Conference on Smart City and Emerging Technology, Mumbai, India, 5 January 2018; pp. 1–3. [Google Scholar]
  8. Rajendiran, P.; Priyadarsini, P. Survival study on stock market prediction techniques using sentimental analysis. Mater. Today Proc. 2023, 80, 3229–3234. [Google Scholar] [CrossRef]
  9. Colhon, M.; Vlăduţescu, Ș.; Negrea, X. How Objective a Neutral Word Is? A Neutrosophic Approach for the Objectivity Degrees of Neutral Words. Symmetry 2017, 9, 280. [Google Scholar] [CrossRef]
  10. Kandasamya, I.; Vasanthaa, W.; Obbinenib, J.; Smarandache, F. Sentiment analysis of tweets using refined neutrosophic sets. Comput. Ind. 2020, 115, 103180–103190. [Google Scholar] [CrossRef]
  11. AboElHamd, E.; Shamma, H.M.; Saleh, M.; El-Khodary, I. Neutrosophic logic theory and applications. Neutrosophic Sets Syst. 2021, 41, 4. [Google Scholar]
  12. Essameldin, R.; Ismail, A.A.; Darwish, S.M. An Opinion Mining Approach to Handle Perspectivism and Ambiguity: Moving Toward Neutrosophic Logic. IEEE Access 2022, 10, 63314–63328. [Google Scholar] [CrossRef]
  13. Heiden, A.; Parpinelli, R.S. Applying LSTM for stock price prediction with sentiment analysis. In Proceedings of the Fifteenth Brazilian Congress of Computational Intelligence, Online, 26–29 October 2021; pp. 1–8. [Google Scholar]
  14. Xu, Y.; Cohen, S.B. Stock movement prediction from tweets and historical prices. In Proceedings of the Fifty-Sixth Annual Meeting of the Association for Computational Linguistics, Melbourne, Australia, 15–20 July 2018; pp. 1970–1979. [Google Scholar]
  15. Asghar, M.Z.; Rahman, F.; Kundi, F.M.; Ahmad, S. Development of stock market trend prediction system using multiple regression. Comput. Math. Organ. Theory 2019, 25, 271–301. [Google Scholar] [CrossRef]
  16. Kalyani, J.; Bharathi, P.; Jyothi, P. Stock trend prediction using news sentiment analysis. Int. J. Comput. Sci. Inf. Technol. 2016, 8, 67–76. [Google Scholar]
  17. Pagolu, V.S.; Reddy, K.N.; Panda, G.; Majhi, B. Sentiment analysis of twitter data for predicting stock market movements. In Proceedings of the International Conference on Signal Processing, Communication, Power and Embedded System, Paralakhemundi, Odisha, India, 3–5 October 2016; pp. 1345–1350. [Google Scholar]
  18. Xu, Y.; Keselj, V. Stock prediction using deep learning and sentiment analysis. In Proceedings of the IEEE International Conference on Big Data, Los Angeles, CA, USA, 9–12 December 2019; pp. 5573–5580. [Google Scholar]
  19. Maqsood, H.; Mehmood, I.; Maqsood, M.; Yasir, M.; Afzal, S.; Aadil, F.; Selim, M.M.; Muhammad, K. A local and global event sentiment based efficient stock exchange forecasting using deep learning. Int. J. Knowl. Manag. 2020, 50, 432–451. [Google Scholar] [CrossRef]
  20. Gupta, R.; Chen, M. Sentiment analysis for stock price prediction. In Proceedings of the 2020 IEEE Conference on Multimedia Information Processing and Retrieval, Shenzhen, China, 6–8 August 2020; pp. 213–218. [Google Scholar]
  21. Sawhney, R.; Agarwal, S.; Wadhwa, A.; Shah, R. Deep attentive learning for stock movement prediction from social media text and company correlations. In Proceedings of the 2020 Conference on Empirical Methods in Natural Language Processing, Online, 16–20 November 2020; pp. 8415–8426. [Google Scholar]
  22. Ho, T.-T.; Huang, Y. Stock Price Movement Prediction Using Sentiment Analysis and CandleStick Chart Representation. Sensors 2021, 21, 7957. [Google Scholar] [CrossRef] [PubMed]
  23. Fazlija, B.; Harder, P. Using Financial News Sentiment for Stock Price Direction Prediction. Mathematics 2022, 10, 2156. [Google Scholar] [CrossRef]
  24. Cristescu, M.P.; Nerisanu, R.A.; Mara, D.A.; Oprea, S.-V. Using Market News Sentiment Analysis for Stock Market Prediction. Mathematics 2022, 10, 4255. [Google Scholar] [CrossRef]
  25. Srijiranon, K.; Lertratanakham, Y.; Tanantong, T. A Hybrid Framework Using PCA, EMD and LSTM Methods for Stock Market Price Prediction with Sentiment Analysis. Appl. Sci. 2022, 12, 10823. [Google Scholar] [CrossRef]
  26. Koukaras, P.; Nousi, C.; Tjortjis, C. Stock Market Prediction Using Microblogging Sentiment Analysis and Machine Learning. Telecom 2022, 3, 358–378. [Google Scholar] [CrossRef]
  27. Costola, M.; Hinz, O.; Nofer, M.; Pelizzon, L. Machine learning sentiment analysis, COVID-19 news and stock market reactions. Res. Int. Bus. Financ. 2023, 64, 101881. [Google Scholar] [CrossRef]
  28. Awajan, I.; Mohamad, M.; Al-Quran, A. Sentiment analysis technique and neutrosophic set theory for mining and ranking big data from online reviews. IEEE Access 2021, 9, 47338–47353. [Google Scholar] [CrossRef]
  29. Ansaria, A.; Biswasb, R.; Aggarwal, S. Neutrosophic classifier: An extension of fuzzy classifier. Appl. Soft Comput. 2013, 13, 563–573. [Google Scholar] [CrossRef]
  30. Kandasamy, I.; Vasantha, W.B.; Mathur, N.; Bisht, M.; Smarandache, F. Sentiment analysis of the #metoo movement using neutrosophy: Application of single-valued neutrosophic sets. In Optimization Theory Based on Neutrosophic and Plithogenic Sets; Elsevier: Amsterdam, The Netherlands, 2020; pp. 117–135. [Google Scholar] [CrossRef]
  31. Madbouly, M.M.; Darwish, S.M.; Essameldin, R. Modified fuzzy sentiment analysis approach based on user ranking suitable for online social networks. IET Softw. 2020, 14, 300–307. [Google Scholar] [CrossRef]
  32. Essameldin, R.; Ismail, A.A.; Darwish, S.M. Quantifying Opinion Strength: A Neutrosophic Inference System for Smart Sentiment Analysis of Social Media Network. Appl. Sci. 2022, 12, 7697. [Google Scholar] [CrossRef]
  33. Hassan, M.H.; Darwish, S.M.; Elkaffas, S.M. An Efficient Deadlock Handling Model Based on Neutrosophic Logic: Case Study on Real Time Healthcare Database Systems. IEEE Access 2022, 10, 76607–76621. [Google Scholar] [CrossRef]
  34. Vashishtha, S.; Susan, S. Fuzzy rule based unsupervised sentiment analysis from social media posts. Expert Syst. Appl. 2019, 138, 112834. [Google Scholar] [CrossRef]
  35. Abdel-Basset, M.; Gunasekaran, M.; Mohamed, M.; Smarandache, F. A novel method for solving the fully neutrosophic linear programming problems. Neural Comput. Appl. 2019, 31, 1595–1605. [Google Scholar] [CrossRef]
  36. Ko, C.-R.; Chang, H.-T. LSTM-based sentiment analysis for stock price forecast. PeerJ Comput. Sci. 2021, 7, e408. [Google Scholar] [CrossRef]
  37. John, A.; Latha, T. Stock market prediction based on deep hybrid RNN model and sentiment analysis. Automatika 2023, 64, 981–995. [Google Scholar] [CrossRef]
  38. Moghar, A.; Hamiche, M. Stock Market Prediction Using LSTM Recurrent Neural Network. Procedia Comput. Sci. 2020, 170, 1168–1173. [Google Scholar] [CrossRef]
  39. Kim, R.; So, C.H.; Jeong, M.; Lee, S.; Kim, J.; Kang, J. Hats: A hierarchical graph attention network for stock movement prediction. arXiv 2019, arXiv:1908.07999. [Google Scholar]
  40. Feng, F.; Chen, H.; He, X.; Ding, J.; Sun, M.; Chua, T.S. Enhancing stock movement prediction with adversarial training. In Proceedings of the Twenty-Eighth International Joint Conference on Artificial Intelligence, Macao, China, 10–16 August 2019; pp. 5843–5849. [Google Scholar]
Figure 1. The proposed model.
Jtaer 19 00007 g001
Figure 2. Comparison between fuzzy logic and NL: (a) Fuzzy logic membership function (b) NL truth, indeterminacy, and falsity membership functions.
Jtaer 19 00007 g002
Figure 3. NL inference system.
Jtaer 19 00007 g003
Figure 4. NL truth membership functions for the two inputs.
Jtaer 19 00007 g004
Figure 5. NL indeterminate membership functions for the two inputs.
Jtaer 19 00007 g005
Figure 6. NL falsity membership functions for the two inputs.
Jtaer 19 00007 g006
Figure 7. Determining the confidence value.
Jtaer 19 00007 g007
Figure 8. LSTM architecture.
Jtaer 19 00007 g008
Table 1. A sample of NL rules.
RulesPSNSOutput
R1LLNeutral
R2MLPositive
R3LMNegative
R4HLPositive
R5HHNeutral
R6MHNegative
R7MMNeutral
R8HMPositive
R9LHNegative
R10L-ML-MNegative–Neutral
R11M-HM-HPositive–Neutral
R12L-MM-HNegative–Neutral
R13M-HL-MPositive–Neutral
Table 2. Comparison of the model’s performance using sentiment based on NL, and without sentiment analysis.
ModelAccuracyMCC
With sentiment using NL78.48%0.587
Without sentiment73.28%0.461
Table 3. Comparison of the model’s performance using sentiments based on NL, and with sentiments using TextBlob.
ModelAccuracyMCC
With sentiments using NL78.48%0.587
With sentiments using TextBlob75%0.5119
Table 4. Comparison of the model’s performance using LSTM, neural networks, Support Vector Machine, and naïve Bayes.
ModelAccuracyMCC
LSTM prediction model78.48%0.587
NN prediction model72.4%0.449
Support Vector Machine prediction model62.06%0.228
Naïve Bayes prediction model58%0.139
Table 5. Comparison of the performance between different baseline models.
ModelAccuracyMCC
StockNet model 58.2%0.081
Adversarial Attentive LSTM model 57.2%0.148
MAN-SF model.60.8%0.195
Our LSTM model with sentiments using NL.78.48%0.587
Table 6. Comparison of the financial performance between different models.
ModelReturn Sharpe Ratio
StockNet0.9%0.83
MAN-SF1.66%1
Our proposed model4.1%1
Table 7. Comparison of the financial performance between our proposed model and buy-and-hold strategy.
MetricsBuy and HoldOur Proposed Model
Return0.6%4.1%
Sharpe Ratio0.31
Disclaimer/Publisher’s Note: The statements, opinions and data contained in all publications are solely those of the individual author(s) and contributor(s) and not of MDPI and/or the editor(s). MDPI and/or the editor(s) disclaim responsibility for any injury to people or property resulting from any ideas, methods, instructions or products referred to in the content.

