Abstract
OTT (over-the-top) streaming is a subscription-based video service model that delivers video-on-demand content, films, and series directly to end-users over the Internet, bypassing the need for traditional satellite receiver systems. The most popular OTT service providers include Netflix, Hulu, Amazon Prime, and Disney+. During the COVID-19 pandemic, the viewership rates and subscriber numbers for OTT platforms rapidly increased. Like various other products and systems, usability problems can substantially impact user satisfaction, loyalty, and the intention to continue using OTT services. Therefore, this study aimed to conceptualize the usability of OTT platforms and develop an OTT Usability Measurement Scale for the usability evaluation of OTT platforms based on the Apple tvOS Guidelines and the literature. OTT platform usability was conceptualized with nine constructs, including Accessibility and Customization, Account Management, Data Entry and Search, Branding, Privacy, Navigation, Help, Content, and Design, and the concepts were measured with a scale including 48 items. The validity of the developed scale was tested through two separate survey studies conducted with Netflix web application users. The first survey involved 650 participants. At this stage, an exploratory factor analysis was used to evaluate the scale’s measurement properties, and the developed factor structure was confirmed. In the second stage, a survey with 600 participants was conducted, and a confirmatory factor analysis was applied to validate the scale properties. Furthermore, a nomological validation of the developed scale was performed, examining the relationship between the acquired OTT factors and elements such as continued intention to use, satisfaction, and brand loyalty. As a result of the nomological validation, it was observed that the privacy and design factors significantly affected each of the three dependent variables.
1. Introduction
Over-the-top (OTT) platforms are digital service providers that deliver streaming media content, such as movies, TV series, music, and other forms of media, directly to consumers through internet connectivity, thereby bypassing traditional broadcast distribution systems such as terrestrial, satellite, or cable television networks [1,2]. These platforms leverage Internet Protocol (IP) technology to transmit content, functioning similarly to Internet Protocol Television (IPTV) but usually providing services at higher standards [1]. While such platforms generally use ad-based video on demand, subscription-based video on demand (SVOD), transactional video on demand, and hybrid business models [3], some well-known OTT services are Netflix, Hulu, Disney+, and Amazon Prime.
OTT platforms offer numerous benefits, such as convenient access to video content anytime and anywhere, a wide variety of content options, personalized recommendations, flexible viewing hours, multi-device support, and additional advantages through subscription plans. Therefore, OTT platforms are significantly transforming traditional television viewing habits and gaining acceptance as the “new television” in society [4], with OTT services playing a central role in driving changes in video content consumption patterns [5].
The lockdowns caused by COVID-19 have considerably increased the adoption of OTT platforms, resulting in an increase in usage and a rise in subscribers. The global consumer base for OTT services is anticipated to reach approximately 4.22 billion users by 2027, with a penetration rate of 53%. In addition, the revenue generated by OTT platforms is projected to reach EUR 277 billion in 2023 [6]. Improving usability becomes crucial to maintaining customer satisfaction and fostering brand loyalty in these rapidly expanding systems.
Usability is defined as a quality feature evaluating the ease of use of user interfaces and is described with five quality components: learnability, efficiency, memorability, errors, and satisfaction [7]. The ISO defines usability as the “extent to which a system, product, or service can be used by specified users to achieve specified goals with effectiveness, efficiency, and satisfaction in a specified context of use” [8]. Usability is a broader concept than ease of use and user-friendliness; it refers to the effective, efficient, and satisfactory interaction with a system, product, or service, considering diverse user capabilities across all system interactions, including learning, regular, or infrequent use [9]. Furthermore, integrating usability principles at various stages of the design, development, and evaluation process enhances the quality and acceptance of a new system [7,10]. By considering usability factors early on, developers can address potential issues, resulting in a user-friendly and efficient system. This approach minimizes the need for later modifications, leading to effective and user-centric systems that improve the overall user experience, satisfaction, and brand loyalty [11].
In the literature, there is a limited number of studies investigating the usability of video streaming and OTT platforms (e.g., [12,13,14,15,16,17]). On the other hand, there is a more significant number of studies in the literature concerning the evaluation of the usability of TV and similar systems (e.g., [18,19,20,21,22,23,24,25,26,27,28,29,30,31,32,33]). Most existing studies have examined the usability of OTT platforms, video-on-demand (VOD) systems, TV, and similar systems through user testing, field research, and heuristic evaluation. However, a few of these studies have developed usability heuristics and principles for TV systems [19,21,23,25,32,34,35,36]. On the other hand, most of them [19,21,23,34,35] only propose high-level general heuristics or principles for TV systems and give definitions rather than propose a usability checklist for each concept. The remaining ones [25,32,36] propose heuristics and principles with their explanations and checklists. However, the developed principles and heuristics are specific to TV-related services, and not OTT platforms. Our literature review reveals that only the study by Jang and Yi [29] developed a user experience measurement scale designed for smart TVs. To our knowledge, there has not been a usability measurement scale explicitly created for OTT platforms. Therefore, in the current study, we aim to conceptualize usability for OTT platforms and develop a survey instrument to measure and evaluate their usability.
This study is organized as follows: The second section provides a literature review on the usability of OTT platforms, TV, and similar systems. The following section presents the methodology and the findings. The last section discusses managerial implications, limitations, and future research.
2. Literature Review
In the literature, there are several studies investigating the factors affecting the adoption of OTT platforms or streaming services (e.g., [37,38,39,40,41,42,43]). Furthermore, Mulla [3] reviewed the literature to determine the factors influencing the adoption of OTT platforms. The results show that content, price, flexibility, convenience (perceived ease of use), perceived usefulness, perceived enjoyment (hedonic motivation), desire to be freed from any constraint, entertainment value, socialization, culture inclusion, binge-watching, and self-efficacy are the critical factors for OTT adoption.
On the other hand, in the literature, there is a limited number of studies regarding the usability of OTT platforms. These studies are not specifically OTT-focused and generally concentrate on the usability of specific applications that provide video streaming services. Therefore, we focused our literature research on streaming services and specifically included studies related to OTT platforms like Netflix, Hulu, Amazon Prime, and others. Krishnan and Sitaraman [12] conducted an in-depth investigation and found that video streaming quality, especially factors like startup delay, significantly impacts viewer behavior. Hussain et al. [13] identified video streaming and its quality as dominant usability metrics for mobile apps. Hussain et al. [14] assessed YouTube’s usability using video recordings, heatmaps, and questionnaires to evaluate metrics like ease of use and satisfaction. Eliseo et al. [15] provided interface guidelines for OTT platforms like Netflix using Nielsen’s heuristics. Yang et al. [16] assessed the usability of multiple SVOD services, such as Netflix, Amazon Prime, and Hulu, by conducting questionnaires. Kollmorgen et al. [17] highlighted Netflix’s higher UX ratings across several questionnaires, including the UEQ (User Experience Questionnaire), SUS (System Usability Scale), and UMUX (Usability Metric for User Experience). These studies on video streaming and OTT platforms [12,13,14,15,16,17] evaluated the usability of OTT platforms using various usability evaluation methods, including usability tests, heuristic evaluation, and questionnaires. However, none of them attempted to develop a dedicated instrument for evaluating the usability of OTT platforms.
While limited studies in the literature address the usability of OTT platforms, we expanded our literature review to include studies on TV and other systems with similar features. Several studies have conducted user tests on TVs and related systems. For instance, Obrist et al. [20] utilized eye tracking to study usability challenges for users above 50 years of age with interactive TV applications. Bernhaupt et al. [18] employed a combination of field studies, heuristic evaluations, and user testing to uncover usability challenges associated with iTV, a UK-based free television channel. Lim et al. [24] assessed the usability of smart TV interfaces and remotes with diverse age groups. The research by Miesler et al. [26] and Lee and Shin [44] examined user experience and interface comparisons of smart TVs, respectively. Dou et al. [28] and Ouyang and Zhou [27] both focused on usability problems faced by older people in China when using smart TVs. Awale and Murano [30] evaluated the Apple TV interface against Nielsen’s heuristics, while Bures et al. [31] introduced an automated model-based approach for usability testing. Gumussoy et al. [33] conducted a usability test using the concurrent think-aloud method, surveys, eye tracking, expression analysis, and logging techniques, investigating the relationships between usability metrics in TV-related studies.
In the studies that conducted user tests for TV and similar systems [18,20,24,26,27,28,31,33], specific usability problems related to the tested system were identified. However, these studies did not propose any general principles for the design of TV systems. On the other hand, several studies in the literature suggest principles, heuristics (general usability principles), and checklists to analyze and improve the usability of TV-related services [19,21,23,25,29,32,34,35,36]. Kim et al. [19] identified 21 usability principles for personalized electronic program guides for digital TVs, such as controllability, feedback, error, predictability, learnability, memorability, and consistency. Chorianopoulos [34] proposed user interface design principles for interactive TVs, such as viewer as a director, participatory content authoring, diverse content sources, and infotainment. Then, the principles were applied to redesign music TV as an iTV application. Geerts and De Grooff [21] conducted user testing on social TVs, identifying participant issues during testing and converting these issues into sociability guidelines, including personal privacy and group privacy, sharing content flexibly, and minimizing distraction from TV programs. Collazos et al. [35] adapted Nielsen’s ten heuristics to suit the design of an interactive digital television (iDT), incorporating additional heuristics related to navigation, information structure, physical constraints, and considerations for extraordinary users. Solano et al. [23] defined a refined set of usability heuristics proposed by Collazos et al. [35] for iDT applications. Solano et al. [25] proposed a usability checklist for iDT applications using the heuristics proposed by Solano et al. [23]. They validated the checklist’s effectiveness through expert evaluations, enabling a comparative analysis of the number and severity of usability problems against Nielsen’s heuristics. Fernandes et al. [36] introduced graphic and interaction guidelines for iTV systems using Google Material Design and Apple tvOS guides. Kaya et al. [32] proposed 16 usability heuristics and a guideline specific to set-top box and TV systems. The proposed heuristics were validated through user testing, expert judgment, and heuristic evaluation. They determined the most critical heuristics related to catastrophic usability problems to be visibility of system status, pleasurable and respectful interaction with the user, privacy, parental control, and easy access.
Our literature review indicates that the studies [19,21,23,34,35] only proposed high-level general heuristics or principles and explained them through definitions. On the other hand, our current study offers a detailed explanation of concepts related to OTT platforms using open codes. Furthermore, several studies (e.g., [19,21,23,25,32,34,35,36]) have proposed principles, heuristics, guidelines, and checklists for TV systems. However, only Jang and Yi [29] developed a user experience measurement scale specifically for smart TVs. Their research, conducted using a three-stage method encompassing identification, integration, and verification, utilized laboratory and field studies. They developed a scale to measure user experience factors and found a significant relationship between these UX factors, user satisfaction, and usage intention. Although several studies have been conducted on TV and OTT usability, the literature lacks a measurement scale designed specifically for OTT platforms. A summary of the studies is given in the Appendix Table A1. Therefore, this study aims to fill that gap by developing the OTT Usability Measurement Scale (OTT-UMS) to evaluate the usability of OTT platforms. This is the first study to develop a usability measurement scale tailored for OTT platforms.
3. Methodology
In this study, a three-stage methodology, proposed by Lewis et al. [45], was used to conceptualize and develop a survey instrument to evaluate the usability of OTT platforms. We followed this methodology in the current study since it includes a comprehensive and systematic approach to define constructs and develop and validate the developed survey instrument. The detailed flow of the methodology is presented in Figure 1. In the first step, the constructs’ domain related to the usability of OTT platforms is revealed with open and axial coding procedures. In the second step, the initial survey instrument is developed and validated with several steps like pretest, pilot study, and content validity checks. In the last step, the measurement properties of the survey instrument are evaluated through exploratory and confirmatory factor analyses. Furthermore, this methodology was also successfully applied in usability-related research (e.g., [46]).
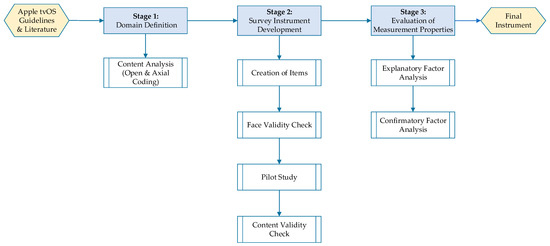
Figure 1.
Stages of survey instrument development methodology.
3.1. Domain Definition
The first stage in developing a construct involves establishing the domain of the idea using various sources like literature reviews, interviews, or case studies [45]. Lewis et al. [45] recommended content analysis as a systematic technique for domain definition, which is used to specify distinct aspects of the construct domain through multiple iterations. In this study, we initially examined Apple tvOS guidelines by using content analysis to conceptualize the usability of OTT platforms. Open and axial coding processes were employed to conduct content analysis.
Open coding is an analytic interpretation process based on the separation, examination, comparison, comprehension, and classification of data that identifies concepts and the properties and dimensions in the data. Events, actions, and interactions are constantly compared according to their similarities and differences, and categorically similar events are grouped into categories and subcategories. Later, axial coding is conducted. The process of relating categories to their subcategories is termed “axial” coding, as it occurs around the axis of a category, linking categories at the level of properties and dimensions; in axial coding, a researcher tries to establish a connection between the concepts and categories revealed as a result of open coding [47,48].
The Apple tvOS Guidelines [49] were used as the primary source for this study. Apple developed this guideline to guide designers who want to build games, OTT applications, and smart home services for Apple TV. The guidelines describe the characteristics that a reasonable application should have in many areas, such as application architecture, visual design, interface elements, and system capabilities. We conducted a line-by-line analysis of the Apple tvOS Guidelines, generating open codes and exploring questions related to usability categories, their potential subcategories, and their definitions. Through axial coding, we organized the content of the guidelines into main categories based on the similarities of the open codes representing subcategories. Subsequently, nine categories were developed: Accessibility and Customization, Privacy, Account Management, Content, Branding, Navigation, Design, Data Entry and Search, and Help. The coding matrix, which includes axial codes, subcategories, and open codes, is presented in Appendix Table A2.
3.1.1. Accessibility and Customization
Designers now have more possibilities to create various interfaces, but this has increased complexity due to factors like fonts, colors, and sizes [50]. On OTT platforms, font selection for subtitles and text size significantly impact readability. Brown et al. [51] found that positioning subtitles at the bottom of the screen according to viewing angles did not receive positive feedback, but using a dark background improved readability. Studies on Chinese characters [52,53] and Latin characters [54,55] emphasized the importance of font size, resolution, and font type in readability.
Regarding OTT platforms, offering various font options and sizes is crucial for readability, particularly for older people [56,57]. Language is another essential aspect, as subtitles in different languages are necessary for non-native content access. Pedersen [58] highlighted the significance of language norms and localization in subtitles, while Kuscu-Ozbudak’s study [59] on Netflix in Türkiye showed that subtitle quality impacts subscription continuation. In conclusion, ensuring readability and customization in both interfaces and subtitles while adapting to users’ language preferences is essential for enhancing the user experience.
3.1.2. Account Management
When users decide to use any platform, systems usually prompt them to register. Users encounter two main issues at this stage. Firstly, users want to know the intended use of their information, so platforms should provide clear information about this. For example, users may be concerned about whether their entered information will be shared with third-party applications [60]. The second issue related to usability is setting up a username and password. Users need help understanding cryptographic structures, so the password structure should be easily understandable, and data entry should be user-friendly [61].
Usability problems, such as account closure and suspension options, may also arise in account management interfaces. Platforms can offer various options for account closure, as some users may want to regain access after closing their accounts. It is crucial to clearly state what happens to the data after an account is deleted [62]. Platforms can provide authentication options, such as PINs and one-time generators [61]. SMS authentication, which sends a message to the user’s phone number, is effective [63]. However, regardless of the authentication method, designers should never display users’ private information on the interface [60].
OTT platforms like TVs are shared devices at home and thus allow users to define protected user profiles to secure personal information [32]. Popular OTT platforms like Netflix, Amazon Prime Video, and Disney+ allow users to create multiple user profiles, including children’s profiles, enhancing the personalized viewing experience. Features such as profile locking add a layer of security, ensuring that each user’s preferences and viewing patterns remain private. Kaya et al. [32] proposed a usability heuristic related to parental control for STB and TV applications. Lad et al. [64] conducted a comparative study on Amazon Prime Video and Netflix. Their findings indicated that Netflix outperformed Amazon Prime Video in areas such as the availability of movie/series trailers and parental control features. In conclusion, “account management” refers to the ease and flexibility with which users can create, modify, and delete their accounts and manage multiple profiles, including those for children.
3.1.3. Branding
Companies need to create brand values to increase sales and strengthen brand awareness. Research shows that users prefer familiar brands despite having a higher perception of quality in other brands [65]. Therefore, companies should work on brand loyalty and awareness without neglecting the quality factor and strive to improve customers’ perception of the brand. Regarding brand awareness, logo design plays a significant role as a crucial element of the brand concept. The brand logo effectively enhances the quality of customer relationships [66]. Gultom et al. [67] found that brand image significantly influences subscription decisions on Netflix. However, more is needed to increase brand awareness than relying solely on logos and slogans. Providing value and customer benefits is also essential for a brand [68]. A study by Hoehle and Venkatesh [11] emphasized the importance of brand color in brand development efforts and suggested that users should not be forced to watch brand advertisements. In conclusion, companies interact with their target audiences through slogans, logos, and offered features. Therefore, OTT platforms should appropriately use their logos, colors, and other brand elements to enhance brand loyalty and awareness.
3.1.4. Data Entry and Search
Data input and search methods on OTT platforms are significant factors that impact user experience. Research indicates that different user groups respond differently to various methods, suggesting that diversifying these methods can enhance user experience. For instance, Smith and Chaparro [69] and Dou et al. [28] found that physical QWERTY keyboards and voice input methods were more effective for younger and older users. Bernard et al. [56] noted that children found speech recognition and handwriting methods more enjoyable.
The importance of text prediction in data input was emphasized by Geleijnse et al. [70], Bernhaupt et al. [18], and Solano et al. [25]. However, when determining data input methods, multiple factors must be considered. Oliveira et al. [71] pointed out that different user groups respond differently to various data input methods, making it challenging to select a one-size-fits-all approach. Barrero et al. [72] emphasized the significance of providing users with the most comfortable method. Consequently, to improve user experience, OTT platforms should offer diverse data input methods, considering different user characteristics and needs.
Users use the search function to quickly and easily access information like movies, TV series, etc. Lamkhede and Das [73] defined the concepts of “Get,” “Find,” and “Discover” on Netflix. “Get” is for users who precisely know what they are looking for, “Find” is for those who do not have a specific preference but know what they are searching for, and “Discover” is for users who are not sure about their preferences but want to explore new content. Accordingly, the search feature should produce results based on the keywords entered and offer personalized content recommendations to the user. Therefore, the success of an OTT platform is not just reliant on user-friendly data input and search mechanisms, but also on how well they personalize content recommendations and improve user experience. For example, the research by Pattanayak and Shukla [74] highlighted that employing an algorithm that provides personalized content recommendations based on user preferences can significantly enhance user experience. In conclusion, to enhance user experience and increase platform success, OTT platforms should provide diverse and user-friendly data input methods and personalize search and recommendation mechanisms based on user preferences.
3.1.5. Design
Design plays a significant role in enhancing user experience on OTT platforms. Design involves integrating various components such as colors, layouts, graphics, icons, images, and animations. Using colors is essential for usability as it directly affects users’ perception and interactions [75,76]. Usability studies have shown that color significantly impacts ease of use, satisfaction, and overall usability (e.g., [19,20,25,27,77]). It should also be noted that the impact of colors on user perception and response may vary based on cultural differences, age, or gender, and appropriate color palettes should be used in the design while taking these factors into account [78,79].
Page layout refers to arranging elements on a web page or application, such as links, buttons, images, menus, texts, etc. Effective performance of these components is crucial to provide users with an excellent aesthetic experience and ease of use across different screen sizes. Designing consistent and aesthetically pleasing layouts while avoiding complex arrangements is essential [80]. Another important aspect of layout design is visual balance. To achieve visual balance in the layout, objects should be distributed evenly along the vertical and horizontal axes [81]. A design approach that heavily uses only a specific portion of the screen and leaves some parts empty is not favored by users [82].
Icons, images, and animations are fundamental components that form an interface and are crucial for effective interaction between users and the system. These components enable users to comprehend system messages and convey their intended actions to the system. Therefore, presenting these components complexly may blur the perception of information and confuse users on where they should focus [79]. Icons play essential roles in effectively conveying messages without the need for text [83]. When used appropriately, animations can provide users with a rich visual experience, but they should be used in suitable ways to avoid distracting users [79]. The quality of images and the emotions they evoke in users are also important. Offering customized images may positively impact user interaction [84,85]. In conclusion, color, layout, and graphics (icons, images, and animations) are critical elements in the design of OTT platforms that directly influence user experience and interactions, determining aesthetics, usability, and accessibility, and ultimately shaping user satisfaction and overall platform success.
3.1.6. Help
Users frequently need help and feedback when using systems. Help and feedback are essential factors in usability evaluation and design [19,23,25,35,86,87]. Help is crucial for users to solve their problems and access necessary information. User-friendly help content and interfaces especially play significant roles in OTT platforms. Feedback helps users understand the results of their actions. Users want to know if their commands are recognized and when the operation will be completed, and they want to receive information about the system status. Designers can enhance the user experience by providing precise and consistent feedback [88,89]. In conclusion, help and feedback are essential elements that facilitate users’ interactions with systems. User-friendly help content, interfaces, and clear feedback are necessary for a successful user experience on OTT platforms.
3.1.7. Navigation
Navigation refers to the path users follow to access the desired content. Good navigation should have fundamental characteristics such as being easy to use and understand [35]. When users interact with a website or TV application, effective usability requires them to move smoothly, easily understand their location, navigate within the system, and cancel actions when needed. Solano et al. [23,25] emphasized the importance of the “Navigation” concept in their usability studies for interactive TV, highlighting the need for users to access desired information easily and receive navigational feedback. Obrist et al. [20] confirmed, using eye tracking technology, that elderly users comprehend navigation more slowly than younger users. Hence, the navigation structure developed by OTT platforms should suit users of different age groups. Another important factor is the use of vertical, horizontal, or mixed navigation structures. Ribeiro et al. [90] found, in their study on IPTV, that users made fewer errors in vertical navigation compared to horizontal navigation. Golja et al. [91] discovered in their study on iTV that users reached their desired content with fewer clicks in horizontal navigation. Navigation is essential for OTT platforms, enabling users to access desired content easily and effectively. A good navigation system assists users in smoothly navigating through the system, understanding their location, and seamlessly performing desired actions.
3.1.8. Privacy
The widespread adoption of OTT platforms in recent years has led many people to use these platforms frequently. Profit-driven OTT platforms have started analyzing user-generated data to increase their sales. As a result, there is a need to classify the data that will be used to ensure the privacy of users’ personal information. Data such as names, addresses, dates of birth, film preferences, and IP addresses can be directly or indirectly associated with users [92]. Therefore, it is concluded that the generated data are personal, and OTT platforms cannot use them as they wish; furthermore, sharing data with third parties requires permission. Additionally, the preference for OTT platforms for cloud environments instead of data centers [93] is believed to bring new privacy-related issues.
Geerts and De Grooff [21] attempted to establish intuitive rules for social TV and emphasized the importance of personal and group privacy in the rules they defined. Mohajeri Moghaddam et al. [94] conducted a study on Amazon Fire TV and Roku TV. They discovered a security vulnerability in the Roku TV application that exposed users’ locations and watched channels without permission. This indicates that inferences about user preferences are made without their consent. Shim and Yeon [95] addressed the “Privacy Paradox” concept and conducted a survey with 618 Netflix users in South Korea. The study revealed that when users believed they would benefit from Netflix using their personal data, their privacy concerns became less significant. Although OTT platforms’ analysis of user data to enhance user experiences may not be seen as a problem, it is essential to ensure the storage and security of data that can be directly linked to users.
3.1.9. Content
One of the most appealing features of OTT platforms compared to traditional television is the content they offer to users. Traditional television operates on a fixed programming schedule, requiring viewers to passively consume content at specific periods determined by the television station, limiting users’ ability to access their desired content at any time [96]. However, OTT platforms offer users a wide range of content options, offering them greater freedom and flexibility. In a study comparing Netflix with its competitors, participants emphasized that Netflix’s most substantial aspect is its content [97]. Similarly, another study conducted in Türkiye identified content as the most influential factor for subscribing to an OTT platform [59]. Furthermore, several studies, such as those by Kim and Lee [96] and Shin and Park [5], have shown that content significantly impacts the selection of OTT services and contributes to user satisfaction. Malewar and Bajaj [39] demonstrated that content diversity is a significant factor in adopting OTT platforms, affecting users’ behavioral intentions and actual usage. In addition to content diversity, the continuous delivery of new content is highlighted as an essential factor. Additionally, OTT platforms recommend content to users based on their viewing history and preferences [25]. In conclusion, the primary reason why users prefer OTT platforms is access to high-quality and diverse content. In this context, within the scope of this study, the term “content category” refers to an OTT platform that provides users with easy access to content and delivers an enjoyable, uninterrupted viewing experience.
Based on the content analysis and literature review, Table 1 provides a summary of construct definitions.

Table 1.
Construct definitions.
3.2. Survey Instrument Construction
In the second stage of the methodology, a survey instrument was developed and refined over several iterations [45]. Development of the OTT measurement usability scale from categorical structures consists of four steps: (1) development of items, (2) pre-test, (3) pilot study, and (4) content validity check.
Initially, every statement within the domain was transformed into an item for the instrument. A list of open-coded items (Appendix Table A2) was analyzed to develop the initial item pool, and 80 items were created. An initial instrument was created using these items. Then, a pre-test was conducted to get feedback from experts in human-computer interaction to check the initial instrument [45]. Experts, including one assistant professor, one associate professor, and two research assistants, were asked to review the initial instrument in terms of its design, content, and clarity. Based on their feedback, necessary modifications were made. Twenty-four items unrelated to OTT platforms or specific to television applications were eliminated, and several items were modified to increase their clarity. As a result, a refined list of 56 items was obtained after the pre-test.
In the following step, a pilot study was conducted using a small sample group of real users to test the efficacy of the OTT usability measurement scale. Lewis et al. [45] emphasized the significance of choosing pilot study participants from the target audience. Thus, this research was conducted with 26 Netflix users. Table 2 displays their demographic details. Participants were asked to report any challenges they experienced during the survey and to identify and propose improvements for any missing, unclear, or complex items in the scale [45]. After analyzing the feedback, four items were discarded, and ten were rephrased for clarity. As a result, the scale was refined to 52 items.
Table 2.
Demographic information of the pilot test.
Content validity is a quantitative procedure that assesses how well an individual criterion or the entire scale represents its intended domain [45]. Anderson and Gerbing’s [98] methodology was used for content analysis. The evaluators for content validity should be representative of the primary study sample and the population of interest rather than just experts. Although there is no universally accepted number for sample size, suggestions range from 12 to 30 participants [98]. This study’s content validity was conducted with 30 users in line with these recommendations.
A matrix was used for the content validity check, with categorical structures in columns and criteria in rows. Participants selected the most suitable criterion–categorical structure combinations in this matrix. Two indices were calculated from this matrix: PSA and CSV. The PSA index is the ratio of participants assigning a criterion to the related categorical structure to the total number of participants, ranging from 0 to 1. A high value indicates that the criterion effectively expresses the definition of the categorical structure. The CSV index is calculated by subtracting the highest number of times a criterion is assigned to another categorical structure from the number of participants assigning the criterion to the related structure, then dividing that value by the total number of participants. This index ranges between −1 and +1, with positive values indicating better alignment with the related categorical structure [98]. The threshold for these indices can vary. A study with four categorical structures was set at 0.30 since the expected ratio for random assignment was 0.25 [99]. High content validity ratios aligned with the determined categorical structures, and experts carefully reviewed and rearranged items falling below the threshold for better clarity [11]. Since there are nine categories in this study, the probability of random assignment is 0.111. A value higher than this, specifically 0.25, was taken as the threshold. Items HLP6, CON8, and CON9, which had values below the threshold, were removed. Meanwhile, NVG3, NVG5, NVG6, HLP1, CON2, CON3, CON4, and DES3 were revised for clarity. The results are presented in Table 3.
Table 3.
PSA and CSV scores of the items.
3.3. Evaluation of Measurement Properties
We initially used exploratory factor analysis (EFA) to evaluate the scale’s measurement properties to determine the factor structure. Then, we applied confirmatory factor analysis (CFA) to validate the scale properties. During the confirmatory phase, we assessed if the theoretical structures could accurately predict the related dependent variables, ensuring the nomological validity of the scale. For both the EFA and CFA, two separate samples were employed. All criteria were measured using a 7-point Likert scale, ranging from 1 (strongly disagree) to 7 (strongly agree). Two survey studies were conducted among Netflix web application users to measure the usability of OTT platforms. We selected the Netflix platform to validate our proposed instrument due to its global prominence as an OTT platform. As of the second quarter of 2023, Netflix had approximately 238.39 million subscribers worldwide [102]. Furthermore, its annual revenue has consistently risen, reaching a record high of USD 31.6 billion in 2022 [103]. Despite its relatively recent introduction to Türkiye in 2016, Netflix has rapidly emerged as one of the country’s leading OTT platforms, gaining 3.5 million subscribers by 2022 [104].
3.3.1. Exploratory Factor Analysis
The first survey was conducted with 650 individuals who use the Netflix web application in Türkiye. An extra question, “Please answer this question as “agree” (6),” was added to the survey to filter non-attentive survey respondents. Fifty-five respondents who answered the control question incorrectly and forty-three respondents who provided the same answer to all questions were excluded from the sample. An EFA was performed using the survey results of the remaining 552 individuals. The demographics of the participants are provided in Table 4.
Table 4.
Demographics (EFA).
In our survey, there are 46 newly developed items, including 3 items related to the “Privacy” category that were adopted from Cheung and Lee [100] and Flavián and Guinalíu [101]. The recommended item-to-response ratio for EFA should be between 1:3 and 1:8 [105]. With 46 newly developed items, at least 368 responses would be sufficient. In total, 552 responses were collected for the study, which meets this requirement. IBM SPSS Statistics 25 software was used for EFA.
Before extracting the factors, the suitability of the data for factor analysis was assessed using the Kaiser–Meyer–Olkin (KMO) test and Bartlett’s Test of Sphericity. The KMO index was found to be 0.963, surpassing the critical value of 0.6 [106]. Additionally, Bartlett’s Test of Sphericity yielded a significant result (p < 0.001), indicating the validity of the factor analysis [105].
Next, the factor structure was obtained using the principal component analysis (PCA) method with variable rotation. The results revealed nine factors that accounted for a total variance of 74.46%. Upon inspecting the factor loadings, it was observed that the factor loading of item DES9 (0.463) was below 0.5. Consequently, DES9 was removed from the scale. The remaining items had factor loadings above the threshold of 0.5 [107].
After removing DES9, the total explained variance increased to 75.12%. In Figure 2, the scree plot suggests that retaining 4–6 factors would be appropriate; however, based on eigenvalues, there are 9 factors with values above 1. Table 5 presents the means, standard deviations, final factor loadings, variance explained, and Cronbach’s alpha values for each factor. All factor loadings exceeded the acceptable value of 0.6 [107]. Additionally, the Cronbach’s alpha values for each construct were above 0.7, indicating an adequate level of reliability. The final version of the OTT usability measurement scale obtained through EFA is provided in Appendix Table A3.
Figure 2.
EFA scree plot.
Table 5.
Exploratory study: descriptive statistics, factor loadings, explained variance, and Cronbach’s alpha values.
3.3.2. Confirmatory Factor Analysis (CFA)
In the confirmatory assessment of the OTT usability measurement scale’s final version derived from the EFA, we ensured the scale’s nomological validity, as Lewis et al. [45] recommended. Nomological validity considers the extent to which the relationship of a measured concept with other concepts aligns with previous research findings [108]. Based on a literature review, questions regarding factors like continued intention to use, brand loyalty, and satisfaction, which are inherently linked to usability, were identified.
This approach was employed in a second survey with Netflix web application users in Türkiye, where 600 individuals participated. However, twenty respondents were excluded; thirteen provided the same responses to all questions, while seven answered the control question incorrectly, resulting in 580 valid responses for the CFA. Participant demographics are illustrated in Table 6. IBM SPSS Amos software was utilized for the CFA.
Table 6.
Demographics (CFA).
The results of the CFA showed that the model fit the data well. Table 7 presents the untrimmed and modified models’ fit statistics. The selected fit criteria for CFA included the Comparative Fit Index (CFI), the Tucker–Lewis Index (TLI), the Goodness of Fit Index (GFI), the Adjusted Goodness of Fit Index (AGFI), the Normed Fit Index (NFI), the ratio of Chi-squared to Degrees of Freedom (CMIN/DF), and the Root Mean Square Error of Approximation (RMSEA). As the results show, all fit indicators meet the recommended cutoff values [109,110,111,112,113], indicating a good fit between the model and the data. Moreover, compared to the original model, the modified model demonstrated better fit indicators, especially regarding the RMSEA, CFI, NFI, GFI, TLI, and AGFI.
Table 7.
Confirmatory study: model fit indices.
CFA was used to assess the convergent and discriminant validities of the constructs. When two or more items measure the same concept, it is called convergent validity [114]. The convergent validity of the measurement items was evaluated by examining the t-values, factor loadings, composite reliability, and average extracted variance (AVE) values (Table 8).
Table 8.
Confirmatory study: descriptive statistics, factor loadings, t-statistics, AVE, CR, and Cronbach’s alpha values.
According to the results, at a 95% confidence level, all items’ t-values are statistically different from the critical value of 1.96 [115]. The factor loadings for each item exceed the recommended value of 0.70 [105]. Additionally, all AVE values are higher than the suggested threshold of 0.50 [116]. The composite reliability values, which assess the internal consistency of the measurement model [117], are above the threshold of 0.60 [118]. Moreover, each construct’s Cronbach’s alpha score is above 0.60. As indicated in Table 8, all of these statistics demonstrate that the convergent validity condition is satisfied.
Anderson and Gerbing’s [119] criteria were used to evaluate the discriminant validity of the measurements. χ2 difference tests were applied for each pair of constructs, and the results are shown in Table 9. The correlation parameter was set to 1 for each pair of constructs, and the tests were conducted for all structure pairs. When a difference in χ2 is significant, it is assumed that the structures are statistically different. All χ2 differences were greater than the critical value of 3.84 at a 95% confidence level. This result indicates that the models correlated to “1” showed a poor fit for all structure pairs (all χ2 differences > 3.841, df = 1, and p = 0.05). Therefore, discriminant validity was achieved, as Bagozzi and Philips [114] suggested.
Table 9.
Discriminant validity.
3.3.3. Nomological Validity
After examining the measurement model, a structural model was evaluated to determine the nomological validity of the OTT usability measurement scale. Three dependent variables were included in the structural model: satisfaction, continued intention to use, and brand loyalty. Satisfaction with a system refers to users’ discrepancy between their expectations of the system and the system’s actual performance [120]. Therefore, it is related to the consumer’s feeling that the system fulfills some of the needs of the customer and leads to pleasure. When satisfaction is aggregated, this feeling may lead to brand loyalty, but not necessarily [121]. Therefore, brand loyalty is a broader concept and especially important in marketing research [11,121]. It is defined as “a deeply held commitment to rebuy a preferred product/service consistently in the future, thereby causing repetitive same-brand purchasing”. In addition, in the IS research, intention to use a system is a commonly used variable to measure the likelihood of a user to use such systems. On the other hand, continued intention to use does not only focus on initial or first-time usages, but also considers a user’s decision to continue using in the long run [120]. Therefore, factors such as satisfaction, brand loyalty, and continued intention to use become important for firms to retain customers in which acquiring new customer costs more than retaining existing ones [122].
Several studies in the literature also revealed the significant effect of usability on continued intention to use, brand loyalty, and satisfaction [46,123,124,125], as hypothesized in the nomological validation of the current study. Lee et al. [123] examined the effect of a mobile phone’s key design factors (simplicity and interactivity) on satisfaction and brand trust via perceived usability. The results show that simplicity and interactivity have significant positive effects on perceived usability, which, in turn, affect both satisfaction and the brand trust. Hoehle et al. [46] defined mobile application usability and then examined the effects of these factors on both brand loyalty and continued intention to use for mobile social media application users. The results revealed that continued intention to use is explained by the usability factors of aesthetic graphics, entry points, fingertip-size controls, gestalt, subtle animation, and transition. In contrast, brand loyalty is explained with control obviousness, fingertip-size controls, gestalt, hierarchy, subtle animation, and transition. Another study conducted by Ramadan and Aita [124] revealed the impact of user experience with a mobile payment application on perceived satisfaction, which, in turn, affects brand loyalty and intention to use. Another study [125] also revealed the significant effect of brand experience on brand loyalty to a website. In that study, brand experience is defined by several factors, and it was found that usability is one of the critical factors in explaining the brand loyalty of a website. In this context, in the current study, it is expected that the usability factors of OTT platforms may affect continued intention to use, brand loyalty, and satisfaction, as confirmed in the literature. We constructed the following hypotheses:
H1 (a–i):
Usability factors of OTT platforms (Account Management (H1a), Privacy (H1b), Navigation (H1c), Help (H1d), Content (H1e), Branding (H1f), Design (H1g), Accessibility and Customization (H1h), and Data Entry and Search (H1i)) have positive effects on satisfaction.
H2 (a–i):
Usability factors of OTT platforms (Account Management (H2a), Privacy (H2b), Navigation (H2c), Help (H2d), Content (H2e), Branding (H2f), Design (H2g), Accessibility and Customization (H2h), and Data Entry and Search (H2i)) have positive effects on continued intention to use.
H3 (a–i):
Usability factors of OTT platforms (Account Management (H3a), Privacy (H3b), Navigation (H3c), Help (H3d), Content (H3e), Branding (H3f), Design (H3g), Accessibility and Customization (H3h), and Data Entry and Search (H3i)) have positive effects on brand loyalty.
The items related to brand loyalty, satisfaction, and continued intention to use were taken from the literature and then adopted to the OTT context. The additional questions related to these dependent variables are shown in Table 10.
Table 10.
Dependent variables used for nomological validation.
Nine usability factors have successfully explained 51.9% of brand loyalty, 56.4% of satisfaction, and 54.9% of the intention to continue using the product or service (Table 11). The factors that influence satisfaction are navigation (21.8%), design (17.4%), privacy (16.1%), content (16%), and data entry and search (13.2%). The influential factors of the continued intention to use the product or service are design (26%), data entry and search (19%), privacy (14.3%), and content (12.6%). Furthermore, brand loyalty is statistically explained by three variables: privacy (32.5%), content (27.6%), and design (17.8%). Furthermore, the results show that the demographic factors of gender and age do not affect satisfaction, continued intention to use, or brand loyalty.
Table 11.
R-squared value of the outcome variables and standardized regression weights of each factor.
4. Discussion and Conclusions
This study aims to conceptualize the usability of OTT platforms and propose a survey instrument to evaluate the usability of OTT platforms based on the Apple tvOS Guidelines and the literature, employing a methodology that combines three stages and six phases adopted from Lewis et al. [45]. First, the usability of OTT platforms was defined by the concepts of accessibility and customization, account management, branding, data input and search, design, help, navigation, privacy, and content. Then, a survey instrument specifically for measuring the usability concepts was developed. To evaluate the characteristics of the OTT usability measurement scale, two survey studies were conducted with 650 and 600 Netflix web application users, respectively, and the scale’s validity was tested using EFA, CFA, and nomological validation techniques.
In the literature, there are several studies on the usability of OTT platforms and TV interfaces: YouTube [14,15], Netflix [15,16,17], Apple TV [30], interactive digital TV (e.g., [23,25,34,35,36,130]), social TV [21], set-top box (e.g., [32,33]), and smart TV (e.g., [22,24,26,27,28,29,31]). These studies used various usability evaluation methods (surveys, usability tests, eye tracking, think-aloud method, etc.). However, to our knowledge, no study has developed a scale to measure the usability of OTT platforms. Therefore, this study is the first one involving the development of a comprehensive assessment tool to evaluate the usability of OTT platforms. Using the developed OTT scale, usability experts and OTT platform designers assess the usability of OTT systems. Furthermore, a large-scale survey may be conducted with users to gather customer feedback about the system.
The usability of OTT platforms is conceptualized with nine factors specific to OTT platforms, namely accessibility and customization, account management, branding, data input and search, design, help, navigation, privacy, and content. In the literature, there are various studies that highlight the significance of these factors in evaluating the usability of OTT web platforms. The accessibility and customization factor is crucial in usability evaluation, as it impacts the readability of texts and subtitles on OTT platforms. Studies have highlighted the importance of subtitle position [51], readability at different screen sizes [52], font comparison [54,55], and age differences [56,57]. The Google Material Design guide [131] and Microsoft [132] also mention “typography” in text design, and the Web Content Accessibility Guidelines 2.1 [133] suggest text design as a critical factor. Account management and user features are crucial for usability, ensuring that users can easily log in and open new accounts. Concerns about private information, password entry, and authentication options [60,61,62] are addressed, requiring designers to find simple solutions without complexity.
Branding is also essential for usability because it contributes to a consistent user experience and develops trust and familiarity with the product or service. The colors used in the logo and interface layers significantly impact brand perception. For example, Netflix utilizes red in its logo and dominates its interface layers with the same color, while Amazon Prime Video uses blue harmoniously throughout its design. The importance of brand concept is supported by various studies in the literature, including works by Phillips [134], Gultom et al. [67], Govers [68], and Japutra et al. [66]. Data entry and search involve users typing in fields using their keyboards to search for content. Researchers have compared various data entry methods and evaluated their effects on young and old users [28,69,135]. Furthermore, the fact that Microsoft [136] mentions text input and Google [131] includes the concept of search highlights the significance of this factor.
Design and layout are crucial in usability, examining colors, layout design, and graphic elements. Extensive studies have explored the impact of colors on navigation and accessibility [77,130]. Layout prevents complexity [80] and ensures compatibility across different screen sizes [137]. Microsoft [132] and Google [131] have suggested improvements in color and motion, making design and layout crucial considerations for designers. The help factor emphasizes user access to instructions and information and supportive feedback from the system. Research has shown that FAQs [86], help and documentation heuristics [25,35,138], and feedback types [88] are essential components. Microsoft [136] and Google [131] suggest system status and notification concepts related to this factor. The navigation factor refers to the user’s actions on the interface, such as moving between menus or performing activities. The objective is to achieve a natural and familiar navigation experience that does not overwhelm the user interface or distract attention from the content [131] Numerous studies have analyzed navigation concepts in terms of usability. For example, Solano et al. [25] developed a navigation heuristic for interactive digital TV; Obrist et al. [20] investigated the differences between older and younger people in navigation; and Ribeiro et al. [90] and Golja et al. [91] compared vertical/horizontal navigation designs. Google [131] highlights the value of navigation in terms of design.
There are very few studies in the literature that assess the privacy factor in usability evaluation. Geerts and De Grooff [21] identified privacy heuristics, while Shim and Yeon [95] discussed the privacy paradox, where users may compromise their privacy for perceived benefits. OTT platforms manage vast amounts of confidential information, such as user preferences, viewing habits, location, and payment details, which can raise concerns about privacy and data protection. Users may be apprehensive about sharing their personal information, leading to the privacy paradox. To address this issue, OTT platforms must balance providing personalized experiences and respecting users’ privacy preferences. Prioritizing privacy in data management builds trust, ensures compliance with regulations, mitigates data breaches, and safeguards the platform’s reputation.
Content is a crucial aspect of OTT platforms, as it forms the foundation of the platform experience. Research on the content concept has often explored aspects like the intention to subscribe again and the significance of original content [39,59]. High-quality content attracts and engages users. A diverse and engaging content library increases user satisfaction and loyalty, increasing user retention. Seamless content delivery, smooth playback, and minimal buffering are crucial for providing users with a positive viewing experience. Users who can easily access and consume content without disruptions are more likely to enjoy the platform and return for future content consumption. Personalized content recommendations based on user preferences and viewing habits enhance user satisfaction. OTT platforms can establish themselves as key players in the competitive streaming market by offering compelling content, including original and exclusive productions, and ensuring efficient content delivery.
4.1. Implications and Theoretical Contributions
This study’s most important managerial contribution is establishing a categorical framework to evaluate the usability of OTT web interfaces and the development of an instrument tailored to usability experts, software designers, and evaluators. An analysis of the nomological evaluation results revealed compelling findings. Primarily, the intention to continue usage, satisfaction, and brand loyalty are explained by 54.9%, 56.4%, and 51.9%, respectively, thereby validating the efficacy of the nine-category structure. The fact that the “privacy,” “design,” and “content” categories have significant relationships with all three independent variables is essential in guiding designers. Moreover, the “navigation” and “data entry & search” categories significantly influence user satisfaction and the continued intention to use. Thus, designers can mitigate potential usability issues by focusing on these categories.
The open codes and the survey instrument, including nine main categories and 48 associated items, will benefit OTT platform designers and usability experts. This detailed structure provides a comprehensive framework for evaluating and improving the user experience on OTT platforms. For designers, the open codes and the items of the scale serve as guides for creating user-friendly interfaces. They offer specific insights into what aspects of an interface are essential for user satisfaction, such as privacy settings, content search functionality, and content delivery. This allows for designers to proactively address these factors during the development process, enhancing the overall user experience and leading to increased user retention and brand loyalty. For usability experts, the open codes and the OTT usability measurement scale’s items provide a thorough and systematic method for evaluating the usability of OTT platforms. Using this scale as a checklist, usability experts can identify the strengths and weaknesses in an interface and provide specific, actionable feedback to designers for improvements.
Furthermore, this study provides detailed instructions on the steps to be followed in developing an instrument [45], making it a valuable guide for future researchers planning to assess usability in different domains. Consequently, this study can be utilized to evaluate an existing OTT web interface and guide designers during the interface development phase via its categorical structures.
4.2. Limitations and Suggestions for Future Research
While this study provides valuable insights into the usability evaluation of OTT platforms, several limitations may impact the interpretation of the findings. Even though the nomological evaluation yielded promising results (with the continued intention to use, satisfaction, and brand loyalty at 54.9%, 56.4%, and 51.9%, respectively), it is evident that there may be other categories relevant for assessing usability. Therefore, future studies in this field should consider exploring additional categories.
Furthermore, the fact that this study was conducted with Netflix users in Türkiye may raise questions about the global applicability of the developed instrument. Addressing these considerations in subsequent research with users of diverse demographic backgrounds from different countries and cultures on various OTT platforms could lead to a more comprehensive and universally applicable understanding of OTT platform usability. Furthermore, a comparative analysis of the proposed instrument with the existing instruments can provide valuable insights regarding its relative advantages and limitations. Future research should consider conducting such comparative analyses to further validate and refine the instrument for OTT platform usability studies.
Author Contributions
Conceptualization, A.P., M.C.C., and C.A.G.; methodology, A.P., M.C.C., and C.A.G.; software, A.P., M.C.C., and C.A.G.; validation, A.P., M.C.C., and C.A.G.; formal analysis, A.P., M.C.C., and C.A.G.; investigation, A.P., M.C.C., and C.A.G.; resources, A.P., M.C.C., and C.A.G.; data curation, A.P., M.C.C., and C.A.G.; writing—original draft preparation, A.P., M.C.C., and C.A.G.; writing—review and editing, A.P. and C.A.G.; visualization, A.P., M.C.C., and C.A.G.; supervision, C.A.G.; project administration, C.A.G.; funding acquisition, C.A.G. All authors have read and agreed to the published version of the manuscript.
Funding
This research was funded by Istanbul Technical University, Scientific Research Projects Department grant number MGA-2022-43270.
Institutional Review Board Statement
The study was conducted in accordance with the Declaration of Helsinki, and approved by the Social and Human Sciences Research Ethics Committee of Istanbul Technical University (protocol code 294 and date of approval 29 November 2022).
Informed Consent Statement
Informed consent was obtained from all subjects involved in the study.
Data Availability Statement
The data is not available due to ethical restrictions.
Conflicts of Interest
The authors declare no conflict of interest.
Appendix A
Table A1.
Literature review.
Table A1.
Literature review.
| Study | Platform | Research Methodology | Usability Attributes/Metrics |
|---|---|---|---|
| Bernhaupt et al. [18] | Interactive Television (iTV) | Survey, laboratory study, field study | Navigation/the task completion rate, communication interactivity index |
| Kim et al. [19] | Digital TV | Prototype development, literature review, expert assessment, factor analysis, survey, user test | Responsiveness, predictability, prevention, user control, error indication, feedback, controllability, generalizability, icon, learnability, visibility, color, text, observability/task completion time, ratio of task completion time and error-free time, number of commands, frequency of errors, help frequency |
| Obrist et al. [20] | iTV | eye-tracking method, think-aloud method, Standard Usability Score (SUS) questionnaire | The difficulty of task completion, the number of errors, gaze plot (road maps) |
| Piccolo et al. [130] | Interactive Digital Television (IDTV) | Analyzing the current guidelines and recommendations | Content must be perceivable, interface components in the content must be operable, content and controls must be understandable, and content should be robust enough to work with current and future user agents |
| Chorianopoulos [34] | iTV | Developing new design principles and applying the principles to music TV with a case study | Viewer as a director, participatory content authoring, diverse content sources, infotainment, social viewing, relaxed navigation, multiple levels of attention, and TV grammar and aesthetics |
| Collazos et al. [35] | Interactive Television (iTV) | Developing new heuristics for iTV applications’ usability | Nielsen’s ten heuristics, navigation, structure of information, physical constraints, extraordinary users |
| Geerts and De Grooff [21] | Social TV | User test, questionnaires and interviews, open-axial coding | Offer different channels and levels for communicating freely, use awareness tools for communicating availability, allow for both synchronous and asynchronous use, exploit viewing behavior for informing and engaging other viewers, support remote as well as collocated interaction, give the user appropriate control over actions and system settings, minimize distraction from the television program, notify the user of incoming events and situation changes, guarantee both personal privacy and group privacy, adapt to appropriate television program genres, let users share content flexibly, and encourage shared activities |
| Silva and Nunes [22] | TV | Usability test, guideline development | User drive and control, test settings and preparation, care, communication, and listening |
| Solano et al. [23] | Interactive Digital Television (IDTV) | Developing new heuristics using a 6-stage methodology | Match between the system and the real world, simplicity, consistency and standards, feedback, physical constraints, extraordinary users, structure of information, navigation, recognition rather than recall, flexibility and efficiency of use, user control and freedom, error prevention, recovering from errors, help, and documentation |
| Krishnan and Sitaraman [12] | Streaming video | Quasi-experimental design, large-scale data analysis | Failures, startup delay, average bitrate, abandonment rate, normalized rebuffer delay, playtime, return rate |
| Lim et al. [24] | Smart TV | User test: eye tracking and cursor recording methods, interviews, and questionnaires | Gaze duration, task completion time, performance time, error rate |
| Solano et al. [25] | Interactive Digital Television (IDTV) | Testing new iDT heuristics developed by Solano et al. [23] | Match between the system and the real world, simplicity, consistency and standards, feedback, physical constraints, extraordinary users, structure of information, navigation, recognition rather than recall, flexibility and efficiency of use, user control and freedom, error prevention, recovering from errors, help, and documentation |
| Lee and Shin [44] | Smart TV | Emotion recognition, gesture recognition, satisfaction | Facial expressions of the participants |
| Miesler et al. [26] | VOD app for smart TV | Complaint analysis, customer survey, log-file analysis, usability test | Average time on site/app; average page views; clickthrough rate; jumps; site exits per process; percentage of high-, medium-, and low-frequency visitors; conversion rate (registration); conversion rate (purchase); consumption rate (average order value) |
| Hussain et al. [13] | Mobile video streaming apps | Literature review | Video streaming quality |
| Eliseo et al. [15] | Video websites (Netflix, VideoBrasil Platform, Video@RNP, Vimeo, and YouTube) | Heuristic evaluation | Nielsen’s ten heuristics |
| Hussain et al. [14] | YouTube | Usability test with video recordings, mouse and keyboard heatmaps, questionnaires | Ease of use, usefulness, learnability, satisfaction, task time |
| Fernandes et al. [36] | Interactive television (iTV) | Creating new principles based on Google Material Design and Apple tvOS guidelines, mockups, prototype development, and testing | Layout and grid, images and visual textures, navigation/satisfaction, motivation, control, pragmatic quality, hedonic quality of stimulation, hedonic quality of identification, attractiveness |
| Yang et al. [16] | SVOD services in Japan (Netflix, Amazon Prime, etc.) | Card sorting, questionnaires | Ease of use, ease of searching for content, content indication, genre/categorization |
| Dou et al. [28] | Smart TV | Physiological measurement method, video recording, eye-tracking method, interviews, user test | Search task time, skin conductance (low-frequency and high-frequency) |
| Jang and Yi [29] | Smart TV | Laboratory and field study, instrument development | Ease of adaptation, playfulness, perceived aesthetics, relative salience, appearance appropriateness, controllability of the remote controller, cognitive easiness, perceived responsiveness, user satisfaction, connectivity, usage intention, perceived security, content diversity, social relatedness, customization flexibility, perceived sound quality, perceived helpfulness, stability, real-life applicability, perceived quality of 3D viewing, perceived picture quality |
| Ouyang and Zhou [27] | Smart TV | Pilot study, think-aloud method, PSSUQ (Post Study System Usability Questionnaire), user test | The task effectiveness, completion time, the number of keystrokes metrics |
| Awale and Murano [30] | Apple TV | Nielsen’s heuristics and the seven universal design principles | Nielsen’s heuristics and the seven universal design principles |
| Bures et al. [31] | Smart TV | Automatic model-based approach, user testing | Path steps, average time needed to execute the scenario |
| Kaya et al. [32] | Smart TV | Five-step formal methodology to develop new heuristic | Nielsen’s ten heuristics, pleasurable and respectful interaction with the user, privacy, parental control, easy access |
| Gumussoy et al. [33] | Set-top box and TV | Simultaneous thinking aloud technique, surveys, eye tracking, expression analysis, logging | Completion time, success rate, task difficulty, fixation duration, task completion time, fixation count, saccade count, scanpath length, keystroke count, saccade duration, blink count, negative emotions count, average fixation duration, backspace count, PSSUQ |
| Kollmorgen et al. [17] | Netflix, Microsoft PowerPoint, Zoom, BBB | Questionnaires: UEQ, SUS, UMUX | User experience (UX) ratings |
Table A2.
Coding matrix: axial codes, subcategories, and open codes.
Table A2.
Coding matrix: axial codes, subcategories, and open codes.
| Axial Codes | Subcategory | Open Codes |
|---|---|---|
| Account management | Accounts | The system allows users to create/delete an account easily. |
| The system offers different sign-up options like sign in with Apple or Google. | ||
| The system lets user use another device to sign up or authenticate. | ||
| The system automatically verifies the user’s identity when signing into the OTT platform. | ||
| The system briefly explains the benefits of creating an account on the sign-up screen. | ||
| The system allows user to explore contents without sign-in. | ||
| Profiles | The system allows users to create multiple profiles. | |
| The system shows who is logged in clearly. | ||
| The system allows user to switch between profiles easily. | ||
| Parental Control | The system should allow parental controls. | |
| The system allows users to set up a kids profile with general restrictions based on specific maturity ratings. | ||
| The system allows users to lock their profiles with a PIN to prevent kids or others from accessing it. | ||
| Privacy | Privacy | The system respects the user’s rights when obtaining personal information. |
| Data Security | The OTT platform abides by personal data protection laws and only collects user’s personal data necessary for its activity. | |
| Navigation | Easy Navigation | The system should be natural and intuitive to ensure that people easily know what to do and where they are at all times. |
| People navigate through the system easily. | ||
| The system should offer natural and familiar navigation to make people access content easily and quickly. | ||
| The information structure of the system should require the fewest screens. | ||
| While performing actions, people should use a few gestures. | ||
| User Control and Freedom | People should navigate backward or the main menu easily. | |
| People should cancel their actions easily. | ||
| Menu Bar | The system should have a neat and uncomplicated menu bar with a maximum of seven items with short names. | |
| The system should show all items when the menu bar is in focus. | ||
| Help | Onboarding | The system should have an intuitive design where not much guidance is required. |
| If necessary, the system can guide users, but the priority is that the system has an intuitive design. | ||
| Help | The system should provide necessary instructions when controls vary from the norm. | |
| The system should provide necessary and easy-to-understand information in the help section. | ||
| Feedback and Alerts | The system should use alerts in important situations, such as confirming purchases, destructive actions, or notifying people about problems. | |
| Alerts should have only critical information and useful choices. | ||
| Label destructive actions clearly. The system should allow users to identify alert buttons that cause destructive actions. | ||
| The system should use images instead of descriptive alert text whenever possible. If necessary, the alert messages should be short and only one or two lines long. | ||
| Alarm texts and button titles should be clear without needing an extra explanation. | ||
| The OTT platform should provide user-friendly language in warning messages. | ||
| Content | Content | Content is the most important element for people. The system should focus on content and minimize distractions to give people an uninterrupted and enjoyable viewing experience. The system should provide high-quality video and sound to enhance cinematic experience. |
| Provide useful information such as images, titles, and descriptions about content. | ||
| Avoid using more than eight lines for additional information about the content. | ||
| In the info panel, people should display additional information such as subtitles, chapters, audio tracks, and speaker output options. | ||
| Easy Access | People should skip forward and backward in a video by clicking the right and left sides of the progress bar. | |
| The system allows people to perform actions such as watching, starting over easily, and resuming playback. | ||
| The system should allow people to access their favorite content quickly. | ||
| The system allows people to find content by grouping content into familiar categories such as “Movies,” “TV Shows,” “Kids,” and “Sports”. | ||
| Top Shelf Content | The system should highlight new or featured content on the top shelf to enable people to access content easily. | |
| The system should feature new content instead of those users have already watched. | ||
| The system should feature episodes or season trailers, new shows, and new seasons or shows coming soon. | ||
| The system should personalize favorite content and show recommendations based on the user’s viewing experience on the top shelf. | ||
| PiP Mode | The system should allow people to use an app while watching content in picture-in-picture (PiP) mode. | |
| Loading | The system should not wait for users to reach content using splash screens, detail screens, or intro animations. | |
| The system should not appear to be frozen while the contents are loading. | ||
| The system should make loading clear by using standard progress indicators or customize loadings using different educating or entertaining hints, videos, or graphics to create immersive experience while masking loading time. | ||
| The system should provide accurate progress information. | ||
| The system provides visual feedback to give time streaming content to load. | ||
| The system should prefer to use progress bars for quantifiable actions; otherwise, it should use activity indicators. | ||
| The system should preload screens of content in the background immediately. | ||
| The system displays launch image quickly when the app starts up. | ||
| The system should not wait users to reach content by using splash screens, detail screens, or intro animations. | ||
| Branding | Branding | Provide enough branding without overwhelming people. |
| Implement refined branding through the app’s design using custom color, font, or background. | ||
| The branding elements should be used consistently throughout the system. | ||
| Logo | The system should have an attractive and recognizable logo. | |
| Design | Color | Test colors on televisions with different display settings to understand how colors look on big screens. |
| Avoid using colors that make it difficult for people to perceive the content. | ||
| Layout | The system should design a layout that looks great on various screen sizes. | |
| The system should adhere to the screen’s safe zone and provide primary content away from the edges. | ||
| The system should use enough consistent spacing through the system to avoid overlapping. | ||
| The system should use clean and consistent layouts to keep the content at the center of attention. | ||
| The system should have background compatible with other content considering image and text colors. | ||
| Icons and Images | The system should use simple and recognizable images as icons of buttons, segments, etc. The launch image should not include logos and other branding elements, as it is not a branding opportunity. People should interact and focus on icons and images easily. | |
| The system should use high-quality images appropriate for different sizes of screens. | ||
| The icons and images should have a safe zone to prevent cropping as the icon scales and moves. | ||
| Layering | Use standard interface elements to create layered images to create a sense of realism and vigor using the parallax effect. | |
| Interface Elements | The system should provide consistent interface elements through the system. | |
| Respectful Interaction | Consider how colors are perceived in different countries and cultures to ensure the appropriate message is conveyed. | |
| Accessibility & Customization | Typography | The system should use legible and clear fonts suitable for different screen sizes. |
| The system should use appropriate fonts that are legible at a distance. | ||
| The system should use appropriate leading to ensure readability. | ||
| The system should use built-in text styles whenever possible to make content visually distinct. | ||
| Customization | The system should allow users to customize their text size. | |
| Language | The system should allow people to change audio and subtitle languages easily. | |
| Data Entry & Search | Effort Minimization | The system should automatically display a virtual keyboard when people click a text field. |
| The system should allow users to enter text data quickly using a linear keyboard that automatically appears when they click a text field. | ||
| The system should provide an appropriate keyboard type based on the data being collected to make entering one’s name, e-mail address, or number easier. | ||
| The system should request data entry in fields like search and log in. | ||
| The system shows recently entered information if data entry is required. For example, it shows the email address keyboard and recently entered addresses. | ||
| Search | The system should list popular or recent searches in the results area before people start typing. | |
| The system should simplify search results and display a short list that best matches the search performed to prevent people from scrolling through the pages. | ||
| The system should allow users to see the search results easily. |
Table A3.
OTT usability measurement scale.
Table A3.
OTT usability measurement scale.
| Construct | Code | Items |
|---|---|---|
| Account Management | ACC1 | I can easily create or delete my user account on the Netflix website. |
| ACC2 | Netflix’s website automatically verifies my identity when I sign in. | |
| ACC3 | I understand the benefits of creating an account from the brief information on the registration screen. | |
| ACC4 | I can create multiple profiles for different users, including children. | |
| ACC5 | I can easily lock my profile. | |
| Privacy | PRV1 | I think the Netflix website values my privacy. |
| PRV2 | I feel safe sending my personal information to the Netflix website. | |
| PRV3 | I believe my personal information is not shared with third parties without my permission. | |
| Navigation | NVG1 | I can easily understand where I am in the system. |
| NVG2 | I can easily navigate through the system. | |
| NVG3 | I can quickly perform my operations in a few steps. | |
| NVG4 | I can easily go back or go to the main menu. | |
| NVG5 | I can cancel my actions easily. | |
| NVG6 | The menu design is simple and understandable. | |
| HLP1 | I do not need much guidance as the system has an intuitive design. | |
| Help | HLP2 | When I need help, I can easily access the necessary instructions and information. |
| HLP3 | I think the information provided in the help section is sufficient and understandable. | |
| HLP4 | I am informed about important situations (such as purchasing, deleting an account, etc.) | |
| HLP5 | I can easily understand warning messages. | |
| CON1 | I think Netflix offers a pleasant and high-quality viewing experience | |
| CON2 | I think the descriptions of the content are sufficient and useful. | |
| Content | CON3 | I can control my viewing experience on Netflix by utilizing features such as fast forwarding, rewinding, starting from the beginning, pausing, and resuming playback anytime. |
| CON4 | I can quickly access my favorite content. | |
| CON5 | I think movies, series, and TV shows are appropriately categorized. | |
| CON6 | I can easily access new or popular content. | |
| CON7 | I think the Netflix website suggests content that is suitable for my viewing experience. | |
| Branding | BRN1 | I think Netflix uses its brand colors or visuals subtly and unobtrusively. |
| BRN2 | I can easily recognize the brand on the Netflix website through color, font, and background. | |
| BRN3 | I think Netflix consistently uses its brand elements on its website. | |
| BRN4 | I can easily recognize Netflix’s logo. | |
| DES1 | I think the colors on the screen look good in different settings and screen sizes. | |
| DES2 | I think the Netflix website has a beautiful design and layout. | |
| DES3 | Netflix places primary content at the center of attention. | |
| DES4 | The appropriate spacing on the Netflix website helps prevent overlapping content. | |
| DES5 | I think the Netflix website has a simple and consistent layout on all pages. | |
| Design | DES6 | I can see the icons and images clearly from a distance. |
| DES7 | Netflix uses lively and realistic images and animations on its website. | |
| DES8 | The Netflix website provides consistent icons and images throughout the system. | |
| Accessibility and Customization | CUS1 | I can easily read the text on different screen sizes. |
| CUS2 | I can easily read the text on the website. | |
| CUS3 | I can customize the text size. | |
| CUS4 | I can easily change the audio and subtitle languages. | |
| Data Entry and Search | SRC1 | I can easily enter data on the website. |
| SRC2 | I only enter data in the required fields on the platform. | |
| SRC3 | I do not need to re-enter the last information I entered. | |
| SRC4 | I can see popular or recent searches without typing in the necessary keywords. | |
| SRC5 | I can easily search on the Netflix website. | |
| SRC6 | I can see the search results in a list. |
References
- Layton, R. Netflix Comes to the Nordics: Lessons in OTT Video. Nord. Balt. J. Inf. Commun. Technol. 2014, 109–138. [Google Scholar] [CrossRef]
- Moro-Visconti, R. From Netflix to Youtube: Over-The-Top and Video-on-Demand Platform Valuation. In Startup Valuation; Palgrave Macmillan, Cham: London, UK, 2021. [Google Scholar]
- Mulla, T. Assessing the Factors Influencing the Adoption of Over-The-Top Streaming Platforms: A Literature Review from 2007 to 2021. Telemat. Inform. 2022, 69, 101797. [Google Scholar] [CrossRef]
- Puthiyakath, H.H.; Goswami, M.P. Is Over the Top Video Platform the Game Changer over Traditional TV Channels in India? A Niche Analysis. Asia Pac. Media Educ. 2021, 31, 133–150. [Google Scholar] [CrossRef]
- Shin, S.; Park, J. Factors Affecting Users’ Satisfaction and Dissatisfaction of OTT Services in South Korea. Telecommun. Policy 2021, 45, 102203. [Google Scholar] [CrossRef]
- Statista. OTT Video—Worldwide. 2023. Available online: https://fr.statista.com/outlook/amo/media/tv-video/ott-video/worldwide#revenue (accessed on 2 August 2023).
- Nielsen, J. Usability 101: Introduction to Usability. 2003. Available online: https://www.nngroup.com/articles/usability-101-introduction-to-usability/ (accessed on 13 June 2020).
- ISO. Ergonomic Requirements for Office Work with Visual Display Terminals (VDTs). Part 11: Guidance on Usability (ISO 9241-11:1998). 1998. Available online: https://www.iso.org/standard/16883.html (accessed on 24 May 2023).
- ISO. Ergonomics of human-system interaction—Part 11: Usability: Definitions and Concepts (ISO 9241-11:2018). 2018. Available online: https://www.iso.org/standard/63500.html (accessed on 24 May 2023).
- Cayola, L.; Macías, J.A. Systematic Guidance on Usability Methods in User-Centered Software Development. Inf. Softw. Technol. 2018, 97, 163–175. [Google Scholar] [CrossRef]
- Hoehle, H.; Venkatesh, V. Mobile Application Usability: Conceptualization and Instrument Development. MIS Q. 2015, 39, 435–472. [Google Scholar] [CrossRef]
- Krishnan, S.S.; Sitaraman, R.K. Video stream quality impacts viewer behavior: Inferring causality using quasi-experimental designs. In Proceedings of the 2012 Internet Measurement Conference, Boston, MA, USA, 14–16 November 2012; Association for Computing Machinery: New York, NY, USA; pp. 211–224. [Google Scholar]
- Hussain, A.; Mkpojiogu, E.O.; Mohmad Kamal, F. Mobile Video Streaming Applications: A Systematic Review of Test Metrics in Usability Evaluation. J. Telecommun. Electron. Comput. Eng. 2016, 8, 35–39. [Google Scholar]
- Hussain, A.; Abd Razak, M.N.F.; Mkpojiogu, E.O.; Hamdi, M.M.F. UX Evaluation of Video Streaming Application with Teenage Users. Journal of Telecommun. Electron. Comput. Eng. (JTEC) 2017, 9, 129–131. [Google Scholar]
- Eliseo, M.A.; Casac, B.S.; Gentil, G.R. A Comparative Study of Video Content User Interfaces Based on Heuristic Evaluation. In Proceedings of the 2017 12th Iberian Conference on Information Systems and Technologies (CISTI), Lisbon, Portugal, 21–24 June 2017; IEEE: Piscataway, NJ, USA, 2017; pp. 1–6. [Google Scholar]
- Yang, W.; Yahiro, S.; Sato, K. Research on User-Centered Information Design in SVOD Service. In Proceedings of the HCI International 2018–Posters’ Extended Abstracts: 20th International Conference, HCI International 2018, Las Vegas, NV, USA, 15–20 July 2018; Part I 20. Springer International Publishing: Berlin/Heidelberg, Germany, 2018; pp. 129–135. [Google Scholar]
- Kollmorgen, J.; Schrepp, M.; Thomaschewski, J. Impact of Usage Behaviour on the User Experience of Netflix, Microsoft Powerpoint, Bigbluebutton and Zoom. In Proceedings of the 18th International Conference on Web Information Systems and Technologies (WEBIST 2022), Valletta, Malta, 25–27 October 2022; SCITEPRESS: Setúbal, Portugal, 2022; pp. 397–406. [Google Scholar]
- Bernhaupt, R.; Obrist, M.; Tscheligi, M. Usability and Usage of iTV Services: Lessons Learned in An Austrian Field Trial. Comput. Entertain. (CIE) 2007, 5, 6. [Google Scholar] [CrossRef]
- Kim, M.H.; Ko, S.M.; Mun, J.S.; Ji, Y.G.; Jung, M.R. A Usability Study on Personalized EPG (pEPG) UI of Digital TV. In Human-Computer Interaction. HCI Intelligent Multimodal Interaction Environments. HCI 2007; Jacko, J.A., Ed.; Lecture Notes in Computer Science; Springer: Berlin/Heidelberg, Germany, 2007; Volume 4552. [Google Scholar]
- Obrist, M.; Bernhaupt, R.; Beck, E.; Tscheligi, M. Focusing on Elderly: An iTV Usability Evaluation Study with Eye-Tracking. In Proceedings of the Interactive TV: A Shared Experience: 5th European Conference, EuroITV 2007, Amsterdam, The Netherlands, 24–25 May 2007; Proceedings 5. Springer: Berlin/Heidelberg, Germany, 2007; pp. 66–75. [Google Scholar]
- Geerts, D.; De Grooff, D. Supporting the Social Uses of Television: Sociability Heuristics for Social TV. In Proceedings of the SIGCHI Conference on Human Factors in Computing Systems, Boston, MA, USA, 4–9 April 2009; Association for Computing Machinery: New York, NY, USA, 2009; pp. 595–604. [Google Scholar]
- Silva, P.A.; Nunes, F. 3 × 7 Usability Testing Guidelines for Older Adults. In Proceedings of the 3rd Human-Computer Interaction, Usability Testing, Older Adults, San Luis Potosí, Mexico, 8–10 November 2010; Universidad Politécnica de San Luis Potosí: San Luis Potosí, Mexico, 2010; pp. 1–8. [Google Scholar]
- Solano, A.; Rusu, C.; Collazos, C.; Roncagliolo, S.; Arciniegas, J.L.; Rusu, V. Usability Heuristics for Interactive Digital Television. In Proceedings of the AFIN 2011: The Third International Conference on Advances in Future Internet, Nice, France, 21–27 August 2011; IARIA Press: Wilmington, DE, USA, 2011; pp. 60–63. [Google Scholar]
- Lim, Y.; Park, J.; Jung, E.S.; Chung, D.H.; Kim, T.; Choi, K.; Lee, S. Comparative Study on Advanced TV Interface Types in the Smart Media World. In Proceedings of the 2012 9th International Conference on Ubiquitous Intelligence and Computing and 9th International Conference on Autonomic and Trusted Computing, Fukuoka, Japan, 4–7 September 2012; IEEE: Piscataway, NJ, USA, 2012; pp. 342–348. [Google Scholar]
- Solano, A.; Rusu, C.; Collazos, C.A.; Arciniegas, J. Evaluating Interactive Digital Television Applications Through Usability Heuristics. Ingeniare. Rev. Chil. De Ing. 2013, 21, 16–29. [Google Scholar] [CrossRef]
- Miesler, L.; Gehring, B.; Hannich, F.; Wüthrich, A. User Experience of Video-on-Demand Applications for Smart TVs: A Case Study. In Design, User Experience, and Usability. User Experience Design Practice; Marcus, A., Ed.; Lecture Notes in Computer Science; Springer International Publishing: Cham, Switzerland, 2014; pp. 412–422. [Google Scholar]
- Ouyang, X.; Zhou, J. How to Help Older Adults Move the Focus on a Smart TV? Exploring the Effects of Arrow Hints and Element Size Consistency. Int. J. Hum.—Comput. Interact. 2019, 35, 1420–1436. [Google Scholar] [CrossRef]
- Dou, J.; Qin, J.; Wang, Q.; Zhao, Q. Identification of Usability Problems and Requirements of Elderly Chinese Users for Smart TV Interactions. Behav. Inf. Technol. 2019, 38, 664–677. [Google Scholar] [CrossRef]
- Jang, J.; Yi, M.Y. Determining and Validating Smart TV UX Factors: A Multiple-Study Approach. Int. J. Hum.—Comput. Stud. 2019, 130, 58–72. [Google Scholar] [CrossRef]
- Awale, B.; Murano, P. A Preliminary Usability and Universal Design Evaluation of a Television App User Interface. Balt. J. Mod. Comput. 2020, 8, 433–443. [Google Scholar] [CrossRef]
- Bures, M.; Macik, M.; Ahmed, B.S.; Rechtberger, V.; Slavik, P. Testing the Usability and Accessibility of Smart TV Applications Using an Automated Model-Based Approach. IEEE Trans. Consum. Electron. 2020, 66, 134–143. [Google Scholar] [CrossRef]
- Kaya, A.; Gumussoy, C.A.; Ekmen, B.; Bayraktaroglu, A.E. Usability Heuristics for The Set-Top Box and TV Interfaces. Hum. Factors Ergon. Manuf. Serv. Ind. 2021, 31, 270–290. [Google Scholar] [CrossRef]
- Gumussoy, C.A.; Pekpazar, A.; Esengun, M.; Bayraktaroglu, A.E.; Ince, G. Usability Evaluation of TV Interfaces: Subjective Evaluation Vs. Objective Evaluation. Int. J. Hum.—Comput. Interact. 2022, 38, 661–679. [Google Scholar] [CrossRef]
- Chorianopoulos, K. User Interface Design Principles for Interactive Television Applications. Int. J. Hum.—Comput. Interact. 2008, 24, 556–573. [Google Scholar] [CrossRef]
- Collazos, C.A.; Rusu, C.; Arciniegas, J.L.; Roncagliolo, S. Designing and Evaluating Interactive Television from a Usability Perspective. In Proceedings of the 2009 Second International Conferences on Advances in Computer-Human Interactions (ACHI), Cancun, Mexico, 1–7 February 2009; IEEE: Cancun, Mexico, 2009; pp. 381–385. [Google Scholar]
- Fernandes, S.; Velhinho, A.; Abreu, J.; Almeida, P. UI Design for an iTV platform: An iterative approach. In Proceedings of the XIX International Conference on Human Computer Interaction, Palma, Spain, 12–14 September 2018; Association for Computing Machinery: New York, NY, USA, 2018; pp. 1–8. [Google Scholar]
- Chen, Y.N.K. Competitions Between OTT TV Platforms and Traditional Television in Taiwan: A Niche Analysis. Telecommun. Policy 2019, 43, 101793. [Google Scholar] [CrossRef]
- Bhullar, A.; Chaudhary, R. Key Factors Influencing Users’ Adoption towards OTT Media Platform: An Empirical Analysis. Int. J. Adv. Sci. Technol. 2020, 29, 942–956. [Google Scholar]
- Malewar, S.; Bajaj, S. Acceptance of OTT Video Streaming Platforms in India During COVID-19: Extending UTAUT2 with Content Availability. J. Content Community Commun. 2020, 12, 89–106. [Google Scholar] [CrossRef]
- Camilleri, M.A.; Falzon, L. Understanding Motivations to Use Online Streaming Services: Integrating the Technology Acceptance Model (TAM) and the Uses and Gratifications Theory (UGT). Span. J. Mark.—ESIC 2021, 25, 217–238. [Google Scholar] [CrossRef]
- Gupta, G.; Singharia, K. Consumption of OTT Media Streaming in COVID-19 Lockdown: Insights from PLS analysis. Vision 2021, 25, 36–46. [Google Scholar] [CrossRef]
- Bhattacharyya, S.S.; Goswami, S.; Mehta, R.; Nayak, B. Examining the Factors Influencing Adoption of Over the Top (OTT) Services Among Indian Consumers. J. Sci. Technol. Policy Manag. 2022, 13, 652–682. [Google Scholar] [CrossRef]
- Chakraborty, D.; Siddiqui, M.; Siddiqui, A.; Paul, J.; Dash, G.; Dal Mas, F. Watching is Valuable: Consumer Views–Content Consumption on OTT Platforms. J. Retail. Consum. Serv. 2023, 70, 103148. [Google Scholar] [CrossRef]
- Lee, J.S.; Shin, D.H. The Relationship Between Human and Smart TVs Based on Emotion Recognition in HCI. In Proceedings of the Computational Science and Its Applications–ICCSA 2014: 14th International Conference, Guimarães, Portugal, 30 June–3 July 2014; Proceedings, Part IV 14. Springer International Publishing: Cham, Switzerland, 2014; pp. 652–667. [Google Scholar]
- Lewis, B.R.; Templeton, G.F.; Byrd, T.A. A Methodology for Construct Development in MIS Research. Eur. J. Inf. Syst. 2005, 14, 388–400. [Google Scholar] [CrossRef]
- Hoehle, H.; Aljafari, R.; Venkatesh, V. Leveraging Microsoft’s mobile usability guidelines: Conceptualizing and developing scales for mobile application usability. Int. J. Hum.—Comput. Stud. 2016, 89, 35–53. [Google Scholar] [CrossRef]
- Corbin, J.M.; Strauss, A. Grounded Theory Research: Procedures, Canons, and Evaluative Criteria. Qual. Sociol. 1990, 13, 3–21. [Google Scholar] [CrossRef]
- Strauss, A.; Corbin, J. Basics of Qualitative Research: Techniques and Procedures for Developing Grounded Theory, 2nd ed.; Sage Publications, Inc.: Thousand Oaks, CA, USA, 1998. [Google Scholar]
- Apple. Designing for tvOS- Platforms- Human Interface Guidelines- Design- Apple Developer. 2022. Available online: https://developer.apple.com/design/human-interface-guidelines/platforms/designing-for-tvos/ (accessed on 29 December 2022).
- Sawyer, B.D.; Dobres, J.; Chahine, N.; Reimer, B. The Great Typography Bake-Off: Comparing Legibility At-A-Glance. Ergonomics 2020, 63, 391–398. [Google Scholar] [CrossRef]
- Brown, A.; Jones, R.; Crabb, M.; Sandford, J.; Brooks, M.; Armstrong, M.; Jay, C. Dynamic Subtitles: The User Experience. In Proceedings of the ACM International Conference on Interactive Experiences for TV and Online Video, Brussels, Belgium, 3–5 June 2015; Association for Computing Machinery: New York, NY, USA, 2015; pp. 103–112. [Google Scholar] [CrossRef]
- Huang, D.-L.; Patrick Rau, P.-L.; Liu, Y. Effects of Font Size, Display Resolution and Task Type on Reading Chinese Fonts from Mobile Devices. Int. J. Ind. Ergon. 2009, 39, 81–89. [Google Scholar] [CrossRef]
- Liu, N.; Yu, R.; Zhang, Y. Effects of Font Size, Stroke Width, and Character Complexity on the Legibility of Chinese Characters: Effects of Font Size on Legibility of Chinese Characters. Hum. Factors Ergon. Manuf. Serv. Ind. 2016, 26, 381–392. [Google Scholar] [CrossRef]
- Chaparro, B.S.; Shaikh, A.D.; Chaparro, A. The legibility of Cleartype Fonts. In Proceedings of the Human Factors and Ergonomics Society Annual Meeting; SAGE Publications: Los Angeles, CA, USA, 2006; Volume 50, pp. 1829–1832. [Google Scholar]
- Bernard, M.; Mills, M. So, What Size and Type of Font Should I Use on My Website? Usability News 2000, 2, 1–5. [Google Scholar]
- Bernard, M.; Liao, C.H.; Mills, M. The Effects of Font Type and Size on The Legibility and Reading Time of Online Text by Older Adults. In Proceedings of the CHI’01 Extended Abstracts on Human Factors in Computing Systems, Seattle, DA, USA, 31 March–5 April 2001; Association for Computing Machinery: New York, NY, USA, 2001; pp. 175–176. [Google Scholar]
- Darroch, I.; Goodman, J.; Brewster, S.; Gray, P. The Effect of Age and Font Size on Reading Text on Handheld Computers. In Human-Computer Interaction—INTERACT 2005; Costabile, M.F., Paternò, F., Eds.; Lecture Notes in Computer Science; Springer: Berlin/Heidelberg, Germany, 2005; pp. 253–266. [Google Scholar]
- Pedersen, J. From Old Tricks to Netflix: How Local Are Interlingual Subtitling Norms for Streamed Television? J. Audiov. Transl. 2018, 1, 81–100. [Google Scholar] [CrossRef]
- Kuscu-Ozbudak, S. The Role of Subtitling on Netflix: An Audience Study. Perspectives 2022, 30, 537–551. [Google Scholar] [CrossRef]
- Bonner, J.; O’Hagan, J.; Mathis, F.; Ferguson, J.; Khamis, M. Using Personal Data to Support Authentication: User Attitudes and Suitability. In Proceedings of the 20th International Conference on Mobile and Ubiquitous Multimedia (MUM’21), Leuven, Belgium, 5–8 December 2021; Association for Computing Machinery: New York, NY, USA, 2022; pp. 35–42. [Google Scholar]
- Braz, C.; Robert, J.-M. Security and Usability: The Case of The User Authentication Methods. In Proceedings of the 18th Conference on l’Interaction Homme-Machine (IHM’06), Montreal, QC, Canada, 18–21 April 2006; Association for Computing Machinery: New York, NY, USA, 2006; pp. 199–203. [Google Scholar]
- Schaffner, B.; Lingareddy, N.A.; Chetty, M. Understanding Account Deletion and Relevant Dark Patterns on Social Media. Proc. ACM Hum.—Comput. Interact. 2022, 6, 1–43. [Google Scholar] [CrossRef]
- Hajahmed, M.I.O.; Osman, K.E.M.; Ali, O.T.M. Approaches for SMS encryption and user accounts verification. In Proceedings of the 2020 International Conference on Computer, Control, Electrical, and Electronics Engineering (ICCCEEE), Khartoum, Sudan, 26 February–1 March 2021; IEEE: Piscataway, NJ, USA, 2021; pp. 1–5. [Google Scholar] [CrossRef]
- Lad, A.; Butala, S.; Bide, P. A Comparative Analysis of Over-the-Top Platforms: Amazon Prime Video and Netflix. In Communication and Intelligent Systems; Bansal, J.C., Gupta, M.K., Sharma, H., Agarwal, B., Eds.; Springer: Singapore, 2020; Volume 120, pp. 283–299. [Google Scholar] [CrossRef]
- Macdonald, E.; Sharp, B. Management Perceptions of The Importance of Brand Awareness as An Indication of Advertising Effectiveness. Mark. Bull. 2003, 14, 1–15. [Google Scholar]
- Japutra, A.; Molinillo, S.; Wang, S. Aesthetic or Self-Expressiveness? Linking Brand Logo Benefits, Brand Stereotypes and Relationship Quality. J. Retail. Consum. Serv. 2018, 44, 191–200. [Google Scholar] [CrossRef]
- Gultom, M.D.; Adlina, H.; Siregar, O.M. The Influence of Electronic Word of Mouth and Brand Image on the Purchase Decision of Video on Demand Netflix Subscription:(Study on Netflix Users in Medan City). J. Humanit. Soc. Sci. Bus. 2022, 2, 122–127. [Google Scholar] [CrossRef]
- Govers, R. Why Place Branding is Not About Logos and Slogans. Place Brand Public Dipl. 2013, 9, 71–75. [Google Scholar] [CrossRef]
- Smith, A.L.; Chaparro, B.S. Smartphone Text Input Method Performance, Usability, and Preference with Younger and Older Adults. Hum. Factors 2015, 57, 1015–1028. [Google Scholar] [CrossRef]
- Geleijnse, G.; Aliakseyeu, D.; Sarroukh, E. Comparing Text Entry Methods for Interactive Television Applications. In Proceedings of the Seventh European Conference on European Interactive Television Conference, Leuven, Belgium, 3–5 June 2009; ACM Press: New York, NY, USA, 2009; p. 145. [Google Scholar]
- Oliveira, J.; Guerreiro, T.; Nicolau, H.; Jorge, J.; Gonçalves, D. Blind People and Mobile Touch-Based Text-Entry: Acknowledging the Need for Different Flavors. In the Proceedings of the 13th International ACM SIGACCESS Conference on Computers and Accessibility, Dundee Scotland, UK, 24–26 October 2011; ACM: New York, NY, USA, 2011; pp. 179–186. [Google Scholar]
- Barrero, A.; Melendi, D.; Pañeda, X.G.; García, R.; Cabrero, S. An Empirical Investigation into Text Input Methods for Interactive Digital Television Applications. Int. J. Hum.—Comput. Interact. 2014, 30, 321–341. [Google Scholar] [CrossRef]
- Lamkhede, S.; Das, S. Challenges in Search on Streaming Services: Netflix Case Study. In Proceedings of the 42nd International ACM SIGIR Conference on Research and Development in Information Retrieval, Paris, France, 21–25 July 2019; ACM: New York, NY, USA, 2019; pp. 1371–1374. [Google Scholar]
- Pattanayak, S.; Shukla, V.K. Review of Recommender System for OTT platform through Artificial Intelligence. In Proceedings of the 2021 9th International Conference on Reliability, Infocom Technologies and Optimization (Trends and Future Directions) (ICRITO), Noida, India, 3–4 September 2021; IEEE: New York, NY, USA, 2021; pp. 1–5. [Google Scholar]
- Barber, W.; Badre, A. Culturability: The Merging of Culture and Usability. In Proceedings of the 4th Conference on Human Factors and the Web, Basking Ridge, NJ, USA, 5 June 1998; Volume 7, pp. 1–10. [Google Scholar]
- Becker, S.A.; Mottay, F.E. A Global Perspective on Web Site Usability. IEEE Softw. 2001, 18, 54–61. [Google Scholar] [CrossRef]
- Oztekin, A.; Delen, D.; Turkyilmaz, A.; Zaim, S. A Machine Learning-Based Usability Evaluation Method for Elearning Systems. Decis. Support Syst. 2013, 56, 63–73. [Google Scholar] [CrossRef]
- Morgan, M.R.P. Color Me Blue… Or Red or Green? Lessons from the Literature on Color and Usability. In Proceedings of the 1995 IEEE International Professional Communication Conference. IPCC 95 Proceedings. Smooth Sailing to the Future, Savannah, GA, USA, 27–29 September 1995; IEEE: New York, NY, USA, 1995; pp. 72–75. [Google Scholar]
- Noiwan, J.; Norcio, A.F. Cultural Differences on Attention and Perceived Usability: Investigating Color Combinations of Animated Graphics. Int. J. Hum.—Comput. Stud. 2006, 64, 103–122. [Google Scholar] [CrossRef]
- Comber, T.; Maltby, J. Evaluating usability of screen designs with layout complexity. In Proceedings of the OZCHI 95: Fifth Australian Conference on Computer-Human Interaction, Wollongong, Australia, 27–30 November 1995; CHISIG: Downer, ACT, Australia, 1995. [Google Scholar]
- Zen, M.; Vanderdonckt, J. Towards an Evaluation of Graphical User Interfaces Aesthetics Based on Metrics. In Proceedings of the 2014 IEEE Eighth International Conference on Research Challenges in Information Science (RCIS), Marrakech, Morocco, 28–30 May 2014; IEEE: New York, NY, USA, 2014; pp. 1–12. [Google Scholar]
- Graham, L. Basics of Design: Layout and Typography for Beginners, 2nd ed.; Cengage Learning: Clifton Park, NY, USA, 2005. [Google Scholar]
- Gatsou, C.; Politis, A.; Zevgolis, D. The Importance of Mobile Interface Icons on User Interaction. Int. J. Comput. Sci. Appl. 2012, 9, 92–107. [Google Scholar]
- Cakar, M.; Yildiz, K.; Demir, O. Creating Cover Photos (Thumbnail) for Movies and TV Series with Convolutional Neural Network. In Proceedings of the 2020 Innovations in Intelligent Systems and Applications Conference (ASYU), Istanbul, Turkey, 15–17 October 2020; IEEE: New York, NY, USA, 2020; pp. 1–5. [Google Scholar]
- Eklund, O. Custom Thumbnails: The Changing Face of Personalisation Strategies on Netflix. Convergence 2022, 28, 737–760. [Google Scholar] [CrossRef]
- Oztekin, A.; Nikov, A.; Zaim, S. UWIS: An Assessment Methodology for Usability of Web-Based Information Systems. J. Syst. Softw. 2009, 82, 2038–2050. [Google Scholar] [CrossRef]
- Martin, A.P.; Ivory, M.Y.; Megraw, R.; Slabosky, B. How Helpful is Help? Use of and Satisfaction with User Assistance. In Proceedings of the 3rd International Conference on Universal Access in Human-Computer Interaction, Las Vegas, NV, USA, 22–27 July 2005; pp. 22–27. [Google Scholar]
- Juristo, N.; Moreno, A.; Sanchez-Segura, M.-I. Guidelines for Eliciting Usability Functionalities. IEEE Trans. Softw. Eng. 2007, 33, 744–758. [Google Scholar] [CrossRef]
- Nielsen, J. 10 Usability Heuristics for User Interface Design. Nielsen Norman Group. 2020. Available online: https://www.nngroup.com/articles/ten-usability-heuristics/ (accessed on 17 May 2023).
- Ribeiro, V.S.; Martins, A.I.; Queirós, A.; Silva, A.G.; Rocha, N.P. Usability Evaluation of a Health Care Application Based on IPTV. Procedia Comput. Sci. 2015, 64, 635–642. [Google Scholar] [CrossRef]
- Golja, M.; Stojmenova, E.; Humar, I. Interactive TV User Interfaces: How Fast Is Too Fast? Multimed. Tools Appl. 2014, 71, 61–76. [Google Scholar] [CrossRef]
- Garfinkel, S.L. De-Identification of Personal Information (NISTIR 8053); Information Access Division, Information Technology Laboratory, National Institute of Standards and Technology: Gaithersburg, MD, USA, 2015. [Google Scholar] [CrossRef]
- Forrow. Netflix Heads into the Clouds: Interview with Adrian Cockcroft | USENIX. 2012. Available online: https://www.usenix.org/publications/login/february-2012/netflix-heads-clouds-interview-adrian-cockcroft (accessed on 29 December 2022).
- Mohajeri Moghaddam, H.; Acar, G.; Burgess, B.; Mathur, A.; Huang, D.Y.; Feamster, N.; Felten, E.W.; Mittal, P.; Narayanan, A. Watching You Watch: The Tracking Ecosystem of Over-the-Top TV Streaming Devices. In Proceedings of the 2019 ACM SIGSAC Conference on Computer and Communications Security, London, UK, 11–15 November 2019; ACM: New York, NY, USA, 2019; pp. 131–147. [Google Scholar]
- Shim, H.; Yeon, J. Two-Facedness of Netflix Users? Privacy Paradox with Privacy Insensitivity in Using Video Streaming Service. 2022. Available online: https://papers.ssrn.com/sol3/papers.cfm?abstract_id=4107152 (accessed on 2 May 2023).
- Kim, J.; Lee, C. The Return of the King: The Importance of Killer Content in a Competitive OTT Market. J. Theor. Appl. Electron. Commer. Res. 2023, 18, 976–994. [Google Scholar] [CrossRef]
- Au-Yong-Oliveira, M.; Marinheiro, M.; Costa Tavares, J.A. The Power of Digitalization: The Netflix Story. In Trends and Innovations in Information Systems and Technologies, Advances in Intelligent Systems and Computing; Rocha, Á., Adeli, H., Reis, L.P., Costanzo, S., Orovic, I., Moreira, F., Eds.; Springer International Publishing: Cham, Switzerland, 2020. [Google Scholar]
- Anderson, J.C.; Gerbing, D.W. Predicting the Performance of Measures in a Confirmatory Factor Analysis with a Pretest Assessment of Their Substantive Validities. J. Appl. Psychol. 1991, 76, 732–740. [Google Scholar] [CrossRef]
- Yao, G.; Wu, C.H.; Yang, C.T. Examining the Content Validity of the WHOQOL-BREF From Respondents’ Perspective by Quantitative Methods. Soc. Indic. Res. 2008, 85, 483–498. [Google Scholar] [CrossRef]
- Cheung, C.M.K.; Lee, M.K.O. Trust in Internet Shopping: Instrument Development and Validation Through Classical and Modern Approaches. J. Glob. Inf. Manag. 2001, 9, 23–35. [Google Scholar] [CrossRef]
- Flavián, C.; Guinalíu, M. Consumer Trust, Perceived Security and Privacy Policy: Three Basic Elements of Loyalty to a Web Site. Ind. Manag. Data Syst. 2006, 106, 601–620. [Google Scholar] [CrossRef]
- Stoll, J. Quarterly Netflix Subscribers Count Worldwide 2013–2023. 2023. Available online: https://www.statista.com/statistics/250934/quarterly-number-of-netflix-streaming-subscribers-worldwide/ (accessed on 22 September 2023).
- Stoll, J. Netflix’s Annual Revenue 2002–2022. 2023. Available online: https://www.statista.com/statistics/272545/annual-revenue-of-netflix/ (accessed on 22 September 2023).
- Vivarelli, N. Netflix, HBO Max, Amazon Prime up the Ante in Turkish TV Production and Storytelling. Variety. 2 April 2022. Available online: https://variety.com/2022/tv/spotlight/turkish-tv-netflix-amazon-hbo-max-1235220335/ (accessed on 22 September 2023).
- Hair, J.F. Multivariate Data Analysis, 5th ed.; Prentice Hall: Hoboken, NJ, USA, 1998. [Google Scholar]
- Tabachnick, B.G.; Fidell, L.S. Using Multivariate Statistics, 5th ed.; Allyn & Bacon/Pearson Education: Boston, MA, USA, 2007. [Google Scholar]
- Straub, D.W. Validating Instruments in MIS Research. MIS Q. 1989, 13, 147–169. [Google Scholar] [CrossRef]
- MacKenzie, S.B.; Podsakoff, P.M.; Podsakoff, N.P. Construct Measurement and Validation Procedures in MIS and Behavioral Research: Integrating New and Existing Techniques. MIS Q. 2011, 35, 293–334. [Google Scholar] [CrossRef]
- Chau, P.Y.K. Reexamining a Model for Evaluating Information Center Success Using a Structural Equation Modeling Approach. Decis. Sci. 1997, 28, 309–334. [Google Scholar] [CrossRef]
- Doll, W.J.; Xia, W.; Torkzadeh, G. A Confirmatory Factor Analysis of the End-User Computing Satisfaction Instrument. MIS Q. 1994, 18, 453–461. [Google Scholar] [CrossRef]
- Hair, J.F.; Black, W.C.; Babin, B.J.; Anderson, R.E. Multivariate Data Analysis, 7th ed.; Pearson: London, UK, 2009. [Google Scholar]
- Hu, L.; Bentler, P.M. Cutoff Criteria for Fit Indexes in Covariance Structure Analysis: Conventional Criteria Versus New Alternatives. Struct. Equ. Model. 1999, 6, 1–55. [Google Scholar] [CrossRef]
- Kline, R.B. Principles and Practice of Structural Equation Modeling, 4th ed.; Guilford Press: New York, NY, USA, 2016. [Google Scholar]
- Bagozzi, R.P.; Phillips, L.W. Representing and Testing Organizational Theories: A Holistic Construal. Adm. Sci. Q. 1982, 27, 459–489. [Google Scholar] [CrossRef]
- Bagozzi, R.P.; Yi, Y.; Phillips, L.W. Assessing construct validity in organizational research. Adm. Sci. Q. 1991, 36, 421–458. [Google Scholar] [CrossRef]
- Fornell, C.; Larcker, D.F. Evaluating Structural Equation Models with Unobservable Variables and Measurement Error. J. Mark. Res. 1981, 18, 39–50. [Google Scholar] [CrossRef]
- Chen, L.; Gillenson, M.L.; Sherrell, D.L. Consumer Acceptance of Virtual Stores: A Theoretical Model and Critical Success Factors for Virtual Stores. SIGMIS Database 2004, 35, 8–31. [Google Scholar] [CrossRef]
- Diamantopoulos, A.; Siguaw, J.A. Introducing LISREL: A Guide for the Uninitiated. Sage Publications Ltd., 2000. Available online: https://uk.sagepub.com/en-gb/eur/introducing-lisrel/book205246 (accessed on 24 May 2023).
- Anderson, J.C.; Gerbing, D.W. Structural equation modeling in practice: A review and recommended two-step approach. Psychol. Bull. 1988, 103, 411. [Google Scholar] [CrossRef]
- Bhattacherjee, A. Understanding information systems continuance: An expectation-confirmation model. MIS Q. 2001, 25, 351–370. [Google Scholar] [CrossRef]
- Oliver, R.L. Whence customer loyalty? J. Mark. 1999, 63, 33–44. [Google Scholar] [CrossRef]
- Ramachandran, S.; Balasubramanian, S. Examining the moderating role of brand loyalty among consumers of technology products. Sustainability 2020, 12, 9967. [Google Scholar] [CrossRef]
- Lee, D.; Moon, J.; Kim, Y.J.; Mun, Y.Y. Antecedents and consequences of mobile phone usability: Linking simplicity and interactivity to satisfaction, trust, and brand loyalty. Inf. Manag. 2015, 52, 295–304. [Google Scholar] [CrossRef]
- Ramadan, R.; Aita, J. A model of mobile payment usage among Arab consumers. Int. J. Bank Mark. 2018, 36, 1213–1234. [Google Scholar] [CrossRef]
- Cleff, T.; Walter, N.; Xie, J. The effect of online brand experience on brand loyalty: A web of emotions. UIP J. Brand Manag. 2018, 15, 7–24. [Google Scholar]
- Kim, M.K.; Park, M.C.; Park, J.H.; Kim, J.; Kim, E. The Role of Multidimensional Switching Barriers on The Cognitive and Affective Satisfaction-Loyalty Link in Mobile Communication Services: Coupling in Moderating Effects. Comput. Hum. Behav. 2018, 87, 212–223. [Google Scholar] [CrossRef]
- Yang, Z.; Peterson, R.T. Customer Perceived Value, Satisfaction, and Loyalty: The Role of Switching Costs. Psychol. Mark. 2004, 21, 799–822. [Google Scholar] [CrossRef]
- Bhattacherjee, A. An Empirical Analysis of The Antecedents of Electronic Commerce Service Continuance. Decis. Support Syst. 2001, 32, 201–214. [Google Scholar] [CrossRef]
- Cronin Jr, J.J.; Brady, M.K.; Hult, G.T.M. Assessing the Effects of Quality, Value, And Customer Satisfaction on Consumer Behavioral Intentions in Service Environments. J. Retail. 2000, 76, 193–218. [Google Scholar] [CrossRef]
- Piccolo, L.S.G.; Melo, A.M.; Baranauskas, M.C.C. Accessibility and Interactive TV: Design Recommendations for the Brazilian Scenario. In Proceedings of the Human-Computer Interaction–INTERACT 2007: 11th IFIP TC 13 International Conference, Rio de Janeiro, Brazil, 10–14 September 2007; Part I 11. Springer: Berlin/Heidelberg, Germany, 2007; pp. 361–374. [Google Scholar]
- Google. Designing for TV—Design Principles—Android TV. 2023. Available online: https://tv.withgoogle.com/design-principles/designing-for-tv.html (accessed on 30 May 2023).
- Microsoft. Fluent UI—Styles—React. 2023. Available online: https://developer.microsoft.com/en-us/fluentui#/styles/web (accessed on 30 May 2023).
- WCAG. Web Content Accessibility Guidelines (WCAG) 2.1. 2018. Available online: https://www.w3.org/TR/WCAG21/ (accessed on 30 May 2023).
- Phillips, D.P. The Importance of Branding. CHEMARK Consulting Group. 2006. Available online: https://www.chemarkconsulting.net/the-importance-of-branding/ (accessed on 1 May 2023).
- Hamano, Y.; Nishiuchi, N. Usability Evaluation of Text Input Methods for Smartphone among the Elderly. In Proceedings of the 2013 International Conference on Biometrics and Kansei Engineering, Tokyo, Japan, 5–7 July 2013; IEEE: Piscataway, NJ, USA, 2013; pp. 277–280. [Google Scholar] [CrossRef]
- Microsoft. User Interface Principles. 2022. Available online: https://learn.microsoft.com/en-us/windows/win32/appuistart/-user-interface-principles (accessed on 8 May 2023).
- Lutteroth, C.; Weber, G. User Interface Layout with Ordinal and Linear Constraints. In Proceedings of the 7th Australasian User Interface Conference, Hobart, Australia, 16–19 January 2006; Australian Computer Society: Darlinghurst, Australia, 2006; Volume 50, pp. 53–60. [Google Scholar]
- Nielsen, J. Enhancing the Explanatory Power of Usability Heuristics. In Proceedings of the SIGCHI Conference on Human Factors in Computing Systems, Boston, MA, USA, 24–28 April 1994; ACM: New York, NY, USA, 1994; pp. 152–158. [Google Scholar] [CrossRef]
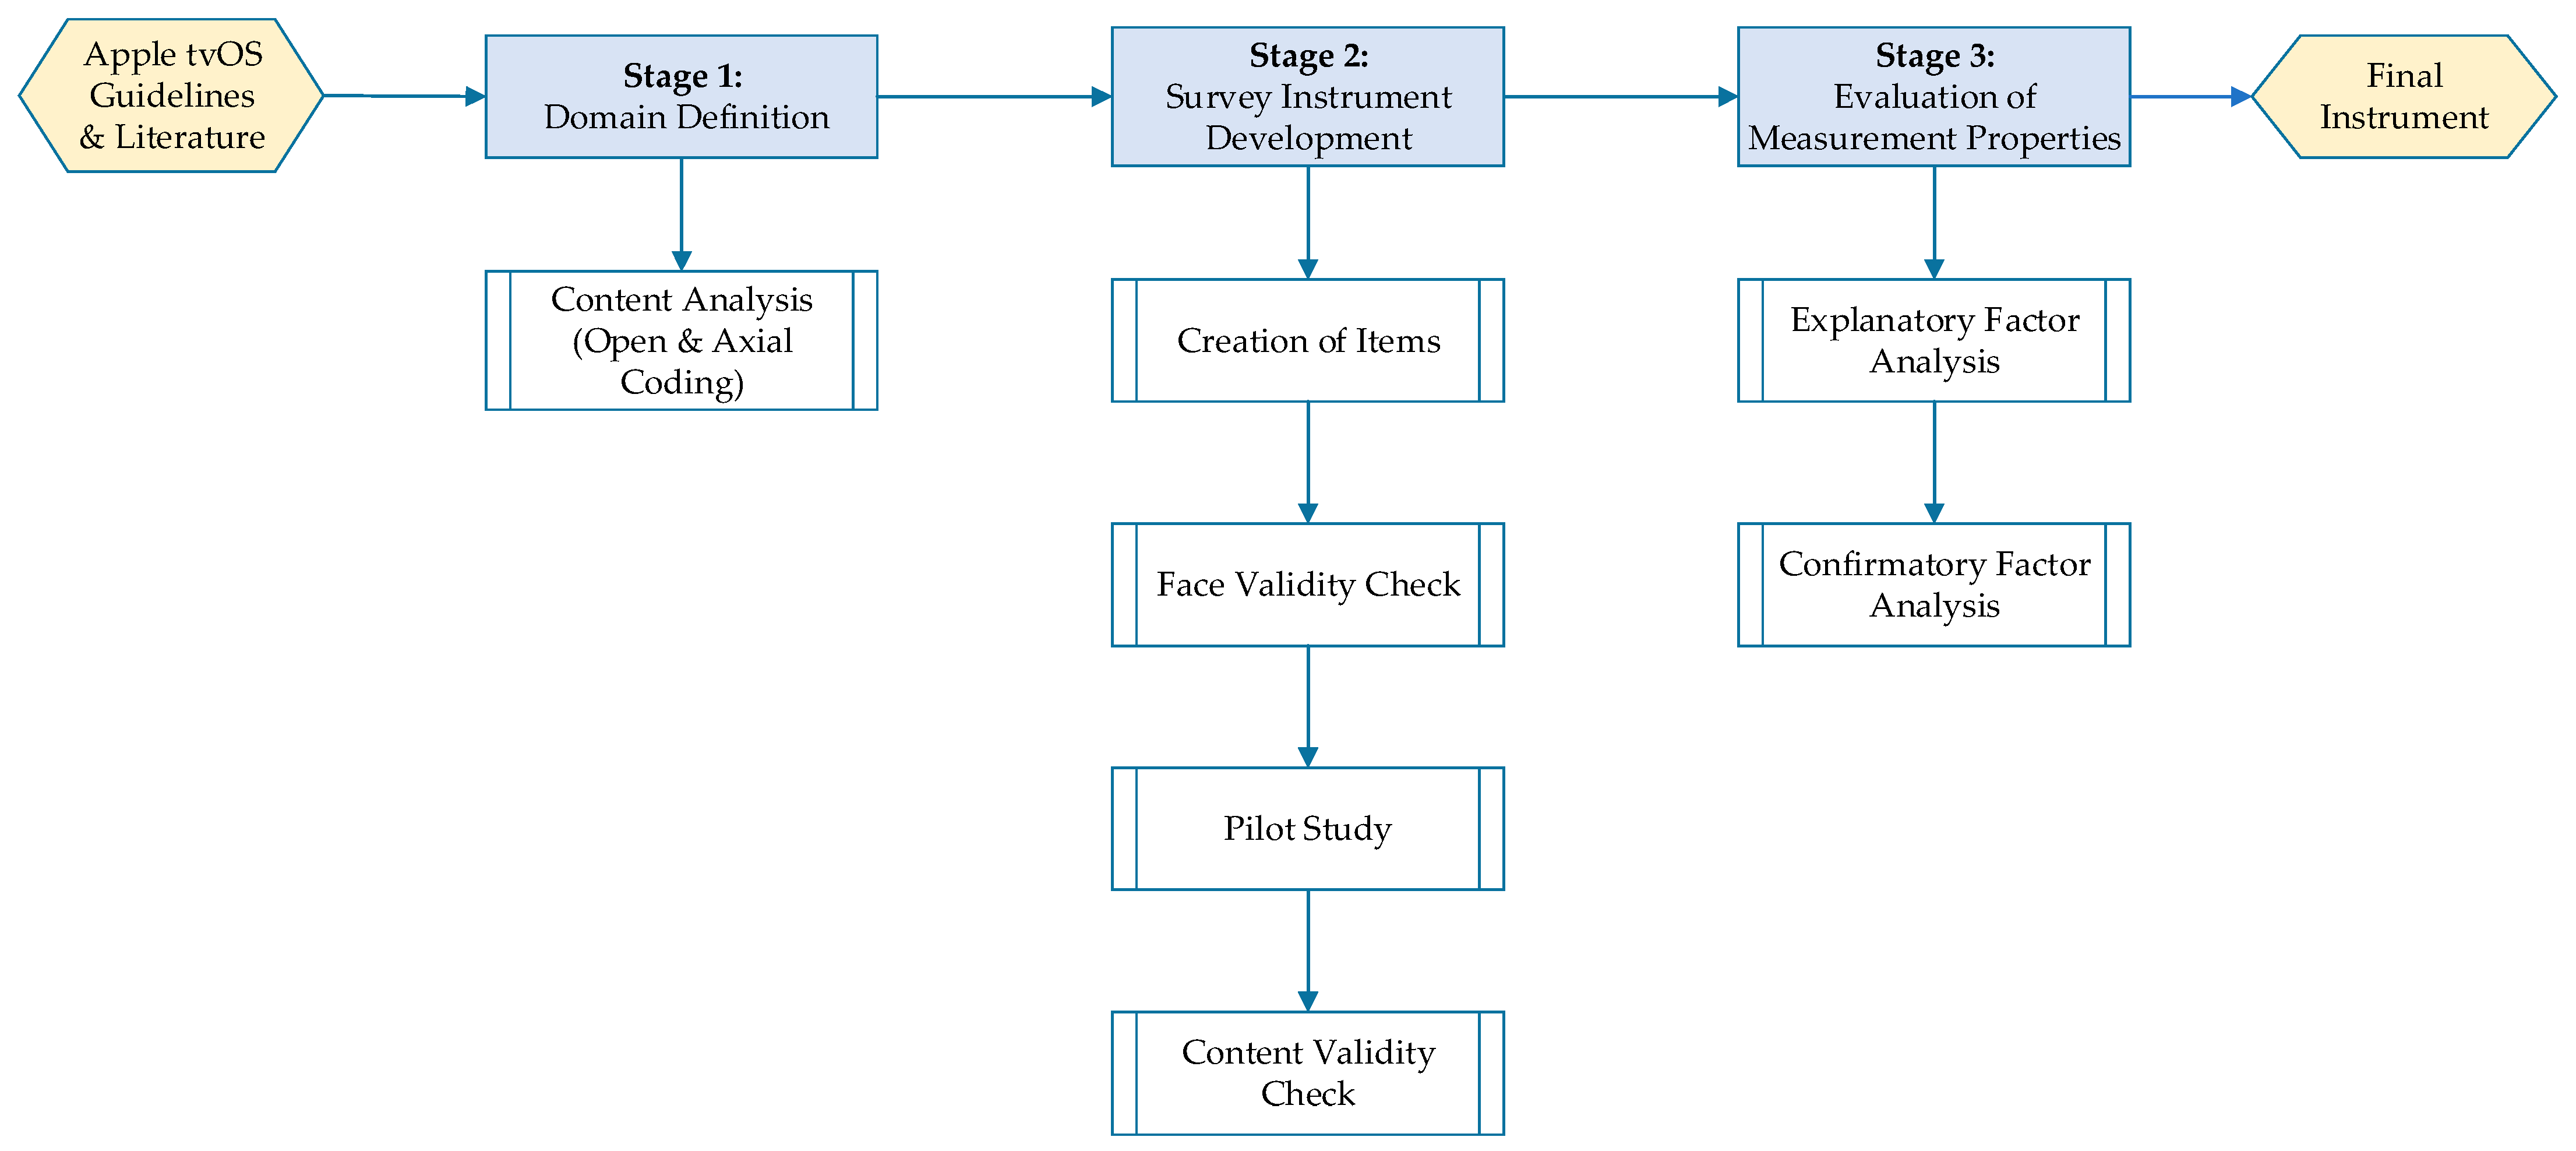
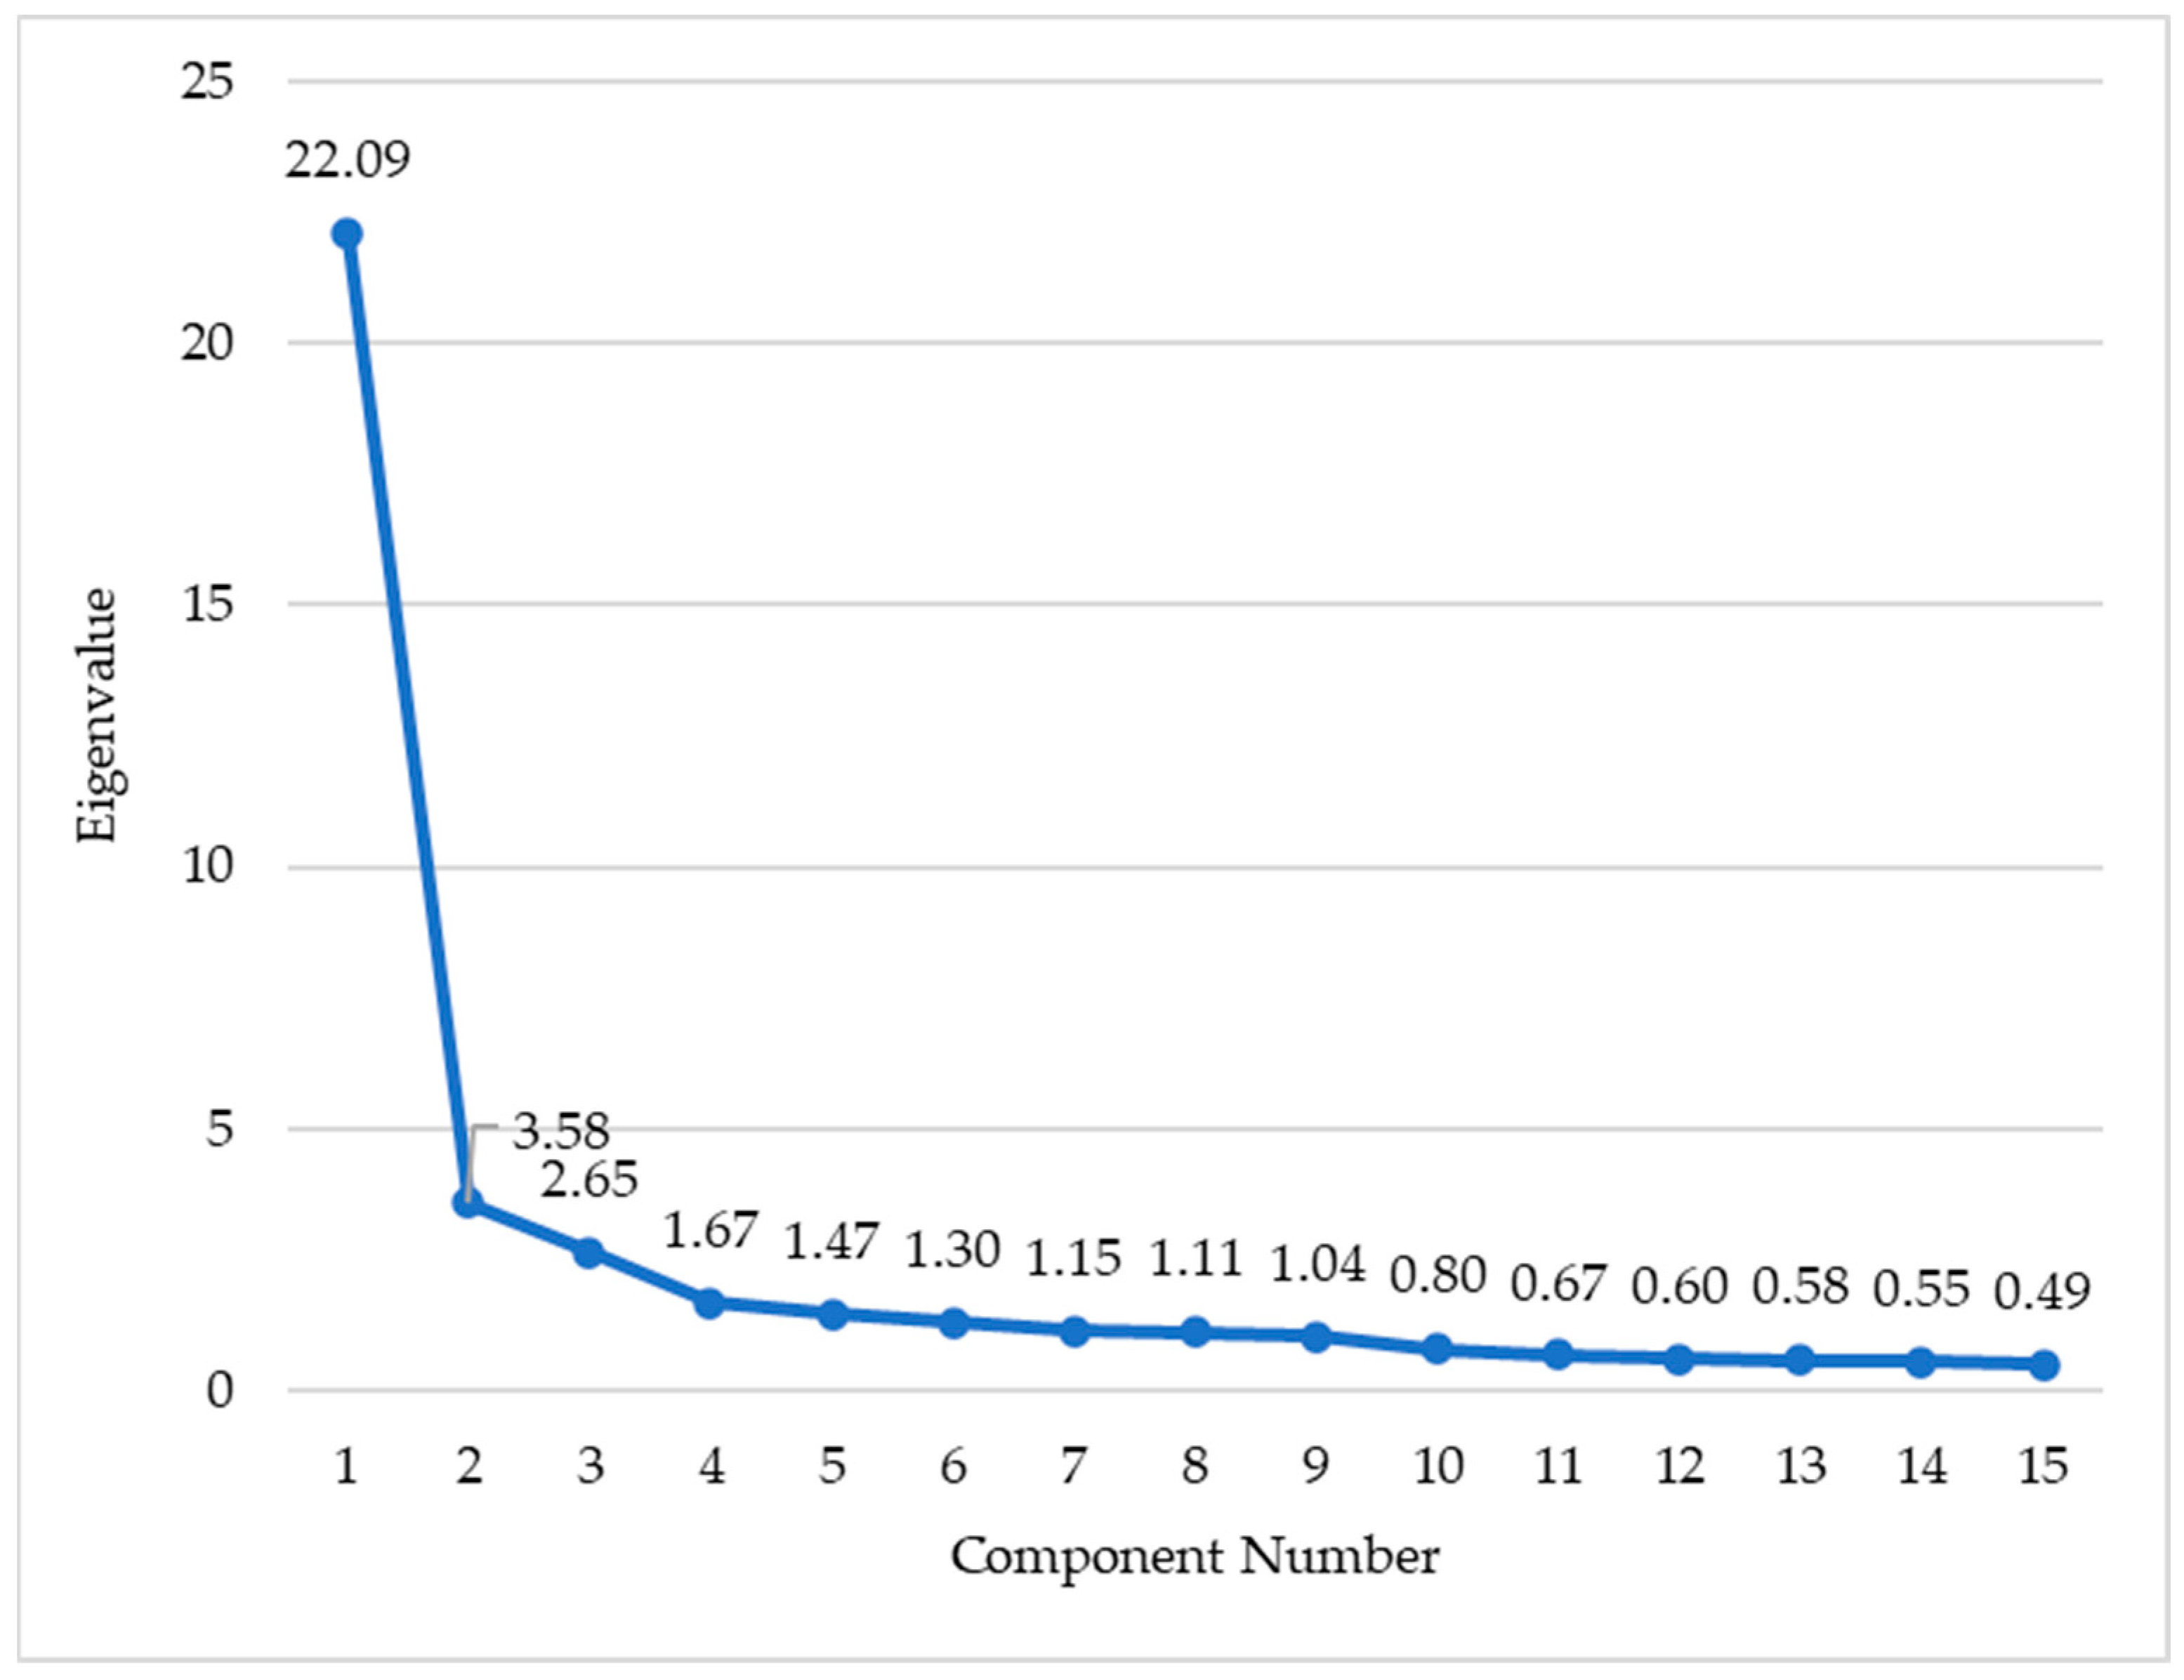
Disclaimer/Publisher’s Note: The statements, opinions and data contained in all publications are solely those of the individual author(s) and contributor(s) and not of MDPI and/or the editor(s). MDPI and/or the editor(s) disclaim responsibility for any injury to people or property resulting from any ideas, methods, instructions or products referred to in the content. |
© 2023 by the authors. Licensee MDPI, Basel, Switzerland. This article is an open access article distributed under the terms and conditions of the Creative Commons Attribution (CC BY) license (https://creativecommons.org/licenses/by/4.0/).