Abstract
In the e-commerce environment, it is very common for consumers to select goods or services based on online reviews from social platforms. However, the behavior of some unscrupulous merchants who hire a “water army” to brush up on reviews of their products has been continuously exposed, which seriously misleads consumers’ purchasing decisions and undermines consumer trust. Until now, it has been a challenging task to accurately detect the “water army”, who could easily alter their behaviors or writing styles. The focus of this paper is on some collusive clues between members of the same social platform to propose a new graph model to detect the “water army”. First is the extraction of six kinds of user collusive relationships from two aspects: user content and user behavior. Further, the use of three aggregation methods on such collusive relationships generates a user collusive relationship factor (CRF), which is then used as the edge weight value in our graph-based water army detection model. In the combination of the graph grouping method and evaluation rules on candidate subgraphs, the graph model effectively detects multiple collusive groups automatically. The experimental results based on the Mafengwo platform show that the CRF generated from the coefficient of variation (CV) method demonstrates the best performance in detecting collusive groups, which provides some practical reference for the detection of “water armies” in an e-commerce environment.
1. Introduction
The development of online trading platforms has made online shopping more common, with an increasing number of consumers choosing to buy the products and services they need online. The theory of consumer risk reduction holds that consumers’ consumption behavior is to find ways to reduce risks. In order to reduce risks, many people will collect as much information about products as possible to increase their understanding of the product. Under the special form of online shopping, a large number of reviews published by other consumers is undoubtedly the most effective way for consumers to understand the product. Therefore, online product reviews on social platforms have become an important reference for consumers when making purchase decisions [1].
In circumstances driven by opportunism, some unscrupulous merchants deliberately mislead consumers by hiring users to manipulate online reviews. These users are actually fake users who make up fake transactions with fake reviews and even have some interactive behaviors with each other. In 2018, Mafengwo, a well-known Chinese social travel platform, pointed out that 18 million of the 21 million comments published were plagiarized from other websites. The comment time of 15,000 accounts was extremely unreasonable, and the plagiarism rate was as high as 85%. The fake review problem was subsequently acknowledged [2]. In recent years, these fake users have gradually shown the characteristics of grouping and concealment, that is, multiple people secretly collude with each other and try to control the evaluation of the target product. This kind of group of people is usually called the “e-commerce water army” [3] or “review spammer groups” [4]. According to Chen et al. [5], the “Internet water army” refers to a specific group of users employed by interest organizations or individuals to post purposeful comments and articles on the Internet. Compared with individual spammers, the e-commerce “water army” has greater negative effects and more destructive effects. They rely on social networks to form groups and create fictitious business transactions, which not only bring great trouble to consumers when shopping online but also reduce consumers’ credibility of product brands and disrupt a fair and orderly e-commerce environment. First of all, for the platform, the water army will greatly damage its reputation and reduce its credibility. For example, the above-mentioned Mafengwo platform has been criticized for its false reviews. Secondly, for shops, the water army will cause opportunistic shops to get bonuses while honest merchants have mediocre incomes. Consequently, herd and comparison mentalities will cause shops that originally stuck to the bottom line to fall. Finally, for users, the water army will reduce the user’s ability to judge when shopping and disrupt the user’s purchase decision. Therefore, with such dire consequences, it is particularly important to adopt corresponding intervention strategies to effectively detect water army.
In related research, the usual method is to use graph-based models to detect internet spammers or review spammer groups. The main idea is to create a user relationship graph with users as nodes and determine the edge weights between nodes based on suspicious relationships between users. Different grouping methods are employed [1,6,7,8,9,10] subsequently to excavate candidate water army groups from the graph, and then such candidate groups are sorted to obtain the final result according to some evaluation metrics. For example, Wang et al. [1,6] find k-connected sub-graphs in a user relationship graph recursively as candidate review spammer groups. Similarly, Xu et al. [7] and Wang et al. [8] also adopt CPM and LDA methods, respectively, to identify candidate review spammer groups in a user graph. Generally, the focus of current research is to find review spammer groups from the graph structure after the user relationship graph is built, neglecting the comprehensive analysis and refinement of the collusive relationships between users, which are important clues to the existence of the “water army” on social platforms. Additionally, collusive relationships refer to a group of people who cooperate to publish deceptive reviews to manipulate the reputation of the target product [11], which is the premise and basis for building a user relationship graph model. The reason is that the edge weights between nodes in a user relationship graph are mainly reflected by the collusive relationships between users. Therefore, the collusive relationships between users, when fully examined, will directly affect the accuracy of the final performance of water army group detection.
Currently, some studies have tried to extract collusive relationships between users from the metadata of user reviews, such as rating, review time, or product consistency [6,7,8,9,10,11]. Among them, Wang et al. [6,8] considered the user review time difference and rating difference when building the user relationship graph and, based on this, defined “co-review collusiveness,” which is used to describe the degree of user collusion. Xu et al. [7] considered the review time interval and rating deviation, gave a set of calculation methods, and then established a suspicious reviewer graph. Additionally, Ye et al. [9] extracted multiple interactive behavior indicators and user behavior indicators to establish a weighted graph. The number of common comments, rating of similarity, etc., are considered. Similarly, Zhang et al. [10] also consider the number of common comments and rating similarity to construct a weighted graph. Xu et al. [11] considered target consistency, rating consistency, activity consistency, etc. to obtain the collusion relationship between users. This shows that user interactive behavior indicators can be examined to serve as edge weights to mine user collusive relationships. Although these researches indicate that there are some important complicity clues of fake users reflected in user content and user behavior, as far as we know, has started to analyze collusive relationships of the “water army” in an e-commerce environment from such two aspects. Thus, it provides some enlightenment for us to fully mine collusive relationships between users from such two aspects.
On the basis of the above analysis, current research has identified the following gaps in the water army identification problem: (1) Most studies focus on the identification method after the user-weighted graph is established but ignore the influence of the edge weight setting method on the final result when the user-weighted graph is established. In other words, there is currently no research that discusses the effect of water army recognition under different edge weight settings. (2) Most studies only consider a few indicators to measure the collusion relationship between users, and no research has conducted a comprehensive analysis and refinement of the collusion relationship between users.
Therefore, in order to make up for the above deficiencies, this paper focuses on the problem of weight setting when establishing a user-weighted graph in the process of water army identification. First, in view of the fact that user collusive relationships have an important impact on the results of e-commerce water army detection, this study focuses on the identification and extraction of multiple collusive relationships among users. Six kinds of user collusive relationships are first proposed from the aspects of user content and user behavior. Firstly, the popular pre-trained model of Bert (Bidirectional Encoder Representations from Transformers) is used to explore whether the content semantics between users are collusive. Secondly, in order to effectively utilize these identified multiple user collusive relationships into a user graph model, this paper introduces for the first time three methods, including the mean method, the entropy weight method, and the variation coefficient method, to generate the collusive relationship factor (CRF) between users as the edge weights to build a user collusive relationship graph model. In combination with the graph grouping method and comprehensive evaluation rules to rank candidate sub-graphs, good results are achieved in the task of water army detection on the Mafengwo platform.
2. Related Work
In the existing research, the detection methods of e-commerce water army or review spammer groups can be divided into three categories: based on user content or behavior characteristics, based on group structural characteristics, and combining user behavior and structural characteristics.
The detection methods based on user content or behavior characteristics assume that users with some peculiar behaviors increase the probability that they belong to the “water army”. Lim et al. [12] believe that users in the same group are more likely to post reviews with the same rating on their products within a short time of the product release and that there is a rating bias among normal users. In addition, Xu et al. [13,14,15] point out that users in the same group will tend to be similar in behavioral characteristics and text characteristics, such as the similarity of reviewers’ ratings or content semantics on the same product and the deviation of the review’s published time. Guo et al. [16] designed a comprehensive set of features to compare the water army against normal users on different dimensions and built an ensemble detection model to find the water army. Further, Ji et al. [17] focused on product rating distribution, proposed a method called GSDB (Group Spam Detection Algorithm Based on Review Burst), and confirmed the effectiveness of the method. Hussain et al. [18] proposed the Spam Group Detection (SGD) method, which identifies suspected spam groups based on the similarity of the activities of all reviewers, taking into account their review time and rating. The results show that the proposed methods outperformed the existing approaches when compared in terms of accuracy. Liu et al. [19] analyzed the behavioral characteristics of users and used the user2vec algorithm to represent users as vectors to identify the user population. In addition, the field of water army recognition is also diverse. For example, Zhang et al. [20] proposed a multi-view feature expression and recognition model for cultural products and designed the model according to the unique characteristics of the cultural product field. Wang et al. [21] focused on Weibo and used different feature extraction methods to design methods to identify Weibo’s water army. In this type of method based on user content and behavior characteristics, when studying water army detection problems, researchers often focus more on the differences between water army and normal users in some behaviors or comment content. They regard each user as an independent individual without considering the possible internal connection between users, that is, they seldom consider the group characteristics of the water army. Consequently, some researchers began to identify water army groups from user structural characteristics based on the relationship between users.
The detection method based on group structure features obtains the network connections between users, reviews, and products. Mukherjee et al. [22,23] use the frequent itemset mining method to obtain the network between users and commodities so as to find candidate groups and establish a ranking model to obtain the final groups. Akoglu et al. [24] rank fake reviewers through the network effect between reviewers and products and obtain review spammer groups by clustering the induced sub-graphs of fake reviewers and corresponding products. Additionally, Ye et al. [25] propose a Network Footprint Score (NFS) to explore the abnormality of the behavior of reviewers and use the GroupStainer algorithm to cluster review spammer groups. Yu et al. [26] establish connections among users, groups, and merchants, calculate the group false degree through the iterative relationship between the three, and obtain spammer groups after sorting. Zhang et al. [27] improve FIM and unsupervised ranking methods and propose an identification method for reviewing spammer groups based on cosine patterns and heterogeneous information networks. Rukari et al. [28] used frequent item mining (FIM) to extract candidates from the spammer community and then used PU-Learning to identify actual spammer groups from these candidates. Li et al. [29] proposed a framework to discover the overlapping community from the emotional social network and detect “water armies” in communities. Soni et al. [30] performed the hyperparameter optimization of various unsupervised deep learning algorithms, such as self-organizing maps and restricted Boltzmann machines, on the reviewer graph data, and the experimental results showed that the projected method can detect the group of fake reviewers with reasonable accuracy. Furthermore, Li et al. [31] proposed a reviewer suspiciousness ranking algorithm based on community discovery and TrustRank. On the basis of the supernetwork theory, Jothi et al. [32] proposed a model for detecting “water army” and demonstrated its effectiveness. In summary, this detection method based on structural features is essentially designed to discover water armies from the graph structure or network structure. The focus on the associations between users can effectively identify user groups with collusive relationships. However, this method also has a problem. Ordinary users sometimes have group characteristics. For example, some users with similar interests are often very similar in the graph structure, but these users do not meet the definition of a “water army.” In this case, it seems that only focusing on structural features cannot meet the requirements. At this time, it is necessary to comprehensively consider both user behavior features and structural features.
The detection methods that combine group behavior and structural features are the most common in current research. The idea behind this method is to design and construct a graph based on the behavioral characteristics of suspicious groups and to identify spammer groups on the new network. Choo et al. [33] construct a user relationship graph through the interaction between users and further discover groups through the emotional relationships in the user interaction process. Li et al. [34] construct a graph based on user behavior characteristics, using the method of graph clustering to identify review spammer groups. Zhang et al. [10] construct a user relationship graph by correlating the behavioral characteristics of each user and using the Louvain community discovery algorithm to obtain final groups. In addition, after identifying fake users, Cao et al. [35] use the hierarchical clustering method to obtain review spammer groups based on the indicators of user collusion awareness. Similarly, Xu et al. [7] and Wang et al. [8] use the CPM and LDA methods to identify candidate groups, respectively, after mining user collusive relationships to construct a user-weighted graph. Thahira et al. [36] extracted features from metadata and proposed a framework based on these features. In combining metadata and structural features, the method shows good results. He et al. [37] proposed a semi-supervised approach combining network structure features and user attribute features for identifying the Internet “water army.” This method uses the graph embedding algorithm to obtain the user’s network structure features, which together with the defined user attribute features constitute the detection feature set. Results showed that the accuracy can reach 95.15%. According to the results of previous experiments, this method of combining group behavior and structural features is more comprehensive and can often achieve better results than the previous two methods. As a result of this, this kind of method begins to receive the attention of numerous researchers.
The above-mentioned research provides an important reference for “water army” detection in the e-commerce environment, but there is still some room for improvement. Firstly, current research in e-commerce water army focuses more on identifying collusive groups from the graph structure after the user relationship graph is constructed, making the structure feature of sub-groups, not the user collusive relationships, the focus of this type of research. Secondly, the clues in user review content are less concerned by the existing literature. Although some studies have used some text features before constructing the user relationship graph, most of them focus on the metadata features such as review time and review rating. The clues related to content semantics have not been fully explored. Finally, most of the researches analyze the relationships between users from the single aspect of user content or user behavior, not a combination of examining these two aspects. Further, the methods to comprehensively infer multiple collusive relationships between users and how to aggregate these collusive relationships into a user relationship graph have not yet been deeply explored.
Therefore, in order to make up for the above deficiencies, this paper defines six kinds of user collusive relationships from the two aspects of user content and user behavior. On the one hand, it was inferred that the published review content and review metadata from some users are highly consistent, such as similar text semantics, the same rating, and a close review time. On the other hand, the examinations carried out on the behaviors of some users are highly consistent on the same online platform, such as reviews of the same product, similar interactive behaviors, or the activity time-span. Further, three aggregation methods, including the mean value method, the entropy weight method, and the coefficient of variation method, are employed, respectively, to quantify the degree of collusion between users, which is called the “user collusive relationship factor” (CRF). In addition, the user CRF is applied to serve as the edge weight between two nodes in a user collusive relationship graph, which is subsequently divided into multiple connected candidate sub-graphs according to the edge weights. Lastly, combined with the graph clustering method and the comprehensive evaluation rules employed on the candidate sub-graphs, the final review of the water army groups is effectively obtained.
The remainder of this research is organized as follows: Section 3 describes the research framework and discusses the extraction process of user-collusive relationships. Additionally, Section 4 presents the building for the user graph and sub-graph grouping method in detail. Section 5 discusses the experiment setup and the research results. Last, Section 6 provides the conclusions and limitations of the research.
3. Methodology
3.1. Basic Procedure of the Proposed Framework
In conducting an integrated interpretation framework for this research, a subdivision procedure was conducted into several major parts, as shown in Figure 1.
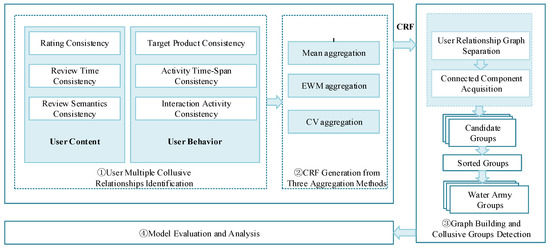
Figure 1.
Overall Design.
The research is mainly composed of four parts: ① user multiple collusive relationship identification; ② CRF generation from three aggregation methods; ③ graph building and candidate detection; ④ model evaluation and analysis.
3.2. User Multiple Collusive Relationships Identification
The construction of multiple collusive relationships among users from the perspectives of user content and user behaviour was performed. Additionally, for the convenience of calculation, the value of each collusive relationship is defined between 0 and 1; that is, the closer the value is to 1, the stronger the collusive relationship. It should be noted that even if the value of a single collusive relationship is large, it does not mean that the collusive relationship between two users will be strong because there may be the influence of accidental factors.
Therefore, we comprehensively consider the weights of multiple collusive relationships to generate a collusive relationship factor (CRF) to reduce chance.
3.2.1. Collusive Relationships from User Content
The users in the same group often have similarities in the review content, which is manifested in the consistency of ratings [6,9,10,24], review time [6], and review semantics for the same product.
- Rating Consistency (RC)
Due to the nearly identical ratings of the product, it was inferred that the consistency in the ratings of two users for the same product largely reflects whether the two users have a collusive relationship. Therefore, we propose the first indicator as rating consistency (RC), which is calculated as Equation (1).
where represents the set of products reviewed by users and , represents the rating of product by user , and represents the rating of product by user . In the case that a user has commented on a product multiple times, the will be the average of the multiple ratings. Usually, online reviews adopt a 5-point rating system, so the users’ rating range is a maximum of 4. Thus, we normalize Equation (1) with a constant value of 4.
- Review Time Consistency (RTC)
The review behavior of the “water army” tends to focus on a specific time period; as a result, we infer that the closer the review time of two users on the same product is, the stronger the collusive relationship between the two users. Further, we proposed the second indicator as review time consistency (RTC), which is calculated by Equation (2).
where represents the review time of user on product , represents the review time of user on product , is a threshold set by data heuristics, and represents the set of products reviewed by users and . If a user has reviewed a product multiple times, the two reviews with the smallest time interval are used for calculation. In , it is set as the maximum value of the average review time interval between users (after removing outliers).
- Review Semantics Consistency (RSC)
The two users who have a collusive relationship and comment on a specific target product usually follow a uniform review template or make slight modifications to the reviews posted by the other people. Therefore, we infer that the more similar the users’ reviews of the same product are, the stronger the collusive relationship between them.
According to the current research status of text semantic understanding, traditional text vectorization methods such as the TF-IDF model or Bag-of-Words model make it difficult to mine the semantic information of colloquial reviews. Although Word2Vec, which is commonly used in deep learning, has achieved good results in semantic similarity calculation, its shortcomings are also relatively obvious. For example, the generated word vectors are fixed, which makes it difficult to deal with polysemy in online reviews and understand contextual information well. Recently, BERT (Bidirectional Encoder Representation from Transformers), a pre-trained language representation model, has gained a lot of attention from both industry and academia. As an important breakthrough in the NLP (natural language processing) field in recent years, the BERT model has achieved optimal results in multiple natural language processing tasks. In particular, the BERT model can assign different word vectors to the same word according to the context of the word in different sentences and can obtain deeper semantic information. Therefore, this paper uses the pre-trained BERT model released by Google to generate BERT sentence vectors, which are used to represent user reviews and measure the semantic consistency of review content. Consequently, we propose the third indicator as Review Semantics Consistency (RSC), which is calculated as Equation (3).
where represents the set of products commented on by users and , and , represent the BERT sentence vector of the reviews on product p by users and respectively. If a user has commented on product p multiple times, the sentence vector that maximizes the cosine similarity is taken. Additionally, the average cosine similarity of the two users to the common products is taken as the final value of RSC.
3.2.2. Collusive Relationships from User Behaviour
Generally, users in the same group show behaviour consistency in the target product [6,9,10,12], activity time span, and interaction activity due to their group characteristics.
- Target Product Consistency (TPC)
Due to the fact that users in the same group tend to collectively comment on the same target product in order to improve or reduce the reputation of the target product, we infer that the more common the comments are on a product, the more likely they are collusive. Therefore, we use the ratio of the intersection and union of the products reviewed by the two users, which is denoted as TPC, as a measure of the consistency of the two users’ target products in Equation (4).
where and represent two different users, and and respectively represent the product sets reviewed by them. The larger the TPC, the stronger the collusion between the two users.
- Activity Time-Span Consistency (ATC)
Severally, the users in collusive groups tend to have a lot of activity within a similar time span (from start time to end time), and the activity intensity decreases outside this time span. Therefore, we infer that the consistency of the time span of two users can reflect the collusive degree between their activities to a certain extent, which is represented as ATC in Equation (5):
where (or ) and (or ) respectively represent the time when the user (or ) posted his first review and his last review. is the threshold set heuristically based on the experiment data, and the setting method is the same as that of . It is set as the maximum value of the time span between users. The indicator of ATC reflects that the closer the time span between two users posting reviews, the stronger their collusive relationship.
- Interaction Activity Consistency (IAC)
Intuitively, the interaction activity of users in the same collusive group tends to be consistent, showing very similar characteristics in some common interactive behavior features, such as user activity level, number of followers, number of fans, number of questions, number of answers, number of comments, number of visits, etc. Therefore, we put forward the interaction activity consistency (IAC) indicator of two users to measure their similarity in their interactive behaviors in Equation (6):
where or respectively represent a vector composed of the feature values of one user ( or ) listed above in italics. As a result, the cosine similarity is used to measure the consistency level of the interaction activity of the two users.
In summing up the total proposed six kinds of collusive relationships among users based on user content and user behavior, two aspects as shown in Table 1.

Table 1.
User Multiple Collusive Relationships.
3.3. CRF Generation
In the six collusive relationships proposed above, an aggregate is calculated to obtain the user collusive relationship factor (CRF), which is the focus of this paper. Due to the diversity of datasets, the importance of each collusive relationship may vary. For example, if the time span of a dataset is short, the RTC value (the review time consistency) between pairs of users will not be much different, making the indicator not effectively distinguish the extent of the user’s collusive relationship. Hence, it is necessary to design a weight calculation method to consider the degree of contribution of the six collusive relationships. In this regard, this paper uses three aggregation methods, including the mean value method, the entropy weight method, and the coefficient of variation method, to calculate the weight of each collusive relationship and uses their weighted sum as the measure of CRF. The pros and cons of different methods will be explored in Section 5.
3.3.1. Mean Value Method
The mean value method treats different collusive relationship equally, and takes the mean value of each relationships as the edge weight in the user-weighted graph. This method is also adopted in [9]. It means if there are collusive relationships, the weight of the jth collusive relationship is calculated as Equation (7):
3.3.2. Entropy Weighted Method
Entropy is a concept in information theory that can measure the chaotic degree of information. The larger the entropy, the more chaotic the information, and the less the amount of information provided. Additionally, by measuring the degree of confusion in each collusive relationship, their importance when constructing edge weight can be determined so as to effectively combine various collusive relationships. Further, the complete calculation of the value of each collusive relationship between users is carried out, assuming there are user pairs and collusive relationships (s = 6 in this paper). Use to represent the value of the jth collusive relationship of the ith user pair, and to represent the set of jth collusive relationships of all the user pairs. The steps to determine the weight by the entropy weight method are as follows:
- Normalization of collusive relationship value
- Calculate the proportion of the jth collusive relationship of the ith user pair
- Calculate the entropy value of the jth collusive relationship
- Determine the weight of each collusive relationship
3.3.3. Variation Coefficient Method
The coefficient of variation can measure the dispersion degree of a set of data. The larger the coefficient of variation, the more scattered the data, the more information it contains, and the greater the weight. The coefficient of variation excludes the influence of data dimension and can be used to compare the degree of dispersion of different groups of data. In this regard, by calculating the coefficient of variation of each collusive relationship, it is also possible to determine their importance and obtain the edge weights when constructing a user-weighted graph. The steps to determine the weight by the coefficient of variation method are as follows:
- Calculate the coefficient of variation for each collusive relationship.
- The coefficient of variation is normalized to obtain the weight of each collusive relationship
3.3.4. Aggregation
Additionally, after obtaining the weight of each collusive relationship through the above methods, the weighted summation was used to get three aggregate results of the six collusive relationship factors (CRF) as shown in Equation 14:
where represents the first collusive relationship degree between user and user , represents its weight of in the total of six collusive relationships. Other relationship calculations follow the same pattern.
4. Collusive Relationships Graph Building and Collusive Group Detection
4.1. Collusive Relationship Graph Building
Further, we construct a graph, denoted as , based on user multiple collusive relationships, with the users as nodes and CRF as the edge weights of nodes. Specially, , which is the set of candidate users; , which is the edge set. If two users and have commented on the same product, an edge is added between the two, and edge weight is computed with CRF, which is represented as Equation (15):
The simple schematic diagram is shown in Figure 2.
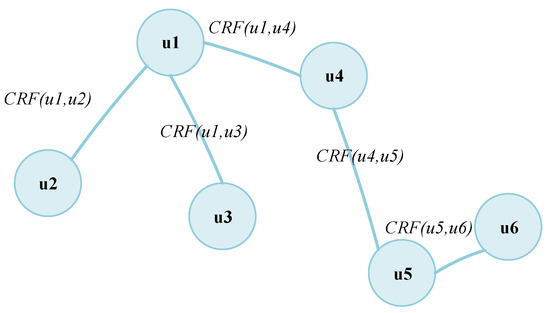
Figure 2.
Simple Schematic Diagram of User Collusive Relationship Graph.
4.2. Collusive Groups Detection
4.2.1. Evaluation Metrics
The evaluation metrics used by our predecessors to evaluate the collusive relationship model effectively and detect the water army group were followed. In related research, Wang et al. [6] have designed eight metrics to measure the performance of their graph model in identifying fake user groups. The article will continue to use these eight metrics.
Additionally, considering that in some large-scale user groups (sub-graph), only a small number of users have the same target products (comment on the same product), and most users have few or no products in common, existing evaluation metrics cannot evaluate such an unbalanced sub-graph well. As a result, a new metric was added, denoted as PN, to measure the average frequency of occurrences of each product in the group, which is shown in Equation (16):
where represents the number of times the product is commented in the sub-graph , and represents the product set in the sub-graph . The larger the PN value, the more times each product appears in the sub-graph. That means the users in the sub-graph are more inclined to buy the same product, so their collusive relationship is more suspicious.
Hence, we use a total of nine metrics to evaluate the performance of our collusive relationship graph model. All the metrics and their descriptions are listed in Table 2 below.
Table 2.
Collusive Group Evaluation Metrics.
The implications and calculation method of the first eight metrics in Table 2 can be found in the literature [6]. After calculating each metric, we further standardize each metric between 0 and 1. The standardized results demonstrate that the closer the metric value is to 1, the more fake the group is.
4.2.2. Collusive Groups Detection Process
The flowchart of the e-commerce water army detection task is designed by combining the user collusive relationship graph with the candidate group evaluation metrics, as shown in Figure 3.
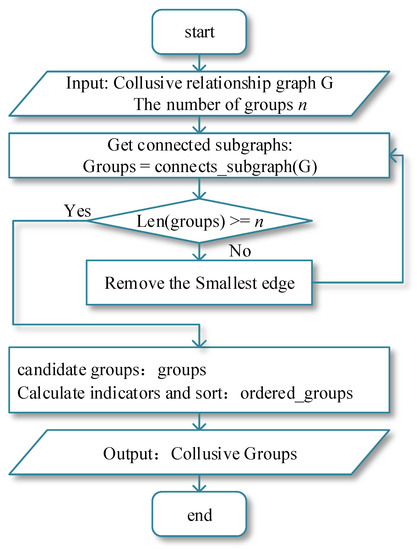
Figure 3.
Collusive Groups Detection Flowchart.
The inputs are the user collusive relationship graph G and the number of collusive groups to be identified n, and the output is the list of collusive groups, which is arranged according to the collusive degree of the groups. The main task of dividing collusive groups is mainly divided into the following three steps:
- Obtain the connected sub-graphs in the graph G.
It is mainly executed by judging whether the number of connected sub-graphs meets the number of required groups. If the requirements are not met in the graph G, delete the edges in the graph G according to the edge weights until the requirements are met.
- Obtain multiple candidate collusive groups
After the previous step, the connected components in the graph G are obtained. Then the user nodes contained in each connected component are treated as a candidate collusive group. Hence, multiple connected components in the graph G will transform to multiple candidate collusive groups.
- Obtain the final collusive groups.
For each candidate collusive group, calculate the metrics in 4.2.1 and sort each group according to its comprehensive performance on the nine metrics to obtain the final collusive group.
5. Experimental Study
5.1. Datasets and Experiment Setup
This paper uses the Mafengwo platform as the experimental data source (https://www.mafengwo.cn/, accessed on 7 October 2021). Mafengwo is a well-known online self-service travel platform in China that provides guide routes, city profiles, travel notes, and hotel reviews. Not only that, Mafengwo also provides some common user social functions, such as following someone, becoming a fan of someone, asking someone a question or answering a question, etc. Therefore, the Mafengwo platform is a typical travel platform with social attributes.
The data was collected from four first-tier hotels in the cities of China, such as Beijing, Shanghai, Guangzhou, and Shenzhen, as our experimental data, including 13,551 hotels, 1829 users, and 102,788 reviews. In considering that there are no publicly available datasets for fake user groups, we follow prior research to build a label set on the experimental data. Three professionals were invited to label the data to determine whether the users belonged to review spammers, and the labeled users are the focus for mining collusive groups. The determination of whether a user is suspicious or not is a complex task for humans, which usually requires collecting a large amount of relevant information and comprehensively judging various aspects. In order to ensure the accuracy of the annotation, we referred to the practice of [38]. An annotator with a series of relevant items was provided, such as the URL of the user’s homepage, the text of the user’s reviews, the hotels reviewed by other users, and the reviews of other users in the hotels. Concurrently, in order to standardize this complex judgment process, the labelers reached an agreement to follow the seven main rules listed in Table 3 below and completed the data labeling work on the basis of these rules.
Table 3.
Labeling Rules.
According to the principle of majority voting, for a user, if at least two annotators think it is a suspicious user, it is marked as 1, otherwise it is marked as 0. Finally, 279 suspicious users out of 1829 users have been marked. By performing the Cohen-Kappa test on the labeled results, the average Kappa of the paired annotation results reached 86.65%, which shows that the consistency of the annotation results is ideal. In the end, the experimental data contains a total of 279 users, 7931 hotels, and 16,734 reviews.
In the experiment setup for semantics calculation and data processing, our configuration is as follows:
- Language: python = 3.6.2;
- Packages: torch = 1.9.0, transformers = 3.4.0;
- Compile platform: Google Colab;
- Pretrained model: chinese_L-12_H-768_A-12;
Transformers is an open-source deep learning framework provided by Huggingface. It supports almost all pre-trained models of the Transformer architecture and is very convenient to use. Based on this framework, this paper uses the BERT model to obtain vector representations when computing semantic similarity.
Further, after calculating the value of each collusive relationship between users, the descriptive statistical analysis of each collusive relationship (before normalization) is shown in Table 4.
Table 4.
Descriptive Statistical Analysis.
Further, we reveal the intensity distribution of various collusive relationships among users by drawing a box plot as shown in Figure 4.
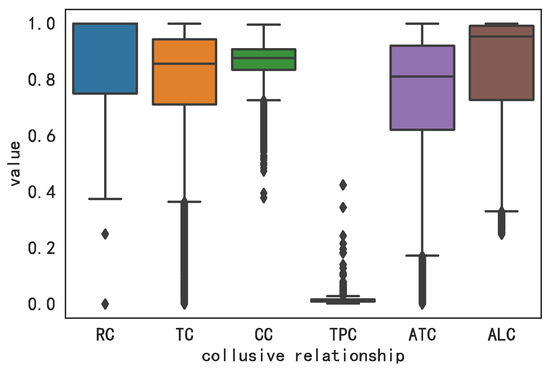
Figure 4.
Boxplot of Collusive Relationships.
It can be observed that in each collusive relationship, there are a certain number of outliers, indicating there may be collusion among them. The preliminary analysis result shows that our experiment data is suitable for our research.
5.2. Detection Results of Collusive Groups
5.2.1. Detection Results on Three Aggregation Methods
The mean method, the entropy weight method, and the coefficient of variation method, respectively, have been used to aggregate the CRF between users as described in Section 4.2.2 First, a demonstration of the collusive group identification results under different aggregation methods was conducted. This paper heuristically sets the n value of the number of collusion groups to 20. The collusive groups obtained under three different methods are shown in Figure 5a–c below.
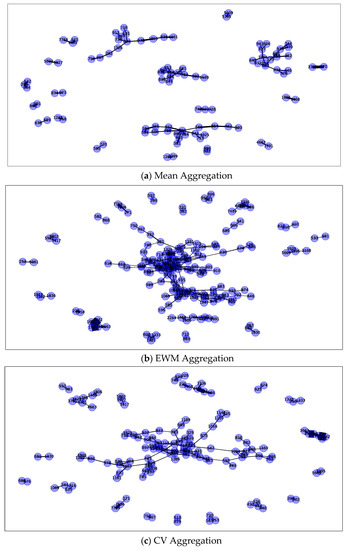
Figure 5.
Collusive Groups.
As shown in Figure 5, the nodes connected together in the figure belong to the same group. The thicker the edge between the nodes, the larger the collusive relationship factor. Comparatively, it can be seen that the group size obtained by the mean method is the smallest, while the entropy weight method and the coefficient of variation method can obtain large groups. Meanwhile, there are obviously a few groups with a large CRF that can be identified in the latter two.
5.2.2. Consistency of Detection Results
Further, in order to explore the consistency of the results under different methods, we count the number of the common collusive groups and the number of the same users obtained by the three methods, which are presented in Table 5a,b below.
Table 5.
Results Consistency.
In Table 5a, , , and represent the collusive relationship graph model established by the mean value method, the entropy weight method, and the coefficient of variation method, respectively. It can be seen that , , and , have 4 identical groups, respectively, while and do not contain the same groups, which means that among the twenty groups identified by , eight groups can be verified using other methods, implying that the collusive groups obtained by the model are more comprehensive.
In addition, as shown in Table 5b, 89 of the 95 users obtained by can be found in the other two models, and 131 of the 134 group users obtained by can be found in the model. It can be seen that the users obtained by the model are also richer and more comprehensive.
5.3. Results Evaluation
5.3.1. Based on Metrics Evaluation
Wang et al. [1,6] used the method of drawing the cumulative distribution function diagram of the group on each metric when evaluating the performance of the identified review spammer groups. As pointed out by Wang et al., the closer the curve is to the vertical axis, the smaller their metric values will be, so the cumulative distribution function diagram can intuitively reflect what proportion of the groups appear in which value range. Therefore, this paper also uses the cumulative distribution function to evaluate the model.
In order to evaluate the identification effect of collusive groups under different calculation models of CRF, we first calculate each value of the nine metrics (refer to Section 4.2.1) of the collusive groups identified under the three models, respectively.
In addition, the values of these nine metrics are integrated by taking the mean value (mean), the entropy weight method weighting (ewm), and the variation coefficient method weighting (cv), thereby obtaining three kinds of evaluation scores of group effectiveness. Further, we plot the cumulative distribution function diagram of the evaluation score as shown in Figure 6 below, where Figure 6a–c represent the cumulative distribution function (CDF) of the three evaluation scores, respectively, corresponding to the three models’ performances of , and respectively.
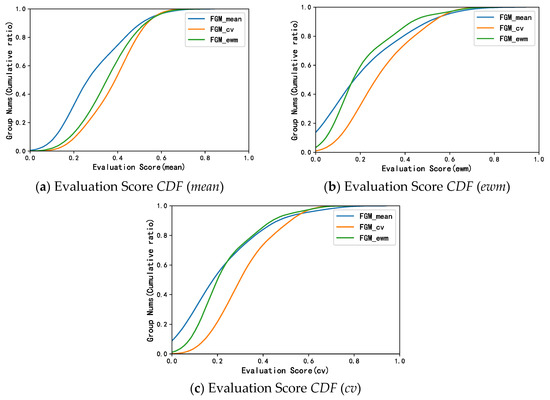
Figure 6.
Metrics CDF Evaluation Results on Three Aggregation Methods.
Under the same cumulative ratio, the further to the right of the curve, the higher the evaluation score for the model. Therefore, the further to the right of the curve, the more effective the group. It can be seen from Figure 6 that no matter what kind of evaluation score is used, performs the best (the curve is further to the right). It means that under the same cumulative ratio, the model can obtain a higher evaluation score; that is, the model obtains more effective collusive groups. It can also be inferred that different calculation methods of the CRF will have different effects on the identification results of collusive groups.
5.3.2. Based on Inner-Group Relationship Evaluation
Further, from the perspective of the group as a whole, the identification performances of the three models of , and are explored. Ideally, the value of the collusive group on each metric is all 1, that is, the group in each metric shows strong collusive group characteristics. In this regard, we consider the cosine similarity between the metric vector of the group identified by the model and the vector of all 1s of equal length to quantitatively represent the collusive degree of the group, denoted as , which is shown in Equation (17).
where
According to Equation (17), the value of each group obtained by each model is calculated and drawn in a box plot as shown in Figure 7. It can be seen from Figure 7 that the median and the maximum value of are significantly higher than the other two models, which indicates that has the best identification effect.
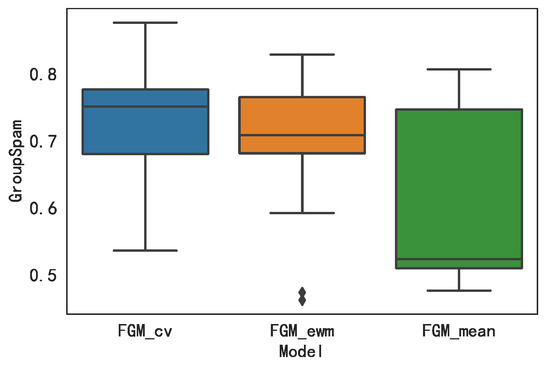
Figure 7.
Boxplots of GroupSpam for Each Model.
Further, the mean of the of each group in the same model is calculated correspondingly to obtain the average , represented as . The results are shown in Table 6.
Table 6.
The Mean of the GroupSpam Comparison.
It can be observed from Table 6 that the value of reaches 0.7160, which is the largest compared to the value, 0.6107 and 0.6990 for and . It can be found that the results of the inner-group relationship evaluation in Figure 7 and Table 6 are consistent with the metrics evaluation results. Hence, it can be concluded that the model obtains more effective results in the collusive group identification task.
5.4. Model Effectiveness Analysis
5.4.1. Comparison with Baseline Models
Wang et al. [8] proposed an edge weight calculation method that combines rating, time, and product consistency in their user graph model. In order to verify the effectiveness of our optimal model, , a first baseline model, was built, by using the weight calculation method proposed by Wang et al. In addition, Ye et al. [9] directly take the mean method to calculate edge weight in their user graph model; thus, we build another baseline model denoted . In addition, a method of plotting boxplots and cumulative distribution function plots is applied to compare the performance of our model with the benchmark models, as presented in Figure 8.
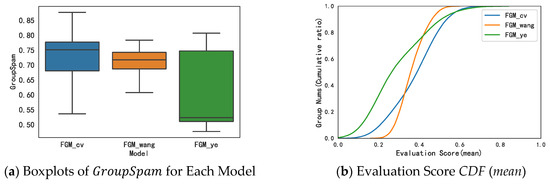
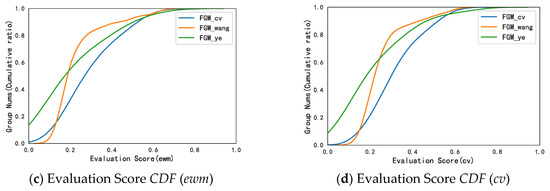
Figure 8.
Compared with Baselines.
As shown in Figure 8a, our model outperforms the other two models since the median and upper quartile of the model are much higher than those of the other two models. What’s more, it can be seen in Figure 8b–d that, from the perspective of evaluation scores, also performs the best.
Thus, it can be concluded that the collusive groups found by our optimal model are significantly better and more stable than the other two baseline models, implying that CRF weight is efficient in detecting the collusive relationship between users.
5.4.2. Collusive Relations Effectiveness Analysis
On the basis of the previous research [6,9,10,12,24], this paper proposes three new collusive relationships: review semantics consistency (RSC), activity time-span consistency (ATC), and interaction activity consistency (IAC). Meanwhile, based on research [6], this paper supplements a new evaluation metric, the “Product Number” (PN), to evaluate the collusion degree of a group. This subsection and the next will verify the validity of these newly proposed relationships and metrics.
In order to verify the effectiveness of three new collusive relationships (RSC, ATC, and ALC) in the task of collusive group identification, we delete each of the three collusive relationships separately and rebuild the model separately. The comparison result between the optimal model (including all the collusive relationships) and the three re-established models, namely , , and , is shown in Figure 9a. At the same time, the average values of each model’s are calculated in Table 7.
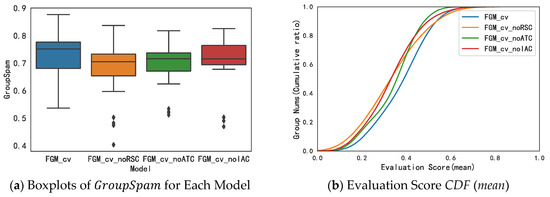
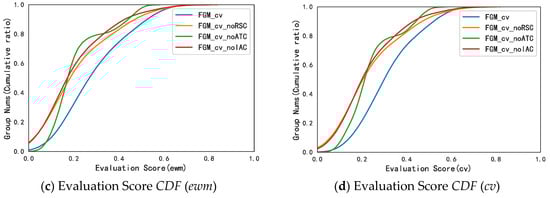
Figure 9.
Collusive Relationships Effectiveness Analysis.
Table 7.
GroupSpammean.
It can be observed from Figure 9a that the model containing all the collusive relationships is significantly better than the other three models, since the median and upper quartile of the model are much higher than those of the other three models. Meanwhile, compared to , , and , the model is the only one that does not contain outliers, meaning the collusive group generated by it is relatively stable.
Additionally, the cumulative distribution function plots are drawn under the three comprehensive evaluation methods described in Section 5.3.1, which are shown in Figure 9b–d. It can be observed from Figure 9b–d that, from the perspective of evaluation scores, performs the best.
Further, the average is calculated as shown in Table 7.
It can be found that the original model has the largest average value of 0.7160, suggesting the three collusive relationships RSC, ATC, and IAC have positive impacts on the final collusive group identification results. Moreover, among the three benchmark models, the model not containing RSC (Review Semantics Consistency) obtained the lowest average of 0.6740, which demonstrates the RSC relationship is more effective than the other two relationships. Since RSC mainly reflects the content semantics, it implies that users’ reviews of content contain important collusive clues. As for another two models, and , the averages for are 0.6857 and 0.6930, respectively, implying the ATC metric is more important than the IAC metric.
The above analysis result confirms the validity of the three new collusive relationships proposed in this paper.
5.4.3. Collusive Metrics Effectiveness Analysis
In order to validate the effectiveness of the collusive group metrics, the first twenty collusive groups identified by the optimal model are compared and analyzed on each metric, and the results are shown in Table 8.
Table 8.
Collusive Group Metrics.
It can be observed from Table 8 that the metric PN, which is proposed in this paper, rarely takes 0 and does not show a significant correlation with other metrics. For example, the first two groups have a value of 0 on the predecessor metric PT, but the value of the PN is relatively large, which shows that the PN makes up for the lack of metric PT. Additionally, from the point of view of the mean and variance, although the mean and variance of metric PN are not large compared with other metrics, the small mean and variance can only indicate that the group contains a few cases of extreme values, considering that this is the result after standardization. Thus, it implies there are groups with abnormally large values on the PN metric, which confirms its importance from the side.
6. Discussion, Implications, and Conclusions
6.1. Discussion
In recent times, almost everyone has experience with online shopping. There are many commodities and services on the Internet that can meet people’s various needs. The variety of products and the convenience of purchasing online make online shopping more and more popular. However, making the right purchase decisions and buy the products they really want has become a concern for consumers. Generally speaking, when there is a clear shopping need, consumers will inevitably shop around, and they tend to pay more attention to the comments of other consumers on the relevant product pages, which will largely affect their final decision. For this reason, a special group has emerged—the water army. For the purpose of profit, they often unite to publish a large number of comments on the target product so as to interfere with consumers’ purchase decisions. The flooding of army groups with water is extremely harmful and will have a negative impact on platforms, shops, and consumers. Therefore, this paper focuses on the identification of water army groups.
First of all, aiming at the research gap of in-depth mining of user collusion relationships neglected in the current water army identification method, this paper focuses on the in-depth mining of the collusive relationships between users, mainly including user content and user behavior. Among them, user content includes three collusive relationships that measure the consistency of two users’ review content: rating consistency, review time consistency, and review semantic consistency. The user behavior includes three collusive relationships: target product consistency, activity time-span consistency, and interaction activity consistency. They measure the consistency of two users’ comment behaviors. If two users show strong consistency on these indicators, it is more likely that the two users belong to the same water army group. Secondly, in view of the research gap that exists because the current research ignores the impact of the edge weight setting method on the final recognition result, this paper uses the mean, EWM, and CV methods to aggregate the above-mentioned user collusive relationships. Then, we design the user collusive relationship factor CRF, which is used to measure the collusion strength between two users, and use the CRF value as the weight of the connection between users when building the user relationship graph. In addition, the impact of different aggregation methods on the final recognition results is discussed in the experimental study section, which fills the existing research gap. Contrary to previous research, the building of the user relationship graph in our research focuses on exploring the recognition effects of different user collusive factor calculation methods. Additionally, from the results, the user collusive factor facilitates the graph clustering method to discover connected components and obtain candidate groups, which heavily relies on the edge weights in the user-weighted graph. The experimental results show that our method in this paper is more suitable for a water detection task than complex group discovering methods such as CPM, LDA, or community discovery algorithms.
In the part about the experimental study, this article first introduces the dataset and experimental settings used in the research. To obtain the relevant data about hotels and their reviews obtained from the Mafengwo platform, we give the labelling rules to experts to label. In the end, the experimental data contains a total of 279 users, 7931 hotels, and 16,734 reviews. A descriptive statistical analysis was carried out on six collusive relationships, and the analysis results confirmed the effectiveness of these indicators. Next, we show the water army recognition results under the three aggregation methods and analyze the consistency of the three results. The results show that, compared with other methods, the water army group obtained by the model built after the aggregation of the CV method is more abundant and comprehensive. On this basis, based on the evaluation metrics mentioned in Section 4.2.1, we draw and show the cumulative distribution function diagram of the three models of , , and . It can be seen that no matter what kind of evaluation score is used, performs the best (the curve is further to the right). Furthermore, in the calculated value of the three model results, the results show that the value of reaches 0.7160, which is the largest compared to the values of, 0.6107 and 0.6990 for and , respectively. Finally, after the above analysis, we came to the conclusion that the model obtained more effective results in the collusive group identification task. In order to verify the effectiveness of the method proposed in this paper, we compared the method in this paper with the methods of Wang et al. [8], Ye et al. [9], etc., and set the edge weight setting method as the only variable. The results show that our optimal model is significantly better and more stable than the other two baseline models, implying that CRF weight is efficient in detecting collusive relationships between users. In addition, compared with previous studies [6,9,10,12,24], this paper proposes three new collusive relationships: review semantics consistency (RSC), activity sime-span consistency (ATC), and interaction activity consistency (IAC). In order to confirm the effectiveness of these newly proposed collusive relationships, we compared the collusive group recognition effect in the cases of deleting this indicator and not deleting this indicator. The final result shows that retaining these indicators can achieve better results, and the importance of each indicator is RSC > ATC > IAC.
6.2. Implications and Conclusions
The identification of the “water army” is of great significance. First of all, on the platform side, when fake reviews seriously endanger the healthy development of online trading platforms, identifying the “water army” can help the platform to regulate user behavior in a timely manner and adopt corresponding intervention strategies [40], which will help the platform regain the trust of consumers. Secondly, in terms of merchants, identifying the “water army” can effectively prevent malicious competition among merchants, prevent the phenomenon of getting good reviews but poor products, and help form a clean and orderly online shopping environment. Finally, on the user side, consumer defense theory [41] pointed out that when consumers realize that they have been deceived, they will engage in appropriate defensive behaviors, including negative reactions and mistrust behaviors, thereby reducing the risk of being deceived again. On the basis of this theory, identifying the information army can help improve users’ information discrimination abilities and help users avoid the influence of false information brought by fake reviews.
The main work and innovation of this research are reflected in the following three aspects: Firstly, in view of the problem of focusing on candidate group mining and ignoring the measurement method of user collusive relationships when setting edge weights in the research of graph-based spammer group identification, this paper focuses on the measurement of user collusive relationship factors; Secondly, several experiments were carried out to explore the optimal method for setting user collusive relationship factors. Finally, the factors were identified, and their effectiveness on the task of e-commerce water army group identification was verified. Furthermore, this study has the following limitations: (1) Due to the limitations of computer computing power, this study only performed the group identification task on a small amount of user data, and whether it can achieve ideal results in the face of a large number of users needs further verification. (2) This paper uses the mean aggregation, EWM aggregation, and CV aggregation to calculate the edge weight. Future research would have to be conducted to find out the possibilities of other, more effective weight calculation methods. Next, we will focus on the above limitations and further explore methods to improve the identification of water army groups.
Author Contributions
Conceptualization, J.P. and Y.M.; methodology, J.P. and Y.W.; formal analysis, Y.W.; writing—original draft preparation, Y.W.; writing—review and editing, J.P.; funding acquisition, J.P. and Y.M.. All authors have read and agreed to the published version of the manuscript.
Funding
This research was funded by the Shanghai Philosophy and Social Sciences Planning Project, grant number 2020BGL009 and Zhejiang International Studies University-Annual Project, grant number 2017Y10.
Institutional Review Board Statement
Not applicable.
Informed Consent Statement
Not applicable.
Data Availability Statement
Supporting data link: https://github.com/wy416408/support_data2.
Conflicts of Interest
The authors declare no conflict of interest.
References
- Wang, Z.; Hou, T.; Song, D.; Li, Z.; Kong, T. Detecting review spammer groups via bipartite graph projection. Comput. J. 2016, 59, 861–874. [Google Scholar] [CrossRef]
- Zhao, R. Mafengwo Accused of Faking 85% of All User-Generated Content. 2018. Available online: https://technode.com/2018/10/22/mafengwo-fake-comments-blog-comment/ (accessed on 19 March 2022).
- Liu, W.; Xia, Z. Detect Network Water Army Based on Large-scale E-commerce Reviews. In Proceedings of the 2021 IEEE 2nd International Conference on Information Technology, Big Data and Artificial Intelligence (ICIBA), Chongqing, China, 17–19 December 2021; pp. 273–278. [Google Scholar]
- Ke, Z. Behavior Modeling of Internet Water Army in Online Forums. In Proceedings of the 19th IFAC World Congress, Cape Town, South Africa, 24–29 August 2014. [Google Scholar]
- Chen, C.; Wu, K.; Srinivasan, V.; Zhang, X. Battling the Internet water army: Detection of hidden paid posters. In Proceedings of the 2013 IEEE/ACM International Conference on Advances in Social Networks Analysis and Mining (ASONAM 2013), Niagara Falls, ON, Canada, 25–28 August 2013; pp. 116–120. [Google Scholar]
- Wang, Z.; Gu, S.; Zhao, X.; Xu, X. Graph-based review spammer group detection. Knowl. Inf. Syst. 2018, 55, 571–597. [Google Scholar] [CrossRef]
- Xu, G.; Hu, M.; Ma, C.; Daneshmand, M. GSCPM: CPM-based group spamming detection in online product reviews. In Proceedings of the ICC 2019—2019 IEEE International Conference on Communications (ICC), Shanghai, China, 20–24 May 2019. [Google Scholar]
- Wang, Z.; Gu, S.; Xu, X. GSLDA: LDA-based group spamming detection in product reviews. Appl. Intell. 2018, 48, 3094–3107. [Google Scholar] [CrossRef]
- Ye, Z.; Wang, B. Fake review groups detection based on spectral clustering. Comput. Appl. Softw. 2021, 38, 175–181. [Google Scholar]
- Zhang, Q.; Ji, S.; Fu, Q.; Zhang, C. Weighted reviewer graph based spammer group detection and characteristic analysis. J. Comput. Appl. 2019, 39, 1595–1600. [Google Scholar]
- Xu, C.; Zhang, J. Collusive opinion fraud detection in online reviews: A probabilistic modeling approach. ACM Trans. Web 2017, 11, 1–28. [Google Scholar] [CrossRef]
- Lim, E.P.; Nguyen, V.A.; Jindal, N.; Liu, B.; Lauw, H.W. Detecting product review spammers using rating behaviors. In CIKM’10, Proceedings of the 19th ACM Conference on Information and Knowledge Management, Niagara Falls, ON, Canada, 26–30 October 2010; ACM: New York, NY, USA, 2010; pp. 939–948. [Google Scholar]
- Xu, C.; Zhang, J.; Chang, K. Uncovering collusive spammers in Chinese review websites. In CIKM’13, Proceedings of the 22nd ACM International Conference on Information and Knowledge Management, San Francisco, CA, USA, 27 October–1 November 2013; ACM: New York, NY, USA, 2013; pp. 979–988. [Google Scholar]
- Xu, C.; Zhang, J. Combating product review spam campaigns via multiple heterogeneous pairwise features. In Proceedings of the SIAM international Conference on Data Mining, Vancouver, BC, Canada, 30 April–2 May 2015; pp. 172–180. [Google Scholar]
- Xu, C.; Zhang, J. Towards collusive fraud detection in online reviews. In Proceedings of the 2015 IEEE International Conference on Data Mining, Atlantic City, NJ, USA, 14–17 November 2015. [Google Scholar]
- Guo, B.; Wang, H.; Yu, Z.; Sun, Y. Detecting the Internet Water Army via comprehensive behavioral features using large-scale E-commerce reviews. In Proceedings of the 2017 International Conference on Computer, Information and Telecommunication Systems (CITS), Dalian, China, 21–23 July 2017. [Google Scholar]
- Ji, S.; Zhang, Q.; Li, J.; Chiu, D.; Xu, S.; Yi, L.; Gong, M. A burst-based unsupervised method for detecting review spammer groups. Inf. Sci. 2020, 536, 454–469. [Google Scholar] [CrossRef]
- Hussain, N.; Mirza, H.; Ali, A.; Lqbal, F.; Hussain, L.; Kaleem, M. Spammer group detection and diversification of customers’ reviews. PeerJ Comput. Sci. 2021, 7, e472. [Google Scholar] [CrossRef] [PubMed]
- Liu, S.; Xu, Y.; Wang, B.; Gao, M.; Deng, J. Water Army Detection of Weibo Using User Representation Learning. J. Intell. 2018, 37, 95–100. [Google Scholar]
- Zhang, Y.; Li, T. Multi-perspective feature discovery and recognition of spammers for cultural products. Comput. Eng. Des. 2021, 42, 2101–2107. [Google Scholar]
- Wang, Y.; Li, T.; Xiao, Z. Feature evaluation and selection of social network spammers identifications. Comput. Eng. Des. 2019, 40, 6. [Google Scholar]
- Mukherjee, A.; Liu, B.; Wang, J.; Glance, N.S.; Jindal, N. Detecting group review spam. In WWW’11, Proceedings of the 20th International Conference on World Wide Web, Hyderabad, India, 28 March–1 April 2011; ACM: New York, NY, USA, 2011; pp. 93–94. [Google Scholar]
- Mukherjee, A.; Liu, B.; Glance, N.S. Spotting fake reviewer groups in consumer reviews. In WWW’12, Proceedings of the 21st International Conference on World Wide Web, Lyon, France, 16–20 April 2012; ACM: New York, NY, USA, 2012; pp. 191–200. [Google Scholar]
- Akoglu, L.; Chandy, R.; Faloutsos, C. Opinion fraud detection in online reviews by network effects. In Proceedings of the 7th International AAAI Conference on Weblogs and Social Media, Cambridge, MA, USA, 8–11 July 2013; pp. 2–11. [Google Scholar]
- Ye, J.; Akoglu, L. Discovering opinion spammer groups by network footprints. In COSN’15, Proceedings of the 2015 ACM on Conference on Online Social Networks, Palo Alto, CA, USA, 2–3 November 2015; ACM: New York, NY, USA, 2015; p. 97. [Google Scholar]
- Yu, C.; Feng, B.; Zuo, Y.; Chen, B.; An, L. An Individual-Group-Merchant Relation Model for Identifying Online Fake Reviews. Acta Sci. Nat. Univ. Pekin. 2017, 53, 262–272. [Google Scholar]
- Zhang, L.; He, G.; Cao, J.; Zhu, H.; Xu, B. Spotting review spammer groups: A cosine pattern and network based method. Concurr. Comput. Pract. Exp. 2018, 30, e4686. [Google Scholar] [CrossRef]
- Rukari, S.; Thaokar, M.; Nanaware, R.; Tekawade, D.; Patil, P. Detecting Spammer Groups from Product Reviews. 2021. Available online: www.jetir.org (accessed on 19 March 2022).
- Li, D.; Yu, Z.; Xiao, C.; Qiu, J. Exploring water army in social media based on group behavior. Comput. Eng. Appl. 2018, 54, 144–149. [Google Scholar]
- Soni, J.; Prabakar, N.; Upadhyay, H. Towards Detecting Fake Spammers Groups in Social Media: An Unsupervised Deep Learning Approach. In Deep Learning for Social Media Data Analytics; Springer: Cham, Switzerland, 2022. [Google Scholar]
- Li, Y.; Zhang, S. A Community Discovery and TrustRank Based Approach for Spammer Ranking. In Proceedings of the 2020 International Conference on Culture-Oriented Science & Technology (ICCST), Beijing, China, 28–31 October 2020; pp. 279–283. [Google Scholar]
- Jothi, D.; Rajasenbagam, T. Enhanced Detection of Internet Water Army Based on Supernetwork Theory. In Proceedings of the 2020 International Conference on Computer Communication and Informatics (ICCCI), Coimbatore, India, 22–24 January 2020; pp. 1–6. [Google Scholar]
- Choo, E.; Yu, T.; Chi, M. Detecting opinion spammer groups through community discovery and sentiment analysis. In IFIP Conference on Data & Applications Security & Privacy; Springer: Cham, Switzerland, 2015. [Google Scholar]
- Li, H.; Fei, G.; Shuai, W.; Bing, L.; Shao, J. Bimodal distribution and co-bursting in review spam detection. In WWW’11, Proceedings of the 26th International Conference on World Wide Web, Perth, Australia, 3–7 April 2017; International World Wide Web Conferences Steering Committee: Geneva, Switzerland, 2017. [Google Scholar]
- Cao, J.; Xia, R.; Guo, Y.; Zhuo, M. Collusion-Aware Detection of Review Spammers in Location Based Social Networks. World Wide Web 2019, 22, 2921–2951. [Google Scholar] [CrossRef]
- Thahira, A.; Sabitha, S. Graphical Framework for Review Spammer Group Detection Using Metadata. In Proceedings of the 2021 2nd International Conference on Computation, Automation and Knowledge Management (ICCAKM), Dubai, United Arab Emirates, 19–21 January 2021; pp. 145–150. [Google Scholar]
- He, Y.; Yang, P.; Cheng, P. Semi-supervised internet water army detection based on graph embedding. Multimed. Tools Appl. 2022. [Google Scholar] [CrossRef]
- Wang, G.; Xie, S.; Liu, B.; Yu, P.S. Identify Online Store Review Spammers via Social Review Graph. ACM Trans. Intell. Syst. Technol. 2012, 3, 1–21. [Google Scholar] [CrossRef]
- Zhang, W.; Yue, K.; Zhang, B. Detecting E-Commerce Review Spammer Based on D-S Evidence Theory. J. Chin. Comput. Syst. 2018, 39, 2428–2435. [Google Scholar]
- Wu, Y.; Ngai, E.; Wu, P.; Wu, C. Fake Online Reviews: Literature Review, Synthesis, and Directions for Future Research. Decis. Support Syst. 2020, 132, 113280. [Google Scholar] [CrossRef]
- Darke, P.; Ritchie, R. The Defensive Consumer: Advertising Deception, Defensive Processing, and Distrust. J. Mark. Res. 2007, 44, 114–127. [Google Scholar] [CrossRef]
Disclaimer/Publisher’s Note: The statements, opinions and data contained in all publications are solely those of the individual author(s) and contributor(s) and not of MDPI and/or the editor(s). MDPI and/or the editor(s) disclaim responsibility for any injury to people or property resulting from any ideas, methods, instructions or products referred to in the content. |
© 2023 by the authors. Licensee MDPI, Basel, Switzerland. This article is an open access article distributed under the terms and conditions of the Creative Commons Attribution (CC BY) license (https://creativecommons.org/licenses/by/4.0/).