Article

The Insights, “Comfort” Effect and Bottleneck Breakthrough of “E-Commerce Temperature” during the COVID-19 Pandemic

1
School of Transportation and Logistics, Southwest Jiaotong University, Chengdu 611756, China
2
TangShan Institute, Southwest Jiaotong University, Tangshan 063000, China
3
School of Logistics and Transportation, Central South University of Forestry and Technology, Changsha 410004, China
*
Author to whom correspondence should be addressed.
J. Theor. Appl. Electron. Commer. Res. 2022, 17(4), 1493-1511; https://doi.org/10.3390/jtaer17040075
Submission received: 26 August 2022 / Revised: 20 October 2022 / Accepted: 10 November 2022 / Published: 14 November 2022
(This article belongs to the Section Digital Marketing and the Connected Consumer)

Abstract

:
The impact of the COVID-19 pandemic on fresh food e-commerce has led to a loss of consumers, and “e-commerce temperature” is seen as an important means of alleviating consumer dissatisfaction and retaining consumers. To explore the connotation and effect of it, and to break through possible “comfort” bottlenecks, we used online reviews of the Jingdong fresh food platform as research data, mined the characteristics of “e-commerce temperature” with the help of the LDA topic model, and evaluated the mechanism of “e-commerce temperature” on consumer satisfaction during the pandemic by using quasi-natural experiments and Word2vec-based sentiment analysis. The results show that “e-commerce temperature” has five connotations of logistics commitment, humanized delivery, health pledge, pandemic perseverance, and consumer care, which can effectively mitigate the loss of consumer satisfaction. Interestingly, we found that the “e-commerce temperature” has a limited “comfort” effect. Additionally, further social network analysis shows that the bottleneck is mainly due to the consumers’ psychological gaps when comparing the usual e-commerce services, and cretailers can repair them through financial compensation and spiritual solace. The study explores e-commerce service quality at different pandemic stages with the help of text mining techniques, enriches the theory of e-commerce research, and alleviates the Hawthorne bias in traditional empirical studies. This study also provides a reference for e-retailers to improve service quality and respond to emergencies in a changing post-pandemic era.

1. Introduction

The COVID-19 pandemic has boosted online consumption of fresh food, medical supplies, and protective gear, further accelerating the shift in consumer purchasing behavior from offline to online [1,2]. However, the accessibility, responsiveness, and safety challenges brought by the pandemic to fresh food e-commerce such as shortage, supply chain disruption, and risk of infection have made consumers worry about health, logistics, after-sales handling, etc. Meanwhile, the continuous spread of foreign pandemics and the repeated alternation of domestic cases make epidemic prevention and control a long and arduous journey of normalization. The fresh food market dovetails with rigid demands of high-frequency consumption of residents, and its special and sensitive nature affected by the pandemic makes consumers experience a mental gap in the process compared to the service in the usual period [3]. Facing “the cold winter” of the pandemic such as difficult profit, high cargo loss, and high rate of negative reviews, the “e-commerce temperature” as an altruistic behavior based on humanism is plowed into the transformation process of e-commerce companies. For example, Jingdong has opened green aid channels for medical personnel and residents in home isolation, supporting their basic life with perseverance in special times. It is no coincidence that Amazon also provides consumers with customized services such as priority delivery and contactless delivery that can be selected according to the severity of the pandemic.
In the context of the new business of e-commerce and the normalization of epidemic prevention and control, some “robotic” companies without consumer care and passive handling of problems are bound to lose consumers in the process. Companies with “temperature” and emotional support can help close the psychological distance between consumers [4], find a sustainable development path to “coexist” with the pandemic, and form a symbiotic relationship between companies and consumers that is “sympathetic, win-win, and resonant”.
During the special period of the pandemic, the fresh food market connects the residents’ high-frequency consumption needs. Humane and thoughtful e-commerce services will significantly enhance consumer satisfaction, and researchers pay more attention to the fine-grained service quality: for example, fast delivery [5], secure logistical contact [6], and thoughtful consumer care [7]. However, past studies have only integrated and analyzed empathy as a dimension in service quality, but lack systematic abstraction and conceptualization of “e-commerce temperature”. In addition, consumers have a minimum tolerance threshold, and the “e-commerce temperature” has a corresponding bottleneck to enhance [8]; few studies have taken the approach to break through and explore the net effect.
Therefore, in this context, this paper explores the connotations and characteristics of “e-commerce temperature” during the pandemic using the LDA topic model, quantifies the text by building a distributed sentiment analysis model based on Word2vec and machine learning, examines the net effect of “e-commerce temperature” on consumer satisfaction with a quasi-natural experiment as the research framework, and further identifies and breaks through the possible “comfort” bottleneck with the help of social network analysis to provide a reference for fresh food e-retailers to improve their service quality and corporate image in the post-epidemic era. Through this paper, we answer the main problem: Can “e-commerce temperature” remedy the loss of consumer satisfaction? and we divide it into three logically related subproblems:
(1) What are the meaning and characteristics of “e-commerce temperature”?
(2) Does “e-commerce temperature” have a “comfort” effect that can alleviate consumer dissatisfaction during the pandemic? And how does it work?
(3) Is there really a bottleneck in “e-commerce temperature”? if so, how to break through?
Compared to previous studies, the possible innovation contributions of this paper are mainly in the following aspects: (1) Although “e-commerce temperature” can be found in the empathy of service quality, previous studies have not developed a concept or theory on this, and few tests have examined the net effect of influencing factors [9,10,11,12]. This paper explores the connotation of “e-commerce temperature” by using the LDA topic model and tests the “comfort” effect of it during the pandemic by the difference-in-differences (DID) method. (2) The effectiveness and rationality of the quasi-natural experiment for solving endogeneity problems in empirical research have been proven in several fields [13,14,15], but the drawback of not being able to repeat the experiments makes data collection fall into the dilemma of subjectivity and fragmentation, and the traditional survey method has Hawthorne bias as well. On this basis, this paper uses text mining technology to realize sentiment analysis of online content, which provides an objective and fair data premise for empirical research, forming a research paradigm of “topic model to build theory—text mining to collect and analyze data—experimental method to test the hypothesis—social network analysis to find inner association”.
The remainder of this paper is organized as follows. A brief review of the literature is presented in Section 2. Section 3 describes the methods and data collection. Section 4 shows the results. Section 5 analyzes the results and compares with the previous studies. Section 6 concludes the paper.

2. Literature Review

2.1. Empathy in E-Commerce Services

During the pandemic, “e-commerce temperature” has appeared several times in the public. It means that product or service providers put themselves in the shoes of consumers and make timely and appropriate adjustments to their marketing strategies in response to changes in the environment. In the past, its connotation of consumer-centered, humanistic thinking, and aiming to provide personalized services to consumers can be traced back to the empathy dimension in the service quality evaluation model of the 1980s [9]. It influences online consumers’ purchasing behaviors and is considered the key to e-tailing success [16]. With the abundance of material life, people tend to seek the satisfaction of emotional needs in the spiritual world, and researchers are mostly driven by consumers’ perceptions to explore the answers to enhance satisfaction and loyalty (for example, providing services with dual rational-emotional interaction [17], considering consumer perceptions to capture their rapidly changing needs and preferences [18], etc.). With the longitudinal development of the Internet, the emotional needs of consumers are gradually exposed to the virtual environment, and companies are more likely to find the key to improving their satisfaction in digital environments such as e-commerce pages and online reviews [19,20]. Lim et al. [21] used topic modeling and sentiment analysis to analyze the information implicit in customer-generated reviews, and the results figured out that speed, price, cold chain transportation, package, quality, error handling, service staff, and logistics information were the key concerns of consumers; Hsiao et al. [22] integrated kansei engineering and text mining to design cross-border logistics services, and they deemed that emotional needs were essential to enhance consumer satisfaction. At the same time, the occurrence of unexpected events is often accompanied by new and old consumer demands and changes in corporate strategies. Yi and Shi [23] optimized and modified the classical theoretical model according to the characteristics of fresh food e-commerce services and the needs for epidemic protection, and professionalism, reliability, responsiveness, convenience, and safety were identified as the main dimensions of service quality, taking into account consumer expectations and perceptions. In this period, security, convenience, and consumer perception such as thoughtful and considerate care are playing an increasingly important role in demonstrating the spiritual pursuit and empathy of e-retailers [4,21,23].

2.2. Quasi-Natural Experiments and Text Mining

There are many factors influencing consumer satisfaction, and it is an important and difficult issue to clarify the contribution of “e-commerce temperature” to consumer satisfaction during the special period of the pandemic. Quasi-natural experiments based on the DID model can be a good solution to endogeneity problems in empirical studies such as omitted variables and reciprocal causality [24]. Meanwhile, COVID-19 provides a natural randomized experimental setting and a manipulation-friendly grouping basis for the study. Therefore, researchers mostly use experimental methods based on the DID model to test the net effect of exogenous shocks. Dalla et al. [25] used the DID model to explore the effects of a pilot project that strengthened savings incentive mechanisms. Huo et al. [26] used the DID approach to analyze the effects of emission reduction and conducted a cost-benefit analysis of the pilot cities. Meanwhile, quasi-natural experiments are also widely used as a framework for research in the face of emergencies, especially natural disasters. Grabich et al. [13] used quasi-natural experiments to test the effect of county-level hurricane exposure on birth rates in Florida and demonstrated the feasibility of the method by comparing it with the linear model. Sakai et al. [14] used prefecture-level data to examine the impact of the great east Japan earthquake on the oyster market in Japan. Eguchi et al. [15] used a social network service-based DID approach to examine the effect of restricted social activities during the COVID-19 pandemic on people’s mental health. Similarly, Luo and Si [27] explored the influence of online education on students with different family conditions during the COVID-19 pandemic.
However, there is a “black box” of cognition in current research on “e-commerce temperature”, and no clear concept or scope has been developed. Moreover, although such studies can address the endogeneity issues of omitted variables and reciprocal causality in empirical research, the COVID-19 pandemic, as a “black swan” event, provides a natural grouping while dictating that experiments cannot be repeated. To meet the needs of grouping, the traditional data collection method not only has a long cycle time but also requires a return visit one by one, which is more demanding in terms of time in the collection process. The text mining technology can directly extract effective information from the time-bound online content and can be combined with machine learning, deep learning, and other methods for sentiment analysis and quantification [28]. In this case, natural experiments jump out of the inherent mode that traditional survey methods need to collect data immediately after the event.
In conclusion, the basic hypothesis of the article is that “e-commerce temperature” during the pandemic is conducive to consumer satisfaction, but there may be bottlenecks of the effect. In this light, this paper explores the connotation and characteristics of “e-commerce temperature” during the pandemic using the LDA model, quantifies the text by building a distributed sentiment analysis model based on Word2vec and machine learning, and examines the net effect of “e-commerce temperature” on consumer satisfaction with a quasi-natural experiment. With the help of social network analysis, the possible “comfort” bottlenecks are identified and broken through for fresh food e-commerce retailers to improve their service quality and corporate image in the post-pandemic era.

3. Methods and Materials

3.1. Solving Process of Research Questions

According to the research question and hypothesis, the study can be divided into three parts: characteristic insights into “e-commerce temperature”, examination of “comfort” effects, and the identification and breakthrough of possible bottlenecks. Firstly, the raw text materials were collected by using web crawler technology and important e-commerce service elements were obtained by word frequency analysis after data pre-processing such as word segment and stop word filtering of online reviews. Since this paper only focuses on online texts related to “e-commerce temperature”, words related to empathetic connotations were selected and mapped using Word2vec to form a “temperature” sentiment lexicon. Secondly, the new dataset was analyzed by the LDA topic model to obtain the characteristics of “e-commerce temperature”, which was used as a basis for grouping in a quasi-natural experiment with the DID model to test the mechanism of “e-commerce temperature” on consumer satisfaction during the pandemic. Finally, if there was a certain bottleneck that the “comfort” effect could not significantly alleviate consumer discontent when satisfaction was at a low level [8], negative online reviews with the satisfaction less than the significance threshold were screened. Then, the bottleneck could be identified depending on the centrality and frequency, which could reveal relevance and importance of the nodes (words) by using social network analysis, and the breakthrough means were proposed accordingly. The research framework is shown in Figure 1.

3.2. LDA Topic Model

The LDA topic model is an unsupervised clustering algorithm capable of giving document topics in a distributed form. In the model, the process of document generation is shown in Figure 2.
i = {1, 2, …, d} is a set of the online reviews; θ i is the distribution of topics sampled from the Dirichlet distribution α to generate comment i; Z i , j is the topic of the word j of the sampled generated comment i; K is the number of topics; ϕ Z i , j is the word distribution for generating topics sampled from the Dirichlet distribution β ; W i , j is the word generated by sampling in the word polynomial distribution. Therefore, the joint distribution of topics and words in online reviews and the maximum likelihood estimation of the final document word distribution can be expressed respectively as:
p ( w i , z i , θ i , ϕ | α , β ) = j = 1 N p ( θ i | α ) p ( z i , j | θ i ) p ( ϕ | β ) p ( w i , j | ϕ z i , j )
p ( w i | α , β ) = θ i ϕ Z i p ( w i , z i , θ i , ϕ | α , β )
According to the maximum likelihood estimation, the topic-word matrix ϕ m a t and the document-topic matrix θ m a t can be obtained by Gibbs sampling, where the probability of word t under the topic k and the topic k under the document m are:
ϕ k , t = ( n k ( t ) + β t ) n k + β t , θ m , k = ( n m ( k ) + α k ) n m + α k
In Equation (3), n k ( t ) and n m ( k ) denote the number of times corresponding to word t under topic k and topic k under comment m, respectively. In the document-topic matrix, the topic that has the maximum probability is used as the topic of the comment.
LDA needs to preset the number of topics before fitting the model, and perplexity and consistency are two metrics commonly used to determine the number of topics [29]. Considering the risk of overfitting caused by the perplexity evaluation, the paper adopts consistency as a criterion for the topic clustering, which is calculated as follows [30]:
C ( k ; V ( k ) ) = m = 2 M t = 1 m - 1 l o g D ( v m ( k ) , v t ( k ) ) + 1 D ( v t ( k ) )
In Equation (4), C ( k ; V ( k ) ) is the consistency score, and the higher the value, the better the clustering. V ( k ) is the list of M most likely words in topic k, D ( v t ( k ) ) is the frequency of occurrence of word t under topic k, and D ( v m ( k ) , v t ( k ) ) is the frequency of co-occurrence of the two words.

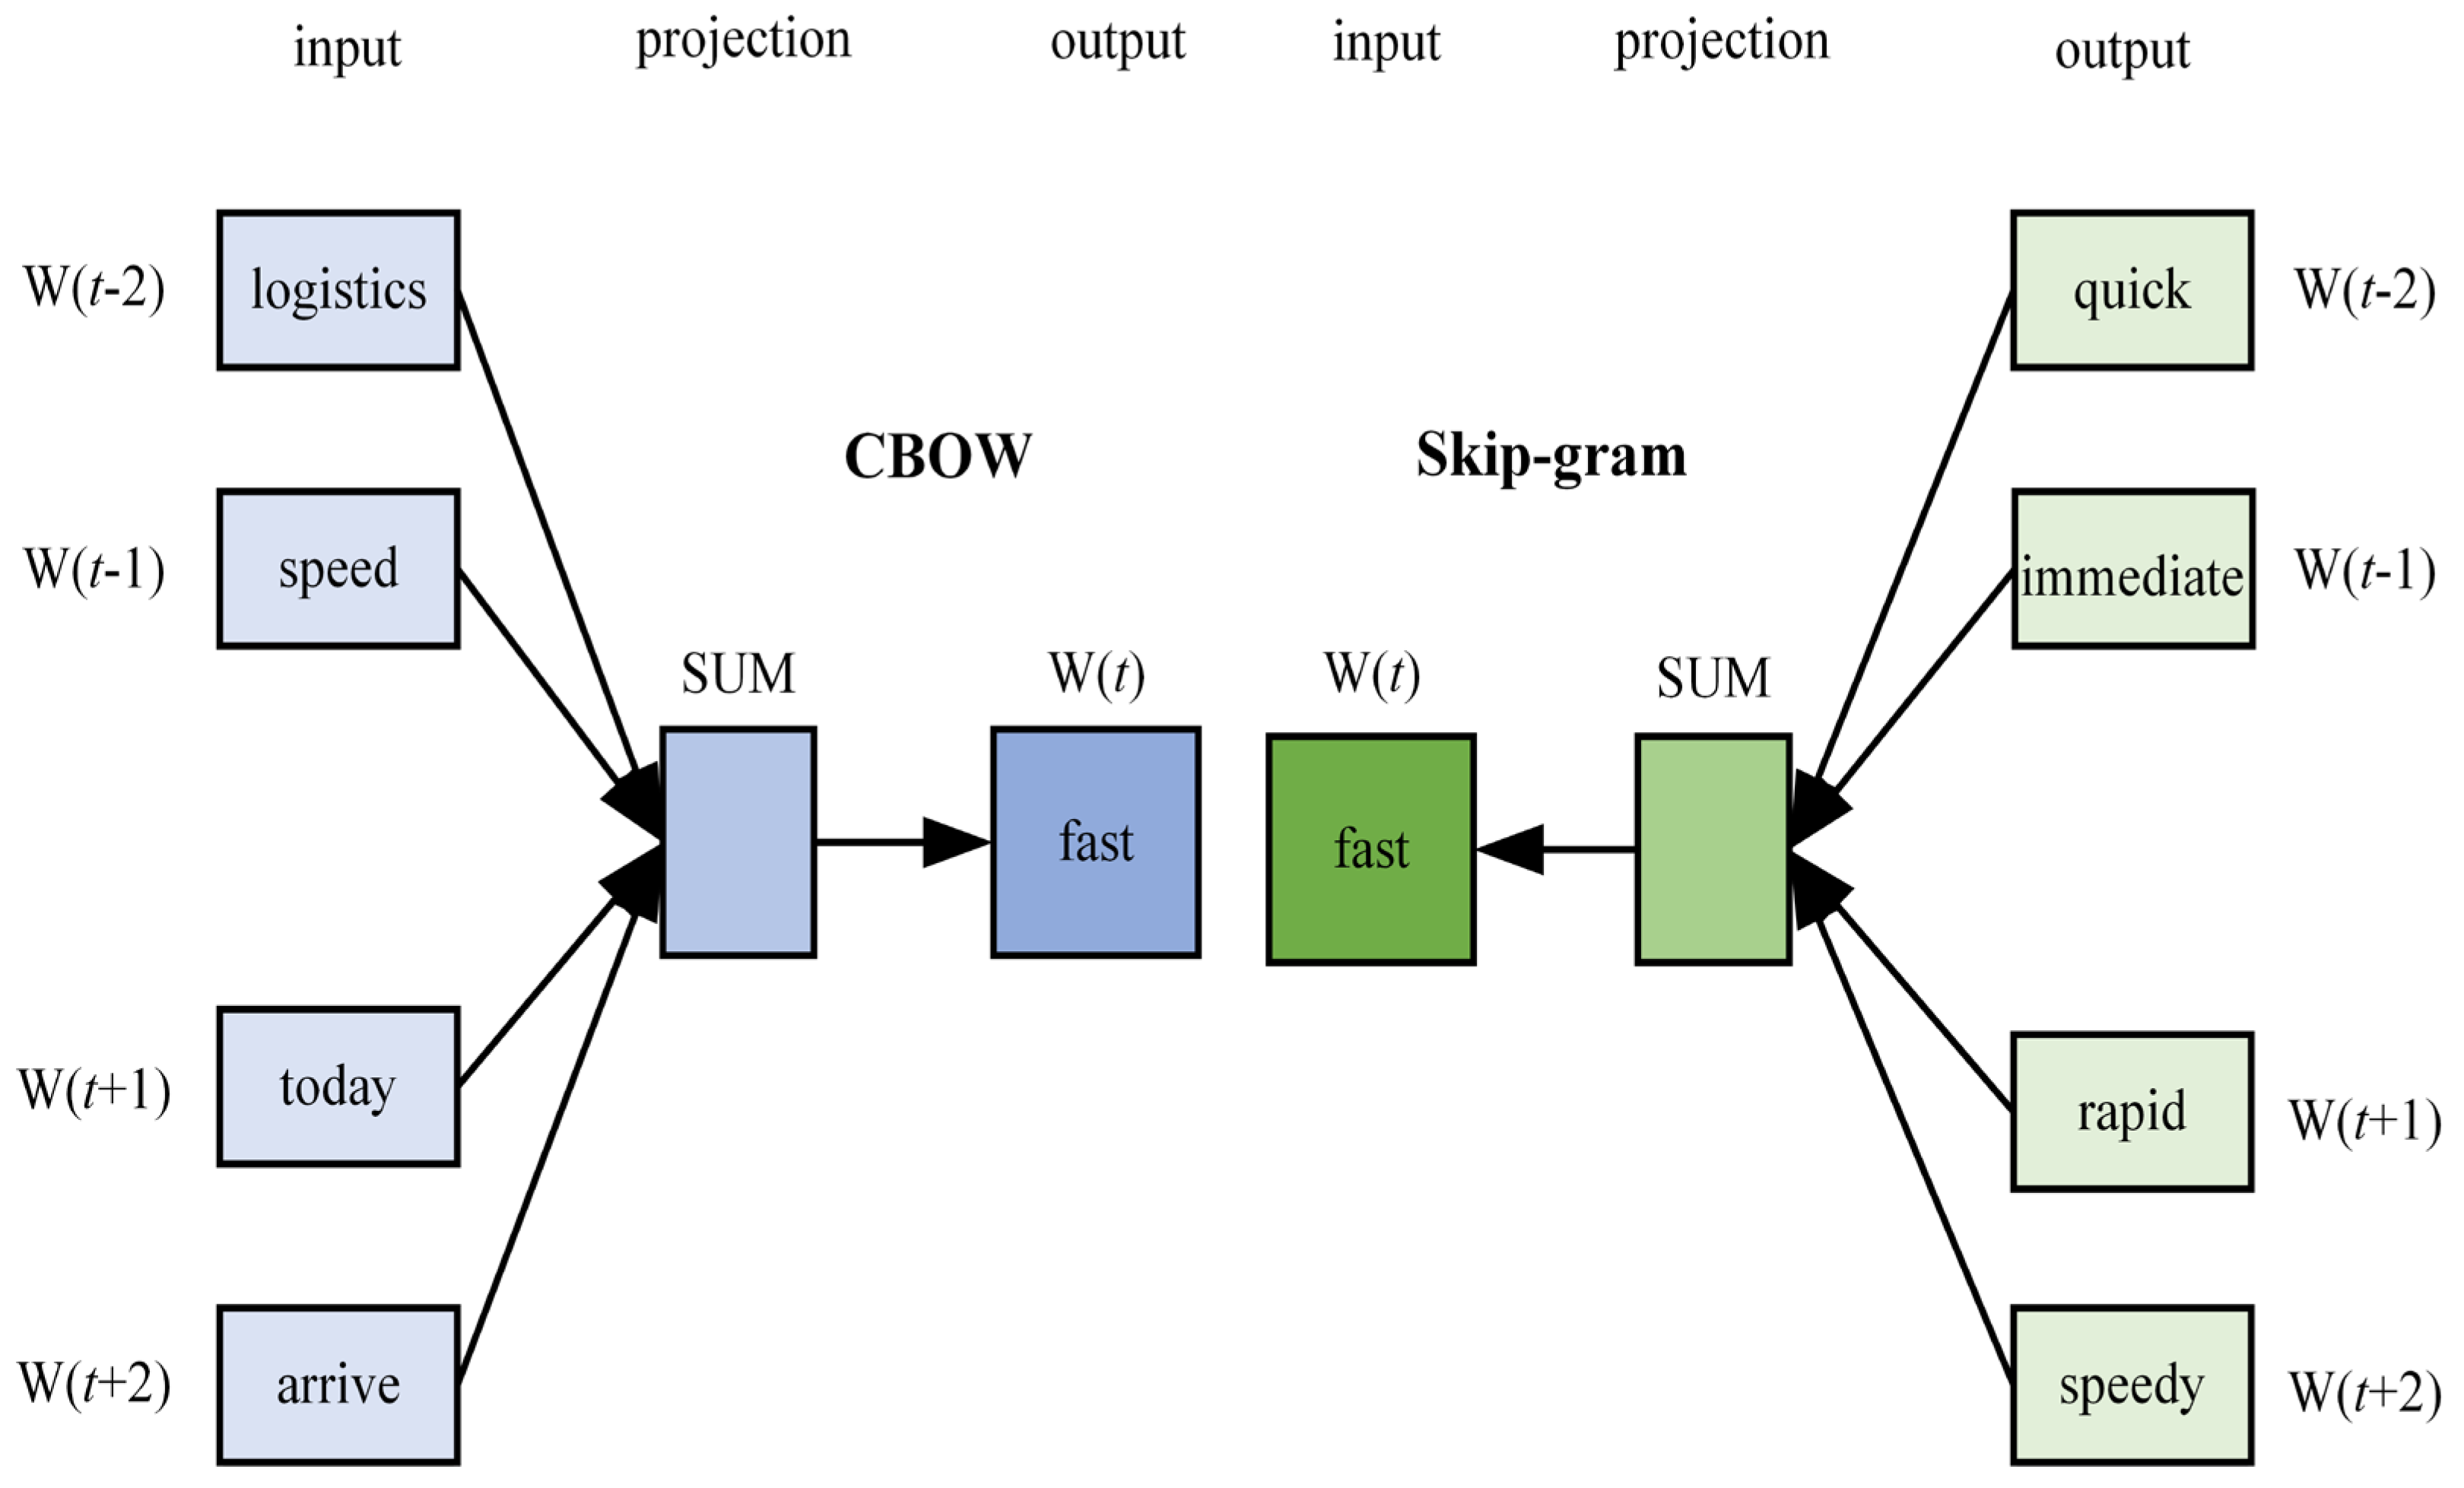
3.3. Distributed Sentiment Analysis Based on Word2vec

Sentiment analysis can be implemented through word computing based on sentiment lexicon, machine learning, and deep learning [31]. The lexicon-based approach can target sentiment keywords directly, but it requires real-time updates and there is no metric to measure the effectiveness. Machine learning and deep learning-based sentiment analysis mainly classify texts by training them. Although both approaches require extensive pre-labeling of online content, they can predict and quantify other texts based on the completed training models, and the models can be evaluated comprehensively by metrics such as precision, recall, and F1.
Support vector machine (SVM) is a nonlinear mapping classifier that maps the input vector to a high-dimensional space and constructs the optimal classification hyperplane to separate the samples of different categories [32]. Compared with supervised learning such as Logistic Regression and Naive Bayes, it has better model accuracy in dealing with binary classification problems [33].
Distributed sentiment analysis, which can achieve better prediction results, refers to the pre-training of semantic similarity before machine learning training. Word2vec is a word embedding method proposed by MIKOLOV in 2013, which can compute a distributed word vector for each word in the text [34]. The vector dimension is reduced by replacing the implicit layer in the neural network with a quadratic approach, which has a higher rate and better model accuracy for the same sample size when training large samples. Word2vec has two training models, Skip-gram and CBOW (Figure 3, w(t) is the tth word), which can both consider textual scenarios to calculate semantic similarity. The difference is that the former predicts synonyms by a single word, while the latter predicts central words by the top and bottom words and has better model accuracy in large samples; thus, the CBOW model is used for model training in this paper.

3.4. Difference-In-Differences Model

Faced with the impact of the COVID-19 pandemic on the e-commerce industry, different retailers will react differently, providing a natural and experimental framework for research. Specifically, the experimental and control groups are divided based on the LDA clustering results combined with the actual services provided by each retailer, and the development of the pandemic is used as the basis for the classification of the time variable. The model is set up as follows:
S a t i s f a c t i o n r s = ω 0 + ω 1 t i m e s × t r e a t e d r + ω 2 c o n t r o l s r s + λ r + η s + ε r s
In Equation (5), Satisfactionrs is consumer satisfaction, the dependent variable in the model, and is the probability of training the model to predict online content as positive sentiment, between 0 and 1; times is the time dummy variable, which is assigned a value of 1 after January 2020 and 0 before that; treatedr is a group dummy variable: retailers with “e-commerce temperature” are assigned a value of 1, and the opposite is 0. To better examine the net effect of “e-commerce temperature” on consumer satisfaction, controlsrs is used to control for heterogeneity among retailers including the product price, retailers’ reputation and size; λ r and η S are individual fixed effects and time fixed effects; ω 0 ,   ω 1 ,   ω 2 are their corresponding coefficients, respectively; ε r s is the random error term.

3.5. Social Network Analysis

A social network is a collection of social actors and their relationships. Social network analysis is a method to quantify social relationships, which represents social actors by nodes and connections by lines between points [35]. This paper considers the interaction between consumers and their demand perceptions as a social network and uses centrality analysis to explore the power and position of each node and how subjective demands merge and resonate in the network.
Centrality analysis for each node includes three main methods: degree centrality, betweenness centrality, and closeness centrality. Degree centrality is used to measure the direct connection of a node with other nodes and the higher the value, the more power it has in the network; betweenness centrality is used to measure the extent to which a node resides between two other nodes, and the larger the value, the greater the control over the information; closeness centrality is used to measure the extent to which a node is not controlled by other nodes: the smaller the value the more independent the node is in the network. The three measures are calculated as follows [36]:
C A D p = d e g r e e p ,   C A B p = x N u m f N u m g x f ( p ) g x f , x < f p ,   C A P p = x = 1 N u m d p x
In Equation (6), CADp, CABp, and CAPp are the degree, betweenness, and closeness centrality of point p, respectively; degreep is the degree of point p, i.e., the number of points p directly connected to others; Num is the total number of nodes; gxf is the number of paths between points x and f; gxf (p) denotes the number of paths from point x to point f and through point p; dpx denotes the shortest distance between point p and point x.

3.6. Data Collection and Text Quantification

Considering the representativeness and accessibility of the data as well as the need for theoretical construction and model testing, this paper takes Jingdong Fresh, one of the top five Chinese fresh food e-commerce platforms, as the source of data acquisition. We use web crawlers to collect two datasets for exploring the “e-commerce temperature” feature and testing its comfort effect. The former is 97,553 online reviews of fresh products during the emergency and transition period (January 2020 to October 2021), and the latter is 40,117 online reviews before and after the pandemic (September 2017 to March 2022), including 18 types of fresh food items with similar price and shipping requirements. Subsequently, the train set and test set are set according to the ratio of 7:3, and the SVM with higher accuracy is selected to train the cleaned text to obtain the evaluation of Machine Learning. After that, the CBOW model in Word2vec is used for pre-training to fully consider the association of the context. SVM is used for secondary modeling to achieve distributed sentiment analysis and obtain the relevant model evaluation, and finally, the one with the better prediction is selected.
From Figure 4, it can be seen that the distributed algorithm based on Word2vec has better model accuracy in terms of precision, recall, and F1 value. Therefore, this paper uses the distributed algorithm as the training framework to analyze the sentiment intensity of online content (Table 1).
Except for the dependent variable, which requires model training from the text, other variables can be quantified based on the services. The time and group dummy variables are treated according to the settings in the DID model; control variables such as product price, retailers’ reputation, and size are assigned according to the provided services on the Jingdong fresh produce e-commerce platform and combined with the time dummy variable to generate panel data with 586 observations (Table 2).

4. Results

4.1. Insight into the Characteristics of “E-Commerce Temperature”

Referring to the connotation of empathy to put oneself in the consumers’ shoes and try to meet their requirements, and combining with the characteristics of the online content of fresh food e-commerce during the pandemic, we selected the sentiment seed words that can reflect the “e-commerce temperature” and mapped them by Word2vec to obtain the sentiment lexicon (Table 3).
After obtaining the sentiment lexicon, it was used as the root node for traversing and filtering online reviews to obtain a new dataset reflecting the “e-commerce temperature”, which is used as the input to the LDA topic model. Based on the process of extracting online review topics, we applied python programming and used LdaModel from the gensim to explore the topic characteristics of “e-commerce temperature”. Specifically, a topic model was first pre-trained and its consistency was calculated by Equation (5) to determine the optimal number of clustered topics. Figure 5 shows the consistency scores for the number of topics from 1 to 15, and the value is highest when the number of topics is five. Therefore, the optimal number of clustered topics was determined as five. Next, the low-frequency words with less than 10 occurrences were filtered out and the batch mode was selected to run iteratively 15 times. Finally, the topic-word matrix was obtained, as shown in Table 4.

4.2. Comfort Effect Test of “E-Commerce Temperature”

4.2.1. Baseline and Quantile Regression

This paper uses the difference-in-differences model for empirical testing. Specifically, the mean satisfaction value of each retailer is the dependent variable; the time dummy variables are set and assigned according to the pandemic; the group dummy variables are differentiated by five “e-commerce temperature” features derived from the LDA topic model, which corresponds to the actual e-commerce services provided by Jingdong. For example, logistics commitment corresponds to the “211” time-limit delivery, next-day-arrival delivery, etc.; humanized delivery corresponds to home delivery, delivery by appointment, etc.; health pledge corresponds to the provision of COVID testing, quality certification, etc.; pandemic perseverance corresponds to timely replenishment of retailers and green channel in the emergency period, etc.; consumer care corresponds to storage, cooking and other shopping guidelines. In addition, product price, retailers’ reputation, and size are included in the model as control variables to better test the net effect. The results of the baseline regression are shown in Table 5.
To further analyze the relationship between “e-commerce temperature” and different levels of satisfaction, this paper classifies the satisfaction level into 0.3, 0.5, and 0.7 according to the mean and standard deviation of satisfaction and uses quantile regression to test the segmentation of the dependent variable (Table 6)

4.2.2. Robustness Testing

(1) Parallel Trend Testing
A parallel trend is a premise and basic assumption of the DID model, which requires that the experimental group and the control group have the same trend of change before the exogenous shock. There are various ways to achieve parallel trend testing, among which the time-varying trend of the dependent variable best visualizes the difference between groups before and after the event [37,38]. Therefore, this paper takes January 2020 as the cut-off point of the pandemic shock, takes the month as the basic unit to calculate consumer satisfaction according to the time series, and plots the time change trend of satisfaction between the control group and the experimental group (Figure 6).
As seen in Figure 6, the trend is generally consistent until January 2020 even though the satisfaction of the experimental group is higher than that of the control group. After January 2020, the e-commerce industry was hit by the pandemic and a decline in satisfaction occurred in both groups. However, compared with the control group, the experimental group with “e-commerce temperature” shows an evident slower decline in satisfaction and stabilizes with the gradual recovery of the social economy, which verifies the parallel trend hypothesis in terms of the dependent variable.
(2) Placebo Test
Different e-retailers have different characteristics, and although the price, retailers’ reputation, and size are selected as the control variables of the model, there are still some unobservable and unidentifiable variables that can affect and perturb the model over time [39,40]. Based on this, the paper randomly selects an experimental group to test whether the slowdown of decreased satisfaction is caused by the “e-commerce temperature” during the pandemic. Specifically, 252 pseudo-experimental groups were randomly selected from 586 observations, and the random sampling process was iterated 500 times and cross-multiplied with a time dummy variable for regression analysis.
Figure 7 shows the distribution of regression coefficients for consumer satisfaction as the dependent variable. The regression coefficients of the model are mostly concentrated around 0, indicating that the combination of samples after random sampling does not have a significant effect on satisfaction and that the differences between the experimental and control groups before and after the pandemic are not perturbed by unidentifiable variables. Thus, the regression results based on the pandemic and the “e-commerce temperature” are robust.
(3) Counterfactual Testing
To exclude the possibility of pre-pandemic and post-pandemic factors shaping the results and show that the effect of “e-commerce temperature” on satisfaction during the pandemic is not randomly generated by chance, it is necessary to conduct counterfactual testing by changing the time of exogenous shocks [41]. Specifically, two dummy scenarios were set, i.e., advancing the outbreak to January 2019 and postponing it to January 2021, forming an additional “experimental year” and a “control year”, respectively, and using them to reset the time dummy variables for regression analysis.
Table 7 shows the regression results for postponed and delayed outbreaks, respectively. It can be seen that when the impact of the pandemic is advanced to January 2019, although the dummy group variable can significantly affect consumer satisfaction, the core interaction variable is not significant, and in the virtual “experimental year”, neither retailers nor consumers are affected actually. “E-commerce temperature” does not significantly explain the differences in satisfaction between the control and experimental group. Interestingly, the core interaction variable can significantly influence consumer satisfaction and explain the evolutionary differences between the two groups when delayed to January 2021. This is due to the alternating rebound of the domestic cases and the confirmation of the “object-to-human” transmission chain closely linked to e-commerce during this period. The “control year” created by delaying the time is still affected by the pandemic and hardly has the characteristics of a control group in the full sense. However, compared to emergency times, the pandemic in the “experimental year” does not spread nationwide and is only localized and sporadic. Moreover, the orderly vaccination and construction of immune barriers, to a large extent, have provided a stable operating environment for e-commerce and logistics transportation, and the severity of the outbreak is lower during this period. Thus, the coefficients of the core interaction variable are less significant than that of the reality and the model can pass the counterfactual test under the assumptions of time front and delay.

4.3. Identifying and Breaking through “Comfort” Bottlenecks

According to the results of the quantile regression in Section 4.2.1, there is a bottleneck of “comfort” in the low level of consumer satisfaction for “e-commerce temperature”. To further improve consumer satisfaction and find the pain points of fresh food e-commerce during the pandemic, this paper screens out the negative reviews (satisfaction less than 0.3) and uses social network analysis to dig out the factors that result in consumer dissatisfaction. A co-occurrence matrix with a word frequency higher than 10 is built with the help of python, and three kinds of centralities of fresh food e-commerce are analyzed by Ucinet (Table 8).
To better illustrate the centrality of each node, 2292 negative reviews (satisfaction less than 0.3) after word segmentation are visualized by using Netdraw, as shown in Figure 8, Figure 9 and Figure 10.

5. Discussion

To explore the meaning and effect of “e-commerce temperature” during the pandemic and to break the bottleneck of satisfaction enhancement, this paper takes the pandemic as the natural entry point and combines text mining and a quasi-natural experiment to attribute the changes in consumer satisfaction before and after the pandemic. According to empirical results, the research questions posed in the Introduction can be answered.
Firstly, the “e-commerce temperature” is an altruistic behavior of retailers based on humanism, which contains five connotations of logistics commitment, humanized delivery, health pledge, pandemic perseverance, and consumer care. As seen in Table 4, the increase in delivery time during the pandemic makes fresh goods more susceptible to spoilage and deterioration, and the keywords “express”, “fresh” and “punctual” in topic1 (logistics commitment) can reflect the professionalism and responsibility of the e-commerce during special times; the continuous cases make the prevention of the pandemic exist with obvious spatial heterogeneity, and the delivery services that can be selected according to regional differences in severity will make consumers feel convenient and humane, which is reflected in keywords such as “convenient”, “delivery” and “self-pickup” in topic 2 (humanized delivery); the nature of fresh goods, which are more likely to carry and spread viruses at low temperatures, and the risk of infection at pickup have created food and contact safety concerns for consumers. Meanwhile, the accessibility of goods purchasing and delivery is reduced due to traffic control and community closure policies, while health commitments such as providing necessary COVID testing, quality certification, and contactless delivery, as well as retailers’ perseverance in fighting against the pandemic and ensuring supply, will make consumers feel reassured and gain their trust and support. Therefore, topic 3 and topic 4 are set as health pledge and pandemic perseverance; the bitterness of the suspension of offline activities makes consumers seek satisfaction in the spiritual world more than in normal times and expect more emotional services [6]. Beautiful gifts and attentive services can give consumers spiritual care and comfort so that retailers can achieve empathy with consumers during the pandemic, which is reflected in keywords such as “gift”, “attitude” and “service” in topic 2 (consumer care). In summary, the five characteristics that reflect the “e-commerce temperature” are logistics commitment, humanized delivery, health pledge, pandemic perseverance, and consumer care. In previous studies, there were some similarities to the e-commerce services during the pandemic, such as commodity sterilization, contactless delivery, and personal protection of logistics staff, which focus on the direct rational needs of consumers [23,42]. Meanwhile, Restuputri et al. [43] further considered implicit emotional perceptions in emergency periods. These five connotations in the paper both include the rational and affective dimensions, and provide a clear theory and concept of “e-commerce temperature”.
Secondly, during the pandemic, personalized services have a significant and positive effect on consumer satisfaction and retaining customers [44], and the “e-commerce temperature” can remedy the loss of consumer satisfaction with a “comfort” effect. Table 5 presents that the core interaction term (time × treated) is significant at 1% whether the control variables are included in the model sequentially or wholly. Interestingly, the interaction term coefficient is negative. The seemingly contradictory inverse correlation is actually because consumer satisfaction is hit by the pandemic, with a decrease in both the control and experimental groups, as evidenced by the low absolute value of the impact coefficient. Meanwhile, it also echoes the general decline in satisfaction after the outbreak and the slower temporal change in the experimental group’s trend in the parallel trend test (Figure 6) later on. In addition, combined with the positive and significant effects of the group dummy variables on satisfaction, it can be shown that “e-commerce temperature” can effectively mitigate the decrease in consumer satisfaction caused by the lack of goods or services during the pandemic, i.e., “e-commerce temperature” can remedy the loss of consumer satisfaction. Interestingly, according to the regression results in Table 6, in terms of different quartiles, the coefficients of the interaction terms are both low and negative values at the 1% significant level when satisfaction is in the 0.5 and 0.7 quartiles, and the dummy group variables are also positively significant at the 1% level. However, the coefficients of both the interaction term and the group dummy variable are not significant when satisfaction is in the 0.3 quantile, and the significant coefficient also decreases from the higher to the lower quartiles in descending order, which shows that the “e-commerce temperature” for consumer comfort effect has the “bottleneck”, i.e., consumers have a minimum tolerance threshold. If the consumers’ most basic e-commerce needs are ignored, resulting in low satisfaction, then the remedy will not work, which is consistent with the trend in the changes in human suffering due to lack of goods or services in the economics of social welfare [8]. Thus, “e-commerce temperature” does not have an insuranced role and has a bottleneck as a means of compensation, which is different from the results in previous studies that emotional services can unrestrictedly improve consumer satisfaction, such as kansei engineering and kano model [18,22]. Moreover, the paper considers the repair and remediation of discontent under exogenous shocks reversely rather than simple forward enhancement [45,46].
Thirdly, according to the results of social network analysis, degree centralities of the nodes such as “JD”, “consumer service”, “time” and “fresh” are significantly higher than those of other nodes (Figure 8), which indicates that the dissatisfaction during the pandemic is directly related to the retailer images, service attitudes, logistics time, and freshness of products. In addition, people tend to make social comparisons when the environment changes [3], and the direct correlation between nodes such as “before”, “quality”, “inferior” and “second time” is also strong, indicating consumers will experience a psychological gap after comparing the services during the pandemic with those in normal times; in Figure 9, the betweenness centrality of each node is consistent with the degree centrality in general, and “JD”, for example, has a strong direct connection with other nodes and acts as a “bridge” between nodes as well. Home delivery, appointment delivery, time-limited delivery, and perseverance in the special period are all carried out with Jingdong as the carrier, which shows the unity of convenience, responsiveness, accessibility, and reliability in consumers’ minds. In contrast to degree and betweenness centrality, the lower the closeness centrality of a node, the more independent it is in the network. In Figure 10, all nodes except “JD” are relatively independent of each other, revealing the specific reasons for consumer dissatisfaction. For example, “taste” and “flavor” reflect the palate preferences; “synthetic meat”, “fake”, “flesh” reflect the product quality; “time”, “frozen”, “spoiled”, “a smell” reflect the logistics speed and cold chain; “refund”, “return”, “order” reflect the after-sales handling; “no crab roe”, “not the same”, “insufficient” reflect the figure-object consistency and “perfunctory”, “seller”, “contact” reflect the retailer attitudes. It illustrates the fine-grained factors influencing consumer satisfaction and most of them are basic services of fresh food e-commerce. Thus, the bottleneck derives from consumer experience gaps after comparing the fresh food e-commerce services in normal periods, which can be broken through by improving the basic services and providing financial compensation or spiritual comfort. Differently, previous studies pay little attention to the limits of consumer satisfaction enhancement and mostly focus on single type of consumer demands [21,43]. This paper takes a deeper look at the causes of consumer dissatisfaction and provides ideas for solving the problem at both the rational cognitive and perceptual levels.
The impact of the pandemic has largely changed consumers’ purchasing behaviors, and fresh food e-commerce is also changing in the search for empathy and win-win relationships with consumers. It is an established reality that the pandemic will not go away in a short period, and how to be inspired by the experience of the emergency period to improve the quality of service and consumer satisfaction in the “coexistence” of the post-pandemic era is the key to the sustainable operation of e-commerce. Based on the findings of the study, the research implications of this paper are presented as follows:
Firstly, fresh commodities are connected to the high-frequency rigid demand of residents. In the post-pandemic era where the epidemics are normalized or when the next public health emergency comes, retailers should fully implement the human-centered concept and take the initiative to play the social function of fresh e-commerce to fight against the pandemic and keep supply. In terms of supply, retailers should focus on ensuring accessibility to deliver and replenish goods promptly to provide consumers with adequate necessities. In terms of commodity prices, retailers should not use the shortage of materials as a reason to raise prices and induce consumers to hoard, rush, and other panic behaviors, and should also provide consumers with fair prices in emergency periods. In terms of logistics, retailers should choose trustworthy logistics enterprises for commodity delivery, which can provide priority delivery, contactless delivery, appointment delivery, and other humane delivery methods according to the spatial and temporal differences of the pandemic, and can unblock the “last mile” under the static management through flexible “multimodal distribution”.
Secondly, retailers should gain insight into the changing needs of consumers and take the initiative to adapt to the market. The “otaku culture” and “lazy economy” have cultivated new consumer inertia [47]. Whether in the emergency or normalization phase of the pandemic, home-based prevention and control measures have given rise to a safe, private, untouched consumption model. Repeated outbreaks and the “object-to-human” chain of transmission have made nucleic acid testing of fresh food commodities an e-commerce practice, and retailers should focus on protecting consumers’ health and safety. Meanwhile, in the face of the consumer experience gaps that result from the pandemic, retailers should focus on the emotional value of services and the spiritual world of consumers to give them psychological compensation after frustrating experiences such as product promotions, gifts, logistics cost reductions, and other economic compensation, and attentive shopping guides, warm service attitudes, and other spiritual comforts.
Thirdly, the “comfort” bottleneck of “e-commerce temperature” requires retailers not to ignore the most essential commodity requirements of online shopping. They should first hold the bottom line on the fundamentals of freshness and quality of fresh goods before supplementing with additional services in terms of empathy. Focus should be on solving the common pain points of fresh food e-commerce, such as strictly controlling the quality of goods, providing quality traceability channels, improving the collection, pre-cooling, grading, packaging, storage and other aspects of the cold chain, and working to reduce the consumption in transportation to ensure the freshness of goods. At the same time, fresh goods are more prone to deterioration due to the slow logistics during the pandemic. In the face of unavoidable after-sales problems, retailers should shorten the time consumers spend waiting for audit and compensation by simplifying the after-sales process, showing a timely response to problems and a responsible e-commerce image.

6. Conclusions

The reasons for the decline in fresh food consumer satisfaction during the pandemic are complex and varied. The “e-commerce temperature” is an altruistic behavior of retailers based on humanism and it can satisfy the additional safety and empathy needs of consumers due to the pandemic. However, “e-commerce temperature” can not compensate for the psychological gap and has no insuranced effect. Retailers should focus on the most essential commodity requirements of online shopping and hold the bottom line on the fundamentals of freshness and quality of fresh goods to break the bottlenecks.
While this study offers important lessons, it has certain limitations that must be acknowledged. Due to the review limitations of large e-commerce platforms, most product pages only present the first 100 pages of online content, which can result in some imbalances towards best-sellers whose reviews only go back a few months before the outbreak, making the sample size of the control group slightly smaller than that of the experimental group. Technical means can be used to try to break through the limitations and achieve a larger time range of content acquisition in the future. Furthermore, the Chinese government’s unique epidemic prevention and control measures, such as dynamic zero-COVID policy and static management, provide a unique local scenario worldwide. However, each country has different characteristics of the pandemic and the article is difficult to generalize to every study scenario. Scholars can later compare e-commerce activities in different countries or regions, taking into account the phases of the pandemic in this article to further consider them from a spatial and temporal perspective.

Author Contributions

Conceptualization, Y.Y. and G.W.; methodology, Y.Y. and Y.M.; software, Y.Y. and Y.M.; validation, Y.M.; resources, Q.G.; writing-original draft preparation, Y.Y.; writing—review and editing, Y.Y. and Y.M.; visualization, Q.G. and H.X.; supervision, G.W. and H.X. All authors have read and agreed to the published version of the manuscript.

Funding

This research was supported by research grant from the National Social Science Fund of China (No. 15YJA790064), and Chengdu soft science research project (No. 2020-RK00-00071-ZF).

Institutional Review Board Statement

Not applicable.

Informed Consent Statement

Not applicable.

Data Availability Statement

Not applicable.

Acknowledgments

The authors would like to express the thankfulness to the participants who assisted us during the process of the research, the editors and reviewers for their hard work.

Conflicts of Interest

The authors declare no conflict of interest.

References

  1. Gu, S.; Ślusarczyk, B.; Hajizada, S.; Kovalyova, I.; Sakhbieva, A. Impact of the COVID-19 pandemic on online consumer purchasing behavior. J. Theor. Appl. Electron. Commer. Res. 2021, 16, 2263–2281. [Google Scholar] [CrossRef]
  2. Yang, S.; Ning, L.; Jiang, T.; He, Y. Dynamic impacts of COVID-19 pandemic on the regional express logistics: Evidence from China. Transp. Policy 2021, 111, 111–124. [Google Scholar] [CrossRef]
  3. Festinger, L. A theory of social comparison processes. Hum. Relat. 1954, 7, 117–140. [Google Scholar] [CrossRef]
  4. Zhou, L.; Fan, J.H. Shaping trust: The scene framework and emotional logic of live online e-commerce. J. Southwest Minzu Univ. 2021, 42, 142–147. [Google Scholar]
  5. Scutariu, A.L.; Șuşu, Ș.; Huidumac-Petrescu, C.E.; Gogonea, R.M. A Cluster Analysis Concerning the Behavior of Enterprises with E-Commerce Activity in the Context of the COVID-19 Pandemic. J. Theor. Appl. Electron. Commer. Res. 2021, 17, 47–68. [Google Scholar] [CrossRef]
  6. Truong, D.; Truong, M.D. How do consumers change their purchasing behaviors during the COVID-19 pandemic? J. Retail. Consum. Serv. 2022, 67, 102963. [Google Scholar] [CrossRef]
  7. Escudero-Santana, A.; Muñuzuri, J.; Lorenzo-Espejo, A.; Muñoz-Díaz, M.L. Improving E-Commerce Distribution through Last-Mile Logistics with Multiple Possibilities of Deliveries Based on Time and Location. J. Theor. Appl. Electron. Commer. Res. 2022, 17, 507–521. [Google Scholar] [CrossRef]
  8. Holguín-Veras, J.; Pérez, N.; Jaller, M.; Van Wassenhove, L.N.; Aros-Vera, F. On the appropriate objective function for post-disaster humanitarian logistics models. J. Oper. Manag. 2013, 31, 262–280. [Google Scholar] [CrossRef]
  9. Parasuraman, A.; Zeithaml, V.A.; Berry, L.L. A conceptual model of service quality and its implications for future research. J. Mark. 1985, 49, 41–50. [Google Scholar] [CrossRef]
  10. Murray, J.; Elms, J.; Curran, M. Examining empathy and responsiveness in a high-service context. Int. J. Retail. Distrib. Manag. 2019, 47, 1364–1378. [Google Scholar] [CrossRef]
  11. Umasuthan, H.; Park, O.J.; Ryu, J.H. Influence of empathy on hotel guests’ emotional service experience. J. Serv. Mark. 2017, 31, 618–635. [Google Scholar] [CrossRef]
  12. Yoon, N.; Lee, H.K. AI recommendation service acceptance: Assessing the effects of perceived empathy and need for cognition. J. Theor. Appl. Electron. Commer. Res. 2021, 16, 1912–1928. [Google Scholar] [CrossRef]
  13. Grabich, S.C.; Robinson, W.R.; Engel, S.M.; Konrad, C.E.; Richardson, D.B.; Horney, J.A. County-level hurricane exposure and birth rates: Application of difference-in-differences analysis for confounding control. Emerg. Themes Epidemiol. 2015, 12, 19. [Google Scholar] [CrossRef] [PubMed] [Green Version]
  14. Sakai, Y.; Wakamatsu, H.; Miyata, T. Impact of the Great East Japan Earthquake on the oyster market: A difference-in-differences estimation. Fish. Sci. 2018, 84, 1109–1118. [Google Scholar] [CrossRef]
  15. Eguchi, A.; Yoneoka, D.; Shi, S.; Tanoue, Y.; Kawashima, T.; Nomura, S.; Makiyama, K.; Uryu, S.; Sawada, M.; Kawamura, Y.; et al. Effect of emergency declaration on mental health during the COVID-19 pandemic in Japan: A social network service-based difference-in-differences approach. Sci. Prog. 2021, 104. [Google Scholar] [CrossRef]
  16. Zhang, C.; Ma, H.M. Introduction of the marketplace channel under logistics service sharing in an e-commerce platform. Comput. Ind. Eng. 2022, 163, 107724. [Google Scholar] [CrossRef]
  17. Pappas, I.O.; Kourouthanassis, P.E.; Giannakos, M.N.; Chrissikopoulos, V. Sense and sensibility in personalized e-commerce: How emotions rebalance the purchase intentions of persuaded customers. Psychol. Mark. 2017, 34, 972–986. [Google Scholar] [CrossRef]
  18. Wu, T.; Liu, X.; Qin, J.; Herrera, F. An interval type-2 fuzzy Kano-prospect-TOPSIS based QFD model: Application to Chinese e-commerce service design. Appl. Soft Comput. 2021, 111, 107665. [Google Scholar] [CrossRef]
  19. Bataoui, S. When e-commerce becomes more human by transposing the hospitality concept to merchant websites. J. Retail. Consum. Serv. 2022, 65, 102831. [Google Scholar] [CrossRef]
  20. Yang, X.R.; Du, R. Impacts of IT-enabled knowledge sharing in virtual communities on service quality of cross-border e-commerce. Chin. J. Manag. Sci. 2022, 30, 226–233. [Google Scholar]
  21. Lim, M.K.; Li, Y.; Song, X. Exploring consumer satisfaction in cold chain logistics using a text mining approach. Ind. Manag. Data Syst. 2021, 121, 2426–2449. [Google Scholar] [CrossRef]
  22. Hsiao, Y.H.; Chen, M.C.; Liao, W.C. Logistics service design for cross-border E-commerce using Kansei engineering with text-mining-based online content analysis. Telemat. Inform. 2017, 34, 284–302. [Google Scholar] [CrossRef]
  23. Yi, Y.C.; Shi, Y.X. Research on the logistics service quality improvement of fresh food e-commerce under the normalization of the COVID-19 epidemic. J. Jiangxi Univ. Financ. Econ. 2022, 1, 65–75. [Google Scholar]
  24. DiNardo, J. Natural experiments and quasi-natural experiments. In Microeconometrics; Palgrave Macmillan: London, UK, 2010; pp. 139–153. [Google Scholar]
  25. Dalla Pellegrina, L.; De Michele, A.; Di Maio, G.; Landoni, P. Fostering savings by commitment: Evidence from a quasi-natural experiment at the small enterprise foundation in South Africa. World Dev. 2021, 148, 105660. [Google Scholar] [CrossRef]
  26. Huo, W.; Qi, J.; Yang, T.; Liu, J.; Liu, M.; Zhou, Z. Effects of China’s pilot low-carbon city policy on carbon emission reduction: A quasi-natural experiment based on satellite data. Technol. Forecast. Soc. Chang. 2022, 175, 121422. [Google Scholar] [CrossRef]
  27. Luo, C.Y.; Si, C.X. Does online education widen the gap between students with different family conditions? a quasi-natural experiment based on covid-19. J. Financ. Econ. 2020, 46, 4–18. [Google Scholar]
  28. Kim, Y.; Kang, M.; Jeong, S.R. Text mining and sentiment analysis for predicting box office success. KSII Trans. Internet Inf. Syst. (TIIS) 2018, 12, 4090–4102. [Google Scholar]
  29. Guan, P.; Wang, Y.F. Identifying optimal topic numbers from Sci-Tech information with LDA model. New Technol. Libr. Inf. Serv. 2016, 32, 42–50. [Google Scholar]
  30. Mimno, D.M.; Wallach, H.M.; Talley, E.M.; McCallum, A. Optimizing Semantic Coherence in Topic Model. Available online: https://Aclanthology.Org/D11-1024.Pdf (accessed on 20 May 2022).
  31. Wang, Y.; Zhu, J.; Wang, Z.; Bai, F.; Gong, J. Review of applications of natural language processing in text sentiment analysis. J. Comput. Appl. 2022, 42, 1011–1020. [Google Scholar]
  32. Atmaja, B.T.; Akagi, M. Two-stage dimensional emotion recognition by fusing predictions of acoustic and text networks using SVM. Speech Commun. 2021, 126, 9–21. [Google Scholar] [CrossRef]
  33. Chidambarathanu, K.; Shunmuganathan, K.L. Predicting user preferences on changing trends and innovations using SVM based sentiment analysis. Clust. Comput. 2019, 22, 11877–11881. [Google Scholar] [CrossRef]
  34. Mikolov, T.; Chen, K.; Corrado, G.; Dean, J. Efficient Estimation of Word Representations in Vector Space. Available online: https://Arxiv.Org/Pdf/1301.3781.Pdf (accessed on 28 March 2022).
  35. Fu, J.L.; Sun, D.Y.; Jin, X.; Wang, S.Y. Review of the research on the terrorist networks based on social network analysis. Syst. Eng.-Theory Pract. 2013, 33, 2177–2186. [Google Scholar]
  36. Ping, L.; Zong, L.Y. Research on microblog information dissemination based on SNA: A case study with Sina Microblog. Doc. Inf. Knowl. 2010, 6, 6. [Google Scholar]
  37. Qian, X.; Kang, J.; Tang, Y.; Cao, X. Industrial policy, efficiency of capital allocation and firm’s total factor productivity: Evidence from a natural experiment in China. China’s Ind. Econ. 2018, 35, 42–59. [Google Scholar]
  38. Xie, Q.J.; Gao, J.; Su, J. Research on the Impact of Government Cooperation on Inter-Regional Collaborative Innovation Based on the Quasi-Natural Experiment. Chin. J. Manag. 2021, 18, 1612. [Google Scholar]
  39. La Ferrara, E.; Chong, A.; Duryea, S. Soap operas and fertility: Evidence from Brazil. Am. Econ. J. Appl. Econ. 2012, 4, 1–31. [Google Scholar] [CrossRef] [Green Version]
  40. Song, H.; Sun, Y.J.; Chen, D.K. Assessment for the effect of government air pollution control policy: Empirical evidence from “low-carbon city” construction in China. J. Manag. World 2019, 35, 95–108. [Google Scholar]
  41. Fang, H.; Zhao, S.L. Has the Belt and Road Initiative promoted the upgrading of China’s industrial structure? A difference-in-differences test based on 285 cities of China. Ind. Econ. Res. 2021, 1, 29–42. [Google Scholar]
  42. Muangmee, C.; Kot, S.; Meekaewkunchorn, N.; Kassakorn, N.; Khalid, B. Factors Determining the Behavioral Intention of Using Food Delivery Apps during COVID-19 Pandemics. J. Theor. Appl. Electron. Commer. Res. 2021, 16, 1297–1310. [Google Scholar] [CrossRef]
  43. Restuputri, D.P.; Indriani, T.R.; Masudin, I. The effect of logistic service quality on customer satisfaction and loyalty using kansei engineering during the COVID-19 pandemic. Cogent Bus. Manag. 2021, 8, 1906492. [Google Scholar] [CrossRef]
  44. Andrews, E.; Berghofer, K.; Long, J.; Prescott, A.; Caboral-Stevens, M. Satisfaction with the use of telehealth during COVID-19: An integrative review. Int. J. Nurs. Stud. Adv. 2020, 2, 100008. [Google Scholar] [CrossRef] [PubMed]
  45. Torabi, M.; Bélanger, C.H. Influence of Online Reviews on Student Satisfaction Seen through a Service Quality Model. J. Theor. Appl. Electron. Commer. Res. 2021, 16, 3063–3077. [Google Scholar] [CrossRef]
  46. Bueno, S.; Gallego, M.D. eWOM in C2C Platforms: Combining IAM and Customer Satisfaction to Examine the Impact on Purchase Intention. J. Theor. Appl. Electron. Commer. Res. 2021, 16, 1612–1630. [Google Scholar] [CrossRef]
  47. Xiao, W.J. The Influence and Countermeasures of Outbreak Epidemic on the Circulation of Fresh Agricultural Products from the Perspective of Risk Society. Rev. Econ. Manag. 2020, 36, 25–33. [Google Scholar]
Figure 1. Research framework.
Jtaer 17 00075 g001
Figure 2. The Process of the LDA topic model.
Jtaer 17 00075 g002
Figure 3. CBOW and Skip-gram.
Jtaer 17 00075 g003
Figure 4. Model evaluation.
Jtaer 17 00075 g004
Figure 5. Consistency score of the LDA model.
Jtaer 17 00075 g005
Figure 6. The time change trend of satisfaction between two groups.
Jtaer 17 00075 g006
Figure 7. Placebo test.
Jtaer 17 00075 g007
Figure 8. Analysis of degree centrality.
Jtaer 17 00075 g008
Figure 9. Analysis of betweenness centrality.
Jtaer 17 00075 g009
Figure 10. Analysis of closeness centrality.
Jtaer 17 00075 g010
Table 1. The results of treated online content (Partial).
Raw CommentSplitting ResultsSatisfaction
hard work of the Jingdong courier, so late during the pandemic is still delivering, thanks. The fish fillets are sized and fresh, with a clear texture, and very satisfied.hard work Jingdong courier late pandemic still delivering thanks sized fresh clear satisfied0.96
Shivering the imported products during the pandemic, the packaging has a negative test mark and a traceability QR code, very reassuring, children especially love to eat. Shivered imported products pandemic packaging negative test traceability QR code reassuring love eat0.96
Affordable price, very tasty, and abalone practice on the package, it’s thoughtful, will return to buy next time.Affordable price tasty practice package thoughtful return buy0.99
One died in transport, fast compensation, kudos to your service, two days to the countryside, everyone can buy with confidence.died transport fast compensation kudos service two days countryside everyone buys confidence0.92
Logistics are too slow, delivered without calling, directly on the self-pickup cabinet, extremely poor attitude, and the product is not fresh.Logistics slow delivered without calling self-pickup cabinet poor attitude product not fresh0.04
It’s unpalatable, the fishy smell can not be described and causes diarrheaThe unpalatable fishy smell can not be described as diarrhea0.03
Food is okay, but home delivery is not available, bad for poor logistics!Food okay home delivery not available bad poor logistics0.34
Table 2. Descriptive statistics.
Mean ValueStandard DeviationObservationsDescription
Satisfaction0.7820.214586Sentiment analysis (Table 1)
Time189 (Number of 1)397 (Number of 0)586Grouping of DID (Unit, 1 or 0)
Treated271 (Number of 1)315 (Number of 0)586Grouping of DID (Unit, 1 or 0)
Price102.55093.151586The price of products
Reputation9.6000.391586Store ratings on JD
Size9.4340.413586Product sales (ten thousand)
Note: Satisfaction is consumer satisfaction; Time and Treated are dummy variables of DID model; Price, Reputation and Size are product price, retailers’ reputation and size.
Table 3. Sentiment lexicon of “e-commerce temperature”.
Seed WordsExtended Words by Word2vec
ThanksGratitude, Thankfulness, Thanksgiving, Conscientious, Reliable
ThoughtfulConsiderate, Heartwarming, Attentive, Mindful
PerseverancePandemic, Special Period, Bottom Line, Trust, Laborious, Homage
AttitudePatience, Friendliness, Manners, Enthusiasm, Passion, Service
ResponsibleDutiful, Serious, Rigorous, Dedication, Meticulous, Normative, After-Sales
HumanizationHome delivery, Convenience, Trouble-free, Worry-free
Table 4. Topic-word matrix of “e-commerce temperature”.
Logistics CommitmentHumanized DeliveryHealth PledgePandemic PerseveranceConsumer Care
Express0.005Convenient0.006Quality0.013Courier0.005Gift0.006
Merchant0.004Shipping0.005Freshness0.009Thanks0.004Attitude0.005
Fresh0.004Home Delivery0.005Contact0.008Dedicate0.004Consumer Service0.005
Logistics0.003Self-run0.004Package0.008Homage0.004Thoughtful0.004
Punctual0.003Flexible0.004Covid test0.008Pandemic0.003Awesome0.004
Order0.003Self-pickup0.004Certificate0.006Merchant0.003Delicate0.004
Next day0.003Stores0.003Reassured0.006Caring0.003Enthusiasm0.004
Table 5. The results of baseline regression.
(1)(2)(3)(4)(5)
time × treated−0.092 ***
(0.034)
−0.099 ***
(0.034)
−0.100 ***
(0.034)
−0.105 ***
(0.034)
−0.105 ***
(0.034)
treated0.287 ***0.286 ***0.275 ***0.282 **0.295 ***
Constant term0.5750.6970.356−0.1540.259
individual and
time fixed
YESYESYESYESYES
priceYESNONONOYES
ReputationNOYESNONOYES
SizeNONOYESNOYES
R-squared0.2900.2800.2800.2900.310
Note: time × treated is the interaction item of time and treated, and is also the core variable of the model; Constant term is the constant of the model; individual and time fixed represent whether to control the fixed effect; columns (1)–(5) represent the baseline regressions of the model with different control variables, and the robust standard errors are reported in each parenthesis; ***, ** represent the significance levels of the coefficients of the variables at 1% and 5%, respectively. The following tables are the same.
Table 6. The results of quantile regression.
Satisfaction = 0.3Satisfaction = 0.5Satisfaction = 0.7
Time × Treated−0.011
(0.060)
−0.068 ***
(0.022)
−0.087 ***
(0.012)
Treated−0.0140.303 ***0.633 ***
Constant terms−0.3370.0180.438
Individual and
Time fixed
YESYESYES
controlsYESYESYES
R-squared0.2200.2300.170
Note: The robust standard errors are reported in each parenthesis; *** represents the significance levels of the coefficients of the variables at 1%.
Table 7. Counterfactual Testing.
TimeJanuary 2019January 2021
time × treated−0.095
(0.061)
−0.080 **
(0.032)
treated0.223 ***0.255 ***
Constant terms0.3730.447
Individual and
Time fixed
YESYES
controlsYESYES
R-squared0.2800.310
Note: The robust standard errors are reported in each parenthesis; ***, ** represent the significance levels of the coefficients of the variables at 1% and 5%, respectively.
Table 8. Centrality analysis of fresh food e-commerce (Partial).
NodesDegreeBetweennessClosenessNodesDegreeBetweennessCloseness
Fresh494.00054.37693.269Poor200.00023.76976.378
JD834.00059.34597.000Ice bag373.00033.31985.841
Normal303.00029.65978.862Already325.00036.86785.088
Consumer Service629.00050.97193.269Quality346.00045.04688.182
Packaging610.00058.8397.000Disappointed303.00044.37487.387
Express462.00046.93191.509Purchase313.00038.84686.607
None524.00049.07993.269Somewhat270.00023.51875.781
First time437.00044.07889.815Time335.00037.82586.607
Cannot376.00040.16588.182Terrible149.00019.49975.781
Nice313.00035.18184.348Price248.00026.62377.600
Publisher’s Note: MDPI stays neutral with regard to jurisdictional claims in published maps and institutional affiliations.

