Article

The Impact of Guarantees on Peer-to-Peer Lending Platform: Evolutionary Game Analysis and Empirical Evidence from China

1
School of Management, Fudan University, Shanghai 200433, China
2
Shanghai Gold Exchange, Shanghai 200010, China
*
Author to whom correspondence should be addressed.
J. Theor. Appl. Electron. Commer. Res. 2021, 16(7), 2708-2731; https://doi.org/10.3390/jtaer16070149
Submission received: 2 August 2021 / Revised: 31 August 2021 / Accepted: 2 October 2021 / Published: 10 October 2021
(This article belongs to the Section e-Commerce Analytics)

Abstract

:
The peer-to-peer lending market has developed rapidly over the past decade and reveals a severe problem of information asymmetry. This research constructed a four-party evolutionary game model to analyze the influence pathway of the guarantee mechanism on the users’ participation of the peer-to-peer lending platform and conducted an empirical study applying the mediating effect model and simultaneous equation model based on data of China’s peer-to-peer lending platform. The theoretical model shows that the guarantee mechanism reduced the participation of borrowers of the peer-to-peer lending platform through a screening effect, but increased the participation of investors through a signal effect. In the case of the platform self-guarantee, there existed a self-screening effect, whose influence on the participation of investors depended on the strength of external constraints imposed on the platform enterprises. Further, the empirical study shows that during the sample period, the platform self-guarantee mechanism reduced the scale of borrowers and investors of the peer-to-peer lending platform at the same time, thus reducing the transaction volume of the platform. Although the third-party guarantee mechanism reduced the scale of borrowers, it increased the scale of investors, and the comprehensive effect was to increase the transaction volume of the platform. On this basis, this research puts forward suggestions such as strengthening the qualification examination of the platform enterprises, transforming the platform self-guarantee mechanism into the third-party guarantee mechanism, and introducing more signal mechanisms.

1. Introduction

The rapid pervasiveness of information and communication technology (ICT) has enabled numerous business opportunities and reconstructed the traditional business model [1,2], thus giving birth to peer-to-peer lending [3]. Through the creation of an online communication and transaction environment, peer-to-peer lending increases the effectiveness and efficiency of financing activities, acting as an appealing financing channel [4,5]. Given ICT’s intrinsic attributes of instantaneity and ubiquity [6], peer-to-peer lending has achieved a rapid development in both business practice (the transaction volume of China’s peer-to-peer lending industry from 2011 to 2019 is shown in Figure 1) and academic fields.
Two-sided platform, also referred to as two-sided market [7,8,9], is the most typical market organization form in the Internet Economy [10], as well as in peer-to-peer lending. The structure of a peer-to-peer lending platform is shown in Figure 2. Specifically, the platform enterprises, borrowers, and investors jointly constitute the peer-to-peer lending platform. In a peer-to-peer lending platform, borrowers publish the information of their projects, and investors search for suitable projects according to the information displayed on the platform, while the platform enterprises match the transaction between these two groups of users, benefitting from the corresponding interaction [11,12]. In this way, the transaction relationship involves three parties and is no longer the traditional mode which only relates to the “seller” and “buyer”.
It should be noted that the transaction relationship between borrowers and investors is formed after the establishment of their agency relationship with platform enterprises [16]; thus, the problem of information asymmetry under the two-sided platform mode is more severe compared to the traditional direct transaction mode related with two parties [16]. In other words, information asymmetry exists not only between platform users, but also between platform enterprises and users [17]. In addition, peer-to-peer lending’s basic characteristic of being able to interact through the Internet anywhere at any time changes the trust mechanism between transaction counterparties [18], and leads to a high risk of information distortion. Specifically, the borrower retains more information (especially the default information) about the project [19], and may mislead the investor with fictitious information [1], which will lead to a dual information asymmetry problem including adverse selection and moral hazards [20,21]. Such concerns of truthfulness stop investors from participating in the platform transaction, which is not conducive to the expansion and healthy long-term development of the market. To solve this series of problems, in the Chinese market, introducing a guarantee mechanism is an important approach adopted by the platform enterprises, as the guarantee weakens investors’ concerns about funding security and attracts investors, thus promoting the development of the peer-to-peer lending industry. Additionally, theoretical researches also show that a guarantee mechanism can alleviate the problem of information asymmetry; hence, it is of great significance to discuss the impact of guarantees on a peer-to-peer lending platform.

1.1. Related Literature

Two-sided platform is the most typical market organization form of the peer-to-peer lending industry. According to the definition from Armstrong’s study [7], platforms are those markets where the users’ utility depends on the size of the users of other groups the platform enterprise bridges with, and that characteristic is so called cross-group externalities. Over the past decades, scholars basically reached a consensus on the characteristics of two-sided markets [22], including the non-neutral price structure and cross-group externalities. Rong [23] further pointed out that the non-neutral price structure was caused by the asymmetry of cross-group externalities from different groups of users. For the operation of platform, almost all scholars (for instance, Evans [24] and Régibeau [25]) emphasized the importance of the interaction between platform enterprises and users. This kind of relationship is different from the traditional two-party transaction relationship, leading to a severe information asymmetry problem [16]. Luo and Gu [17] pointed out that there existed dual information asymmetry problems on the peer-to-peer lending platform.
Regarding the governance of information asymmetry, there has been an abundance of research results, divided into administrative governance method and market governance method [26]. Theoretical researches show that the signal mechanism is an important market governance method to alleviate the problem of information asymmetry [27,28], and the guarantee is a common signal mechanism [29,30,31]. Bester [29] pointed out that collateral (a guarantee provided by the borrowers themselves) could be used as a signal mechanism, as only low risk borrowers would accept contracts with a high amount of collateral. Coco [30] investigated the use of collateral as an informative signal. Biglaiser and Li [31] concluded that the guarantee played an important role in sorting out the risk classes of the borrowers.
As for peer-to-peer lending, a great number of researches focused on investigating the factors that determine the market performance, including transaction volume [5,17,32] and funding success rate [12,33,34]. For instance, Duarte et al. [33] investigated the impact of the characteristics of the borrower on funding success rate. Meanwhile, plenty of scholars focused on the behavior of the platform users, especially the investors, including herding behaviors [35,36,37] and discrimination behavior [38,39,40]. Although some scholars recognized the importance of the guarantee mechanism, the guarantee mechanism of peer-to-peer lending platforms had not been systematically studied [41], and the existing researches mainly focused on the analysis of the guarantee mechanism’s classification [42,43,44], influence [42,45,46], and legal risk [43,47,48]. Specifically, for the classification of guarantee mechanism, Li [42] divided the guarantee mechanism into platform self-guarantee mode, co-guarantee mode, and third-party guarantee mode. Chen [43] divided the guarantee mechanism into four types: third-party institution mode, risk reserve fund (a special fund set up and managed by the platform enterprise to compensate the overdue project) mode, platform self-guarantee mode, and “financial institution credit + guarantee institution guarantee” mode. Zhang and Chen [44] divided the guarantee mechanism into two types according to the identity of the guarantee institution: platform enterprises mode (relying on the risk capital pool) and third-party guarantee institutions mode. As for the influence, Peng [45] pointed out that the guarantee in peer-to-peer lending platforms would concentrate the credit risk of lending activities on the guarantee institutions. Xiong et al. [46] found that the guarantee certification service in peer-to-peer lending platforms could increase the funding success rate, shorten the financing time and reduce the payment interest rate. In terms of the legal risk of the guarantee mechanism, Zhang [48] pointed out that the guarantee activities of the platform enterprises had crossed the prescribed business scope. Ye [47] also pointed out that the platform enterprises are no longer information intermediaries, but guarantee agencies operating without a license when the platform enterprises provide guarantees with their own funds.
In general, researches on the guarantee mechanisms of peer-to-peer lending platforms are mostly qualitative analysis and case studies, while theoretical and empirical researches on the internal microscopic mechanism of guarantee are relatively scarce.

1.2. Contributions

In this context, this research intended to apply evolutionary game theory to analyze the influence pathway of the guarantee mechanism, as the game between the stakeholders in the peer-to-peer lending platform repeated many times. In addition, a mediating effect model was applied to investigate the empirical influence of the guarantee mechanism on the scale of platform users and transaction volume, so as to reveal the impact of the guarantee on the platform operation.
As for the research content, different from the previous researches like the study of Zhang et al. [41], this research tried to distinguish the different influence pathways between platform self-guarantee mode and third-party guarantee mode, and verify their influence on platform users’ participation and market transaction. From the perspective of the research methods, compared with the existing researches [42,45], this research did not analyze the impact of the guarantee mechanism qualitatively, but adopted the method of combining the theoretical analysis and empirical test, paying more attention to the interaction between platform enterprises and platform users, and the dynamics of the peer-to-peer lending transaction.
The remainder of this paper is organized as follows: Section 2 constructs the evolutionary game model and analyzes the influence pathway of the guarantee mechanism on users’ participation. Section 3 applies a mediating effect model to analyze the influence of the guarantee mechanism on users’ participation and transaction volume of the platform based on the empirical operation data of China’s peer-to-peer lending platforms. Finally, conclusions are drawn in Section 4.

2. Evolutionary Game Analysis

With the development of evolutionary game theory, its application has gradually penetrated from the field of biology to the fields of sociology, economics, and others [16]. For example, Gu et al. [49] used an evolutionary game model to analyze the supervision of the credit risk of the peer-to-peer lending platform. In contrast to the study of Gu et al. [49], this research focuses on the participation strategies of users on both sides of the peer-to-peer lending platform, constructing a four-party evolutionary game model, and concentrates on the analysis of the influence of the guarantee mechanism on the evolution stability strategy (ESS) [50].

2.1. Model Framework and Assumption

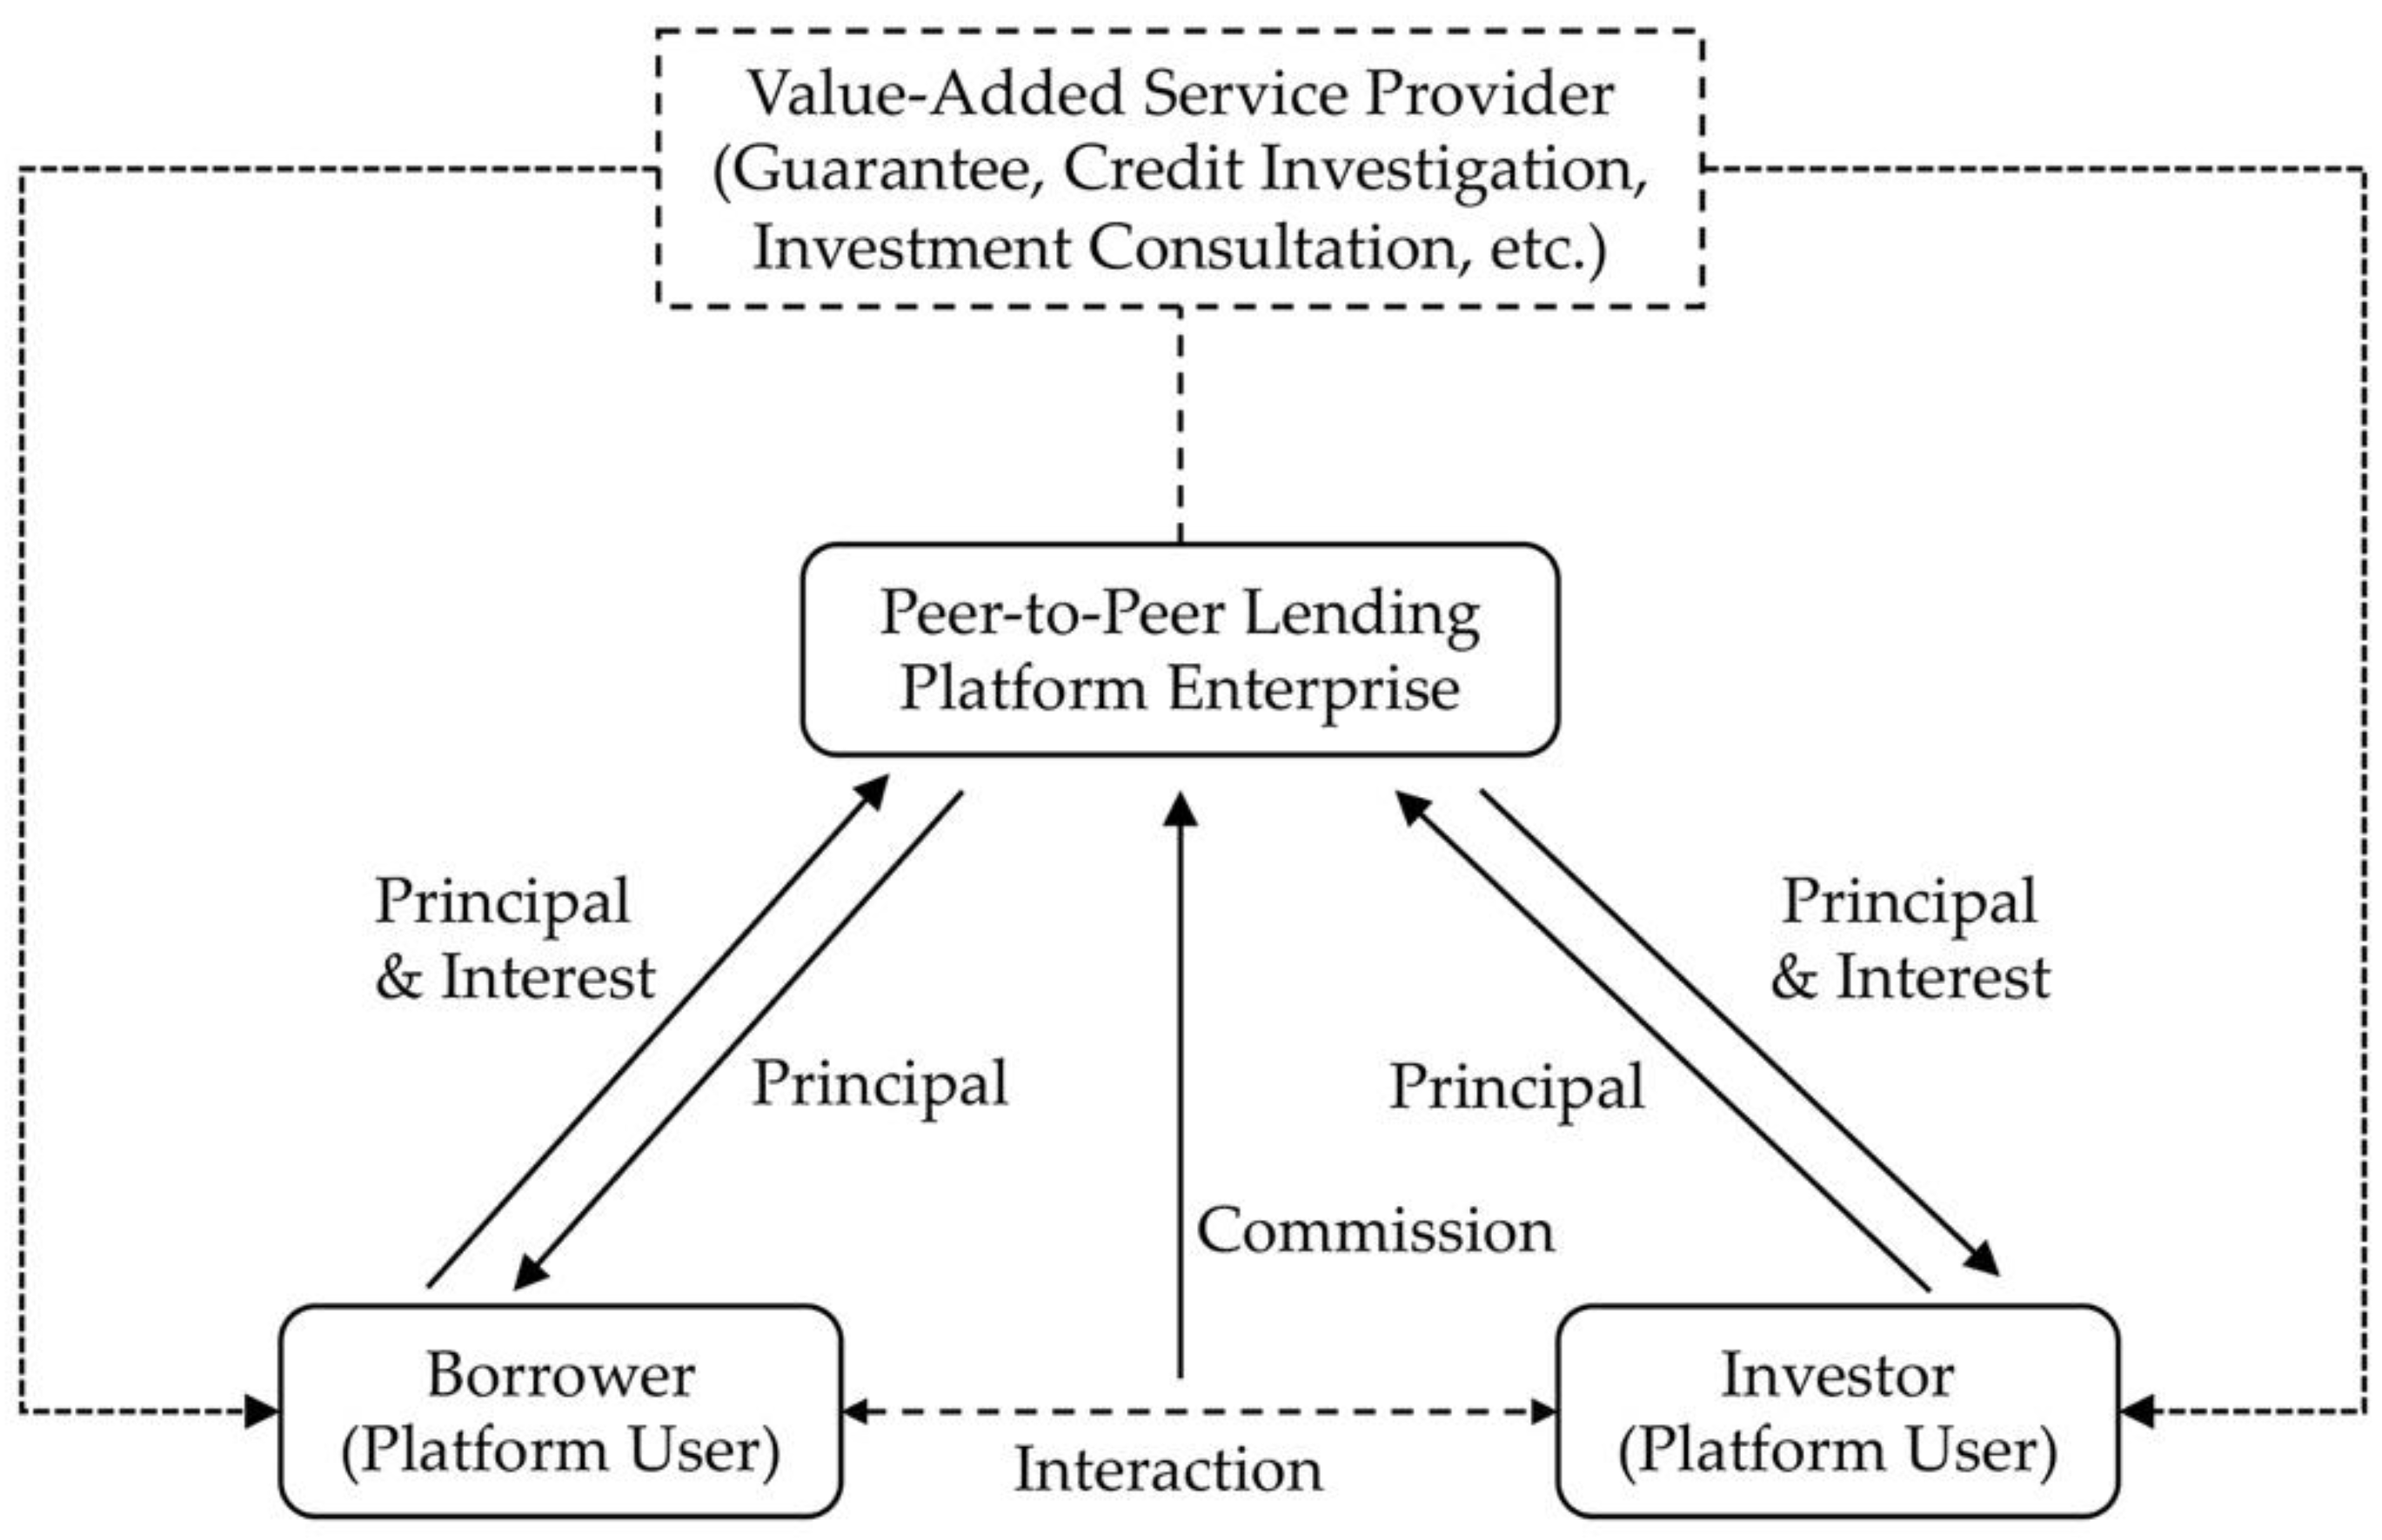
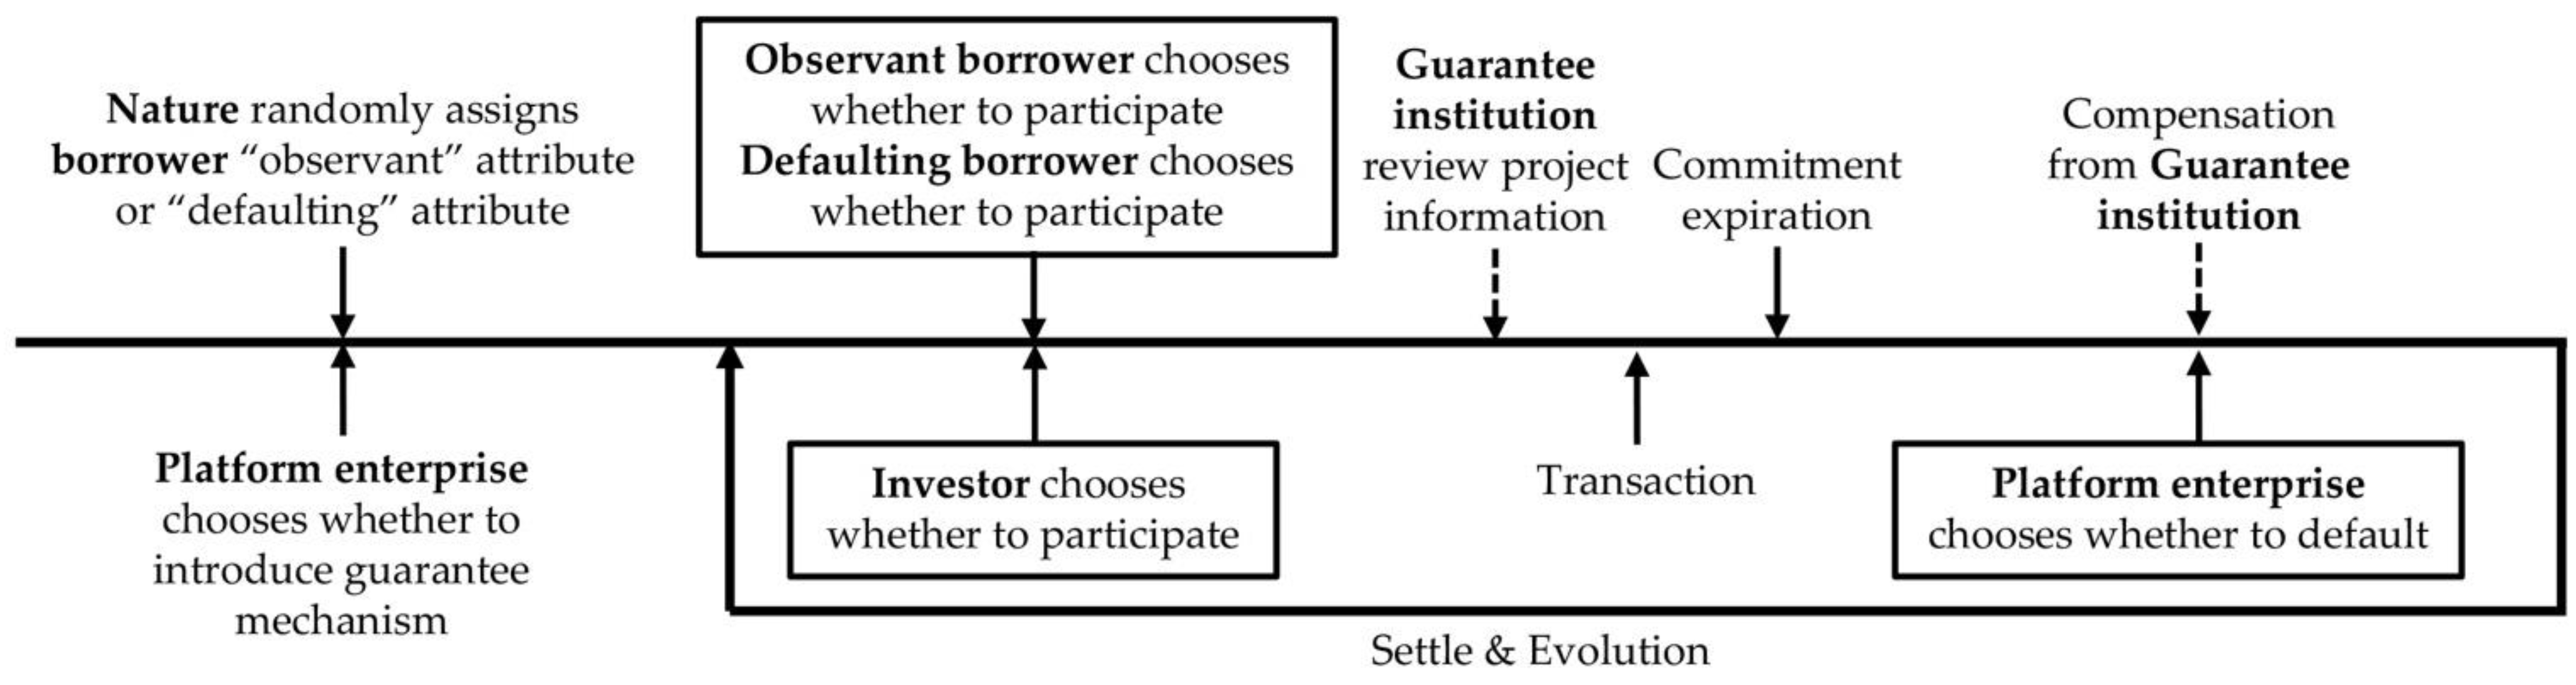
2.1.1. Model Framework

The evolutionary game model constructed in this research focuses on the influence of the guarantee mechanism on users’ participation in the peer-to-peer lending platform. According to identity of the guarantee institution, this research classifies the guarantee mechanism into two types: platform self-guarantee mechanism (platform enterprises provide a guarantee) and third-party guarantee mechanism (intermediary agencies, independent from platform enterprises and users, provide a guarantee). The guarantee mechanism discussed in this research is only related to the guarantee and compensation for the potential defaulting behavior of the borrowers. In addition, this research divides borrowers into the observant borrower group and the defaulting borrower group. Observant borrowers refer to those who publish real information of the project on the platform and will repay the principal and interest upon the expiration of project according to the transaction commitment, while defaulting borrowers refer to those who fabricate information to defraud money. Hence, we constructed the evolutionary game model which includes four types of stakeholders: observant borrower, defaulting borrower, platform enterprise, and investor, presuming that all stakeholders are finite rational people.
As this evolutionary game model aims to analyze the engagement of users, we focused on the strategies about the “participation” behavior of platform users. Given that the operation behavior of platform enterprises is very important to the users’ market participation, we took the strategies about compliance operation of the platform enterprises into consideration. Observant borrowers can choose to propose the information of their project on the platform and interact with the investors based on the desire of making a transaction (hereinafter referred to as “Participation”, OB1). Additionally, they can choose not to disclose the relevant information so as to give up the opportunity of making a transaction (hereinafter referred to as “Non-Participation”, OB2). From the perspective of the defaulting borrowers, they may choose to make up fake information to defraud money (hereinafter referred to as “Participation”, DB1) or may not (hereinafter referred to as “Non-Participation”, DB2). As for the platform enterprises, it is possible for them to maintain the normal operation of the platform (hereinafter referred to as “Regular Operation”, PE1). Additionally, the platform enterprises may choose to violate operation guidelines, for example, shutting down the platform, keeping the returned principal and interest (hereinafter referred to as “Irregular Operation”, PE2). Investors may choose to make transactions on the platform (hereinafter referred to as “Participation”, IN1) or may not (hereinafter referred to as “Non-Participation”, IN2).
The strategy-making order of this evolutionary game is shown in Figure 3. Before the game starts, the borrower randomly falls between the observant borrower or the defaulting borrower (“nature” selecting), and the platform enterprise chooses whether to introduce the guarantee mechanism (we discuss this problem by analyzing two scenarios below). The complete sequence of a single evolution process is as follows: (1) First, the borrowers (including observant borrowers and defaulting borrowers) and the investors choose whether to participate in the transaction; (2) the guarantee institution (if any) will review the information and eliminate the identified fictitious projects (defaulting borrowers), then the investors will lend the principal to the borrowers (the review process could take place before the investors choose whether to participate in the transaction, and we make it the second step of the sequence for the sake of presentation; it does not make a difference to the model analysis); (3) upon the expiration of the transaction commitment, the observant borrowers will repay the principal and interest through the accounts opened in the platform, while the defaulting borrowers will not return the principal and interest, that is, not taking any further steps; (4) the platform enterprises choose whether to violate operation guidelines (keeping the returned principal and interest), and the guarantee institution (if any) will compensate the investors for those participating in the non-identified fictitious transaction. Additionally, if the platform enterprise also assumes the role of the guarantee institution, the irregular operations also mean the removal of the compensation function. To some extent, the evolution process also reflects herding behaviors of all stakeholders. Actually, the theoretical model developed in this research focuses on the capital flow mode depicted in Figure 2. For the mode that the capital flow directly linked with the investors and borrowers, described in the notes of Figure 2, the corresponding analysis would be much simpler, as the operations of the platform enterprises only make a difference to the abovementioned compensation function. Indeed, we could easily reach a conclusion similar to that presented in the following analysis, based on the method we applied in this section (Section 2).

2.1.2. Model Assumption

Let x be the possibility of the observant borrower taking the OB1 strategy; then, 1 x represents the possibility of the observant borrower taking the OB2 strategy; x satisfies the condition of 0 x 1 . Similarly, y represents the possibility of the defaulting borrower taking the DB1 strategy, while 1 y represents the possibility of the defaulting borrower taking the DB2 strategy; y satisfies the condition of 0 y 1 . z represents the possibility of the platform enterprises taking the PE1 strategy, and 1 z represents the possibility of the platform enterprises taking the PE2 strategy; z satisfies the condition of 0 z 1 . φ represents the possibility of the investor taking the IN1 strategy, and 1 φ represents the possibility of the investor taking the IN2 strategy; φ satisfies the condition of 0 φ 1 .
This research investigated two scenarios. First of all, we considered the scenario in which the platform enterprises do not introduce any guarantee mechanism. We refer to the evolutionary game model under this scenario as the basic model. Supposing that the principal of the investor (also referred to as the investment amount of the project) is M , the promised interest paid by the borrower is R , and the commission charged by the platform enterprises is T . The observant borrower uses the principal obtained from the investor to implement the project with profit W , while the defaulting borrower does not make any further action after receiving the principal from the investor. Taking the external supervision into consideration, the post-event penalty imposed by the regulator on the irregular platform enterprises is L P E , while the post-event penalty on the defaulting borrower is L D B (the penalty could be an administrative fine or a credit loss).
On the basis of the basic model, this research further considered the influence of the guarantee mechanism, which is referred to as scenario 2. It was assumed that the guarantee mechanism would take the borrower C (this cost can be the monetary measure of the cost of time) to provide the relevant information for reviewing. The platform enterprises would spend E to carry out the project information review by themselves or hire a third-party institution. Given that this research did not compare these two kinds of guarantee mechanisms in the evolutionary game analysis directly, we thus assumed the cost of introducing these two mechanisms was at the same level. In fact, in the subsequent model derivation, since this parameter existed in all strategy combinations when introducing the guarantee mechanism, it had no effect on the equilibrium results. Further, this research assumes that the probability of identifying the fictitious project is f , and the corresponding transaction would not occur if the fictitious information was identified in advance; otherwise, the guarantee institution should compensate M for those investors involved in the fictitious transaction. In reality, the compensation amount of the guarantee mechanism depends on the provisions of the specific contract. In order to make the analysis more focused, this research directly assumed the compensation amount equals to the principal of the investor. We assumed θ , the proportion of the observant borrowers in the whole borrower group, to be exogenous to the whole game system. To make the payoff of each participant more explicit, this research further assumed that the total number of the borrowers and total number of the investors were both equal to 1. In this way, θ also represents the proportion of investors that the observant borrowers would trade with, and 1 θ represents the proportion of investors that the defaulting borrowers would trade with (before the review of the guarantee institution). The definitions of the related parameters are shown in Table 1.

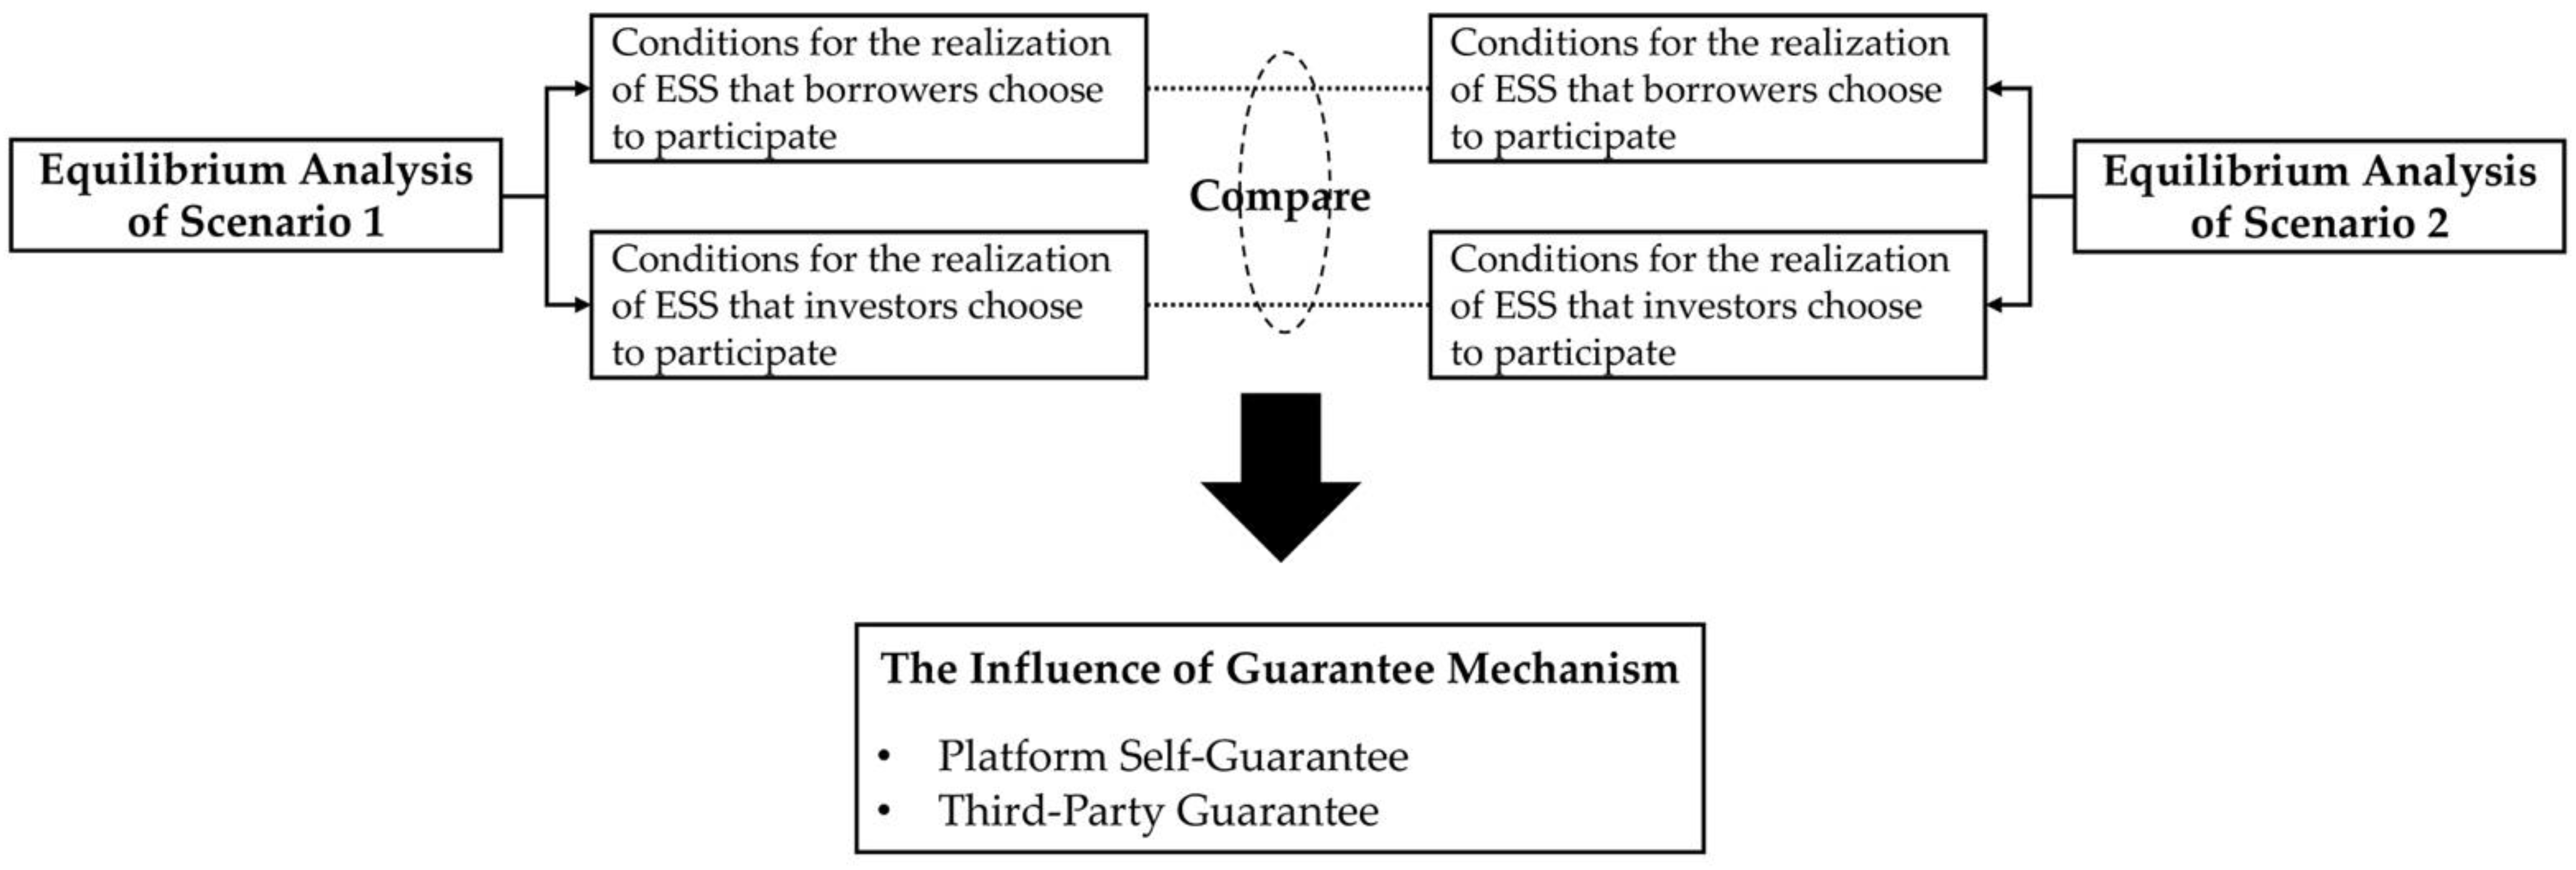
2.2. Equilibrium Analysis of the Evolutionary Game

Based on the abovementioned model assumptions, we conducted the equilibrium analysis of the evolutionary game, and the block diagram of the analysis is shown in Figure 4.

2.2.1. Scenario 1: No Guarantee

When the investor chooses the IN2 strategy, that is, the investor does not participate in the transaction, the payoff of all game participants is 0. When the investor chooses the IN1 strategy, the payoff of the game players is shown in Table 2.
According to evolutionary game theory, the strategy will gradually evolve in the system if its return is higher than the average return, and we can use the replicated dynamic equation to analyze the ESS [16]. The replicated dynamic equation is an evolutionary mechanism based on differential equations, and the detailed principles can be found from the study of Taylor and Jonker [51], Smith [52], and Weibull [53].
According to the payoff matrix in Table 2, we denote t as the evolution time, and the replicated dynamic equation system (I) can be obtained as follows:
{ F 1 ( x ) = d x d t = x ( 1 x ) φ θ ( W R ) F 2 ( y ) = d y d t = y ( 1 y ) φ ( 1 θ ) ( M L D B ) F 3 ( z ) = d z d t = z ( 1 z ) x φ [ L P E + θ ( T M R ) ] F 4 ( φ ) = d φ d t = φ ( 1 φ ) { x θ [ z ( R T ) ( 1 z ) M ] y ( 1 θ ) M }
where F 1 ( x ) is the replicated dynamic equation of an observant borrower taking the OB1 strategy; F 2 ( y ) is the replicated dynamic equation of a defaulting borrower taking the DB1 strategy;   F 3 ( z ) is the replicated dynamic equation of a platform enterprise taking the PE1 strategy; and F 4 ( φ ) is the replicated dynamic equation of an investor taking the IN1 strategy (see Appendix A for the detailed derivation process).
From the replicated dynamic equation system (I), we can obtain the conditions for the realization of ESS in which the observant borrower takes the OB1 strategy ( R C 1 ), the defaulting borrower takes DB1 strategy ( R C 2 ), the platform enterprise takes the PE1 strategy ( R C 3 ), and the investor takes IN1 strategy ( R C 4 ). These conditions are shown in Equation (2):
{ R C 1 = φ θ ( W R ) 0 R C 2 = φ ( 1 θ ) ( M L D B ) 0 R C 3 = x φ [ L P E + θ ( T M R ) ] 0 R C 4 = x θ [ z ( R T ) ( 1 z ) M ] y ( 1 θ ) M 0

2.2.2. Scenario 2: Guarantee Mechanism

When the platform enterprises introduce the guarantee mechanism, the guarantee institution will examine and identify the defaulting borrowers in advance with probability f . If the investor transacts with the defaulting borrower not identified in advance, the guarantee institution would compensate for its loss.
Similarly, when the investor chooses the IN2 strategy, the peer-to-peer lending transaction would not occur, and the payoff of all the participants is 0. When the investor chooses the IN1 strategy, the payoff of the game players is shown in Table 3. Here, we incorporated the parameter s to distinguish different kinds of guarantee mechanisms ( s = 1 represents the platform self-guarantee mechanism, while s = 0 represents the third-party guarantee mechanism).
Similarly, according to the payoff matrix in Table 3, we can obtain the replicated dynamic equation system (II) in which G 1 ( x ) is the replicated dynamic equation of an observant borrower taking the OB1 strategy; G 2 ( y ) is the replicated dynamic equation of a defaulting borrower taking the DB1 strategy;   G 3 ( z ) is the replicated dynamic equation of a platform enterprise taking the PE1 strategy; and G 4 ( φ ) is the replicated dynamic equation of an investor taking the IN1 strategy, as shown in Equation (3). See Appendix B for the detailed derivation process.
{ G 1 ( x ) = d x d t = x ( 1 x ) φ θ ( W R C ) G 2 ( y ) = d y d t = y ( 1 y ) φ ( 1 θ ) [ ( 1 f ) M L D B C ] G 3 ( z ) = d z d t = z ( 1 z ) φ { x [ L P E + θ ( T M R ) ] s y [ ( 1 θ ) ( 1 f ) M ( 1 x ) L P E ] } G 4 ( φ ) = d φ d t = φ ( 1 φ ) { x θ [ z ( R T ) ( 1 z ) M ] s y ( 1 z ) ( 1 θ ) ( 1 f ) M }
From the replicated dynamic equation system (II), we can obtain the conditions for the realization of ESS in which the observant borrower takes the OB1 strategy ( R C 1 ); the defaulting borrower takes the DB1 strategy ( R C 2 ); the platform enterprise takes the PE1 strategy ( R C 3 ); and the investor takes the IN1 strategy ( R C 4 ). These conditions are shown in Equation (4):
{ R C 1 = φ θ ( W R C ) = R C 1 φ θ C 0 R C 2 = φ ( 1 θ ) [ ( 1 f ) M L D B C ] = R C 2 φ ( 1 θ ) ( f M + C ) 0 R C 3 = φ { x [ L P E + θ ( T M R ) ] s y [ ( 1 θ ) ( 1 f ) M ( 1 x ) L P E ] } = R C 3 s φ y [ ( 1 θ ) ( 1 f ) M ( 1 x ) L P E ] 0 R C 4 = x θ [ z ( R T ) ( 1 z ) M ] s y ( 1 z ) ( 1 θ ) ( 1 f ) M = R C 4 + y ( 1 θ ) M [ 1 s ( 1 z ) ( 1 f ) ] 0

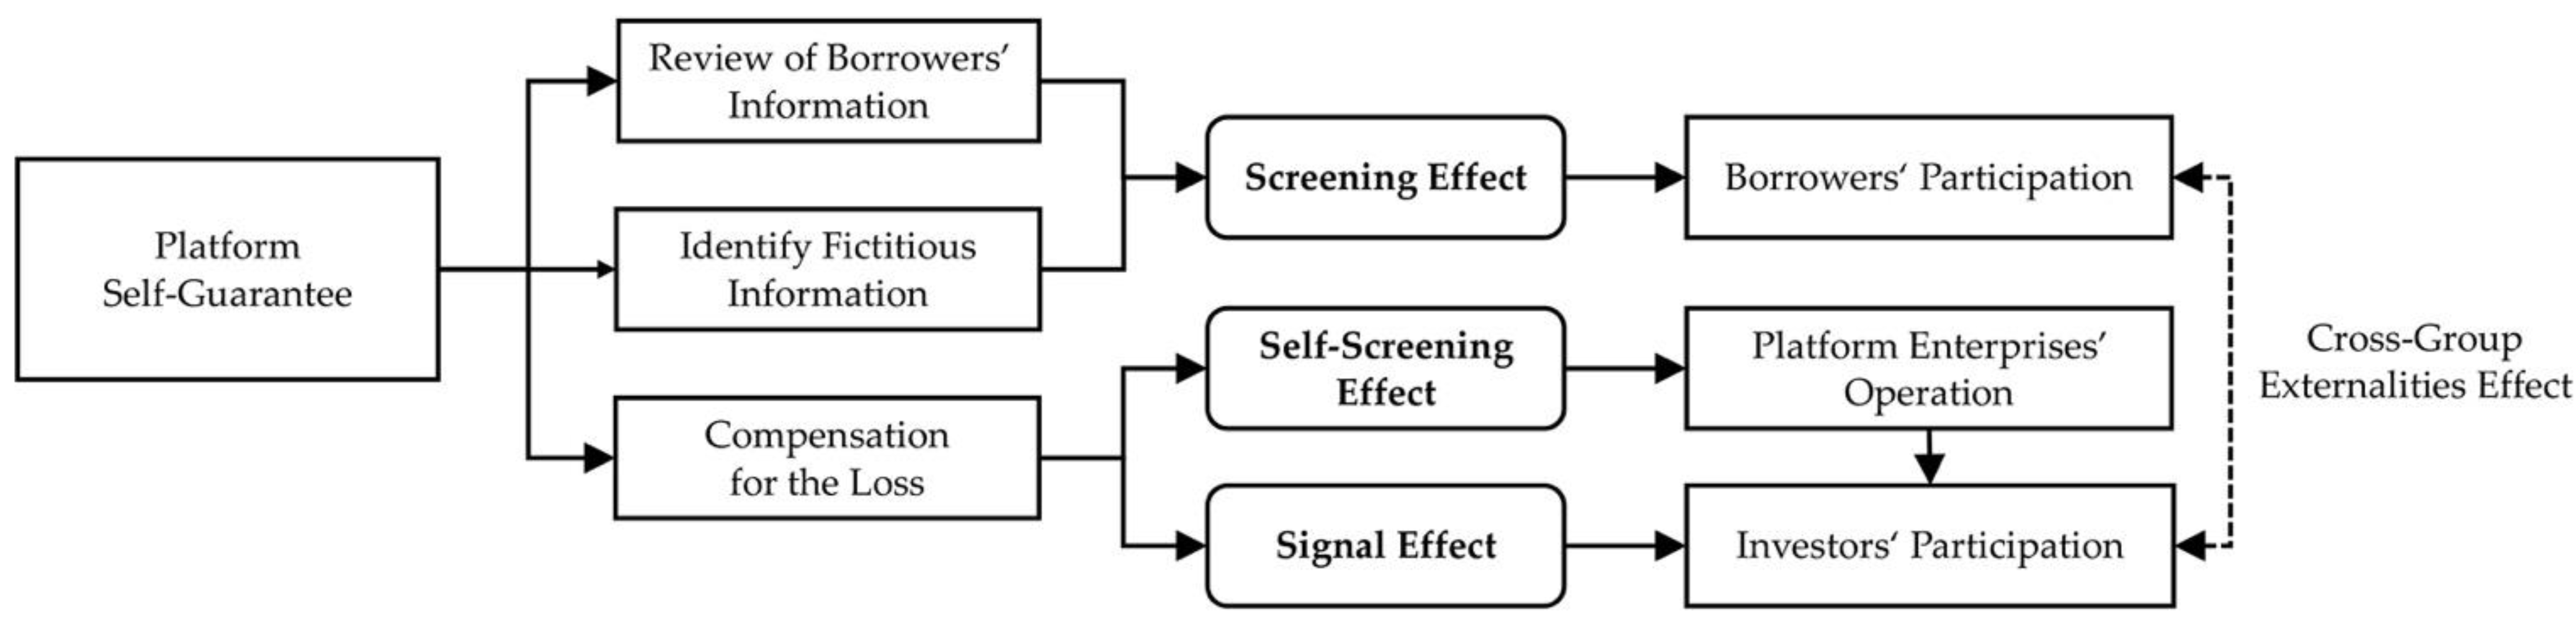
Analysis of Platform Self-Guarantee Mechanism

We first analyzed the influence on the participation strategy of the borrower group after introducing the platform self-guarantee mechanism. As for the observant borrower, we have R C 1 = R C 1 φ θ C . As φ θ C 0 , we can easily come to the conclusion that the introduction of the platform self-guarantee mechanism increases the cost of the observant borrower, which is not conducive for the observant borrowers to choose the “Participation” strategy. For the defaulting borrower, there is R C 2 = R C 2 φ ( 1 θ ) ( f M + C ) . As φ ( 1 θ ) ( f M + C ) 0 , we can know that the introduction of the platform self-guarantee mechanism not only increases the cost of the defaulting borrower, but also reduces its potential income due to the identification of fictitious information. Hence, it is not conducive for the defaulting borrowers to choose the “Participation” strategy. On the whole, the platform self-guarantee mechanism reduces the participation of the borrower group by reviewing the borrowers’ information and identifying the fictitious information (avoiding the fictitious transaction), and we call it the “screening effect” of the platform self-guarantee mechanism.
As for the strategy of the platform enterprises, we have R C 3 = R C 3 φ y [ ( 1 θ ) ( 1 f ) M ( 1 x ) L P E ] . When the regulators have strong constraints on the platform enterprises, meeting L P E ( 1 θ ) ( 1 f ) M ( 1 x ) , we have φ y [ ( 1 θ ) ( 1 f ) M ( 1 x ) L P E ] 0 , which means that the introduction of the platform self-guarantee mechanism is conducive to platform enterprises’ choosing the “Regular Operation” strategy. On the contrary, when the regulators implement loose constraints on the platform enterprises, the platform self-guarantee mechanism will instead become the motivation of platform enterprises’ irregular operation. Therefore, the platform self-guarantee mechanism will promote “self-selection” (positive selection or adverse selection) of the platform enterprises; that is, the platform self-guarantee mechanism has a “self-screening effect”.
Next, we considered the participation strategy of the investor group. Given that R C 4 = R C 4 + y ( 1 θ ) M [ 1 ( 1 z ) ( 1 f ) ] , and y ( 1 θ ) M [ 1 ( 1 z ) ( 1 f ) ] 0 , the introduction of the platform self-guarantee mechanism is conducive to investors’ choosing the “Participation” strategy. It is not difficult to find that the platform self-guarantee mechanism increases the participation of the investors group by identifying the fictitious project and compensating the potential loss; that is, there exists a “signal effect” that enhances the credit of transactions.
As for the relationship between different stakeholders, it is not difficult to see from R C 1 ,   R C 2 , and R C 4 that there exists an interaction between platform users, which is also called cross-group externalities in the two-sided market theory [7]. Additionally, from R C 4 , we can know that the participation strategy of investors would be affected by the strategy of platform enterprises. Hence, the platform self-guarantee mechanism also has an indirect influence on the investor’s participation strategy by influencing the strategy of platform enterprises. Given that R C 4 z = x θ ( M + R T ) + y ( 1 θ ) ( 1 f ) M 0 , we can easily know that the higher the possibility of the platform enterprises taking the “Regular Operation” strategy, the higher possibility of the investors taking the “Participation” strategy. Proposition 1 concludes the above analysis of the impact of the platform self-guarantee mechanism on the strategy of game stakeholders.
Proposition 1.
The platform self-guarantee mechanism reduces the participation of the borrowers through a “screening effect”, while it increases the participation of the investors through a “signal effect”. Additionally, the platform self-guarantee mechanism also has a “self-screening effect” on the platform enterprises’ strategies and indirectly affects the participation of investors, and the direction of its effect is related to the intensity of external constraints from regulators.
The influence pathway of the platform self-guarantee mechanism on platform users’ participation is depicted in Figure 5.

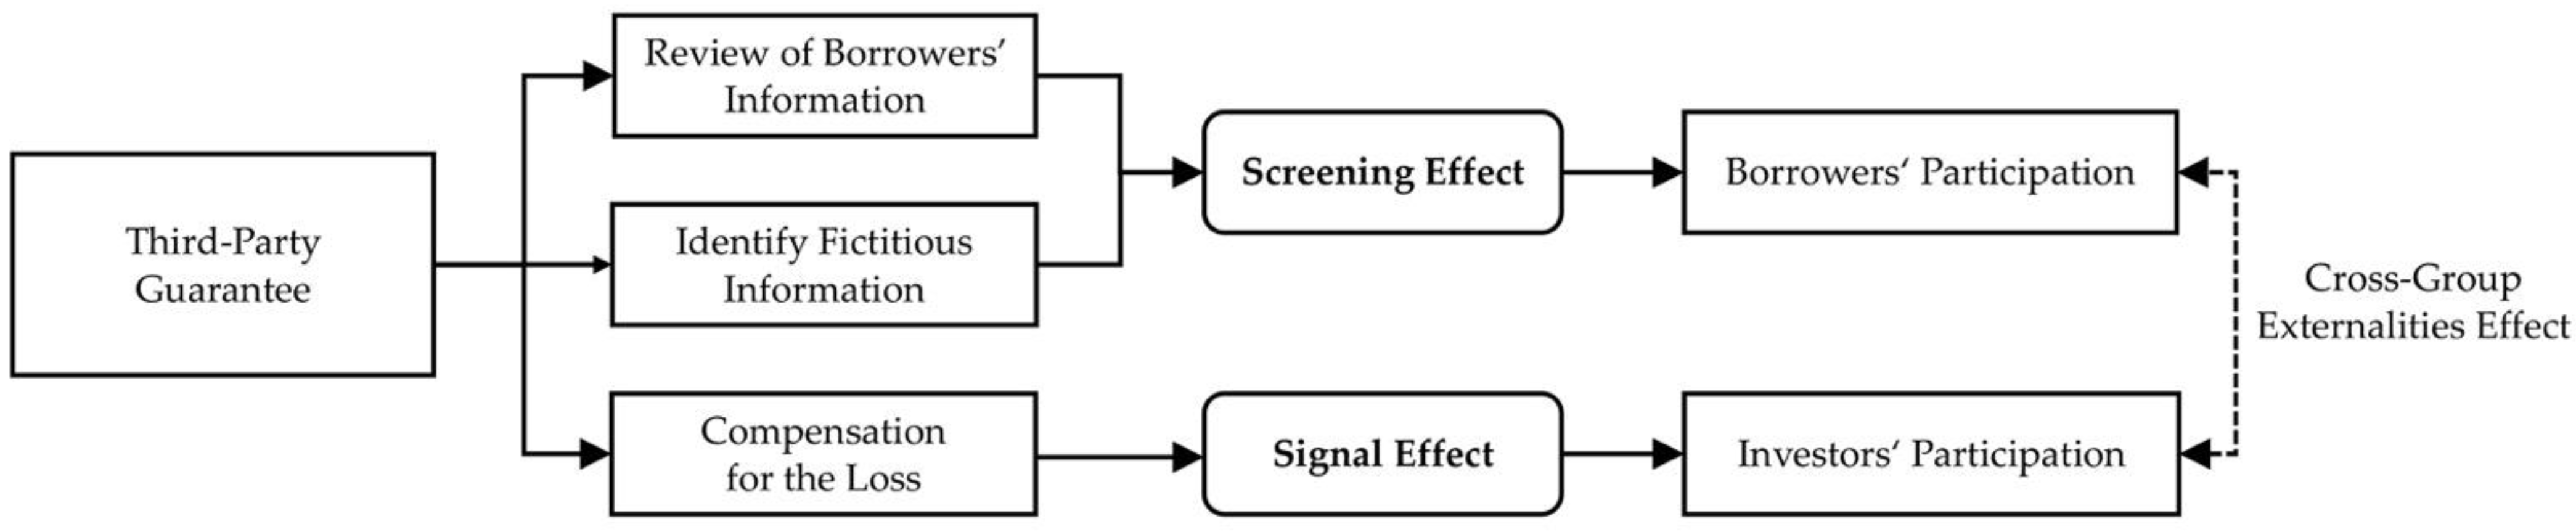
Analysis of Third-Party Guarantee Mechanism

As for the participation strategy of borrowers, similar to the influence of platform self-guarantee mechanism, the third-party guarantee mechanism also reduced the participation of the borrowers through a “screening effect”, that is, reviewing borrowers’ information and identifying the fictitious information.
As for the strategy of platform enterprises, given that s = 0 , we have R C 3 = R C 3 . It can be seen that the introduction of the third-party guarantee mechanism had no direct influence on the strategy decision of platform enterprises.
For the participation strategy of investors, we have R C 4 = R C 4 + y ( 1 θ ) M , and y ( 1 θ ) M 0 , which shows that the introduction of the third-party guarantee mechanism was conducive to investors’ choosing the “Participation” strategy. It is not difficult to find that third-party guarantee mechanism promotes the participation of the investors through a “signal effect”, that is, the signal of compensating the potential loss.
Similarly, there exist cross-group externalities between two platform user groups. Proposition 2 concludes the above analysis of the impact of the third-party guarantee mechanism on the strategy of game stakeholders.
Proposition 2.
The third-party guarantee mechanism reduces the participation of the borrowers through a “screening effect”, while it increases the participation of the investors through a “signal effect”.
The influence pathway of the third-party guarantee mechanism on platform users’ participation is depicted in Figure 6.

3. Empirical Analysis of China’s Peer-to-Peer Platform

Since the evolutionary game model applied in Section 2 had analyzed the influence pathway of the guarantee mechanism on platform users’ participation from a theoretical perspective, this research tried to further discuss the impact of the guarantee mechanism empirically. In fact, the guarantee mechanism played an important role in promoting the rapid development of China’s peer-to-peer lending industry, but the lack of a clear understanding of the guarantee mechanism in industrial practice is also one of the reasons for the decline in China’s peer-to-peer lending industry.
According to Proposition 1, we developed two hypotheses of the platform self-guarantee mechanism, that is, Hypothesis 1 and Hypothesis 2. Specifically, given that China’s social credit system is still in the accelerated constructing stage [54], the cost of platform enterprises’ default behavior is relatively low; hence, we supposed the influence of the self-screening effect goes beyond that of the signal effect, and proposed Hypothesis 2.
Hypothesis 1 (H1).
The platform self-guarantee mechanism negatively and significantly influences the scale of borrowers.
Hypothesis 2 (H2).
The platform self-guarantee mechanism negatively and significantly influences the scale of investors.
According to Proposition 2, we developed hypotheses of the third-party guarantee mechanism, namely Hypothesis 3 and Hypothesis 4.
Hypothesis 3 (H3).
The third-party guarantee mechanism negatively and significantly influences the scale of borrowers.
Hypothesis 4 (H4).
The third-party guarantee mechanism positively and significantly influences the scale of investors.
Transactions on peer-to-peer lending platforms originate from the participation of borrowers and investors; hence, the guarantee mechanism would influence the transaction volume of the platform by affecting the scale of borrowers and investors. Similar to the study of Luo and Gu [17], we consider the mediating effect of the scale of platform users; hence, we adopted a mediating effect model [55,56]. Hypothesis 5 is shown as below.
Hypothesis 5 (H5).
The scale of the platform users plays a mediating role in the impact of guarantee mechanism on transaction volume of the platform.

3.1. Materials and Methods

3.1.1. Model Setting

The mediating effect model was the main model applied in our empirical study. Considering that the scale of borrowers and investors may influence each other (cross-group externalities effect), and the pricing level of the platform transaction also affects the scale of platform users (the scale of users in turn affects the pricing level of transaction), we adopted the simultaneous equation model method when constructing the mediating effect model. The simultaneous equation model can take the interaction and influence among different variables into consideration from a systematic perspective, and the regression results can directly reflect the comprehensive influence intensity.
As we mentioned above, similar to the study of Luo and Gu [17], we adopted a mediating effect model in this research, taking the scale of users as the mediating variables. However, Luo and Gu [17] paid more attention to the impact of introducing venture capital on the platform transaction volume, analyzing the corresponding mediating pathways related to the scale of users, while this research focused on the guarantee mechanism, which was rarely found in previous researches. In addition, Luo and Gu [17] constructed a two-stage fixed effects regression model when dealing with the endogeneity problem of the scale of users, while this research applied the simultaneous equation model. Actually, simultaneous equation model is commonly applied in researches on peer-to-peer lending platforms, especially the test for the existence of cross-group externalities, such as the study of Gu et al [5], Xue and Zuo [57]. In contrast to the previous researches [5,57], the simultaneous equation model constructed in this research also considered the interaction between the interest rate and the scale of users; that is, interest rate was also regarded as an endogenous variable, and three equations were established in the model, to make the results of the simultaneous equation model more applicable. Specifically, we constructed Equations (5) and (6) as the empirical models to analyze the impact of the guarantee mechanism. We named these three equations in Equation (5) according to the dependent variable, that is, NOB Equation, NOI Equation, and Rate Equation. The definitions and explanations of each variable are shown in Table 4.
{ N O B i , t = α 0 + α 1 N O I i , t + α 2 R a t e i , t + α 3 S G i , t + α 4 T G i , t + α 5 C o n t r o l s i , t + u 1 , i , t N O I i , t = β 0 + β 1 N O B i , t + β 2 R a t e i , t + β 3 S G i , t + β 4 T G i , t + β 5 C o n t r o l s i , t + u 2 , i , t R a t e i , t = γ 0 + γ 1 N O B i , t + γ 2 N O I i , t + γ 3 C o n t r o l s i , t + u 3 , i , t
V O T i , t = δ 0 + δ 1 N O B i , t + δ 2 N O I i , t + δ 3 R a t e i , t + δ 4 S G i , t + δ 5 T G i , t + δ 6 C o n t r o l s i , t + u 4 , i , t

3.1.2. Data Collection

The data from WDZJ are widely used for the research on China’s peer-to-peer lending industry (for instance, Lu and Lan’s study [59], Luo and Gu’s study [17], and Wang and Fu’s study [60]). This research first collected transaction data and characteristic data of peer-to-peer lending platforms from the WDZJ, and the sample period was from August 2018 to January 2019, covering 263 platforms and a total of 1456 monthly data of platforms (the sample period is not required to be large as the model established mostly considered the platform individual characteristic of the sample and we adopted the pooled regression method; collecting data of sample platforms over multiple months can help alleviate the problem caused by abnormal operation or data collection error on individual platforms at specific month; see Appendix C for more details of the selection of fixed effect model, random effect model, and pooled regression model). As can be seen from Figure 1, this sample period is in the mature development stage of China’s peer-to-peer lending market, which can better reflect the interaction of market participants. For these collected samples, this research had made the revisions described below: (1) Excluding the samples of problematic platforms or suspended operation platforms; (2) eliminating the platform samples with missing transaction data in the sample period; (3) making up for the missing characteristic data of the platform by using the relevant information from WDTY (https://www.p2peye.com, accessed on 2 March 2019), the official website of the platform enterprises, and other websites. After completing the abovementioned revisions, this research obtained 1260 monthly data covering 210 platforms.
As for the representativeness of the samples, we summarized the monthly transaction volume of the revised samples in the sample period and compared it with the entire peer-to-peer lending industry in China (see Table 5). It can be seen from Table 5 that in the sample period, the proportions of the total transaction volume of the sample platforms on the industry were all greater than 50%, which indicated that the sample selected in this research can well represent the peer-to-peer lending industry in China, and the conclusions reflected by the samples are highly applicable to the industry.
The descriptive statistics of the variables involved in the empirical analysis are shown in Table 6. It should be noted that, as the key experimental variables are dummy variables, we did not carry out the logarithmic processing of data, in order to obtain an obvious economic understanding. Considering the potential problem of heteroscedasticity, we adopted White heteroscedasticity correction standard error (robust standard error).
The correlations among those variables are shown in Table 7. The VIF of all variables of pooled regression of Equation (6) are smaller than 3, and the mean VIF is 1.36.

3.2. Result

3.2.1. Testing of the Fitness of the Model Setting

We applied the simultaneous equation model method in the mediating effect model, and we need to verify the fitness of the simultaneous equation model setting. Firstly, we judged the identifiability of the simultaneous equation model [61]. By testing the order condition and rank condition, it could be found that all equations in Equation (5) were identified (overidentified), indicating the estimability of Equation (5) and the appropriateness and necessity of applying three-stage least squares method (3SLS) [61]. Next, we examined the endogeneity of variables NOB, NOI and Rate. The test of multiple endogenous variables was based on the test method of single endogenous variable [61], and we used Stata15.1 to carry out the relevant test, as shown in Table 8. In summary, the NOB Equation, NOI Equation, and Rate Equation had significant endogeneity problems; hence, it was appropriate to adopt the simultaneous equation model to carry out the empirical analysis.

3.2.2. The Impact of Guarantee Mechanism

The 3SLS method was used for the estimation of Equation (5). The 3SLS method can estimate all the equations as a whole system considering the relations among the equations. Traditional R2 is not applicable to the simultaneous equation model, so we used Chi-squared (Chi2) instead. Stata15.1 software was used for model estimation, and the main results are summarized as shown in Table 9.
Model 1 and Model 2 are the regression results of NOI Equation and NOB Equation, considering bidirectional causality problems. It is not difficult to see from the results of Model 1 and Model 2 that there exists a significant cross-group externalities effect between borrowers and investors, which is consistent to the result of Xue and Zuo [57] and Gu et al. [5]. In addition, it echoes the result shown in the study of Gu et al. [5] that the externalities of the investors are much higher than that of the borrowers.

The Impact of the Guarantee Mechanism on the Scale of Borrowers

According to the result of Model 1, introducing the platform self-guarantee mechanism had a significant negative effect on the scale of borrowers (coefficient was −2.9825, significance level of 5%), and introducing the third-party guarantee mechanism also had a significantly negative effect on the scale of borrowers (coefficient was −1.6589, significance level of 1%), supporting H1 and H3. In other words, this result is consistent with Proposition 1 and Proposition 2; that is, introducing the guarantee mechanism will have a screening effect on the borrowers, reducing their participation.

The Impact of the Guarantee Mechanism on the Scale of Investors

According to the results of Model 2, the introduction of the platform self-guarantee mechanism had a significant negative effect on the scale of investors (the coefficient was −1.0756, significance level of 5%), suggesting the support for H2. Meanwhile, it can be easily found that the introduction of the third-party guarantee mechanism had a significant positive effect on the scale of investors (coefficient was 0.7888, significance level of 1%), supporting H4. The different impacts also reflected the rational herd behaviors of the investors, as the investors would distinguish these two guarantee mechanisms instead of treating them as the same signal, forming their own expectations to make decisions.

The Impact of the Guarantee Mechanism on Transaction Volume

Model 4 added two variables (NOB and NOI) on the basis of Model 3, and it could be found that the R2 of Model 4 climbed from 0.2757 to 0.7928, indicating that the scale of borrowers and investors plays a very important role in explaining the change of platform transaction volume, echoing previous studies like Jiang [32], Luo and Gu [17]. Model 5 added two variables (SG and TG) on the basis of Model 4 so that the direct influence of the guarantee mechanism on platform transaction volume could be investigated.
According to the results of Model 5, it was found that the platform self-guarantee mechanism had a direct effect on platform transaction volume (coefficient was 0.8229, significance level of 1%), while the third-party guarantee mechanism had no direct effect. The possible reason is that the introduction of the third-party guarantee mechanism did not make any improvement to the operation of platform, while the introduction of the platform self-guarantee mechanism drove the platform enterprises to strengthen the information system construction, which improved operational efficiency.
Based on the results of Models 1, 2, and 5, the mediating effect, that is, the indirect effect of the guarantee mechanism on the platform transaction volume, can be tested by constructing Z-statistics of different mediating pathways (Sobel Test, see Table 10). From Table 10, it can be seen that there existed a mediating effect, supporting H5; that is, both the platform self-guarantee mechanism and the third-party guarantee mechanism had indirect effects on the platform transaction volume by affecting the scale of borrowers and investors. The overall influence intensity of the platform self-guarantee mechanism on the transaction volume of the platform was −2.8088, among which the indirect effect intensity generated by the borrower (screening effect) was −0.3552, while the indirect effect intensity generated by the investor (signal effect and self-screening effect) was −3.2765, and the direct effect intensity was 0.8229. Similarly, we calculated that the overall influence intensity of the third-party guarantee mechanism on the transaction volume of the platform was 2.2053, in which the indirect effect intensity generated by the borrower (screening effect) was –0.1976, and the indirect effect intensity generated by the investors (signal effect) was 2.4028.
From above analysis, for borrowers, the guarantee mechanism will affect their participation strategy through a screening effect; for investors, the guarantee mechanism influences their participation strategy through a signal effect and a self-screening effect; for the platform transaction, the guarantee mechanism can affect the platform transaction volume directly or indirectly (mediating effect of the scale of platform users). Specifically, the empirical results show that the platform self-guarantee mechanism has an inhibitory effect on the platform transaction, while the third-party guarantee mechanism has promoting effects on the platform transaction; hence, it is appropriate to transform a platform self-guarantee mechanism into a third-party guarantee mechanism. In fact, it can be seen that both the platform self-guarantee mechanism and the third-party guarantee mechanism weakened the participation of borrowers to some extent, thus affecting the transaction volume of the platform. Therefore, it is worth further studying how to establish a better signal mechanism.

4. Conclusions and Implications

4.1. Conclusions

Based on the evolutionary game theory, we constructed a four-party evolutionary game model, analyzed the ESS of different game participants in order to reveal the influence pathway of the guarantee mechanism on platform users’ participation, and further analyzed the empirical impact of the guarantee mechanism of China’s peer-to-peer lending platform. The main conclusions are as follows: (1) The platform self-guarantee mechanism reduced the participation of the borrowers through a “screening effect”, while it increased the participation of the investors through a “signal effect”. Additionally, the platform self-guarantee mechanism also had a “self-screening effect” on the platform enterprises’ operation strategies and indirectly affected the participation of investors, and the direction of this effect was related to the strength of external constraints from regulators. For China’s peer-to-peer lending platform, during the sample period, the introduction of platform self-guarantee mechanism reduced the average number of borrowers by 29,825 and the average number of the investors by 10,756. (2) The third-party guarantee mechanism reduced the participation of the borrowers through a “screening effect”, while it increased the participation of the investors through a “signal effect”. For China’s peer-to-peer lending platform, during the sample period, the introduction of a third-party guarantee mechanism reduced the average number of borrowers by 16,589, and increased the average number of investors by 7888. (3) The guarantee mechanism can affect platform transactions through the indirect paths of the “screening effect”, “signal effect” and “self-screening effect”. For China’s peer-to-peer lending platform, during the sample period, the introduction of the platform self-guarantee mechanism reduced the transaction volume by CNY 280.88 million, including the reduction of CNY 35.52 million through the screening effect and the reduction of CNY 327.65 million through the signal effect and self-screening effect. The third-party guarantee mechanism increased the transaction volume by CNY 220.53 million, including the reduction of CNY 19.76 million through the screening effect and the increase of CNY 240.28 million through the signal effect.

4.2. Implications and Limitations

The existing literature on the guarantee mechanism focuses more on the traditional principal–agent relationship (two-party transaction relationship) instead of the new relationship in the two-sided platform, which involves an intermediate party and cross-group externalities. This research studied the influence of the guarantee mechanism of the peer-to-peer lending platform on platform users’ participation and platform transaction, and it had positive significance for the understanding of the role of the guarantee mechanism and for the promotion of the healthy development of the peer-to-peer lending industry. The implications are shown as below: (1) In the short run, for the existing peer-to-peer lending platform that has set up the platform self-guarantee mechanism, the external constraints should be strengthened to reduce adverse selection problems of platform enterprises so as to weaken the “self-screening effect” for the investors, making the guarantee mechanism a “signal” mechanism. Specifically, platform enterprises should establish an open and transparent fund management mechanism to alleviate the concerns of investors [44]. Meanwhile, the regulator should strengthen the examination of the qualification of platform enterprises, and establish an enterprise credit mechanism, raising the default cost of platform enterprises to reduce the irregular operation behavior [49]. (2) In the medium run, since the third-party guarantee mechanism can effectively filter the defaulting borrowers, enhancing the confidence of the investors and increasing the transaction volume of the platform, platform enterprises should gradually transform the platform self-guarantee mechanism into the third-party guarantee mechanism, making the platform an information intermediary instead of a credit intermediary. Meanwhile, the regulator should strengthen the supervision of the third-party guarantee institutions to reduce the credit risk of the third-party guarantee institutions and protect the interests of the investors. (3) In the long run, the peer-to-peer lending platform should make efforts to introduce more signal mechanisms to eliminate the information asymmetry among platform enterprises and platform users so as to promote the healthy development of the peer-to-peer lending industry.
There are several limitations to this research. For the theoretical study, the relevant assumptions were too strict, as this research made the default behavior of borrowers exogenous to the whole game system in order to focus on the participation strategy of borrowers. If taking the endogeneity of the proportion of defaulting borrower into consideration, the theoretical model analysis could be more applicable; however, it is much more difficult to analyze. For the empirical study, since the irregular operation behavior (also the probability of this behavior) of platform enterprises is hard to be detected in advance, we could not separate the signal effect and the self-screening effect of the platform self-guarantee mechanism in our empirical study. The separation and verification of the existence of these two effects need to be further analyzed by other methods, such as experimental methods of behavioral economics. In addition, the sample period we selected in our empirical study is not large compared to researches like the study of Gu et al. [5] out of the needs of our research design and practical difficulties, so follow-up surveys and cross-country (cross-market) research could be done as our future research direction.

Author Contributions

Conceptualization, P.L. and Z.W.; methodology, Z.W.; software, Z.W.; validation, Z.W. and P.L.; formal analysis, Z.W. and P.L.; writing—original draft preparation, Z.W.; writing—review and editing, P.L.; visualization, Z.W. and P.L.; supervision, P.L.; project administration, P.L. All authors have read and agreed to the published version of the manuscript.

Funding

This research received no external funding.

Institutional Review Board Statement

Not applicable.

Informed Consent Statement

Not applicable.

Data Availability Statement

The data presented in this research are available on request from the corresponding author. The data are not publicly available due to the accessing time requirement of the corresponding website.

Acknowledgments

The authors would like to thank the anonymous reviewers for their criticisms and suggestions.

Conflicts of Interest

The authors declare no conflict of interest.

Appendix A

The derivation process of each stakeholder’s replicated dynamic equation in scenario 1 is shown in this appendix.
E O B 1 and E O B 2 are used to denote the expected payoff of the observant borrower taking the “Participation” strategy and “Non-Participation” strategy, and E ¯ O B is defined as the averaged payoff of the observant borrower. According to the results in Table 2, E O B 1 , E O B 2 and E ¯ O B can be expressed as:
E O B 1 = φ θ ( W R ) ,
E O B 2 = 0 ,
E ¯ O B = x E O B 1 + ( 1 x ) E O B 2 .
The replicated dynamic equation of E O B 1 is given by:
F 1 ( x ) = d x d t = x ( E O B 1 E ¯ O B ) = x ( 1 x ) φ θ ( W R )
E D B 1 and E D B 2 are used to denote the expected payoff of the defaulting borrower taking the “Participation” strategy and “Non-Participation” strategy, and E ¯ D B is defined as the averaged payoff of the defaulting borrower. Hence, E D B 1 , E D B 2 and E ¯ D B can be expressed as:
E D B 1 = φ ( 1 θ ) ( M L D B ) ,
E D B 2 = 0 ,
E ¯ D B = y E D B 1 + ( 1 y ) E D B 2 .
The replicated dynamic equation of E D B 1 is given by:
F 2 ( y ) = d y d t = y ( E D B 1 E ¯ D B ) = y ( 1 y ) φ ( 1 θ ) ( M L D B )
E P E 1 and E P E 2 are used to denote the expected payoff of the platform enterprise taking the “Regular Operation” strategy and “Irregular Operation” strategy, and E ¯ P E is defined as the averaged payoff of the platform enterprise. Hence, E P E 1 , E P E 2 and E ¯ P E can be expressed as:
E P E 1 = x φ θ T ,
E P E 2 = x φ [ θ ( M + R ) L P E ] ,
E ¯ P E = z E P E 1 + ( 1 z ) E P E 2 .
The replicated dynamic equation of E P E 1 is given by:
F 3 ( z ) = d z d t = z ( E P E 1 E ¯ P E ) = z ( 1 z ) x φ [ L P E + θ ( T M R ) ]
E I N 1 and E I N 2 are used to denote the expected payoff of the investor taking the “Participation” strategy and “Non-Participation” strategy, and E ¯ I N is defined as the averaged payoff of the investor. Hence, E I N 1 , E I N 2 and E ¯ I N can be expressed as:
E I N 1 = x θ [ z ( R T ) ( 1 z ) M ] y ( 1 θ ) M ,
E I N 2 = 0 ,
E ¯ I N = φ E I N 1 + ( 1 φ ) E I N 2 .
The replicated dynamic equation of E I N 1 is given by:
F 4 ( φ ) = d φ d t = φ ( E I N 1 E ¯ I N ) = φ ( 1 φ ) { x θ [ z ( R T ) ( 1 z ) M ] y ( 1 θ ) M }

Appendix B

The derivation process of each stakeholder’s replicated dynamic equation in scenario 2 is shown in this appendix.
According to the results in Table 3, the expected payoff of the observant borrower taking the “Participation” strategy can be expressed as:
E O B 1 = φ θ ( W R C )
The expected payoff of the observant borrower taking the “Non-Participation” strategy can be expressed as:
E O B 2 = 0
The expected payoff of the observant borrower can be expressed as:
E ¯ O B = x E O B 1 + ( 1 x ) E O B 2
The replicated dynamic equation of E O B 1 is given by:
G 1 ( x ) = d x d t = x ( E O B 1 E ¯ O B ) = x ( 1 x ) φ θ ( W R C )
The expected payoff of the defaulting borrower taking the “Participation” strategy can be expressed as:
E D B 1 = φ ( 1 θ ) [ ( 1 f ) M L D B C ]
The expected payoff of the defaulting borrower taking the “Non-Participation” strategy can be expressed as:
E D B 2 = 0
The expected payoff of the defaulting borrower can be expressed as:
E ¯ D B = y E D B 1 + ( 1 y ) E D B 2
The replicated dynamic equation of E D B 1 is given by:
G 2 ( y ) = d y d t = y ( E D B 1 E ¯ D B ) = y ( 1 y ) φ ( 1 θ ) [ ( 1 f ) M L D B C ]
The expected payoff of the platform enterprise taking the “Regular Operation” strategy can be expressed as:
E P E 1 = E + x θ T s y ( 1 θ ) ( 1 f ) M
The expected payoff of the platform enterprise taking the “Irregular Operation” strategy can be expressed as:
E P E 2 = E + x [ θ ( M + R ) L P E ] s ( 1 x ) y L P E
The expected payoff of the platform enterprise can be expressed as:
E ¯ P E = z E P E 1 + ( 1 z ) E P E 2
The replicated dynamic equation of E P E 1 is given by:
G 3 ( z ) = d z d t = z ( E P E 1 E ¯ P E ) = z ( 1 z ) φ { x [ L P E + θ ( T M R ) ] s y [ ( 1 θ ) ( 1 f ) M ( 1 x ) L P E ] }
The expected payoff of the investor taking the “Participation” strategy can be expressed as:
E I N 1 = x θ [ z ( R T ) ( 1 z ) M ] s y ( 1 z ) ( 1 θ ) ( 1 f ) M
The expected payoff of the investor taking the “Non-Participation” strategy can be expressed as:
E I N 2 = 0
The expected payoff of the investor can be expressed as:
E ¯ I N = φ E I N 1 + ( 1 φ ) E I N 2
The replicated dynamic equation of E I N 1 is given by:
G 4 ( φ ) = d φ d t = φ ( E I N 1 E ¯ I N ) = φ ( 1 φ ) { x θ [ z ( R T ) ( 1 z ) M ] s y ( 1 z ) ( 1 θ ) ( 1 f ) M }

Appendix C

Guarantee mechanism was the platform individual characteristic in our sample, and it seems natural and reasonable to adopt the pooled regression method in our research. However, it is still important to study the fixed effect model and random effect model since we did collect the panel data. Specifically, we considered the month individual effect instead of the platform individual effect in the regression of fixed effect model and random effect model; otherwise, the variables related with the guarantee mechanism would have multicollinearity problems. The regression results of the fixed effect model and random effect model of Equation (6) are shown in Table A1.
Table A1. Regression results of fixed effect model and random effect model.
Model 6Model 7Model 8
.Fixed EffectRandom Effect (FGLS)Random Effect (MLE)
Constant−2.8033 *−3.0686 ***−3.0686 ***
(1.6362)(1.1796)(0.9312)
NOB0.1214 ***0.1191 ***0.1191 ***
(0.0355)(0.0185)(0.0185)
NOI3.0319 ***3.0462 ***3.0462 ***
(0.2521)(0.2343)(0.0727)
Rate−0.1104−0.1088 *−0.1088
(0.0763)(0.0557)(0.0670)
SG0.7911 ***0.8229 ***0.8229 **
(0.2869)(0.1381)(0.4032)
TG0.46080.45030.4503
(0.4130)(0.2873)(0.3322)
Control variableControlledControlledControlled
R20.7945--
N126012601260
Note: ***, **, and * represent significant at the level of 1%, 5%, and 10%, respectively; FGLS is the abbreviation of “Feasible Generalized Least Squares”, and MLE is the abbreviation of “Maximum Likelihood Estimation”.
Comparing with the regression results of pooled regression model (Model 5), it is not difficult to find that the coefficient and significance of the experimental variables have not changed significantly. In particular, we noticed that the coefficients in the random effect model (Model 7 and Model 8) were the same as those in Model 5. The reason for that kind of phenomenon was that the standard deviation of month individual effect is 0, and it indicated that the random effect model was invalid. The result of the relevant test of month individual effect is shown in Table A2. Hence, we should adopt the pooled regression method.
Table A2. Test of the month individual effect.
ItemStatisticp-Value
F Test0.650.6630
BP Test0.001.0000
LR Test0.001.0000
Note: BP Test is the abbreviation of “Breusch and Pagan Lagrangian Multiplier Test”, and LR Test is the abbreviation of “Likelihood-Ratio Test”.

References

  1. Greiner, M.E.; Wang, H. Building Consumer-to-Consumer Trust in E-Finance Marketplaces: An Empirical Analysis. Int. J. Electron. Commer. 2010, 15, 105–136. [Google Scholar] [CrossRef] [Green Version]
  2. Baghdadi, Y. From e-commerce to social commerce: A framework to guide enabling cloud computing. J. Theor. Appl. Electron. Commer. Res. 2013, 8, 12–38. [Google Scholar] [CrossRef] [Green Version]
  3. Chen, X.; Hu, X.; Ben, S. How individual investors react to negative events in the FinTech era? Evidence from China’s Peer-to-Peer lending. J. Theor. Appl. Electron. Commer. Res. 2021, 16, 52–70. [Google Scholar] [CrossRef]
  4. Wei, Z.; Lin, M. Market mechanisms in online peer-to-peer lending. Manag. Sci. 2017, 63, 4236–4257. [Google Scholar] [CrossRef] [Green Version]
  5. Gu, D.; Lu, T.; Luo, P.; Zhang, C. The Impact of Venture Capital Investment on the Performance of Peer-to-Peer Lending Platforms: Evidence from China. Asia-Pac. J. Financ. Stud. 2019, 48, 640–665. [Google Scholar] [CrossRef]
  6. Cui, Y.; Mou, J.; Cohen, J.; Liu, Y.; Kurcz, K. Understanding consumer intentions toward cross-border m-commerce usage: A psychological distance and commitment-trust perspective. Electron. Commer. Res. Appl. 2020, 39, 100920. [Google Scholar] [CrossRef]
  7. Armstrong, M. Competition in two-sided markets. RAND J. Econ. 2006, 37, 668–691. [Google Scholar] [CrossRef] [Green Version]
  8. Rochet, J.C.; Tirole, J. Two-sided markets: A progress report. RAND J. Econ. 2006, 37, 645–667. [Google Scholar] [CrossRef] [Green Version]
  9. Hagiu, A.; Wright, J. Multi-sided platforms. Int. J. Ind. Organ. 2015, 43, 162–174. [Google Scholar] [CrossRef]
  10. Guo, J.; Luo, P. Does the Internet make contribution to TFP of China? Manag. World 2016, 10, 34–49. [Google Scholar]
  11. Serrano-Cinca, C.; Gutiérrez-Nieto, B.; López-Palacios, L. Determinants of default in P2P lending. PLoS ONE 2015, 10, e0139427. [Google Scholar] [CrossRef] [PubMed]
  12. Tao, Q.; Dong, Y.; Lin, Z. Who can get money? Evidence from the Chinese peer-to-peer lending platform. Inf. Syst. Front. 2017, 19, 425–441. [Google Scholar] [CrossRef] [Green Version]
  13. Guo, W.; Li, Y. Research on the P2P Network Lending Platform Model. China Bus. Mark. 2014, 28, 114–121. [Google Scholar]
  14. Li, J.; Hsu, S.; Chen, Z.; Chen, Y. Risks of p2p lending platforms in china: Modeling failure using a cox hazard model. Chin. Econ. 2016, 49, 161–172. [Google Scholar] [CrossRef]
  15. Hagiu, A. Merchant or Two-Sided Platform? Rev. Netw. Econ. 2007, 6, 115–133. [Google Scholar] [CrossRef]
  16. Weng, Z.; Luo, P. Supervision of the Default Risk of Online Car-Hailing Platform from an Evolutionary Game Perspective. Sustainability 2021, 13, 555. [Google Scholar] [CrossRef]
  17. Luo, P.; Gu, D. Transmission Path of VCs to Platform’s Transaction Volume: A Mediating Effect Model. Mod. Manag. 2018, 38, 1–4. [Google Scholar]
  18. Zhang, L.; Jing, Z.; Liu, Q. A meta-analysis of mobile commerce adoption and the moderating effect of culture. Comput. Hum. Behav. 2012, 28, 1902–1911. [Google Scholar] [CrossRef]
  19. Liao, L.; Li, M.; Wang, Z. The Intelligent Investor: Not-Fully-Marketized Interest Rate and Risk Identify——Evidence from P2P Lending. Econ. Res. J. 2014, 49, 125–137. [Google Scholar]
  20. Holmström, B. Moral hazard and observability. Bell J. Econ. 1979, 10, 74–91. [Google Scholar] [CrossRef] [Green Version]
  21. Yum, H.; Lee, B.; Chae, M. From the wisdom of crowds to my own judgment in microfinance through online peer-to-peer lending platforms. Electron. Commer. Res. Appl. 2012, 11, 469–483. [Google Scholar] [CrossRef]
  22. Weng, Z. Research on the Platformization and Default Risk Governance of Sharing Economy. Ph.D. Thesis, Fudan University, Shanghai, China, 16 October 2019. [Google Scholar]
  23. Rong, L. Research on Competition Strategy and Industry Regulation of Third-Party Payment Platform. Ph.D. Thesis, Fudan University, Shanghai, China, 5 June 2012. [Google Scholar]
  24. Evans, D.S. The Antitrust Economics of Two-Sided Markets. Yale J. Regul. 2003, 20, 325–381. [Google Scholar] [CrossRef]
  25. Régibeau, P. A comment on Evans, Hagiu and Schmalensee. CESifo Econ. Stud. 2005, 51, 225–232. [Google Scholar] [CrossRef]
  26. Zhou, B. Review of research on lemon market governance mechanism. Econ. Perspect. 2010, 3, 131–135. [Google Scholar]
  27. Ross, S.A. The Determination of Financial Structure: The Incentive Signaling Approach. Bell J. Econ. 1977, 8, 23–40. [Google Scholar] [CrossRef]
  28. Gu, D.; Zhao, X.; Luo, P. The signaling behavior of three-player games on P2P platforms. Syst. Eng.-Theory Pract. 2020, 40, 1210–1220. [Google Scholar]
  29. Bester, H. The role of collateral in credit markets with imperfect information. Eur. Econ. Rev. 1987, 31, 887–899. [Google Scholar] [CrossRef]
  30. Coco, G. On the use of collateral. J. Econ. Surv. 2000, 14, 191–214. [Google Scholar] [CrossRef]
  31. Biglaiser, G.; Li, F. Middlemen: The good, the bad, and the ugly. RAND J. Econ. 2018, 49, 3–22. [Google Scholar] [CrossRef]
  32. Jiang, Q. Research on the Efficiency Difference and the Influencing Factors of the Volume of P2P Loan Platform in China. J. Quant. Tech. Econ. 2018, 35, 60–77. [Google Scholar]
  33. Duarte, J.; Siegel, S.; Young, L. Trust and credit: The role of appearance in peer-to-peer lending. Rev. Financ. Stud. 2012, 25, 2455–2484. [Google Scholar] [CrossRef]
  34. Lin, M.; Prabhala, N.R.; Viswanathan, S. Judging borrowers by the company they keep: Friendship networks and information asymmetry in online peer-to-peer lending. Manag. Sci. 2013, 59, 17–35. [Google Scholar] [CrossRef]
  35. Lee, E.; Lee, B. Herding behavior in online P2P lending: An empirical investigation. Electron. Commer. Res. Appl. 2012, 11, 495–503. [Google Scholar] [CrossRef] [Green Version]
  36. Zhang, J.; Liu, P. Rational herding in microloan markets. Manag. Sci. 2012, 58, 892–912. [Google Scholar] [CrossRef] [Green Version]
  37. Liu, D.; Brass, D.J.; Lu, Y.; Chen, D. Friendships in online peer-to-peer lending: Pipes, Prisms, and Relational Herding. Mis Q. 2015, 39, 729–742. [Google Scholar] [CrossRef]
  38. Pope, D.G.; Sydnor, J.R. What’s in a Picture? Evidence of Discrimination from Prosper. com. J. Hum. Resour. 2011, 46, 53–92. [Google Scholar]
  39. Liao, L.; Li, M.; Wang, Z. Regional Discrimination in Chinese Internet Finance. J. Quant. Tech. Econ. 2014, 31, 54–70. [Google Scholar]
  40. Zhao, L.; Qi, R. Can improving the quality of information disclosure weaken the professional identity discrimination in the P2P lending market? Transform. Bus. Econ. 2019, 18, 214–233. [Google Scholar]
  41. Zhang, B.; Zhan, H.; He, F. Guarantee Mechanisms and Intermediary Nature of P2P Lending Market in China—Model Construction and Quantitative Analysis Based on Investor Behavior. Nanjing Bus. Rev. 2018, 4, 73–103. [Google Scholar]
  42. Li, R. Research on network financing guarantee system construction. South China Financ. 2014, 4, 72–76. [Google Scholar]
  43. Chen, Z. Legal risk and prevention suggestions of the guarantee in P2P lending. Leg. Syst. Soc. 2015, 11, 95–96. [Google Scholar]
  44. Zhang, C.; Chen, F. Research on the model dissimilation and de-guarantee of P2P lending platform. South China Financ. 2018, 1, 68–74. [Google Scholar]
  45. Peng, B. Peer-to-Peer Lending and Illegal Financing. Financ. Regul. Res. 2014, 6, 13–25. [Google Scholar]
  46. Xiong, J.; Ma, C.; Yao, Z. The influence of guarantee certification service of P2P lending on borrowing -- Taking Renrendai as an example. Mod. Manag. 2015, 35, 1–3. [Google Scholar]
  47. Ye, X. The Risks of China’s P2P Lending Models and Related Regulations. Financ. Regul. Res. 2014, 3, 71–82. [Google Scholar]
  48. Zhang, H. Regulation of Information Disclosure and the Patterns of P2P Lending in China. China Econ. Q. 2017, 16, 371–392. [Google Scholar]
  49. Gu, D.; Ding, L.; Luo, P. Evolutionary Game Analysis on Credit Risk Control in P2P Online Lending Platforms. R D Manag. 2018, 30, 12–21. [Google Scholar]
  50. Smith, J.M.; Price, G.R. The logic of animal conflict. Nature 1973, 246, 15–18. [Google Scholar] [CrossRef]
  51. Taylor, P.D.; Jonker, L.B. Evolutionary stable strategies and game dynamics. Math. Biosci. 1978, 40, 145–156. [Google Scholar] [CrossRef]
  52. Smith, J.M. Evolution and the Theory of Games; Cambridge University Press: Cambridge, UK, 1982; pp. 40–67. [Google Scholar]
  53. Weibull, J.W. Evolutionary Game Theory; MIT Press: Cambridge, UK, 1995; pp. 35–109. [Google Scholar]
  54. Liu, Y.; Chen, L.; Jin, S. Research on the application value of credit report in social governance. South China Financ. 2020, 8, 81–91. [Google Scholar]
  55. Baron, R.M.; Kenny, D.A. The moderator–mediator variable distinction in social psychological research: Conceptual, strategic, and statistical considerations. J. Personal. Soc. Psychol. 1986, 51, 1173–1182. [Google Scholar] [CrossRef]
  56. Wen, Z.; Ye, B. Analyses of Mediating Effects: The Development of Methods and Models. Adv. Psychol. Sci. 2014, 22, 731–745. [Google Scholar] [CrossRef]
  57. Xue, W.; Zuo, L. An Empirical Study on the Transmission Mechanism between the Cross Network Effect and Non-neutrality Price in Duopoly P2P Market. Mod. Financ. Econ.-J. Tianjin Univ. Financ. Econ. 2017, 37, 59–72. [Google Scholar]
  58. Rong360. 22 Peer-to-Peer Lending Platforms Hold the Small-Loan License: The Transformation Is Not Easy. Available online: https://www.rong360.com/news/2019/02/01/176528.html (accessed on 20 July 2021).
  59. Lu, S.; Lan, H. VC, The Third-Party Escrow and the Trading Volume of the P2P Lending Platforms in China—Analysis from the Perspective of the P2P Investors. Rev. Invest. Stud. 2015, 34, 23–37. [Google Scholar]
  60. Wang, Y.; Fu, K. Analysis of the Features of P2P Network Lending Platforms and Lending Effect in China. Mod. Manag. 2018, 38, 18–22. [Google Scholar]
  61. Wooldridge, J.M. Econometric Analysis of Cross Section and Panel Data. MIT Press: Cambridge, MA, USA, 2010; pp. 126–134, 241–256. [Google Scholar]
Figure 1. Transaction volume of China’s peer-to-peer lending industry from 2011 to 2019. Note: The data were obtained from WDZJ (http://www.wdzj.com, accessed on 20 July 2021); Unit: CNY 1 billion.
Jtaer 16 00149 g001
Figure 2. Structure of a peer-to-peer lending platform. Note: Solid line represents the capital flow of the peer-to-peer lending activity, and this kind of capital flow pattern [13] is prevalent in the market (meanwhile, there exists another kind that investors and borrowers conduct funding transactions directly [13,14]); dotted line represents transaction relationship or affiliation relationship; Li etc. [14], had described the basic process of peer-to-peer lending activities involved platform enterprises and users (without considering the acting of value-added service providers), textually; simplified form of the general platform structure was addressed in Hagiu’s study [15].
Jtaer 16 00149 g002
Figure 3. Strategy-making order of the evolutionary game of peer-to-peer lending platform.
Jtaer 16 00149 g003
Figure 4. The block diagram of the evolutionary game analysis.
Jtaer 16 00149 g004
Figure 5. The influence pathway of the platform self-guarantee mechanism on platform users’ participation.
Jtaer 16 00149 g005
Figure 6. The influence pathway of the third-party guarantee mechanism on platform users’ participation.
Jtaer 16 00149 g006
Table 1. Definitions of the parameters related to different game strategies.
ParameterDefinition
x The possibility of the observant borrower taking the OB1 strategy
y The possibility of the defaulting borrower taking the DB1 strategy
z The possibility of the platform enterprises taking the PE1 strategy
φ The possibility of the investor taking the IN1 strategy
M The investment amount of the project; the compensation amount from the guarantee institution
R The promised interest
T The commission charged by the platform enterprises to the investor for the normal transaction
W The profit of the observant borrower from participating in the transaction
L P E The post-event penalty imposed by the regulator on irregular platform enterprises
L D B The post-event penalty imposed by the regulator on defaulting borrowers
C The extra cost for borrowers to provide information for review
E The cost of platform enterprises for carrying out the project information review by themselves or hiring a third-party institution
f The probability of identifying the fictitious project
θ Exogenous proportion of the observant borrowers in the whole borrower group
Table 2. Payoff matrix of the peer-to-peer lending platform of scenario 1 (when the investor chooses the IN1 strategy).
Observant BorrowerDefaulting BorrowerPlatform Enterprise
Regular OperationIrregular Operation
ParticipationParticipation θ ( W R ) , ( 1 θ ) ( M L D B ) ,
θ T , θ ( R T ) ( 1 θ ) M
θ ( W R ) , ( 1 θ ) ( M L D B ) ,
θ ( M + R ) L P E , M
Non-Participation θ ( W R ) , 0 , θ T , θ ( R T ) θ ( W R ) , 0 , θ ( M + R ) L P E , θ M
Non-ParticipationParticipation 0 , ( 1 θ ) ( M L D B ) ,   0 , ( 1 θ ) M 0 , ( 1 θ ) ( M L D B ) , 0 , ( 1 θ ) M
Non-Participation 0 , 0 , 0 , 0 0 , 0 , 0 , 0
Note: The first item is the payoff of the observant borrowers; the second item is the payoff of the defaulting borrowers; the third item is the payoff of the platform enterprises; the fourth item is the payoff of the investors.
Table 3. Payoff matrix of the peer-to-peer lending platform of scenario 2 (when the investor chooses the IN1 strategy).
Observant BorrowerDefaulting BorrowerPlatform Enterprise
Regular OperationIrregular Operation
ParticipationParticipation θ ( W R C ) ,
( 1 θ ) [ ( 1 f ) M L D B C ] ,
θ T E s ( 1 θ ) ( 1 f ) M ,
θ ( R T )
θ ( W R C ) ,
( 1 θ ) [ ( 1 f ) M L D B C ] ,
θ ( M + R ) E L P E ,
θ M s ( 1 θ ) ( 1 f ) M
Non-Participation θ ( W R C ) , 0 , θ T E , θ ( R T ) θ ( W R C ) , 0 , θ ( M + R ) E L P E , θ M
Non-ParticipationParticipation 0 ,
( 1 θ ) [ ( 1 f ) M L D B C ] ,
E s ( 1 θ ) ( 1 f ) M ,
0
0 ,
( 1 θ ) [ ( 1 f ) M L D B C ] ,
E s L P E ,
s ( 1 θ ) ( 1 f ) M
Non-Participation 0 , 0 , E , 0 0 , 0 , E , 0
Note: The first item is the payoff of the observant borrowers; the second item is the payoff of the defaulting borrowers; the third item is the payoff of the platform enterprises; the fourth item is the payoff of the investors.
Table 4. Definition and interpretation of the variables in the empirical study.
TypeNameUnitDefinition and Interpretation
Experimental VariableVOTCNY 100 millionVolume of transactions on the platform (Monthly)
NOB10 thousandScale of borrowers (Monthly)
NOI10 thousandScale of investors (Monthly)
Rate%The average interest rate of the project (loan) on the platform (monthly, weighted by the amount)
SG/Whether the platform applied a platform self-guarantee mechanism, including the risk reserve fund mode and platform enterprise compensation mode
TG/Whether the platform applied a third-party guarantee mechanism, including financing guarantee mode, non-financing guarantee mode and other guarantees
Control VariableCapitalCNY 100 millionRegistered capital
DurationNThe duration of the platform (Month)
Finance/Whether the platform experienced a history of financing
Association/Whether the platform had joined the Chinese Internet Finance Association
Flexible/Whether the project (loan) can be transferred before maturity
Auto/Whether the investment amount could be automatically bid after the expiration of the project
VC/Whether the platform had introduced venture capital
PeriodNAverage maturity of the project (Month)
AmountCNY 10 thousandPer capita loan amount
Mode/Whether the platform had the small-loan license [58]
Note: For the control variables, the NOB Equation in Equation (5) contains Capital, Duration, Finance, Association, VC, Period, and Amount; the NOI Equation contains Capital, Duration, Finance, Association, Flexible, Auto and VC; and the Rate Equation contains Mode. Equation (6) contains all control variables.
Table 5. The total transaction volume of the sample platforms and the whole industry.
TimeVOT of Sample PlatformsVOT of the IndustryProportion
August 201870.96119.3359.46%
September 201863.63110.7457.46%
October 201858.69102.2757.39%
November 201860.79111.4554.54%
December 201862.20106.0258.67%
January 201957.61103.7155.55%
Note: The data were obtained from WDZJ; unit: CNY 1 billion.
Table 6. Descriptive statistics of the variables.
VariableMeanStandard DeviationMedianMinimumMaximum
VOT2.96729.84030.27200.0001135.7133
NOB2.10498.77260.01210.000188.4951
NOI0.77382.56060.05230.000121.6800
Rate10.01121.99839.85001.070018.5200
SG0.12860.33490.00000.00001.0000
TG0.80480.39651.00000.00001.0000
Capital0.79371.84270.50000.050025.0000
Duration46.942913.106046.000010.0000119.0000
Finance0.23810.42610.00000.00001.0000
Association0.48570.50000.00000.00001.0000
Flexible0.70000.45841.00000.00001.0000
Auto0.63330.48211.00000.00001.0000
VC0.11900.32400.00000.00001.0000
Period7.86017.40805.46500.320046.5700
Amount34.034378.452014.75500.11001239.3500
Mode0.03330.17960.00000.00001.0000
Table 7. Correlation matrix of the variables.
VOTNOBNOIRateSGTGCapitalDuration
VOT1.0000
NOB0.5480 ***1.0000
NOI0.8720 ***0.5647 ***1.0000
Rate−0.0495 *−0.0015−0.00451.0000
SG0.0225−0.0672 **−0.03250.1338 ***1.0000
TG−0.0640 **−0.1206 ***−0.0818 ***−0.0558 **−0.02611.0000
Capital0.1710 ***0.03060.0896 ***−0.0966 ***−0.02920.0503 *1.0000
Duration0.4392 ***0.0729 ***0.4186 ***−0.00930.2161 ***−0.1136 ***0.02131.0000
Finance0.1736 ***0.1701 ***0.2267 ***0.0330−0.0477 *−0.1477 ***−0.01770.2866 ***
Association0.1547 ***0.0486 *0.1859 ***0.0458−0.0033−0.0501 *0.1057 ***0.2799 ***
Flexible0.1174 ***0.0921 ***0.1308 ***0.1457 ***0.0962 ***0.1494 ***0.04430.1768 ***
Auto0.0501 *0.00040.0477 *0.0739 ***0.0856 ***−0.02580.04020.1615 ***
VC0.0631 **−0.02450.1296 ***0.1566 ***−0.0094−0.1157 ***−0.0674 **0.2536 ***
Period0.2159 ***0.1423 ***0.3131 ***0.1662 ***−0.1276 ***0.0486 *0.00080.1114 ***
Amount−0.0265−0.0999 ***−0.0641 **−0.0431−0.00910.0415−0.02540.0883 ***
Mode0.2602 ***0.0765 ***0.3343 ***0.01250.00790.02450.0848 ***0.2630 ***
FinanceAssociationFlexibleAutoVCPeriodAmountMode
Finance1.0000
Association0.1502 ***1.0000
Flexible0.0488 *0.1580 ***1.0000
Auto0.1701 ***0.1068 ***0.2135 ***1.0000
VC0.5885 ***0.0546 *0.01600.1577 ***1.0000
Period0.0538 *0.2433 ***0.2163 ***−0.0674 **0.0801 ***1.0000
Amount−0.0732 ***−0.1162 ***−0.00060.0075−0.0532 *−0.1716 ***1.0000
Mode0.0830 ***0.1911 ***0.1216 ***0.0862 ***0.01370.1317 ***−0.0482 *1.0000
Note: ***, **, and * represent significant at the level of 1%, 5%, and 10%, respectively.
Table 8. Test of endogeneity of Equation (5).
ItemF-Statisticp-Value
Endogeneity of NOI and Rate in NOB Equation11.990.0000
Endogeneity of NOB and Rate in NOI Equation53.790.0000
Endogeneity of NOB and NOI in Rate Equation3.560.0596
Table 9. Model regression results.
Model 1Model 2Model 3Model 4Model 5
Dependent VariablesNOBNOIVOTVOTVOT
Constant−33.4737 ***−23.1898 ***−10.7336 ***−2.9666 *−3.0686 *
(9.6679)(3.9772)(2.5950)(1.6909)(1.7691)
NOB 0.2878 *** 0.1157 ***0.1191 ***
(0.0946) (0.0375)(0.0359)
NOI1.0389 ** 3.0397 ***3.0462 ***
(0.4822) (0.2575)(0.2579)
Rate3.7821 ***1.9710 ***−0.2388 *−0.0940−0.1088
(0.8858)(0.3882)(0.1326)(0.0778)(0.0768)
SG−2.9825 **−1.0756 ** 0.8229 ***
(1.2487)(0.5251) (0.2961)
TG−1.6589 ***0.7888 *** 0.4503
(0.6435)(0.2362) (0.4099)
Control variableControlledControlledControlledControlledControlled
Chi2153.56 ***359.79 ***---
R2--0.27570.79280.7938
N12601260126012601260
Note: ***, **, and * represent significant at the level of 1%, 5%, and 10%, respectively; for pooled regression, robust standard error is indicated in parentheses.
Table 10. Hypothesis validation of the mediating effect (H5).
Mediating PathwayThe Inspection ProcessCoefficientStandard ErrorZ-Statisticsp-ValueMediating Effect
SG→NOB→VOTSG→NOB−2.98251.2487−1.93840.0526Exist
NOB→VOT0.11910.0359
SG→NOI→VOTSG→NOI−1.07560.5251−2.01820.0436Exist
NOI→VOT3.04620.2579
TG→NOB→VOTTG→NOB−1.65890.6435−2.03560.0418Exist
NOB→VOT0.11910.0359
TG→NOI→VOTTG→NOI0.78880.23623.21360.0013Exist
NOI→VOT3.04620.2579
Publisher’s Note: MDPI stays neutral with regard to jurisdictional claims in published maps and institutional affiliations.

