Article

Risk Assessment of Express Delivery Service Failures in China: An Improved Failure Mode and Effects Analysis Approach

1
Department of Logistics Management, College of Modern Posts, Xi’an University of Posts and Telecommunications, Xi’an 710061, China
2
Department of Mechanical and Materials Engineering, College of Engineering & Applied Science, University of Cincinnati, Cincinnati, OH 45221, USA
*
Authors to whom correspondence should be addressed.
J. Theor. Appl. Electron. Commer. Res. 2021, 16(6), 2490-2514; https://doi.org/10.3390/jtaer16060137
Submission received: 26 July 2021 / Revised: 9 September 2021 / Accepted: 13 September 2021 / Published: 21 September 2021
(This article belongs to the Section Digital Business Organization)

Abstract

:
With the rapid growth of express delivery industry, service failure has become an increasingly pressing issue. However, there is a lack of research on express service failure risk assessment within the Failure Mode and Effects Analysis (FMEA) framework. To address the research gap, we propose an improved FMEA approach based on integrating the uncertainty reasoning cloud model and the Technique for Order Preference by Similarity to Ideal Solution (TOPSIS) method. The cloud model describing randomness and fuzziness in uncertainty environment is adopted to achieve the transformation between the qualitative semantic evaluation of occurrence (O), severity (S), and detection (D) risk factors of FMEA and the quantitative instantiation and set up the comprehensive cloud of risk assessment matrix for express delivery service failure (EDSF). The TOPSIS method calculates and ranks the relative closeness coefficients of EDSF mode. Finally, the rationality and applicability of the proposed method are demonstrated by an empirical study for the express delivery service in China. It is found that among 18 express delivery service failure modes, six service failure modes with high risk are mainly located in the processing and delivery stages, while six service failures with the relatively low risk are involved in the picking-up and transportation stages. This study provides insight on how to explore the risk evaluation of express delivery service failure, and it helps express delivery firms to identify the key service failure points, develop the corresponding service remedy measures, reduce the loss from service failures, and improve the service quality.

1. Introduction

Thanks to the rapid development of e-commerce, the express delivery service industry has witnessed a rapid growth in China. According to the statistics of the State Post Bureau of China, the total volume of package delivered exceeded 83 billion in 2020, representing a 30% increase over the previous year. The annual per capita volume of packages sent or received reached 59 items, representing a growth rate of 31%. Meanwhile, the revenue of this industry reached about $135 billion, representing a 16.7% increase over the previous year. Nevertheless, the unprecedented growth is accompanied with frequent service failure (SF), such as sluggish websites, payment problems, privacy security, lost packages, delayed delivery, damaged products, and rough sorting and handling. In 2020, a total of 188,326 customer complaints involving express service were formally filed with State Post Bureau of China alone; the complaints received by local government and express delivery companies were not included. The finding by Dospinescu et al. [1] indicates that express delivery option has significant influence on e-commerce customer’s satisfaction level. It is thus clear that frequent service failure not only leads to losses of business and damaged reputation for e-commerce and express delivery companies but also causes the emotional anxiety of customers and negatively affects their satisfaction which then leads to negative Word of Mouth (WOM) as well as complaints and change of repurchase behavior. Holloway et al. [2] adopted the Critical Incident Technique (CIT) to analyze the online retail service faults and indicated that the main types of service faults are delivery problems, website design problems, payment problems, security problems, product quality problems, and customer service problems. Forbes et al. [3] also carried out CIT analysis on e-commerce service failures, which involve product packaging errors, slow delivery, system checkout errors, missing information, and website design errors. Compared to other intangible service quality factors by using both exploratory and confirmatory factor analysis, Subramanian et al. [4] pointed out that to be competitive, e-retailers in China must pay increasing attention to the express delivery service from third-party logistics companies. Zemke et al. [5] collected information from online shoppers and concluded that the SF modes related to express delivery service include delayed delivery, extra transportation costs for the punctual arrival, incomplete delivery of orders, and damaged objects.
As shown above, early research mainly focuses on relatively narrow segments in analyzing the sources of service failures, types of service failures, remedial measures, and so on. More recently, Chen et al. [6,7] studied the influence of causal attributions on trust conflicts and the service failure recovery policies in e-commerce. Kim et al. [8] investigated consumer-perceived attribution of service failures and its influence on negative emotions and post-purchase activities in social commerce. The finding by Vakeel et al. [9] shows that there is a three-way interaction among deal proneness, locus of attribution, and past emotions; compared with external locus of attribution in the context of online flash sales (OFS), service failures attributed to internal locus of attribution also have a negative impact on reparticipation. Saini et al. [10] also presented a novel contextual scale to measure OFS e-commerce service failures and studied its impact on recovery-induced justice on customer’s loyalty. As such, the recent research diverts attention on service failure attributions based on customer-perception, the relationship of service failure and recovery policy, and customer emotion or post-purchase behaviors.
However, there has been lack of research on occurrence (O), severity (S), and detection (D) of service failures and their risk priority number (RPN), which is related to the determination of recovery strategies in e-commerce. In addition, express service failures are often neglected or overlooked. It should be noted that express delivery service is a complex and special multi-link and multi-participator activity process that crosses organizations, regions, and even borders, so it plays a prominent role in the success of electronic transactions. In this regard, express delivery service failure (EDSF) is a critical issue that should be mitigated by scientific and viable methods. As a result, this research aims to identify the EDSF modes and evaluate their risk levels in a comprehensive way, as well as reveal the importance of individual service failure modes in the different operational stages of express delivery process. The work will help express delivery companies to develop the proper service remedial measures, reduce waste of resources, lower the operation risks, and improve customer satisfaction.
To bridge the above research gaps, this paper attempts to answer the following research problems: (1) what are the critical modes of EDSF and where are they located in express delivery process? (2) under the context of randomness and fuzziness of semantic assessment information, how can the risk of EDSF be more effectively evaluated? (3) how serious are the risk factors, namely occurrence (O), severity (S), and detection (D) of different modes of EDSF?
As such, the objective of this study is to address the above research problems by presenting a systematic quantitative approach to investigate the risk assessment issue for EDSF. Specifically, we present an improved Failure Mode and Effects Analysis (FMEA) approach based on integrating the uncertainty reasoning cloud model and the TOPSIS method. The cloud model for uncertainty reasoning is adopted to quantify the semantic evaluation of the occurrence (O), severity (S), and detection (D) risk factors of EDSF and set up the comprehensive cloud of risk assessment for EDSF. Finally, the Technique for Order Preference by Similarity to Ideal Solution (TOPSIS) method is adopted to calculate and rank the relative closeness coefficient of express delivery service failure modes. Compared with the existing multi-criteria decision making (MCDM) techniques, the proposed decision scheme in this paper is unique by constructing decision matrices of expectation E x , entropy E n and hyper entropy H e in the cloud model. Therefore, it not only describes the randomness and fuzziness in uncertain information but also gives the comprehensive closeness coefficient by TOPSIS, which makes the decision results more comprehensive and reasonable. In this way, it contributes to the theoretical basis for the risk detection ability of EDSF.
The remainder of this paper is arranged as follows. Section 2 provides a brief literature review. Section 3 proposes the research methodology, including the verification of express delivery service failure modes, construction of semantic evaluation of express delivery service failure, and quantitative transformation of evaluation variables based on cloud model, determination of the weight of FMEA risk factors, and calculation of risk assessment comprehensive cloud and rank the risk of express delivery service failure. Section 4 presents an empirical study for the express delivery industry in China based on the proposed methodology. In addition, the results are analyzed, and management implications are discussed. Finally, in Section 5, major findings and contributions of this study are summarized, and future research directions are pointed out.

2. Literature Review

2.1. Service Failure

On the general perspectives of service failure, there is a wealth of literature. Some representative works are briefly summarized in the following. Bitner et al. [11] indicated that service failure incurs when the firms provide the services which fail to meet the requirement of the customers or are inconsistent with standard operating procedures in the service execution, as well as below the acceptable level. Similarly, Maxham et al. [12] suggested that when the business service is lower than the customer’s expectation or a customer’s request fails to be realized, service failures take place. Michel [13] suggested that service failures occur when customers perceive that the received goods or service does not achieve what they expected, which is consistent with the viewpoint of Voorhees et al. [14]. Tan et al. [15] categorized e-commerce service failures as functional, information, and system failures, proposed a theoretical model of e-commerce service failure classifications and their consequences, and tested the relationship between three failure categories and consumers’ disconfirmed expectancies. Moreover, it is commonly recognized that a critical factor of service failure is the occurrence severity of service failure, and the increase of service failure severity leads to the increase of customer dissatisfaction [16,17]. Hsieh and Yen [18] indicated that customers are more inclined to blame service failures on service providers, which turns into dissatisfaction with service and firm. The consequences of service failure include lower customer satisfaction, distrust, negative evaluation and diminutive employee motivation, customer loss, and revenue decrease [19,20,21,22]. In addition, Gelbrich [23] investigated the essential role of helplessness in interpreting weird coping responses to anger and frustration after service failure.
It is clear from the above analysis that the definition of service failure, categorization, consequence of service failure, and its relationship with customer satisfaction have attracted strong attention from many scholars.

2.2. Express Delivery Service Failure (EDSF)

For EDSF, its footprint could be found in the research on e-commerce SF and logistics service quality. Compared with tangible products, less attention has been received. For example, the findings by Durvasula et al. [24] show that the SF occurrence does not imply that the logistics service provider is insufficient; even the best service supplier makes a mistake and perfect service is impossible in the context of B-to-B marketing. Zhong et al. [25] considered that the perceived information sharing quality from express service providers could affect logistics service performance of online shoppers. Holloway et al. [2] discovered that delivery problems are the main types of service faults besides payment problems, security problems, and customer service problems. Subramanian et al. [4] pointed out that e-retailers should pay increasing attention to the express delivery service from third-party logistics providers. Zemke et al. [5] collected information from online shoppers and concluded that the SF modes related to express delivery service include delayed delivery, extra transportation costs for the punctual arrival, incomplete delivery of orders, and damaged objects. Saura et al. [26] pointed out that the timeliness, personnel quality, information accuracy, and order response speed of logistics service quality all have clear, positive, and significant impact on customer satisfaction. Therefore, it is expected that the abovementioned logistics service components will lead to the most significant service failure. Importantly, all services must recover in time because of the time sensitivity of delivery service. Ping et al. [27] suggested that for logistics firms, a high level of logistics services can improve customer satisfaction, maintain customer loyalty, gain potential customers, and improve profits and competitiveness. Giovanis et al. [28] analyzed the impact of logistics service quality on customer satisfaction and loyalty. Ma et al. [29] developed a combined SERVUQAL-AHP-TOPSIS method to assess the quality of service (QoS) of the city express service industry. It was believed that the main dimension of logistics service quality consists of product availability, order accuracy, timeliness, order condition, ordering procedures, personnel contact quality, information quality, order discrepancy handling. Furthermore, the consequences of logistics delivery failure have been reinforced in more recent studies [30,31,32]. In addition, by analyzing the common main topics of complaints from consumers and suppliers in express delivery, Gyu [33] showed that the parcel delivery industry faces challenges such as delay, loss, wrong delivery and fierce competition, and customers demanding higher quality of express logistics service. In studying the problems faced by strategic distribution and transportation in the e-commerce environment in China, Liu et al. [34] argued that the solution of logistics service problems will be a determining factor to define the success or failure of the future development of e-commerce.
To summarize, the existing research efforts have recognized the importance of EDSF to e-commerce market and logistics service quality, but the quantitative studies on how to evaluate the seriousness of risk factors for different EDSF modes have been lacking.

2.3. FMEA

Failure Mode and Effects Analysis (FMEA) is a systematic analysis tool of product function or service quality reliability, which was first proposed in the 1950s. This method can be used to identify the potential failure pattern of product or service and the risk degree and rationally allocate resources to take corresponding intervention measures to avoid the failure of product or service quality. In the FMEA method, Risk Priority Number (RPN) is generally calculated to define the risk level, and different control measures are taken according to its ranking, i.e., RPN = O × S × D (O, S, and D are the risk factors representing occurrence, severity, and detection respectively). To date, FMEA has been widely used in aerospace, medical, service, and other fields to provide forward-looking and operational decision support for enterprise management [35,36,37]. The traditional FMEA may not be very effective as a result of ignoring the fuzziness of evaluation information and inaccuracy of RPN obtained by multiplication of Q, S, and D. To address this issue, researchers have made extensive efforts, and improvements have been suggested in literature. Wang [38] presented fuzzy risk priority numbers (FRPN) to measure the risk priority in a more credible way. Gargama [39] constructed a criticality assessment model for FMEA by applying fuzzy logic to accomplish the convert randomness of evaluated data into a convex normalized fuzzy number. Pillay et al. [40] introduced fuzzy rule base and grey relation analysis (GRA) theory into the marine industry and solved the prioritization of potential failure modes in the situation of the same RPN value but different actual risk levels. Liu [41] proposed an RPN evaluation method using evidential reasoning (ER) method and gray correlation operator, which improved the effectiveness of traditional FMEA. Geum [35] also studied FMEA and GRA to identify and assess potential faults in hospital services. Ahmet et al. [42] determined experts’ evaluation of risk factors O, S, and D through fuzzy sets and realized the calculation of RPN by using fuzzy analytic hierarchy process (FAHP) and TOPSIS method. Hyung et al. [43] proposed analyzing the service risk and service reliability of supermarkets based on FMEA and grey correlation theory. Liu et al. [44] employed the VIKOR method in a fuzzy environment to obtain the priority order of failure modes in general anesthesia process. Liu et al. [45] developed a risk assessment approach in FMEA based on combining fuzzy weighted average with fuzzy decision-making trial and evaluation laboratory (DEMATEL). Liu et al. [46] adopted an intuitionistic fuzzy hybrid TOPSIS approach to improve the FMEA. Kok [47] indicated that perception calculation could be used to solve the uncertainty of FMEA in language evaluation. Moreover, Vodenicharova [48] discussed the use of FMEA method in the logistics processes in manufacturing plants and showed that FMEA is a method that can maintain the connection between logistics elements for analysis and follow the logical sequence of “cause-and-measure”. Zhang et al. [49] suggested a consensus-based group decision-making method for FMEA to classify failure modes into several ordinal risk categories. Alvand et al. [50] presented a combination model based on FMEA, stepwise weight assessment ratio analysis (SWARA), and weighted aggregated sum product assessment (WASPAS) approach under fuzzy environment. Khalilzadeh et al. [51] developed an FMEA approach by integrating SWARA and PROMETHEE techniques with the augmented e-constraint method (AECM) for risk assessment in the planning phase of the oil and gas construction projects in Iran.
In view of the above analysis, due to the imperfection of FMEA in uncertain environments, a few MCDM methods have been integrated into FMEA decision process to increase its performance, such as various types of fuzzy sets, GRA, FAHP [52], VIKOR, DEMATEL [53], etc. While efforts have been made to decrease the fuzziness of decision information in the uncertainty environment, they may not be effective in the processing of randomness, which is an essential component for uncertain cases. In essence, fuzziness and randomness are often equally important in the decision-making process. As such, new FMEA approaches for EDSF risk assessment, which can address fuzziness and randomness simultaneously to improve the reliability of FMEA risk priority ranking, are called for.

3. Research Methodology

To address the research gap, we propose an improved FMEA approach by integrating the uncertainty reasoning cloud model and the TOPSIS method to investigate the risk assessment of EDSF. The cloud model developed by Li et al. [
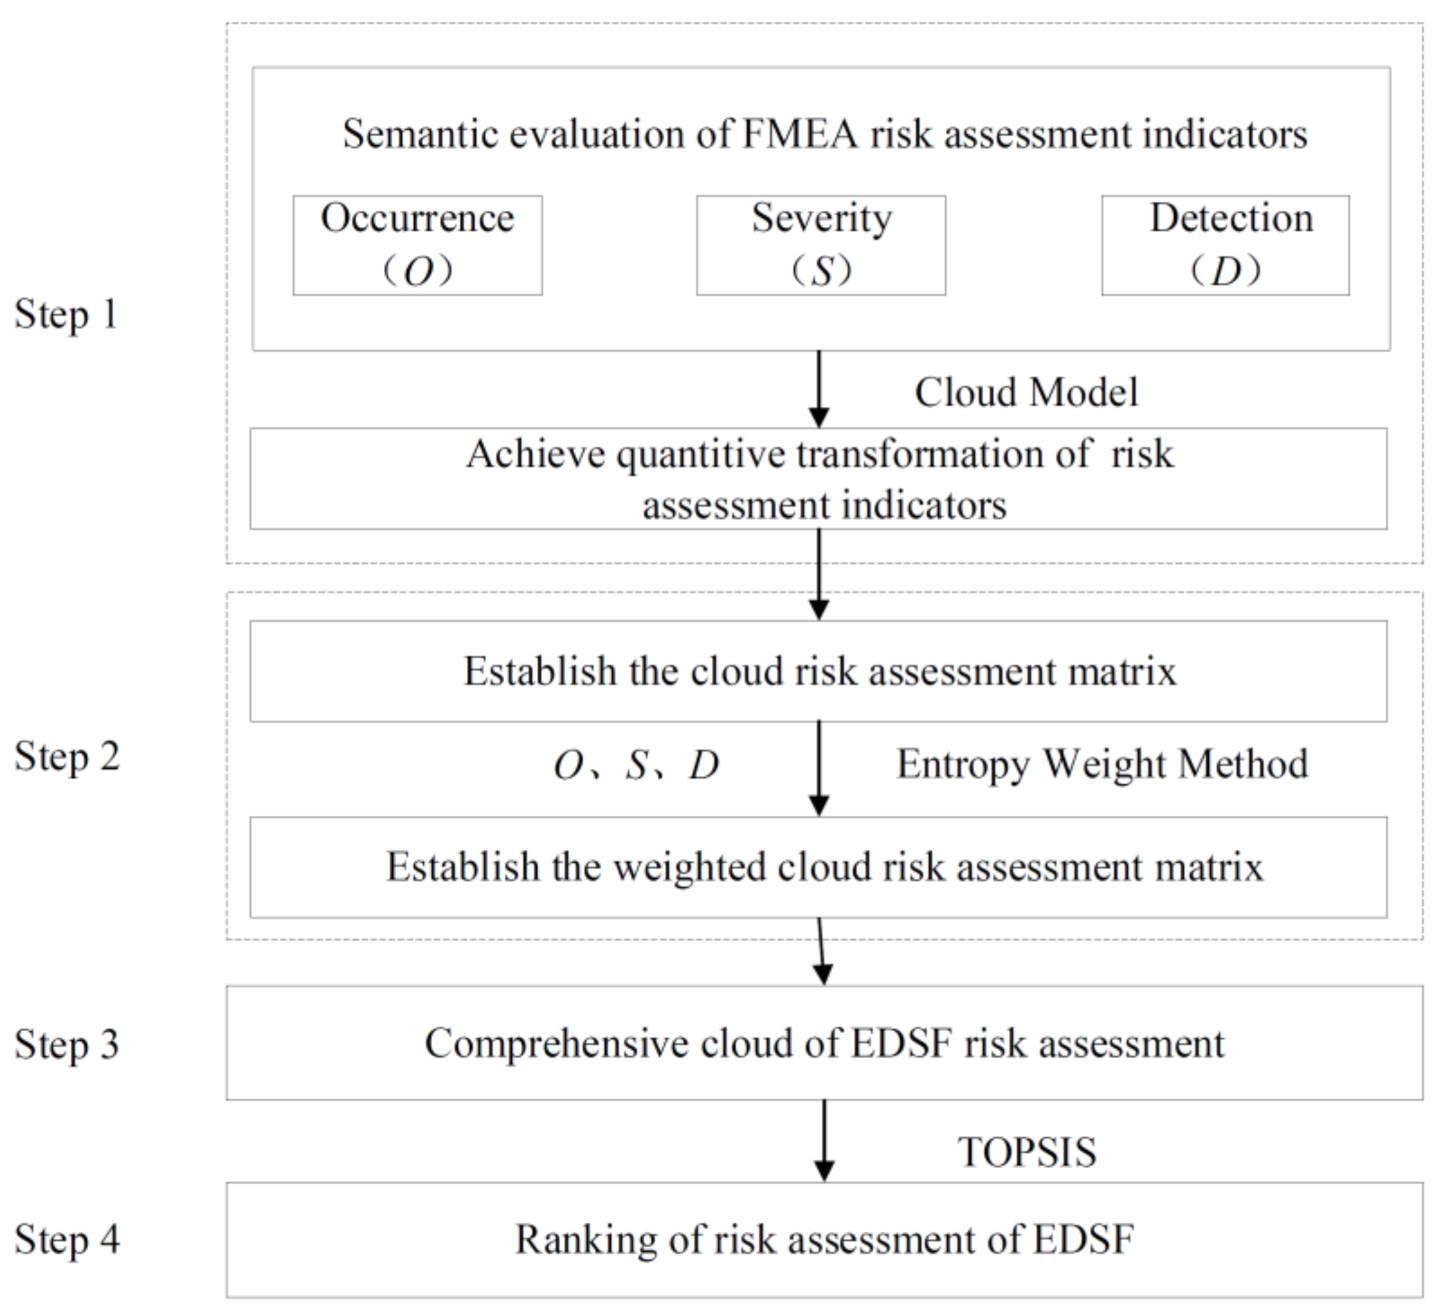
54] employs the basic principles of probability theory and fuzzy set theory to form the mutual transformation between qualitative linguistic variable and quantitative value through specific algorithms, and thus high-quality uncertainty can be obtained. In addition, the cloud model converts the quantitative random number into interval number, which decreases the information loss in the transformation process and will be convenient for decision-making evaluation. In this paper, the cloud model is selected to achieve the transformation between the qualitative semantic evaluation of the occurrence (O), severity (S), and detection (D) risk factors and the quantitative evaluation. Meanwhile, the TOPSIS model is used for obtaining the relative proximities between an evaluation objective and its optimal scheme and worst scheme, respectively, and it has no tight restrictions on the data distribution and sample size. Thus, it is adopted to calculate and rank the relative closeness coefficients of EDSF modes. It is believed that the proposed approach can more objectively assess the risk degree of EDSF for empirical studies. The framework of methodology consists of multiple steps, which are briefly described as below in Figure 1:
Step 1: The semantic evaluation of express delivery service failure is constructed to measure risk assessment indicator of EDSF based on the FMEA. Then the key process mainly realizes transformation between the qualitative FMEA semantic evaluation and the quantitative cloud model.
Step 2: The entropy weight method is used to calculate the weight of risk factors of EDSF, so that the cloud matrix of the risk assessment of express delivery service failure is established.
Step 3: According to the comprehensive digital characteristics of the cloud model, the risk assessment comprehensive cloud of express delivery service failure modes is determined.
Step 4: Based on the TOPSIS method, Hamming distance and closeness degree of positive ideal solution and negative ideal solution of the comprehensive cloud for risk assessment are calculated and ranked.

3.1. Cloud Model for Uncertainty Reasoning

“Cloud model”, first proposed by Li et al. [54,55], is a methodology that studies fuzziness and randomness as well as their correlation and constitutes the mapping relationship between qualitative linguistic indicators and quantitative values. Cloud model is not only competent for the modeling and calculation of imprecise, fuzzy, and incomplete information but also has unique advantages in dealing with random information. It has thus become a new uncertain information processing theory with high research popularity in many fields [56,57,58,59]. It has been recognized that the cloud model possesses the capability of the semantic conversion between quantitative and qualitative and increasing the accuracy of risk assessment.
In the cloud model [60],   C is a qualitative linguistic variable defined on U , which represents the universe of discourse. Cloud refers to the distribution of the mapping of concept C from U to the interval 0 ,   1 in the numerical domain space. x represents a cloud droplet and the distribution of x over U 
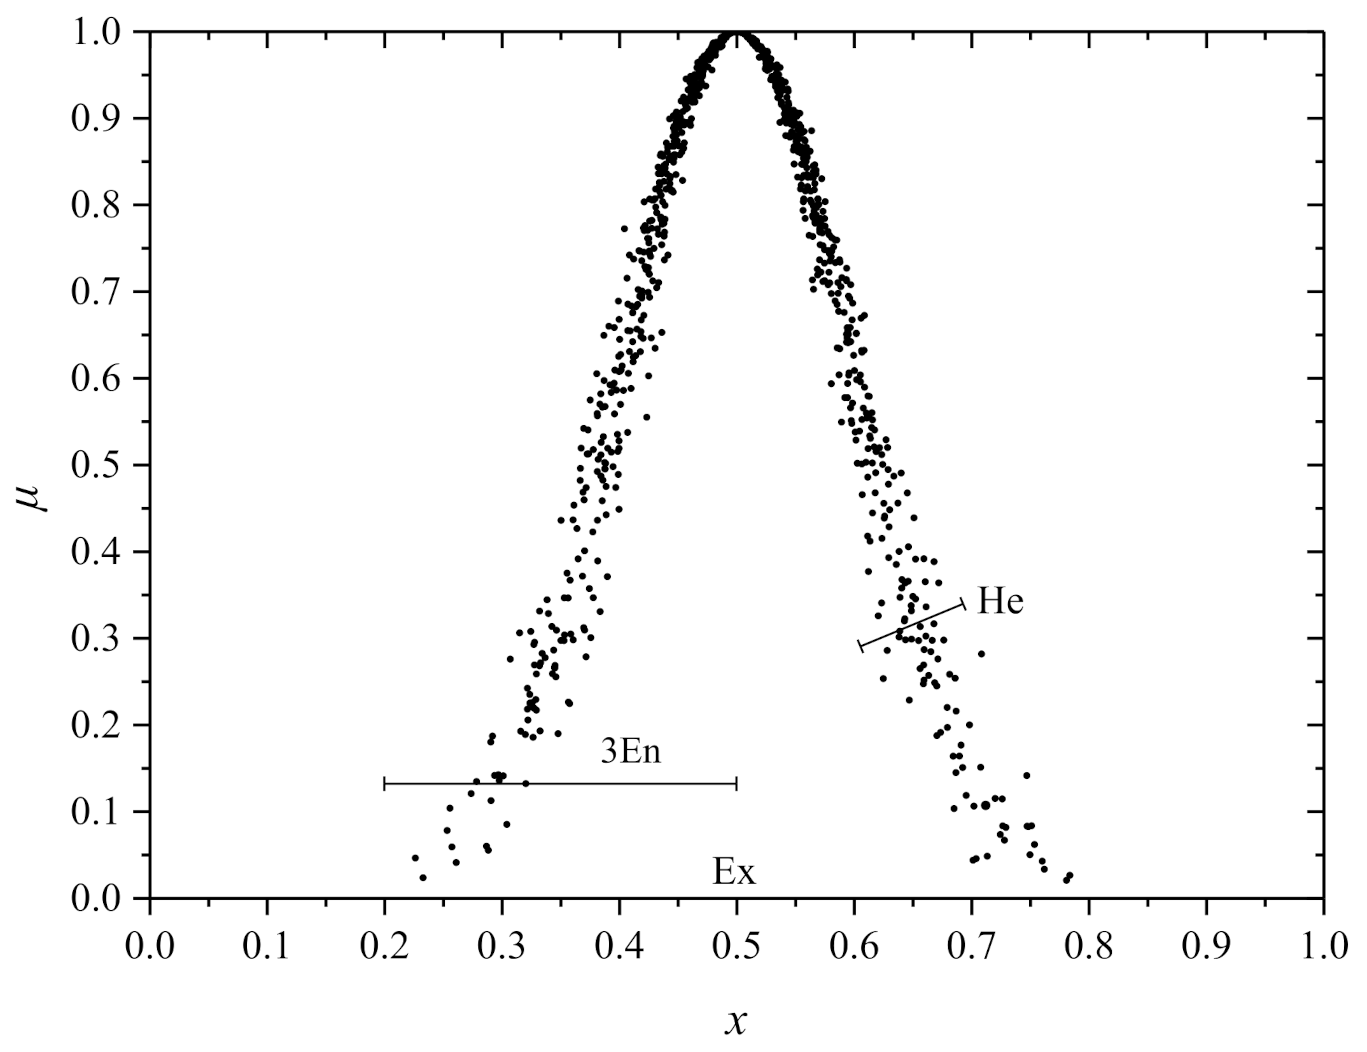
is a cloud. The cloud model is a normal cloud constructed by expectation E x , entropy E n and hyper entropy H e , which can be denoted as C ^ = E x ,   E n ,   H e . Expectation E x is the point that makes the most contribution when describing qualitative concepts and represents the expectation of the spatial distribution of cloud droplets. Entropy E n describes the uncertainty degree of qualitative concept, which is determined by both the randomness and fuzziness. The larger the entropy is, the larger the cloud granularity will be (where cloud granularity reflects the degree of dispersion of cloud droplets). Hyper entropy H e refers to the index changing under the random state, which represents the uncertainty of entropy. The higher the hyper entropy, the thicker the cloud (where cloud thickness reflects the dispersion of cloud), then the greater the randomness of membership degree of x belonging to U. Membership can be calculated from the definition of cloud model and its numerical value:   μ = exp - x - Ex 2 2 En 2 , which satisfies x ~ N Ex , En 2 ,   En ~ N En , He 2 , and the certainty degree of x belonging to concept C. The distribution of x over U is a normal cloud. Figure 2 shows the numerical characteristic cloud of the cloud model. In the figure, Ex = 0.5 ,   En = 0.1 ,   He = 0.01 .

3.2. FMEA Risk Assessment Indicators for Express Delivery Service

3.2.1. Semantic Evaluation of FMEA Risk Assessment Indicators

For the risk assessment of EDSF, in accordance with professional knowledge of expert team, cloud quantitative evaluation can be conducted to measure the occurrence (O), severity (S) and detection (D) of the FMEA model. This study used 7-point Likert scale, including extremely low, very low, low, moderate, high, very high, extremely high, respectively. The semantic evaluation of FMEA assessment indicators is shown in Table 1.

3.2.2. Quantitative Evaluation of FMEA Risk Assessment Indicators

In the risk assessment of express delivery service failure modes, linguistic variables as shown in Table 1 are used for expert assessment. Numerical domain U = ( X min ,   X max ) is determined by experts. The mapping relationship between the qualitative language variables and the cloud model is established by the Golden Section, also known as the Golden Ratio, in which a line segment is divided into two parts so that the ratio of one part to the whole length is equal to the ratio of the other part to this part. The ratio is an irrational number with an approximation value 0.618. In this paper, U = 0 ,   1 , t = 7 and the corresponding semantic variables are selected as (extremely high, very high, high, moderate, low, very low, extremely low). If the moderate cloud is set as Y 0 ( Ex 0 ,   En 0 ,   He 0 ) , the t normal clouds are arranged from left to right in order and can be denoted as: Y - t - 1 2 ( Ex - t - 1 2 ,   En - t - 1 2 ,   He - t - 1 2 ) , Y - 2 ( Ex - 2 ,   En - 2 ,   He - 2 ) , Y - 1 ( Ex - 1 ,   En - 1 ,   He - 1 ) , Y 0 ( Ex 0 ,   En 0 ,   He 0 ) , Y 1 ( Ex 1 ,   En 1 ,   He 1 ) , Y 2 ( Ex 2 ,   En 2 ,   He 2 ) , Y t - 1 2 ( Ex t - 1 2 ,   En t - 1 2 ,   He t - 1 2 ) ) . Then the numerical characteristics of the 7 generated clouds are calculated as follows [61],
Ex 0 = X min + X max 2 ,   Ex 3 = X max ,   Ex - 3 = X min ; Ex 2 = Ex 0 + 0.382 ( X min + X max ) 2 ,   Ex - 2 = Ex 0   -   0.382 ( X min + X max ) 2 ; Ex 1 = Ex 0 + 0.382 ( X min + X max ) 4 ,   Ex - 1   = Ex 0   -   0.382 ( X min + X max ) 4 ; En 0 = 0.618 En 1 ,   En 2 = En - 2 = En 1 0.618 ,   En 3 = En - 3 = En 2 0 . 618 ; He 0 = k ,   He 1 = He - 1 = He 0 0.618 ,   He 2 = He - 2 = He 1 0.618 ,   He 3 = He - 3 = He 2 0.618 .
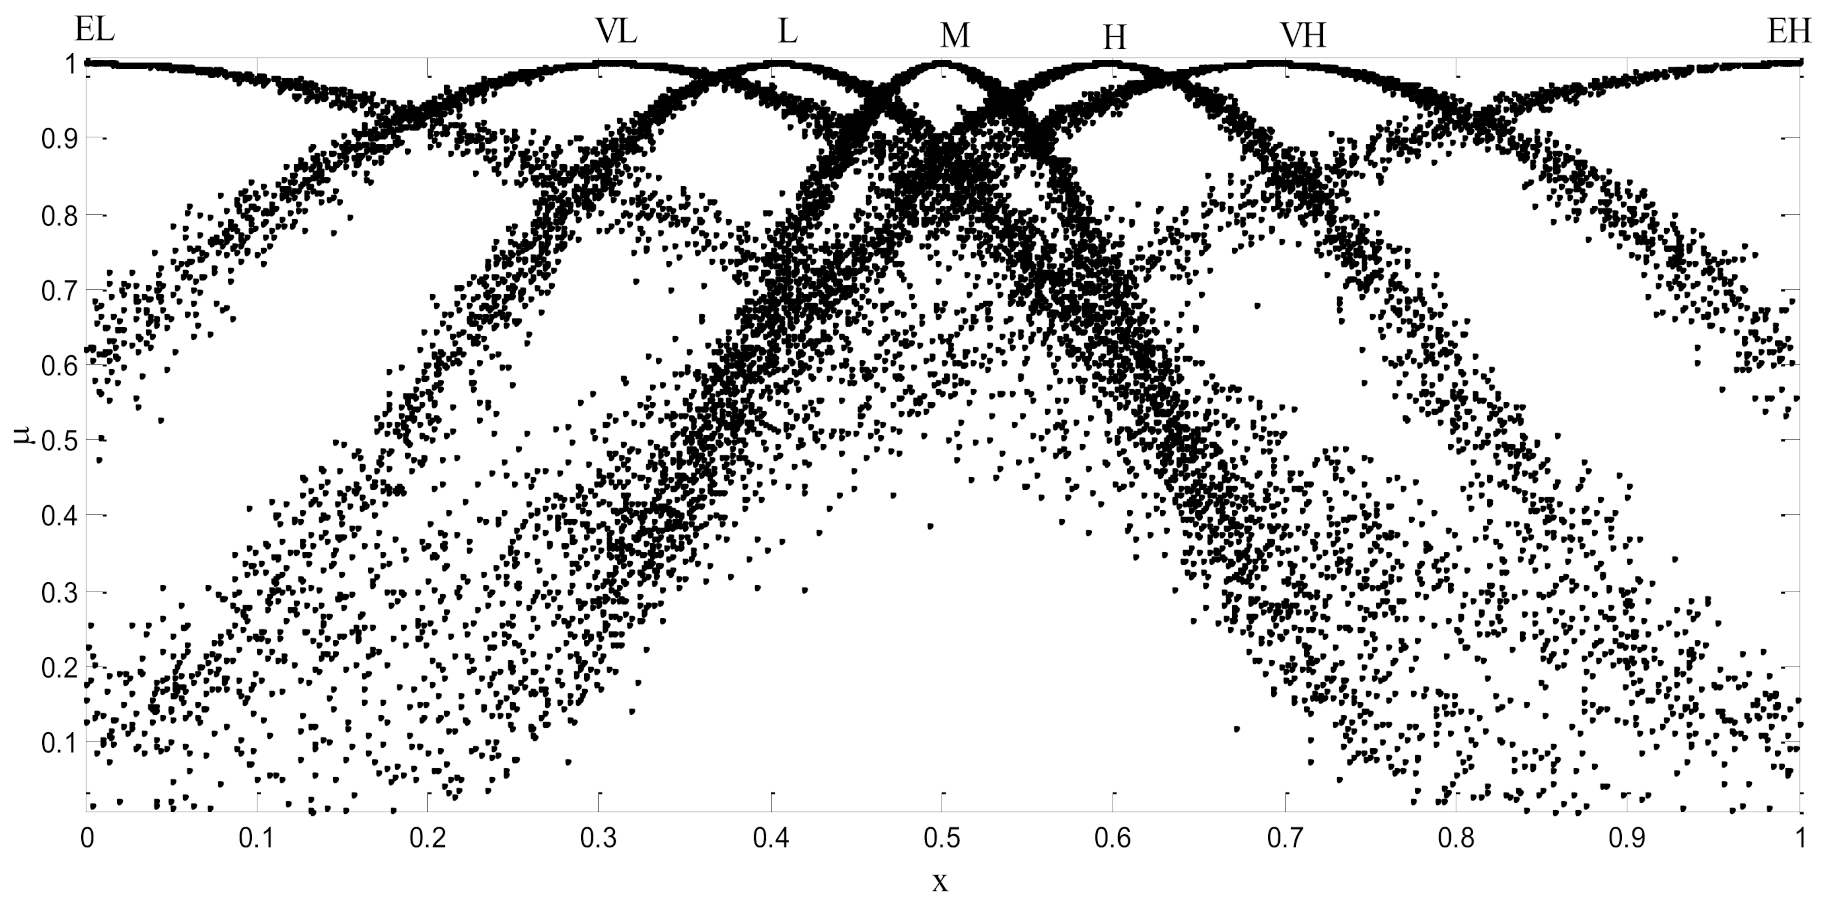
The transformation between semantic variables of evaluation level and the benchmark cloud model is shown in Table 2.
The benchmark cloud model levels is generated by the forward normal cloud generator, and the digital characteristics of the reference cloud of the evaluation level listed in Table 2 are shown in Figure 3.

3.3. Weight Determination of Risk Factor for EDSF

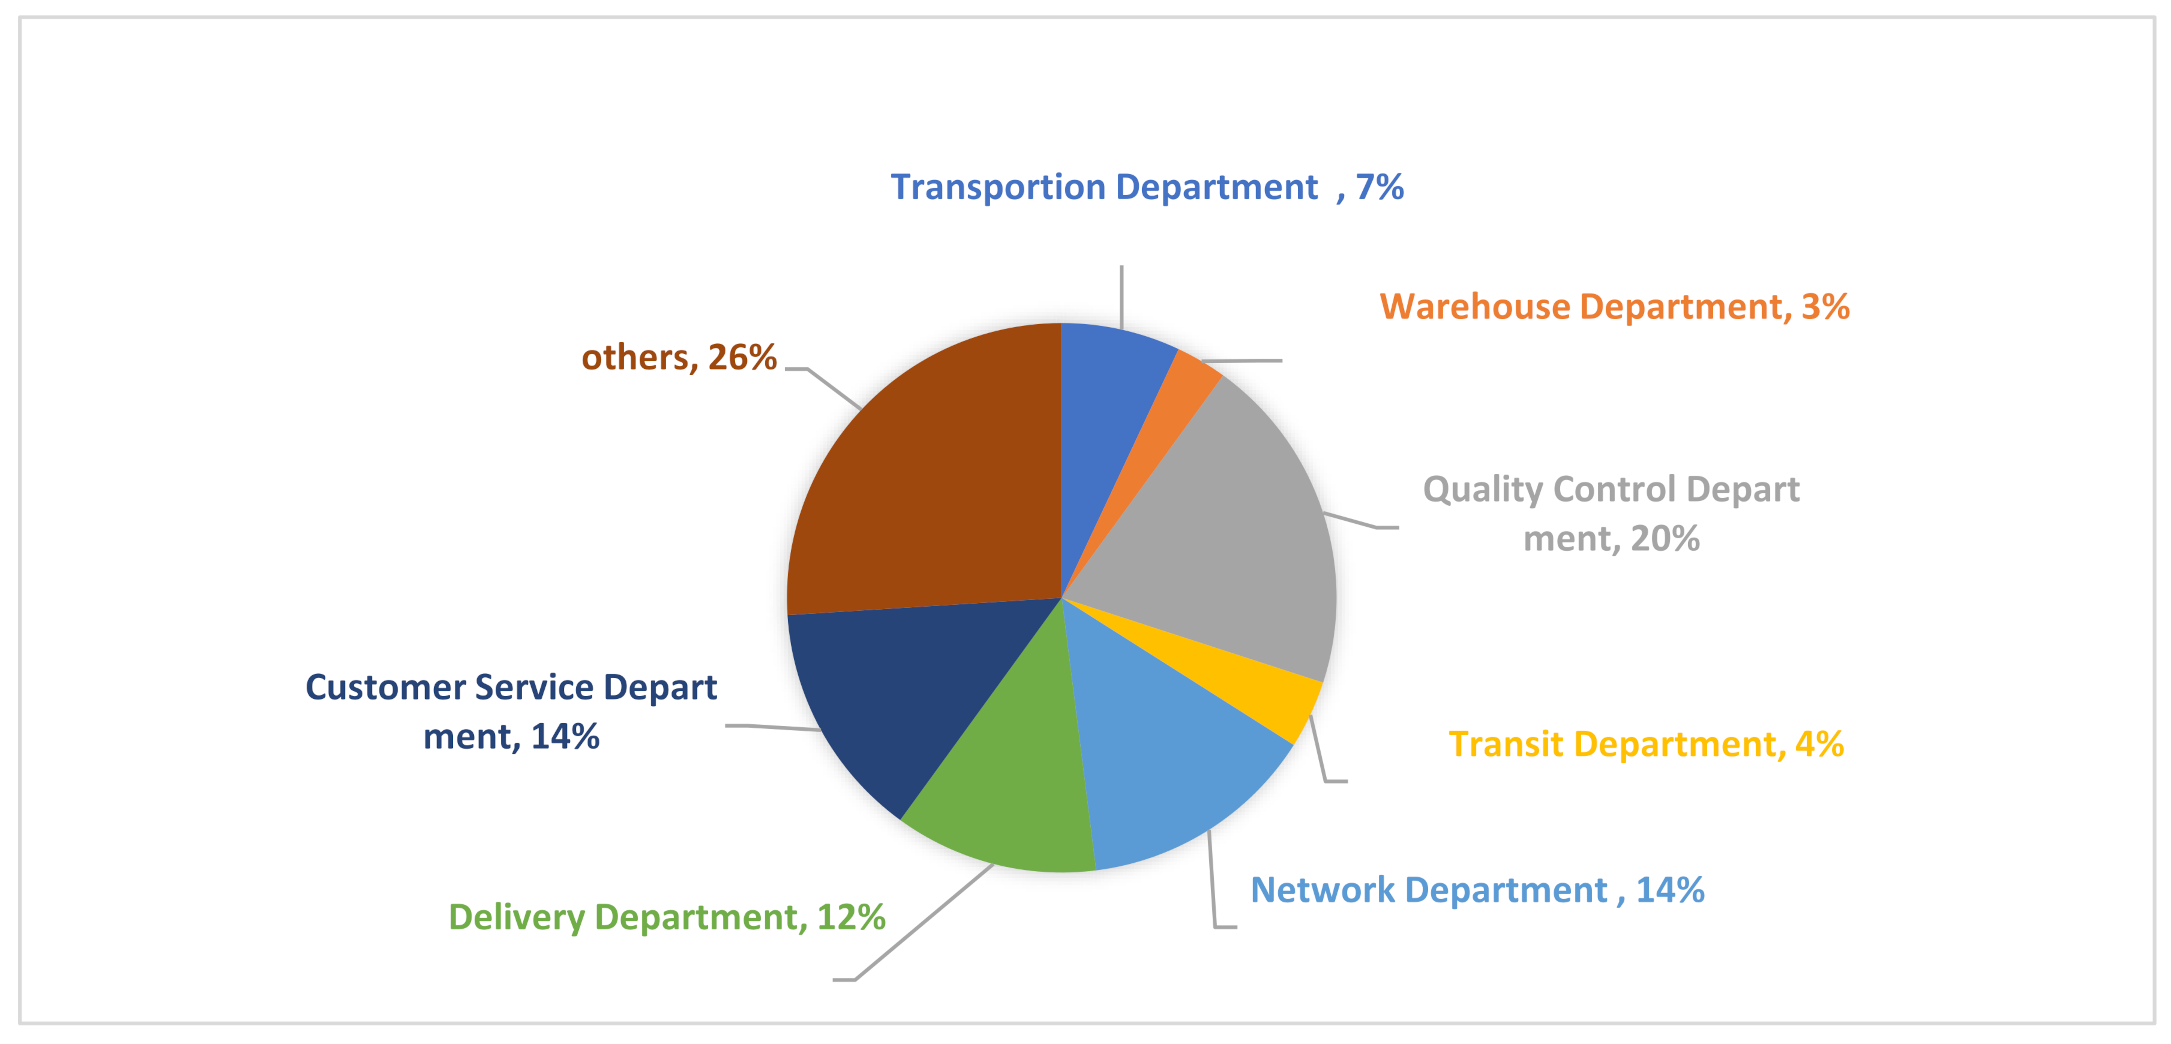
In this study, experts with managerial roles from receiving, transportation, customer service, quality, transit, and delivery departments in express delivery companies are invited to evaluate the risk factors in an electronic questionnaire survey, and then these semantic evaluation data are converted into quantitative values through three parameters of cloud model. Note that before the comprehensive expert survey, the risk factors need to be identified by working with a focus group of people and then finalized using a customer-oriented investigation.
Suppose that experts E k k = 1 ,   2 ,   t use semantic evaluation variables to describe the occurrence O, severity S and detection D of express delivery service failure modes and quantify the semantic evaluation through three parameters of cloud model. Then the cloud quantitative evaluation values of service failure mode F M i i = 1 ,   2 ,   ,   n from the k t h expert are as follows:   y k iO = Ex iO k ,   En iO k ,   He iO k ,   y k iS = Ex iS k ,   En iS k ,   He iS k ,   y k iD = Ex iD k ,   En iD k ,   He iD k . The risk assessment cloud of risk factors O, S, and D is obtained by cloud synthesis of the evaluation values from t experts: y iO = Ex iO   ,   En iO   ,   He iO   ,   y iS = Ex iS   ,   En iS   ,   He iS   ,   y iD = Ex iD   ,   En iD   ,   He iD   .
y i O = 1 t × k = 1 t y k i O     y i S = 1 t × k = 1 t y k i S     y i D = 1 t × k = 1 t y k i D  
The cloud risk assessment matrix of EDSF under the risk factors of Occurrence O, Severity S, and Detection D is as follows:
B = b i j = F M 1 F M i F M n y 1 O y 1 S y 1 D y i O y i S y i D y n O y n S y n D
On the above quantitative evaluation values of O, S, and D risk factors, the weights of risk factors for each express delivery service failure mode will affect the comprehensive risk assessment value of the individual failure modes. To avoid the subjectivity influence, this study adopts the entropy weight method to calculate the weight of risk factors. The basic steps of this method are as follows:
(1) Assuming that there are n evaluation indexes and m evaluation objects, the risk factor evaluation matrix is constructed as follows:
R = FM 1 FM m r 11 r 1 m r n 1 r nm
(2) The evaluation matrix is normalized:   R = r i j n + m , r i j is the value of the j t h measurement object on the index i , and r i j 0 ,   1 .
(3) The entropy of the risk factor of EDSF is defined as:
H I = - K j = 1 n P ij lnf ij i = 1 ,   2 ,   ,   n
where f ij = r ij j = 1 n r ij , k = 1 lnn . if f ij = 0 , f ij lnf ij = 0 .
(4) The weight of risk factors for EDSF is:
w i = 1 - H i m - j = 1 n H i

3.4. Comprehensive Cloud of EDSF Risk Assessment

The comprehensive cloud is formed by the combination of two or more same clouds generated in the same theoretical domain. Qualitative variables are often assigned by comments of experts using language description. The digital characteristics of the comprehensive cloud generated by n cloud models described semantically by experts are calculated as:
Ex = w 1 Ex 1 En 1   + w 2 Ex 2 En 2 + + w n Ex n En n En 1 + En 2 + + En n   En = w 1 En 1 + w 2 En 2 + + w n En n He = w 1 He 1 En 1   + w 2 He 2 En 2 + + w n He n En n w 1 En 1 + w 2 En 2 + + w n En n
In Equation (7), Ex 1 ,   Ex 2 ,   ,   Ex n refer to the expectations, En 1 ,   En 2 ,   ,   En n refer to the entropies, He 1 ,   He 2 ,   ,   He n refer to the hyper entropies of the express delivery service FMEA, and w 1 ,   w 2 ,   ,   w n represent the weights obtained from Equation (6). Suppose two clouds are Y α = Ex α   ,   En α ,   He α ,   Y β = Ex β   ,   En β ,   He β , then the Hamming distance (HMD) is:
d Y α ,   Y β = Ex α - Ex β 2 + En α - En β 2 + He α - He β 2 ( Ex α ) 2 + ( En α ) 2 + ( He α ) 2 + ( Ex β ) 2 + ( En β ) 2 + ( He β ) 2
The semantic evaluation value of the risk factors O, S, and D by the expert group is expressed by a basic cloud. Considering the weight of risk factors, the digital characteristics of the comprehensive cloud assessment of the EDSF risks are calculated as follows:
E x i = w O E x i O E n i O + w i S E x i S E n i S + w D E x i D E n i D w O E n i O + w S E x i S + w D E x i D E n = w O E n i O + w S E x i S + w D E x i D H e i = w O H e i O E n i O + w i S H e i S E n i S + w D H e i D E n i D w O E n i O + w S E x i S + w D E x i D
where w O , w S , and w D represent the weights of occurrence (O), severity (S), and detection (D) risk factors in the ith failure mode, respectively.

3.5. Risk Ranking for EDSF Based on TOPSIS

To sort failure modes, TOPSIS method is adopted. Often combined with fuzzy theory, it is a method used in multi-objective decision analysis for various applications [62,63,64,65]. The risk ranking of the failure modes is determined by relative closeness coefficient ( U i ). The specific steps are as follows [66]:
Step 1: Determine the weights of the risk factors of the target attributes according to Equations (4)–(6). Then take the weights into the risk assessment cloud matrix B to obtain the weighted cloud matrix B .
B = ( b ij ) = FM 1 FM i FM n w 0 y 1 O w S y 1 S w D y 1 D w 0 y iO w S y iS w D y iD w 0 y nO w S y nS w D y nD
Step 2: Establish the risk assessment cloud matrix and determine the cloud positive ideal solution (CPIS) and the cloud negative ideal solution (CNIS). The CPIS is the cloud with the least risk, while the CNIS is the cloud with the greatest risk [67]. For the efficiency-oriented index   J + , the CPIS selects the cloud with the greatest risk, while the CNIS selects the cloud with the least risk. For the cost-oriented index   J , the CPIS is represented by:
B + = max 1 i n b ij | j J + ,   min 1 i n b ij | j J - = b j +
the CNIS is represented by:
B - = min 1 i n b ij | j J + ,   max 1 i n b ij | j J - = b j -
where max b i j represents the b i j that maximizes E x , and if the E x values are the same, select the   b i j that leads to the lowest E n and H e ; m i n b i j represents the b i j that minimize E x , and if the E x values are the same, select the b i j that leads to the lowest E n and H e .
Step 3: Calculate the distance between the comprehensive cloud risk assessment according to Equation (9) and the cloud positive and negative ideal solution according to Equations (11) and (12). The distance to the cloud positive ideal solution is
D i + = j = 1 n d 2 b ij ,   b j +
The distance to the cloud negative ideal solution is
D i - = j = 1 n d 2 ( b ij ,   b j - )
Step 4: Calculate relative closeness coefficient ( U i ) for EDSF to determine the risk ranking:
U i = D i - D i + + D i -

4. Empirical Study

4.1. Risk Assessment Indicators for EDSF

To assess the soundness of methodology for risk assessment of EDSF, we conducted an empirical study for express delivery service in China. The main reason is that the express service industry has experienced significant growth in China, and it has become a critical sector for the society. The enormous user base could lead to the convenience of information collection, while the results could potentially benefit the important industry. The research team carried out a field study by working with the major express delivery service companies, such as SF Express, STO Express, YTO Express, ZTO Express, YunDa Express, and Chinese Post EMS in China. We interviewed a focus group of about 20 people from the quality management and customer service departments and consulted with them about the customers’ complaints. As a result, the initial evaluation indices for risk assessment of EDSF were established and categorized in accordance with four major stages of express service operation process, including picking-up, processing, transportation, and delivery. The initial evaluation indicators are shown in Table 3.
We further conducted a customer-oriented investigation for the importance of the initial evaluation indicators, which determines as the final EDSF risk assessment indicator system. In this regard, the entire list of indicators developed by working with the focus group was provided to the customers, instead of just those indicators that are directly connected to their personal experience. This is because most customers possess certain knowledge on “what could go wrong” in the entire express delivery process. In addition, by giving the initial list of indicators to the general customers, the meaning and cause of each indicator were explained in the survey. As a result, it was believed that the customers are empowered and less important indicators should be filtered out by the customers. The survey results from the general customers should still be regarded complementary to the field interview with the focus group. The importance of each index is scored by 7-point Likert scale: 1 means extremely unimportant, 2 means unimportant, 3 means somewhat unimportant, 4 means neutral, 5 means somewhat important, 6 indicates important, and 7 indicates extremely important. This survey was distributed to the customers who have used or received express services (namely sender or addressee) in all walks of life through phone calls, email, and/or social media platforms. A total of 500 questionnaires were collected in May to August, 2020. After eliminating the questionnaires with invalid entries, 491 questionnaires were kept. To test the quality of questionnaire and data, the reliability and validity tests were performed using SPSS 25.0. The results in Table 4 and Table 5 indicate that the reliability of the questionnaire is 0.938 and validity of the questionnaire is 0.965, which reflects a good internal consistency between variables and questionnaire items.
The cloud model requires the sample data to be normally distributed. The measured skewness and kurtosis should be less than 3 and 10 respectively. The analysis using SPSS 25.0 leads to the descriptive statistics of the survey, as shown in Table 6. The output results show that the absolute value of skewness coefficient of each item is 0.583 at most, which is far less than the standard value 3. The absolute value of the kurtosis coefficient of each item is 0.762 at most, which obviously meets the requirement that kurtosis is less than 10. It can be seen that the results all fit the requirements of normal distribution. In addition, the standard deviations of the obtained indicators are all less than 2, showing that the importance of each indicator is relatively consistent. On the other hand, the mean scores of “Unreasonable route” and “Unexpected charges” indicators are less than 4 points, while other indicators have the mean scores of higher than 4.5. As such, the two indicators are deemed less important and eliminated from further consideration. This is because in the 7-point Likert scale, the median is 4. Therefore, if the average score of an indicator is lower than the median, it is deemed less important. Finally, 18 EDSF modes are determined as the risk assessment indicator system, expressed as FM i ( i = 1 ,   2 ,   ,   18 ) , as shown in Table 7.

4.2. Development of Cloud Charts

After the field interview with a focus group and the customer-oriented survey, the semantic evaluation data on risk factors of express service FMEA: occurrence (O), severity (S), and detection (D) were obtained through a comprehensive questionnaire survey with industry experts. The research team visited the above mentioned major express companies in China again. Experts with managerial roles from receiving, transportation, customer service, quality, transit, and delivery departments in the companies were invited to participate in the electronic questionnaire survey from December 2020 to February 2021. The invited expert composition is shown in Figure 4. Eighteen invalid questionnaires among the 118 responses were eliminated, and 100 qualified questionnaires were retained. The results are shown in Table 8, Table 9 and Table 10.
Table 9, Table 10 and Table 11 are used to achieve the quantitative conversion of the language evaluation of the occurrence O, severity S, and detection D for the express delivery service FMEA, and Equation (2) is used to calculate the risk evaluation cloud on the expert language value. According to Equations (4)–(6), the weights of risk factors O, S, and D are w O = 0.474 , w S = 0.313 , w D = 0.213 , respectively. Finally, the comprehensive cloud of express delivery service FMEA can be obtained by Equation (9). The results are shown in Table 11.
According to the results of the comprehensive cloud in Table 12, the risk degree of EDSF in the picking up, processing, transportation, and delivery cloud charts can be seen in Figure 5, Figure 6, Figure 7 and Figure 8, respectively. In the cloud model, Ex FMi (I = 1, 2, 3,…,18) reflects the central point in the domain space. Figure 5a shows the risk level of comprehensive cloud of EDSF in the picking-up stage compared with the benchmark clouds (which are indicated by the black dots). Figure 5b in close-up view clearly shows that   Ex FM 1 ,   Ex FM 2 ,   Ex FM 3 ,   Ex FM 4     ( 0.309 , 0.405 ) , and this indicates that the risk of EDSF in the picking-up stage is between Very Low (VL) and Low (L). Similarly, Figure 6a shows the risk level of comprehensive cloud of EDSF in the processing stage compared with the benchmark clouds. Figure 6b in close-up view clearly shows that   Ex FM 5 ,   Ex FM 6 ,   Ex FM 7 ,   Ex FM 8     ( 0.405 , 0.596 ) , then the risk of EDSF in the processing stage is between Low (L) and High (H). Figure 7a shows the risk level of comprehensive cloud of EDSF in the transportation stage compared with the benchmark clouds. Figure 7b shows that   Ex FM 9 , Ex FM 10     ( 0.309 , 0.500 ) , the risk of EDSF in the transportation stage is between Very Low (VL) and Moderate (M). Figure 8a shows the risk level of comprehensive cloud of EDSF in the delivery stage compared with the benchmark clouds. Figure 8b in close-up view shows that Ex FM 11 ,   Ex FM 12 ,   Ex FM 13 ,   Ex FM 14 , Ex FM 15 ,   Ex FM 16 ,   Ex FM 17 ,   Ex FM 18     ( 0.309 , 0.500 ) ; the risk of EDSF in the delivery stage is between Very Low (VL) and Moderate (M).

4.3. Ranking of EDSF Risks

To obtain the ranking of EDSF risk more accurately and clearly, this paper uses the TOPSIS method. CPIS and CNIS are determined according to Equations (11) and (12): B + = 0 . 511 ,   0.269 ,   0.025 ; B - = ( 0.347 ,   0.254 ,   0.026 ) . According to Equations (13) and (14), the distance between express delivery service comprehensive cloud with CPIS and CNIS are calculated respectively. Finally, the relative closeness coefficient ( U i ) of express delivery service FMEA is calculated according to Equation (15). The results are shown in Table 12. According to the results, the overall ranking of the failure modes is: FM 8 > FM 7 > FM 11 > FM 6 > FM 12 > FM 13 > FM 15 > FM 10 > FM 5 > FM 9 > FM 17 > FM 14 > FM 3 > FM 18 > FM 16 > FM 1 > FM 2 > FM 4 .
The EDSF risk ranking in the picking-up stage is: F M 3 > F M 1 > F M 2 > F M 4 . F M 3 has the highest risk among four service failure modes. This indicates that customers may most likely become unsatisfied and transfer a different express delivery firm if they encounter the inconsistent charges service failure. The EDSF risk ranking in the processing stage is: F M 8 > F M 7 > F M 6 > F M 5 . The service failure with the highest risk is F M 8 . Package loss not only bring the benefit losses to customers but also damages a firm’s reputation. If it is not remedied in time, the customer’s trust in the service provider will be greatly declined. The risk ranking of EDSF in the transportation stage is:   F M 10 > F M 9 . Compared with F M 9 , the risk of express delivery service failure caused by lack of due diligence F M 10 will reduce the customer’s satisfaction with the express company.
Compared with the first three stages, more service failures are prone to occur in the delivery stage. According to Table 8, the EDSF risk ranking in the delivery stage is: F M 11 > F M 12 > F M 13 > F M 15 > F M 17 > F M 14 > F M 18 > F M 16 . Among them, F M 11 is the highest risk of service failure. If express packages cannot arrive as promised, the timeliness of express delivery service is disrupted, which increases the customer dissatisfaction and decreases customers’ loyalty to a firm.   F M 12 is also the second most significant one. While leaving packages in a pick-up place does provide great convenience for carriers and customers, the extra charge incurred is usually absorbed by the customers. Such action without consent from customers indeed leads to dissatisfaction. F M 13 is easy to occur due to the leakage of customer information. Under the increasing demand for privacy protection, customers regard this as a major risk.

4.4. Managerial Implications

Based on the above analysis, it can be seen that, among 18 EDSF modes in the four major stages, the service failures modes with the high risk in the processing and delivery stages are loss of package, rough handling, sorting error, privacy leakage, unauthorized delivery to a pick-up place, and poor service attitude. At the same time, six service failures with the relatively low risk involved in the picking-up and transportation stages are delayed transportation, lack of due diligence, inconsistent charge rate, service acceptance error, handover omission, and poor network coverage. On the basis of the research findings, the following suggestions are developed for express delivery companies, which help the companies to identify the key failure points, develop service remedial measures, reduce the loss from failures, and improve service quality and customer satisfaction.
(1)
Management should enhance the operations of sorting and processing, by standardizing the basic operation procedure and eliminating human caused errors. Firms are suggested to increase the investment on facilities and equipment to reduce the handling error caused by aging equipment or software.
(2)
The express delivery firms should establish an effective insurance claim system. To deal with weather and other force majeure factors, the firms should strengthen the effort to guide customers to purchase the necessary insurance to reduce the loss caused by those factors. As such, the interests of customers and firms are protected.
(3)
The firms should provide continuous education and training to employees to improve their work skills. Therefore, the employees can become better prepared to cope with various emergency scenarios and improve their sense of responsibility, service awareness, and adaptability.
(4)
The firms should enhance the tracking of service responsibilities. It is essential to be able to know who are responsible when service failures occur and to establish a rewarding system for the employees. Meanwhile, the after-sales service of express delivery should not be neglected so that customer feedback can be properly collected and analyzed.

5. Conclusions and Future Perspectives

5.1. Conclusions

In brief, the paper presents an improved Failure Mode and Effects Analysis (FMEA) approach based on the uncertainty reasoning cloud model and the TOPSIS method to evaluate the risk of express delivery service failure (EDSF). The approach is implemented in an empirical study for EDSF in China. The major contributions are summarized as follows:
(1)
This study addresses the research gap on the risk assessment of express delivery service failure. The established risk assessment indicators for EDSF by the empirical study provide a useful reference for the in-deep study and enrich the body of knowledge related to express delivery service failure.
(2)
Compared with the other decision techniques, this paper provides a new insight of FMEA by constructing decision matrices of expectation Ex, entropy En, and hyper entropy He of the cloud model, which describes the randomness and fuzziness in uncertain information and decreases the information loss in the transformation process. The integration with TOPSIS method further generates the comprehensive closeness coefficients. The approach provides a comprehensive decision process and makes the results more reasonable, and thus it enhances the risk detection ability of EDSF.
(3)
Based on the empirical study on express delivery service in China, this paper finds that six service failure modes with the highest risk are mainly located in the processing and delivery stages, while six service failures with the relatively low risks are involved in the picking-up and transportation stages. The findings provide the decision-making basis for the express firms to mitigate the express delivery service failure and take remedial measures.

5.2. Limitation and Future Research Directions

This study has certain limitations. First, although we shared the findings with the field experts, and they were generally in agreement. However, the rankings have not had the opportunity to be validated by their day-to-day operations through long-term data accumulation. Second, the data collection in the empirical study is only limited to the well-known major express companies, and it may not cover all representative customer groups in China. Third, although this research is intended to understand the critical express service failure modes through field study with focus group, customer survey, and expert questionnaires, the regional differences and correlation among service failure modes is not considered. Last, the research focuses on the risk evaluation of express service failure, while the corresponding recovery and remedial measures for the critical service failures are not addressed.
In the future, the immediate research extensions are called to address the above limitations. While it is for the first time that EDSF has been classified using such classification, the findings need to be further validated through long-term data collection. In addition, research could be extended through data collection from small to medium sized delivery service companies in China and expanding the customer questionnaires to more user groups. In this way, differentiation in findings might be obtained between the major companies and the smaller companies and/or different customer groups. Similarly, the methodology may be adopted for investigating express service failures in other countries, such that new issues might be identified and regional difference could be revealed. Meanwhile, the remedial measures and recovery issues from express delivery service failures should be further studied to effectively prevent and avoid high-risk service failures. In addition, the proposed FMEA approach of combining the cloud model with the TOPSIS method deserves efforts for improvement. In this regard, other MCDM methods [52,53,68] could be attempted and compared with the proposed approach in this study. Lastly, when the dataset from empirical studies is meaningfully large, machine learning approaches could be incorporated to further improve robustness.

Author Contributions

Conceptualization, H.S. and Q.T.; methodology, H.S. and Q.T.; software, Q.T.; validation, H.S., Q.T. and J.S.; formal analysis, H.S., Q.T. and J.S.; investigation, H.S., Q.T. and J.S.; resources, H.S., Q.T. and J.S.; data curation, Q.T., Q.Z.; writing—original draft preparation, H.S., Q.T.; writing—review and editing, H.S., J.S.; visualization, H.S., Q.T., Q.Z.; supervision, H.S., J.S.; project administration, H.S.; funding acquisition, H.S. All authors have read and agreed to the published version of the manuscript.

Funding

The first and second authors recognize research grants from the Humanities and Social Sciences Fund of Ministry of Education in China (Grant No.19YJA790070) and Shaanxi Federation of Social Sciences (Grant No.2020Z406).

Informed Consent Statement

Informed consent was obtained from all subjects involved in the study.

Data Availability Statement

Data are available upon reasonable request.

Conflicts of Interest

The authors declare no conflict of interest.

References

  1. Dospinescu, O.; Dospinescu, N.; Bostan, I. Determinants of e-commerce satisfaction: A comparative study between Romania and Moldova. Kybernetes 2021. [Google Scholar] [CrossRef]
  2. Holloway, B.B.; Beatty, S.E. Service failure in online retailing: A Recovery Opportunity. J. Serv. Res. 2003, 6, 92–105. [Google Scholar] [CrossRef]
  3. Forbes, L.P.; Kelley, S.W.; Hoffman, K.D. Typologies of e-commerce retail failures and recovery strategies. J. Serv. Mark. 2005, 19, 280–292. [Google Scholar] [CrossRef]
  4. Subramanian, N.; Gunasekaran, A.; Yu, J. Customer satisfaction and competitiveness in the Chinese E-retailing: Structural equation modeling (SEM) approach to identify the role of quality factors. Expert Syst. Appl. 2014, 41, 69–80. [Google Scholar] [CrossRef]
  5. Zemke, R.; Connellan, T. E-Service: 24 Ways to Keep Your Customers When the Competition Is Just a Click Away; AMACOM: New York, NY, USA, 2001. [Google Scholar]
  6. Chen, M.Y.; Teng, C.I. A comprehensive model of the effects of online store image on purchase intention in an e-commerce environment. Electron. Commer. Res. 2013, 13, 1–23. [Google Scholar] [CrossRef]
  7. Chen, Y.H.; Wu, J.J.; Chang, H.T. Examining the mediating effect of positive moods on trust repair in e-commerce. Internet Res. 2013, 23, 355–371. [Google Scholar] [CrossRef]
  8. Kim, Y.; Chang, Y.; Wong, S.F.; Park, M.-C. Customer attribution of service failure and its impact in social commerce environment. Int. J. Electron. Cust. Relatsh. Manag. 2014, 8, 136–158. [Google Scholar] [CrossRef]
  9. Vakeel, K.A.; Sivakumar, K.; Jayasimha, K.R.; Dey, S. Service failures after online flash sales: Role of deal proneness, attribution, and emotion. J. Serv. Manag. 2018, 29, 253–276. [Google Scholar] [CrossRef]
  10. Das, S.; Mishra, A.; Cyr, D. Opportunity gone in a flash: Measurement of e-commerce service failure andjustice with recovery as a source of e-loyalty. Decis. Support Syst. 2019, 125, 113–130. [Google Scholar] [CrossRef]
  11. Bitner, M.J.; Booms, B.H.; Mohr, L.A. A Critical Service Encounters: The Employee’s Viewpoint. J. Mark. 1994, 58, 95–106. [Google Scholar] [CrossRef]
  12. Maxham, J.G., III. Service recovery’s influence on consumer satisfaction, positive word-ofmouth, and purchase intentions. J. Bus. Res. 2001, 54, 11–24. [Google Scholar] [CrossRef]
  13. Michel, S. Analyzing service failures and recoveries: A process approach. Int. J. Serv. Ind. Manag. 2001, 12, 20–33. [Google Scholar] [CrossRef]
  14. Voorhees, C.M.; Brady, M.K. A Service Perspective on the Drivers of Complaint Intentions. J. Serv. Res. 2005, 8, 192–204. [Google Scholar] [CrossRef]
  15. Tan, C.; Benbasat, I.; Cenfetelli, R.T. An exploratory study of the formation and impact of electronic service failures. MIS Q. 2016, 40, 1–29. [Google Scholar] [CrossRef] [Green Version]
  16. Hess, R.L.; Ganesan, S.; Klein, N.M. Service failure and recovery: The impact of relationship factors on customer satisfaction. J. Acad. Marke. Sci. 2003, 31, 127–145. [Google Scholar] [CrossRef]
  17. Vázquez-Casielles, R.; Suárez Álvarez, L.; Díaz Martín, A.M. Perceived justice of service recovery strategies: Impact on customer satisfaction and quality relationship. Psychol. Mark. 2010, 27, 487–509. [Google Scholar] [CrossRef]
  18. Hsieh, A.-T.; Yen, C.-H. The effect of customer participation on service providers’ job stress. Serv. Ind. J. 2005, 25, 891–905. [Google Scholar] [CrossRef]
  19. Lewis, B.R.; McCann, P. Service failure and recovery: Evidence from1998 the hotel industry. Int. J. Contemp. Hosp. Manag. 2004, 16, 6–17. [Google Scholar] [CrossRef]
  20. Mattila, A.S. The effectiveness of service recovery in a multi-industry setting. J. Serv. Mark. 2001, 15, 583–596. [Google Scholar] [CrossRef]
  21. Miller, J.L.; Craighead, C.W.; Karwan, K.R. Service recovery: A framework and empirical investigation. J. Oper. Manag. 2000, 18, 387–400. [Google Scholar] [CrossRef]
  22. Lin, W.B. Service failure and consumer switching behaviors: Evidence from the insurance industry. Expert Syst. Appl. 2010, 37, 3209–3218. [Google Scholar] [CrossRef]
  23. Gelbrich, K. Anger, frustration, and helplessness after service failure: Coping strategies and effective informational support. J. Acad. Market. Sci. 2010, 38, 567–585. [Google Scholar] [CrossRef]
  24. Durvasula, S.; Lysonski, S.; Mehta, S.C. Business-to-business marketing service recovery and customer satisfaction issues with ocean shipping lines. Eur. J. Mark. 2000, 34, 433–452. [Google Scholar] [CrossRef] [Green Version]
  25. Zhong, Y.; Lai, I.K.W.; Guo, F.; Tang, H. Effects of Partnership Quality and Information Sharing on Express Delivery Service Performance in the E-commerce Industry. Sustainability 2020, 12, 8293. [Google Scholar] [CrossRef]
  26. Saura, I.G.; Francés, D.S.; Contrí, G.B. Logistics service quality: A new way to loyalty. Ind. Manage. Data Syst. 2008, 108, 650–668. [Google Scholar] [CrossRef] [Green Version]
  27. Ping, H.; Huang, D.Q. Logistics Service Failure and Logistics Service Recovery Measures Research. Proceedings of 2011 International Conference on Management Science and Intelligent Control (ICMSIC 2011), Hefei, China, 24–26 August 2011; Volume 2, pp. 600–603. [Google Scholar]
  28. Giovanis, A.N.; Tsoukatos, E. On the relationships between logistics service deliverables, customer satisfaction and loyalty in industrial supply chains. J. Int. Bus. Entrep. Dev. 2013, 7, 1549–1564. [Google Scholar] [CrossRef]
  29. Ma, P.; Yao, N.; Yang, X. Service Quality Evaluation of Terminal Express Delivery Based on an Integrated SERVQUAL-AHP-TOPSIS Approach. Math. Probl. Eng. 2021, 2021, 8883370. [Google Scholar] [CrossRef]
  30. Lin, Y. Exploring the service quality in the e-commerce context: A triadic view. Ind. Manage. Data Syst. 2016, 116, 388–415. [Google Scholar] [CrossRef]
  31. Adebayo, A.I.T. An Evaluation of the Impact of Business-To-Customer (B2C) Logistics Service Quality (LSQ) on Customer Satisfaction in Niger. IOSR J. Bus. Manag. 2017, 19, 111–115. [Google Scholar]
  32. Giìdener Özaydın, N.G. The Service Failure and Recovery Strategies in Logistics Service Sector. Celal Bayar Üniversitesi Sos. Bilimler Dergisi 2016, 14, 445–449. [Google Scholar] [CrossRef] [Green Version]
  33. Gyu, S.J. Analysis regarding Complaints of Courier Consumers and Workers in the Parcel Delivery Service by using Topic Model. J. Converg. Inf. Technol. 2020, 10, 39–48. [Google Scholar]
  34. Liu, L.G.; Zhang, C.X.; LI, P. Research on Logistics Management in Electronic Commerce. Proceedings of 2018 International Conference on Modeling, Simulation and Analysis, Wuhan, China, 7–8 February 2018; pp. 149–154. [Google Scholar]
  35. Geum, Y. A systematic approach for diagnosing service failure: Service-specific FMEA and grey relational analysis approach. Math. Comput. Model. 2011, 54, 3126–3142. [Google Scholar] [CrossRef]
  36. Bozdag, E. Risk prioritization in Failure Mode and Effects Analysis using interval type-2 fuzzy sets. Expert Syst. Appl. 2015, 42, 4000–4015. [Google Scholar] [CrossRef]
  37. Liu, H.C. Risk evaluation approaches in failure mode and effects analysis: A literature review. Expert Syst. Appl. 2013, 40, 828–838. [Google Scholar] [CrossRef]
  38. Wang, Y.M.; Chin, K.S.; Poon, G.K.; Yang, J.B. Risk evaluation in failure mode and effects analysis using fuzzy weighted geometric mean. Expert Syst. Appl. 2009, 36, 1195–1207. [Google Scholar] [CrossRef]
  39. Gargama, H.; Chaturvedi, S.K. Criticality assessment models for failure mode effects and criticality analysis using fuzzy logic. IEEE Trans. Reliab. 2011, 60, 102–110. [Google Scholar] [CrossRef]
  40. Pillay, A.; Wang, J. Modified failure mode and effects analysis using approximate reasoning. Reliab. Eng. Syst. Safe. 2003, 79, 69–85. [Google Scholar] [CrossRef]
  41. Liu, H.C.; Liu, L.; Bian, Q.H. Failure mode and effects analysis using fuzzy evidential reasoning approach and grey theory. Expert Syst. Appl. 2011, 38, 4403–4415. [Google Scholar] [CrossRef]
  42. Ahmet, C.K.; Mehmet, E.L. Fuzzy failure modes and effects analysis by using fuzzy TOPSIS-based fuzzy AHP. Expert Syst. Appl. 2012, 39, 61–67. [Google Scholar]
  43. Hyung, S.O.; Seung, K.M.; Jung, S.Y. Service-Oriented FMEA and Grey Relational Analysis Based Approach to Service Reliability Assessment. Int. J. Adv. Comput. Technol. 2013, 5, 225–234. [Google Scholar]
  44. Liu, H.C.; Liu, L.; Liu, N.; Mao, L.X. Risk evaluation in failure mode and effects analysis with extended VIKOR method under fuzzy environment. Expert Syst. Appl. 2012, 39, 12926–12934. [Google Scholar] [CrossRef]
  45. Liu, H.C.; You, J.X.; Lin, Q.L.; Li, H. Risk assessment in system FMEA combining fuzzy weighted average with fuzzy decision-making trial and evaluation laboratory. Int. J. Comput. Integ. Manuf. 2015, 28, 701–714. [Google Scholar] [CrossRef]
  46. Liu, H.C.; You, J.X.; Shan, M.M.; Shao, L.N. Failure mode and effects analysis using intuitionistic fuzzy hybrid TOPSIS approach. Soft Comput. 2015, 19, 1085–1098. [Google Scholar] [CrossRef]
  47. Kok, C.C.; Chian, J.; Kai, M.T. A perceptual computing-based method to prioritize failure modes in failure mode and effect analysis and its application to edible bird nest farming. Appl. Soft Comput. 2016, 49, 734–747. [Google Scholar]
  48. Vodenicharova, M. Opportunities for the applications of FMEA Model in logistics processes in Bulgarian enterprises. Logist. Sustain. Transp. 2017, 8, 31–41. [Google Scholar] [CrossRef] [Green Version]
  49. Zhang, H.; Dong, Y.; Palomares-Carrasosa, I.; Zhou, H. Failure mode and effect analysis in a linguistic context: A consensus-based multiattribute group decision-making approach. IEEE Trans. Reliab. 2018, 68, 566–582. [Google Scholar] [CrossRef] [Green Version]
  50. Alvand, A.; Mirhosseini, S.M.; Ehsanifar, M.; Zeighami, E.; Mohammadi, A. Identification and assessment of risk in construction projects using the integrated FMEA-SWARA-WASPAS model under fuzzy environment: A case study of a construction project in Iran. Int. J. Constr. Manag. 2021. [Google Scholar] [CrossRef]
  51. Khalilzadeh, M.; Ghasemi, P.; Afrasiabi, A.; Shakeri, H. Hybrid fuzzy MCDM and FMEA integrating with linear programming approach for the health and safety executive risks: A case study. J. Model. Manag. 2021. [Google Scholar] [CrossRef]
  52. Karatop, B.; Taşkan, B.; Adar, E.; Kubat, C. Decision analysis related to the renewable energy investments in Turkey based on a Fuzzy AHP-EDAS-Fuzzy FMEA approach. Comput. Ind. Eng. 2021, 151, 106958. [Google Scholar] [CrossRef]
  53. Seleem, S.N.; Attia, E.-A.; Karam, A.; El-Assal, A. A lean manufacturing road map using fuzzy-DEMATEL with case-based analysis. Int. J. Lean Six Sig. 2020, 11, 903–928. [Google Scholar] [CrossRef]
  54. Li, D.; Cheung, D.; Shi, X. Uncertainty Reasoning Based on Cloud Models in Controllers. Comput. Math. Appl. 1998, 35, 99–123. [Google Scholar] [CrossRef] [Green Version]
  55. Li, D.; Han, J.; Shi, X. Knowledge representation and discovery based on linguistic atoms. Knowl Based Syst. 1998, 10, 431–440. [Google Scholar] [CrossRef]
  56. Elmore, K.L.; Stensrud, D.J.; Crawford, K.C. Ensemble Cloud Model Applications to Forecasting Thunderstorms. J. Appl. Meteorol. 2002, 41, 363–383. [Google Scholar] [CrossRef] [Green Version]
  57. Liao, R.J.; Bian, J.P.; Yang, L.J. Cloud model-based failure mode and effects analysis for prioritization of failures of power transformer in risk assessment. Int. Trans. Electr. Energy Syst. 2013, 23, 1172–1190. [Google Scholar] [CrossRef]
  58. Wu, Y.; Chen, K.; Zeng, B. A cloud decision framework in pure 2-tuple linguistic setting and its application for low-speed wind farm site selection. J. Clean. Prod. 2017, 142, 2154–2165. [Google Scholar] [CrossRef]
  59. Li, X.L.; Ran, Y.; Zhang, G.B. A failure mode and risk assessment method based on cloud model. J. Intell. Manuf. 2019, 31, 1339–1352. [Google Scholar] [CrossRef]
  60. Li, D.; Liu, C.; Gan, W. A new cognitive model: Cloud model. J. Int. Syst. 2009, 24, 357–375. [Google Scholar] [CrossRef]
  61. An, X.H.; CAI, W.G.; Song, X.J. FMEA coupling evaluation method based on cloud model and collaborative decision. Comput. Int. Manuf. Syst. 2018, 24, 1179–1190. [Google Scholar]
  62. Liu, H.C. Improving Risk Evaluation in FMEA with Cloud Model and Hierarchical TOPSIS Method. IEEE Trans. Fuzzy Syst. 2019, 27, 84–95. [Google Scholar] [CrossRef]
  63. Beikkhakhian, Y.; Javanmardi, M.; Karbasian, M. The application of ISM model in evaluating agile suppliers selection criteria and ranking suppliers using fuzzy TOPSIS-AHP methods. Expert Syst. Appl. 2015, 42, 6224–6236. [Google Scholar] [CrossRef]
  64. Anyaeche, C.O.; Ighravwe, D.E.; Asokeji, T.A. Project portfolio selection of banking services using COPRAS and Fuzzy-TOPSIS. J. Proj. Manag. 2017, 2, 51–62. [Google Scholar] [CrossRef]
  65. Agrawal, S.; Singh, R.K.; Murtaza, Q. Prioritizing critical success factors for reverse logistics implementation using fuzzy-TOPSIS methodology. J. Ind. Eng. Int. 2015, 12, 15–27. [Google Scholar] [CrossRef] [Green Version]
  66. Chen, C.T. Extension of the TOPSIS for group decision-making under fuzzy environment. Fuzzy Set. Syst. 2000, 114, 1–9. [Google Scholar] [CrossRef]
  67. Li, H.; Luo, G.F.; Xie, Q.S. Evaluation model of dynamic allied manufacturing resources based on application service provider. Comput. Integr. Manuf. Syst. 2007, 13, 862–868. [Google Scholar]
  68. Karam, A.; Hussein, M.; Reinau, K.H. Analysis of the barriers to implementing horizontal collaborative transport using a hybrid fuzzy Delphi-AHP approach. J. Clean. Prod. 2021, 321, 128943. [Google Scholar] [CrossRef]
Figure 1. Framework of the proposed methodology.
Jtaer 16 00137 g001
Figure 2. Normal cloud Ex = 0.5, En = 0.1, He = 0.01.
Jtaer 16 00137 g002
Figure 3. Benchmark cloud.
Jtaer 16 00137 g003
Figure 4. Summary of expert composition.
Jtaer 16 00137 g004
Figure 5. Evaluation and benchmark clouds for the pick-up stage: (a) overall plot; (b) close-up view.
Jtaer 16 00137 g005
Figure 6. Evaluation and benchmark clouds for the processing stage: (a) overall plot; (b) close-up view.
Jtaer 16 00137 g006
Figure 7. Evaluation and benchmark clouds for the transportation stage: (a) overall plot; (b) close-up view.
Jtaer 16 00137 g007aJtaer 16 00137 g007b
Figure 8. Evaluation and benchmark clouds for the delivery stage: (a) overall plot; (b) close-up view.
Jtaer 16 00137 g008
Table 1. Semantic evaluation of FMEA assessment indicators.
Linguistic VariableSymbolOccurrence (O)Severity (S)Detection (D)
Extremely lowELalmost impossible occurrencealmost no impactextremely easy to detect
Very lowVLrare occurrencevery low impactvery easy to detect
LowLlow occurrencelow impacteasy to detect
ModerateMmoderate occurrencemoderate impactdetectable
HighHhigh occurrencehigh impactdifficult to detect
Very highVHvery high occurrencevery high impactvery difficult to detect
Extremely highEHalmost constant occurrenceextremely high impactextremely difficult to detect
Table 2. Benchmark cloud model levels.
Semantic Variable ( E x ,   E n ,   H e )
Extremely high (EH)1.000, 0.500, 0.042
Very high (VH)0.691, 0.309, 0.026
High (H)0.596, 0.191, 0.016
Moderate (M)0.500, 0.118, 0.010
Low (L)0.405, 0.191, 0.016
Very low (VL)0.309, 0.309, 0.026
Extremely low (EL)0.000, 0.500, 0.042
Table 3. The initial risk assessment indicator for EDSF and its explanation.
Operation ProcessesFailure ModesExplanation
Picking-upService acceptance errorOutgoing package pick-up delay or mistake due to carelessness of attendants.
Poor network coverageInsufficient coverage of express delivery service, which causes inconveniency for customers.
Inconsistent charge rateService pricing is random and not consistent, resulting in erosion of customer trust.
Handover omissionPackages are not forwarded to the next stage in time.
ProcessingSorting errorPackages are sorted to wrong addresses
Delayed processingPackages are not processed in time, resulting in prolonged receiving time for customers.
Rough handlingPackages are processed in an aggressive way, which causes damages to the goods.
Loss of packagePackages are lost and cannot be recovered during the processing stage.
TransportationUnreasonable routingTransportation routing is not reasonable, which causes the delay of shipment.
Delayed transportationDelays due to poor road condition, unreasonable routing, traffic jam, and other reasons.
Lack of due diligenceLack of good skills and work enthusiasm affects the transportation efficiency.
DeliveryDelivery errorPackages have not been received by customers while the system indicates otherwise.
Unauthorized delivery to a pick-up placePackages are delivered to a convenient pick-up place without consent of customers.
Unexpected chargesExtra (unexpected) charges are incurred for delivery.
Privacy leakagePrivacy information of customers is leaked in the delivery of packages.
Inflexible pick-up timePick-up time is not flexible for customers when packages are left in pick-up places (e.g., convenience stores or cabinets).
Damaged packagePackages are damaged upon arrival.
Receiving signature is-sueRelease of packages without following the operational procedure (such as checking ID).
Poor service attitudeImpatient or rude service from the delivery people.
No response to complaintsCustomer concerns and complaints are not handled in a timely manner.
Table 4. Analysis of data reliability.
Cronbach’s AlphaNumber of Items
0.93820
Table 5. Analysis of data validity.
KMO 0.965
Bartlett’s test for sphericityThe approximate chi-square11,682.460
Df.190
Sig.0.000
Table 6. Descriptive statistics of questionnaire results.
Express Delivery ServiceExpress Delivery Service Failure ModeAverageStandard DeviationSkewnessKurtosisN
StatisticsStandard
Errors
StatisticsStandard
Errors
Picking-upService acceptance error4.661.748−0.5430.110−0.4680.220491
Poor network coverage4.591.667−0.3710.110−0.5110.220491
Inconsistent charge rate4.771.716−0.5810.110−0.4540.220491
Handover omission4.701.773−0.5040.110−0.6660.220491
ProcessingSorting error4.751.807−0.5400.110−0.6510.220491
Delayed processing4.791.714−0.4870.110−0.7250.220491
Loss of package4.651.830−0.5480.110−0.5740.220491
Rough handling4.591.673−0.3920.110−0.4500.220491
TransportationUnreasonable routing3.431.8120.5140.110−0.5370.220491
Delayed transportation4.561.687−0.4110.110−0.5180.220491
Lack of due diligence4.581.658−0.5060.110−0.4680.220491
DeliveryUnauthorized delivery to a pick-up place4.631.832−0.4600.110−0.6780.220491
Delivery error4.861.799−0.4800.110−0.7610.220491
Unexpected charges3.191.8570.5500.110−0.7000.220491
Privacy leakage4.741.945−0.5830.110−0.7180.220491
Inflexible pick-up time4.681.828−0.5110.110−0.6360.220491
Damaged package4.681.717−0.5570.110−0.5890.220491
Receiving signature issue4.691.722−0.5080.110−0.6030.220491
Poor service attitude4.831.854−0.5550.110−0.7620.220491
No response to complaints4.731.730−0.4540.110−0.6960.220491
Table 7. Index system of EDSF risk assessment.
Express Delivery ServiceFailure ModesExpress Delivery Service Failure Mode
Picking-up F M 1 Service acceptance error
F M 2 Poor network coverage
F M 3 Inconsistent charge rate
F M 4 Handover omission
Processing F M 5 Sorting error
F M 6 Delayed processing
F M 7 Rough handling
F M 8 Loss of package
Transportation F M 9 Lack of due diligence
F M 10 Delayed transportation
Delivery F M 11 Delivery error
F M 12 Unauthorized delivery to a pick-up place
F M 13 Privacy leakage
F M 14 Inflexible pick-up time
F M 15 Damaged package
F M 16 Receiving signature issue
F M 17 Poor service attitude
F M 18 No response to complaints
Table 8. Occurrence (O) semantic evaluation results and risk assessment cloud.
Extremely Low (EL)Very Low (VL)Low (L)Moderate (M)High (H)Very High (VH)Extremely High (EH)Risk Assessment Cloud
FM1202720141333(0.363,0.233,0.024)
FM2252224121034(0.346,0.257,0.025)
FM3332213121055(0.325,0.288,0.028)
FM423332212433(0.326,0.239,0.026)
FM5152024201326(0.410,0.227,0.022)
FM6722212114105(0.461,0.207,0.021)
FM7916241517811(0.488,0.238,0.023)
FM81215178142212(0.511,0.273,0.025)
FM9172128181024(0.382,0.228,0.023)
FM10112320221374(0.428,0.211,0.022)
FM111420191710119(0.449,0.246,0.024)
FM12231616241245(0.383,0.252,0.024)
FM1320311411978(0.390,0.252,0.026)
FM1420172219976(0.399,0.252,0.024)
FM15132025211254(0.414,0.218,0.022)
FM1622272015862(0.349,0.239,0.025)
FM1721281914945(0.365,0.243,0.025)
FM1832221912636(0.321,0.285,0.028)
Note: EL, VL, L, M, MH, VH and EH respectively denote expert semantic rating as extremely low, very low, low, moderate, high, very high and extremely high.
Table 9. Severity (S) semantic evaluation results and risk assessment cloud.
Extremely Low (EL)Very Low (VL)Low (L)Moderate (M)High (H)Very High (VH)Extremely High (EH)Risk Assessment Cloud
FM126161818877(0.378,0.275,0.026)
FM2271816161085(0.365,0.273,0.026)
FM3291416148613(0.397,0.306,0.028)
FM4232218121276(0.381,0.262,0.026)
FM5161819191666(0.424,0.237,0.023)
FM6917152018129(0.493,0.232,0.022)
FM71314112019914(0.503,0.259,0.024)
FM810121515141816(0.541,0.272,0.025)
FM91816211810611(0.436,0.261,0.025)
FM10151515192259(0.458,0.245,0.023)
FM1117141510131615(0.492,0.290,0.027)
FM121514102015818(0.508,0.276,0.026)
FM1320209149820(0.477,0.297,0.028)
FM14201722211154(0.387,0.242,0.023)
FM15158271615109(0.463,0.259,0.023)
FM16231520121686(0.398,0.269,0.025)
FM172217141213139(0.427,0.279,0.026)
FM182416171310614(0.424,0.293,0.027)
Table 10. Detection (D) semantic evaluation results and risk assessment cloud.
Extremely Low (EL)Very Low (VL)Low (L)Moderate (M)High (H)Very High (VH)Extremely High (EH)Risk Assessment Cloud
FM122182321781(0.361,0.241,0.023)
FM232142613744(0.323,0.286,0.026)
FM337171412785(0.316,0.308,0.029)
FM430222214822(0.309,0.264,0.026)
FM5191825161363(0.386,0.240,0.023)
FM6152121161494(0.416,0.231,0.023)
FM7192019121578(0.417,0.258,0.025)
FM81521239111110(0.445,0.257,0.025)
FM921242018773(0.365,0.241,0.024)
FM10212024151253(0.370,0.244,0.024)
FM11211922109118(0.407,0.271,0.026)
FM1221171720988(0.410,0.262,0.025)
FM1324191213111011(0.417,0.286,0.027)
FM14241625171152(0.356,0.252,0.024)
FM1516202617975(0.404,0.235,0.023)
FM1625182316594(0.361,0.265,0.025)
FM17261919151164(0.358,0.264,0.025)
FM183024189847(0.337,0.284,0.028)
Table 11. Risk assessment cloud and comprehensive cloud.
OSDComprehensive Cloud
F M 1 (0.363,0.233,0.024)(0.378,0.275,0.026)(0.361,0.241,0.023)(0.368,0.248,0.025)
F M 2 (0.346,0.257,0.025)(0.365,0.273,0.026)(0.323,0.286,0.026)(0.347,0.268,0.026)
F M 3 (0.325,0.288,0.028)(0.397,0.306,0.028)(0.316,0.308,0.029)(0.346,0.298,0.028)
F M 4 (0.326,0.239,0.026)(0.381,0.262,0.026)(0.309,0.264,0.026)(0.340,0.252,0.026)
F M 5 (0.410,0.227,0.022)(0.424,0.237,0.023)(0.386,0.240,0.023)(0.409,0.233,0.023)
F M 6 (0.461,0.207,0.021)(0.493,0.232,0.022)(0.416,0.231,0.023)(0.461,0.220,0.022)
F M 7 (0.488,0.238,0.023)(0.503,0.259,0.024)(0.417,0.258,0.025)(0.477,0.249,0.024)
F M 8 (0.511,0.273,0.025)(0.541,0.272,0.025)(0.445,0.257,0.025)(0.507,0.269,0.025)
F M 9 (0.382,0.228,0.023)(0.436,0.261,0.025)(0.365,0.241,0.024)(0.396,0.241,0.024)
F M 10 (0.428,0.211,0.022)(0.458,0.245,0.023)(0.370,0.244,0.024)(0.425,0.228,0.023)
F M 11 (0.449,0.246,0.024)(0.492,0.290,0.027)(0.407,0.271,0.026)(0.455,0.265,0.025)
F M 12 (0.383,0.252,0.024)(0.508,0.276,0.026)(0.410,0.262,0.025)(0.430,0.261,0.025)
F M 13 (0.390,0.252,0.026)(0.477,0.297,0.028)(0.417,0.286,0.027)(0.425,0.274,0.027)
F M 14 (0.399,0.252,0.024)(0.387,0.242,0.023)(0.356,0.252,0.024)(0.386,0.249,0.024)
F M 15 (0.414,0.218,0.022)(0.463,0.259,0.023)(0.404,0.235,0.023)(0.429,0.234,0.022)
F M 16 (0.349,0.239,0.025)(0.398,0.269,0.025)(0.361,0.265,0.025)(0.368,0.254,0.025)
F M 17 (0.365,0.243,0.025)(0.427,0.279,0.026)(0.358,0.264,0.025)(0.384,0.259,0.026)
F M 18 (0.321,0.285,0.028)(0.424,0.293,0.027)(0.337,0.284,0.028)(0.358,0.287,0.028)
Table 12. Relative closeness coefficient of express delivery service FMEA.
Comprehensive Cloud D i + D i U i Ranking
F M 1 (0.368,0.248,0.025)0.1380.0320.19015
F M 2 (0.347,0.268,0.026)0.1580.0210.11717
F M 3 (0.346,0.298,0.028)0.1580.0530.25113
F M 4 (0.340,0.252,0.026)0.1680.0000.00018
F M 5 (0.409,0.233,0.023)0.0990.0810.4489
F M 6 (0.461,0.220,0.022)0.0620.1340.6854
F M 7 (0.477,0.249,0.024)0.0320.1430.8162
F M 8 (0.507,0.269,0.025)0.0000.1681.0001
F M 9 (0.396,0.241,0.024)0.1090.0650.37210
F M 10 (0.425,0.228,0.023)0.0870.0970.5298
F M 11 (0.455,0.265,0.025)0.0470.1220.7213
F M 12 (0.430,0.261,0.025)0.0710.0980.5815
F M 13 (0.425,0.274,0.027)0.0750.0950.5586
F M 14 (0.386,0.249,0.024)0.1190.0520.30611
F M 15 (0.429,0.234,0.022)0.0800.0990.5537
F M 16 (0.368,0.254,0.025)0.1370.0320.19016
F M 17 (0.384,0.259,0.026)0.1190.0510.29912
F M 18 (0.358,0.287,0.028)0.1450.0450.23814
Publisher’s Note: MDPI stays neutral with regard to jurisdictional claims in published maps and institutional affiliations.

