Changes in HMO Concentrations throughout Lactation: Influencing Factors, Health Effects and Opportunities

 , , ,
, , ,
Abstract
:1. Introduction
2. Composition throughout Lactation
2.1. Total HMO Concentration
2.2. Individual HMO Concentrations
3. Factors Influencing HMO Profile and Concentration
3.1. Secretor and Lewis Blood Group Status
3.2. Country of Origin
3.3. Maternal Physiological Status
4. Health Effects of HMO
4.1. HMO Profile and Microbiota in Infant’s Gut and Mother’s Milk
4.2. Supplementation of Infant Formula with HMOs
5. Conclusions
Supplementary Materials
Author Contributions
Funding
Institutional Review Board Statement
Informed Consent Statement
Acknowledgments
Conflicts of Interest
References
- Elwakiel, M.; Hageman, J.A.; Wang, W.; Szeto, I.; Van Goudoever, J.B.; Hettinga, K.A.; Schols, H.A. Human Milk Oligosaccharides in Colostrum and Mature Milk of Chinese Mothers: Lewis Positive Secretor Subgroups. J. Agric. Food Chem. 2018, 66, 7036–7043. [Google Scholar] [CrossRef]
- Thurl, S.; Munzert, M.; Boehm, G.; Matthews, C.; Stahl, B. Systematic review of the concentrations of oligosaccharides in human milk. Nutr. Rev. 2017, 75, 920–933. [Google Scholar] [CrossRef] [Green Version]
- Bode, L. Human milk oligosaccharides: Every baby needs a sugar mama. Glycobiology 2012, 22, 1147–1162. [Google Scholar] [CrossRef] [PubMed] [Green Version]
- Urashima, T.; Hirabayashi, J.; Sato, S.; Kobata, A. Human Milk Oligosaccharides as Essential Tools for Basic and Application Studies on Galectins. Trends Glycosci. Glycotechnol. 2018, 30, SE51–SE65. [Google Scholar] [CrossRef] [Green Version]
- Stahl, B.; Thurl, S.; Henker, J.; Siegel, M.; Finke, B.; Sawatzki, G. Detection of four human milk groups with respect to Lewis-blood-group-dependent oligosaccharides by serologic and chromatographic analysis. Single Mol. Single Cell Seq. 2001, 501, 299–306. [Google Scholar]
- McGuire, M.K.; Meehan, C.L.; McGuire, M.A.; Williams, J.E.; Foster, J.; Sellen, D.W.; Kamau-Mbuthia, E.W.; Kamundia, E.W.; Mbugua, S.; Moore, S.E.; et al. What’s normal? Oligosaccharide concentrations and profiles in milk produced by healthy women vary geographically. Am. J. Clin. Nutr. 2017, 105, 1086–1100. [Google Scholar] [CrossRef] [PubMed]
- Bode, L. Human Milk Oligosaccharides: Next-Generation Functions and Questions. In Issues in Complementary Feeding; S. Karger AG: Basel, Switzerland, 2019; Volume 90, pp. 191–201. [Google Scholar]
- Erney, R.M.; Malone, W.T.; Skelding, M.B.; Marcon, A.A.; Kleman-Leyer, K.M.; O’Ryan, M.L.; Ruiz-Palacios, G.; Hilty, M.D.; Pickering, L.K.; Prieto, P.A. Variability of Human Milk Neutral Oligosaccharides in a Diverse Population. J. Pediatr. Gastroenterol. Nutr. 2000, 30, 181–192. [Google Scholar] [CrossRef]
- Aakko, J.; Kumar, H.; Rautava, S.; Wise, A.; Autran, C.; Bode, L.; Isolauri, E.; Salminen, S. Human milk oligosaccharide categories define the microbiota composition in human colostrum. Benef. Microbes 2017, 8, 563–567. [Google Scholar] [CrossRef]
- Hunt, K.M.; Preuss, J.; Nissan, C.; Davlin, C.A.; Williams, J.E.; Shafii, B.; Richardson, A.; McGuire, M.K.; Bode, L. Human Milk Oligosaccharides Promote the Growth of Staphylococci. Appl. Environ. Microbiol. 2012, 78, 4763–4770. [Google Scholar] [CrossRef] [Green Version]
- Williams, J.E.; Price, W.J.; Shafii, B.; Yahvah, K.M.; Bode, L.; McGuire, M.A.; McGuire, M.K. Relationships among Microbial Communities, Maternal Cells, Oligosaccharides, and Macronutrients in Human Milk. J. Hum. Lact. 2017, 33, 540–551. [Google Scholar] [CrossRef]
- Petschacher, B.; Nidetzky, B. Biotechnological production of fucosylated human milk oligosaccharides: Prokaryotic fucosyltransferases and their use in biocatalytic cascades or whole cell conversion systems. J. Biotechnol. 2016, 235, 61–83. [Google Scholar] [CrossRef] [PubMed]
- Bych, K.; Mikš, M.H.; Johanson, T.; Hederos, M.J.; Vigsnæs, L.K.; Becker, P. Production of HMOs using microbial hosts—from cell engineering to large scale production. Curr. Opin. Biotechnol. 2019, 56, 130–137. [Google Scholar] [CrossRef] [PubMed]
- Salverda, J.; Van Berlo, D.; Wallinga, A.; Van Acker, F.; Delsing, D. Safety assessment of biotechnologically produced 2′-Fucosyllactose, a novel food additive. Toxicol. Lett. 2018, 295, S148. [Google Scholar] [CrossRef]
- Phipps, K.R.; Baldwin, N.; Lynch, B.; Flaxmer, J.; Šoltésová, A.; Gilby, B.; Mikš, M.H.; Röhrig, C.H. Safety evaluation of a mixture of the human-identical milk oligosaccharides 2′-fucosyllactose and difucosyllactose. Food Chem. Toxicol. 2018, 120, 552–565. [Google Scholar] [CrossRef] [PubMed]
- Coulet, M.; Phothirath, P.; Allais, L.; Schilter, B. Pre-clinical safety evaluation of the synthetic human milk, nature-identical, oligosaccharide 2′-O-Fucosyllactose (2′FL). Regul. Toxicol. Pharmacol. 2014, 68, 59–69. [Google Scholar] [CrossRef]
- Parschat, K.; Oehme, A.; Leuschner, J.; Jennewein, S.; Parkot, J. A safety evaluation of mixed human milk oligosaccharides in rats. Food Chem. Toxicol. 2020, 136, 111118. [Google Scholar] [CrossRef] [PubMed]
- Reverri, E.J.; Devitt, A.A.; Kajzer, J.A.; Baggs, G.E.; Borschel, M.W. Review of the Clinical Experiences of Feeding Infants Formula Containing the Human Milk Oligosaccharide 2′-Fucosyllactose. Nutrients 2018, 10, 1346. [Google Scholar] [CrossRef] [Green Version]
- Marriage, B.J.; Buck, R.H.; Goehring, K.C.; Oliver, J.S.; Williams, J.A. Infants Fed a Lower Calorie Formula With 2′FL Show Growth and 2′FL Uptake Like Breast-Fed Infants. J. Pediatr. Gastroenterol. Nutr. 2015, 61, 649–658. [Google Scholar] [CrossRef] [Green Version]
- Kajzer, J.; Oliver, J.; Marriage, B. Gastrointestinal Tolerance of Formula Supplemented with Oligosaccharides. FASEB J. 2016, 30, 671–674. [Google Scholar] [CrossRef]
- Samuel, T.M.; Binia, A.; De Castro, C.A.; Thakkar, S.K.; Billeaud, C.; Agosti, M.; Al-Jashi, I.; Costeira, M.J.; Marchini, G.; Martínez-Costa, C.; et al. Impact of maternal characteristics on human milk oligosaccharide composition over the first 4 months of lactation in a cohort of healthy European mothers. Sci. Rep. 2019, 9, 11767. [Google Scholar] [CrossRef]
- Kunz, C.; Rudloff, S.; Baier, W.; Klein, N.; Strobel, S. Oligosaccharides in human milk: Structural, functional, and metabolic aspects. Annu. Rev. Nutr. 2000, 20, 699–722. [Google Scholar] [CrossRef] [PubMed]
- McJarrow, P.; Radwan, H.; Ma, L.; MacGibbon, A.K.; Hashim, M.; Hasan, H.; Obaid, R.S.; Naja, F.; Mohamed, H.J.J.; Al Ghazal, H.; et al. Human Milk Oligosaccharide, Phospholipid, and Ganglioside Concentrations in Breast Milk from United Arab Emirates Mothers: Results from the MISC Cohort. Nutrients 2019, 11, 2400. [Google Scholar] [CrossRef] [PubMed] [Green Version]
- Huang, X.; Zhu, B.; Jiang, T.; Yang, C.; Qiao, W.; Hou, J.; Han, Y.; Xiao, H.; Chen, L. Improved Simple Sample Pretreatment Method for Quantitation of Major Human Milk Oligosaccharides Using Ultrahigh Pressure Liquid Chromatography with Fluorescence Detection. J. Agric. Food Chem. 2019, 67, 12237–12244. [Google Scholar] [CrossRef]
- Ma, L.; McJarrow, P.; Mohamed, H.J.B.J.; Liu, X.; Welman, A.; Fong, B.Y. Lactational changes in the human milk oligosaccharide concentration in Chinese and Malaysian mothers’ milk. Int. Dairy J. 2018, 87, 1–10. [Google Scholar] [CrossRef]
- Nijman, R.M.; Liu, Y.; Bunyatratchata, A.; Smilowitz, J.T.; Stahl, B.; Barile, D. Characterization and Quantification of Oligosaccharides in Human Milk and Infant Formula. J. Agric. Food Chem. 2018, 66, 6851–6859. [Google Scholar] [CrossRef]
- Azad, M.B.; Robertson, B.; Atakora, F.; Becker, A.B.; Subbarao, P.; Moraes, T.J.; Mandhane, P.J.; Turvey, S.; Lefebvre, D.L.; Sears, M.R.; et al. Human Milk Oligosaccharide Concentrations Are Associated with Multiple Fixed and Modifiable Maternal Characteristics, Environmental Factors, and Feeding Practices. J. Nutr. 2018, 148, 1733–1742. [Google Scholar] [CrossRef]
- Gómez-Gallego, C.; Morales, J.M.; Monleón, D.; Du Toit, E.; Kumar, H.; Linderborg, K.M.; Zhang, Y.; Yang, B.; Isolauri, E.; Salminen, S.; et al. Human Breast Milk NMR Metabolomic Profile across Specific Geographical Locations and Its Association with the Milk Microbiota. Nutrients 2018, 10, 1355. [Google Scholar] [CrossRef] [Green Version]
- Xu, G.; Davis, J.C.; Goonatilleke, E.; Smilowitz, J.T.; German, J.B.; Lebrilla, C.B. Absolute Quantitation of Human Milk Oligosaccharides Reveals Phenotypic Variations during Lactation. J. Nutr. 2016, 147, 117–124. [Google Scholar] [CrossRef] [Green Version]
- Sprenger, N.; Lee, L.Y.; De Castro, C.A.; Steenhout, P.; Thakkar, S.K. Longitudinal change of selected human milk oligosaccharides and association to infants’ growth, an observatory, single center, longitudinal cohort study. PLoS ONE 2017, 12, e0171814. [Google Scholar] [CrossRef] [Green Version]
- Kunz, C.; Meyer, C.; Collado, M.C.; Geiger, L.; García-Mantrana, I.; Bertua-Ríos, B.; Martinez-Costa, C.; Borsch, C.; Rudloff, S. Influence of Gestational Age, Secretor, and Lewis Blood Group Status on the Oligosaccharide Content of Human Milk. J. Pediatr. Gastroenterol. Nutr. 2017, 64, 789–798. [Google Scholar] [CrossRef]
- Austin, S.; De Castro, C.A.; Bénet, T.; Hou, Y.; Sun, H.; Thakkar, S.K.; Vinyes-Pares, G.; Zhang, Y.; Wang, P. Temporal Change of the Content of 10 Oligosaccharides in the Milk of Chinese Urban Mothers. Nutrients 2016, 8, 346. [Google Scholar] [CrossRef] [PubMed] [Green Version]
- Olivares, M.; Albrecht, S.; De Palma, G.; Ferrer, M.D.; Castillejo, G.; Schols, H.A.; Sanz, Y. Human milk composition differs in healthy mothers and mothers with celiac disease. Eur. J. Nutr. 2015, 54, 119–128. [Google Scholar] [CrossRef] [PubMed]
- Spevacek, A.R.; Smilowitz, J.T.; Chin, E.L.; Underwood, A.M.; German, J.B.; Slupsky, C.M. Infant Maturity at Birth Reveals Minor Differences in the Maternal Milk Metabolome in the First Month of Lactation. J. Nutr. 2015, 145, 1698–1708. [Google Scholar] [CrossRef] [Green Version]
- Goehring, K.C.; Kennedy, A.D.; Prieto, P.A.; Buck, R.H. Direct Evidence for the Presence of Human Milk Oligosaccharides in the Circulation of Breastfed Infants. PLoS ONE 2014, 9, e101692. [Google Scholar] [CrossRef] [PubMed] [Green Version]
- Hong, Q.; Ruhaak, L.R.; Totten, S.M.; Smilowitz, J.T.; German, J.B.; Lebrilla, C.B. Label-Free Absolute Quantitation of Oligosaccharides Using Multiple Reaction Monitoring. Anal. Chem. 2014, 86, 2640–2647. [Google Scholar] [CrossRef] [PubMed]
- Van Niekerk, E.; Autran, C.A.; Nel, D.G.; Kirsten, G.F.; Blaauw, R.; Bode, L. Human Milk Oligosaccharides Differ between HIV-Infected and HIV-Uninfected Mothers and Are Related to Necrotizing Enterocolitis Incidence in Their Preterm Very-Low-Birth-Weight Infants. J. Nutr. 2014, 144, 1227–1233. [Google Scholar] [CrossRef] [PubMed] [Green Version]
- Bao, Y.; Chen, C.; Newburg, D.S. Quantification of neutral human milk oligosaccharides by graphitic carbon high-performance liquid chromatography with tandem mass spectrometry. Anal. Biochem. 2013, 433, 28–35. [Google Scholar] [CrossRef] [Green Version]
- Smilowitz, J.T.; O’Sullivan, A.; Barile, D.; German, J.B.; Lönnerdal, B.; Slupsky, C.M. The Human Milk Metabolome Reveals Diverse Oligosaccharide Profiles. J. Nutr. 2013, 143, 1709–1718. [Google Scholar] [CrossRef] [Green Version]
- Coppa, G.V.; Gabrielli, O.; Zampini, L.; Galeazzi, T.; Ficcadenti, A.; Padella, L.; Santoro, L.; Soldi, S.; Carlucci, A.; Bertino, E.; et al. Oligosaccharides in 4 Different Milk Groups, Bifidobacteria, and Ruminococcus obeum. J. Pediatr. Gastroenterol. Nutr. 2011, 53, 80–87. [Google Scholar] [CrossRef]
- Gabrielli, O.; Zampini, L.; Galeazzi, T.; Padella, L.; Santoro, L.; Peila, C.; Giuliani, F.; Bertino, E.; Fabris, C.; Coppa, G.V. Preterm Milk Oligosaccharides During the First Month of Lactation. Pediatrics 2011, 128, e1520–e1531. [Google Scholar] [CrossRef]
- Leo, F.; Asakuma, S.; Fukuda, K.; Senda, A.; Urashima, T. Determination of Sialyl and Neutral Oligosaccharide Levels in Transition and Mature Milks of Samoan Women, Using Anthranilic Derivatization Followed by Reverse Phase High Performance Liquid Chromatography. Biosci. Biotechnol. Biochem. 2010, 74, 298–303. [Google Scholar] [CrossRef]
- Thurl, S.; Munzert, M.; Henker, J.; Boehm, G.; Müller-Werner, B.; Jelinek, J.; Stahl, B. Variation of human milk oligosaccharides in relation to milk groups and lactational periods. Br. J. Nutr. 2010, 104, 1261–1271. [Google Scholar] [CrossRef] [PubMed] [Green Version]
- Asakuma, S.; Urashima, T.; Akahori, M.; Obayashi, H.; Nakamura, T.; Kimura, K.; Watanabe, Y.; Arai, I.; Sanai, Y. Variation of major neutral oligosaccharides levels in human colostrum. Eur. J. Clin. Nutr. 2007, 62, 488–494. [Google Scholar] [CrossRef] [PubMed] [Green Version]
- Asakuma, S.; Akahori, M.; Kimura, K.; Watanabe, Y.; Nakamura, T.; Tsunemi, M.; Arai, I.; Sanai, Y.; Urashima, T. Sialyl Oligosaccharides of Human Colostrum: Changes in Concentration during the First Three Days of Lactation. Biosci. Biotechnol. Biochem. 2007, 71, 1447–1451. [Google Scholar] [CrossRef] [Green Version]
- Bao, Y.; Zhu, L.; Newburg, D.S. Simultaneous quantification of sialyloligosaccharides from human milk by capillary electrophoresis. Anal. Biochem. 2007, 370, 206–214. [Google Scholar] [CrossRef] [PubMed] [Green Version]
- Martín-Sosa, S.; Martín, M.-J.; García-Pardo, L.-A.; Hueso, P. Sialyloligosaccharides in Human and Bovine Milk and in Infant Formulas: Variations with the Progression of Lactation. J. Dairy Sci. 2003, 86, 52–59. [Google Scholar] [CrossRef]
- Sumiyoshi, W.; Urashima, T.; Nakamura, T.; Arai, I.; Saito, T.; Tsumura, N.; Wang, B.; Brand-Miller, J.; Watanabe, Y.; Kimura, K. Determination of each neutral oligosaccharide in the milk of Japanese women during the course of lactation. Br. J. Nutr. 2003, 89, 61–69. [Google Scholar] [CrossRef] [PubMed]
- Chaturvedi, P.; Warren, C.D.; Altaye, M.; Morrow, A.L.; Ruiz-Palacios, G.; Pickering, L.K.; Newburg, D.S. Fucosylated human milk oligosaccharides vary between individuals and over the course of lactation. Glycobiology 2001, 11, 365–372. [Google Scholar] [CrossRef]
- Coppa, G.V.; Pierani, P.; Zampini, L.; Carloni, I.; Carlucci, A.; Gabrielli, O. Oligosaccharides in human milk during different phases of lactation. Acta Paediatr. Suppl. 1999, 88, 89–94. [Google Scholar] [CrossRef]
- Kunz, C.; Rudloff, S.; Schad, W.; Braun, D. Lactose-derived oligosaccharides in the milk of elephants: Comparison with human milk. Br. J. Nutr. 1999, 82, 391–399. [Google Scholar] [CrossRef] [Green Version]
- Nakhla, T.; Fu, D.; Zopf, D.; Brodsky, N.L.; Hurt, H. Neutral oligosaccharide content of preterm human milk. Br. J. Nutr. 1999, 82, 361–367. [Google Scholar] [CrossRef] [Green Version]
- Van Leeuwen, S.S. Challenges and Pitfalls in Human Milk Oligosaccharide Analysis. Nutrients 2019, 11, 2684. [Google Scholar] [CrossRef] [Green Version]
- Auer, F.; Jarvas, G.; Guttman, A. Recent advances in the analysis of human milk oligosaccharides by liquid phase separation methods. J. Chromatogr. B 2021, 1162, 122497. [Google Scholar] [CrossRef] [PubMed]
- Catenza, K.; Donkor, K. Recent approaches for the quantitative analysis of functional oligosaccharides used in the food industry: A review. Food Chem. 2021, 355, 129416. [Google Scholar] [CrossRef]
- Lefebvre, G.; Shevlyakova, M.; Charpagne, A.; Marquis, J.; Vogel, M.; Kirsten, T.; Kiess, W.; Austin, S.; Sprenger, N.; Binia, A. Time of lactation and maternal fucosyltransferase genetic polymorphisms determine the variability in human milk oligosaccharides. Front. Nutr. 2020, 7, 225. [Google Scholar] [CrossRef] [PubMed]
- Galeotti, F.; Coppa, G.V.; Zampini, L.; Maccari, F.; Galeazzi, T.; Padella, L.; Santoro, L.; Gabrielli, O.; Volpi, N. Capillary electrophoresis separation of human milk neutral and acidic oligosaccharides derivatized with 2-aminoacridone. Electrophoresis 2014, 35, 811–818. [Google Scholar] [CrossRef] [PubMed]
- Urashima, T.; Asakuma, S.; Leo, F.; Fukuda, K.; Messer, M.; Oftedal, O.T. The Predominance of Type I Oligosaccharides Is a Feature Specific to Human Breast Milk. Adv. Nutr. 2012, 3, 473S–482S. [Google Scholar] [CrossRef] [Green Version]
- Sakaguchi, Y.; Hayama, T.; Yoshida, H.; Itoyama, M.; Todoroki, K.; Yamaguchi, M.; Nohta, H. Liquid chromatography/tandem mass spectrometry with fluorous derivatization method for selective analysis of sialyl oligosaccharides. Rapid Commun. Mass Spectrom. 2014, 28, 2481–2489. [Google Scholar] [CrossRef]
- Austin, S.; Cuany, D.; Michaud, J.; Diehl, B.; Casado, B. Determination of 2′-Fucosyllactose and Lacto-N-neotetraose in Infant Formula. Molecules 2018, 23, 2650. [Google Scholar] [CrossRef] [Green Version]
- Kobata, A. Structures and application of oligosaccharides in human milk. Proc. Jpn. Acad. Ser. B Phys. Biol. Sci. 2010, 86, 731–747. [Google Scholar] [CrossRef] [PubMed] [Green Version]
- Ewald, D.R.; Sumner, S.C. Blood type biochemistry and human disease. Wiley Interdiscip. Rev. Syst. Biol. Med. 2016, 8, 517–535. [Google Scholar] [CrossRef] [Green Version]
- Thurl, S.; Henker, J.; Siegel, M.; Tovar, K.; Sawatzki, G. Detection of four human milk groups with respect to Lewis blood group dependent oligosaccharides. Glycoconj. J. 1997, 14, 795–799. [Google Scholar] [CrossRef]
- Schenkel-Brunner, H. Blood Group Antigens in Comprehensive Glycoscience; Kamerling, J.P., Boons, G.J., Lee, C.Y., Suzuki, A., Taniguchi, N., Voragen, A.G.J., Eds.; Elsevier: Amsterdam, The Netherlands, 2007; Volume 3, pp. 343–372. [Google Scholar]
- Sakwinska, O.; Moine, D.; Delley, M.; Combremont, S.; Rezzonico, E.; Descombes, P.; Vinyes-Pares, G.; Zhang, Y.; Wang, P.; Thakkar, S.K. Microbiota in Breast Milk of Chinese Lactating Mothers. PLoS ONE 2016, 11, e0160856. [Google Scholar] [CrossRef] [Green Version]
- Moossavi, S.; Atakora, F.; Miliku, K.; Sepehri, S.; Robertson, B.; Duan, Q.L.; Becker, A.B.; Mandhane, P.J.; Turvey, S.; Moraes, T.J.; et al. Integrated Analysis of Human Milk Microbiota With Oligosaccharides and Fatty Acids in the CHILD Cohort. Front. Nutr. 2019, 6. [Google Scholar] [CrossRef] [PubMed] [Green Version]
- Biddulph, C.; Holmes, M.; Kuballa, A.; Davies, P.; Koorts, P.; Carter, R.; Maher, J. Human Milk Oligosaccharide Profiles and Associations with Maternal Nutritional Factors: A Scoping Review. Nutrients 2021, 13, 965. [Google Scholar] [CrossRef]
- Sprenger, N.; Binia, A.; Austin, S. Human Milk Oligosaccharides: Factors Affecting Their Composition and Their Physio-logical Significance. Nestle Nutr. Inst. Workshop Ser. 2019, 90, 43–56. [Google Scholar]
- Akkerman, R.; Faas, M.M.; De Vos, P. Non-digestible carbohydrates in infant formula as substitution for human milk oligosaccharide functions: Effects on microbiota and gut maturation. Crit. Rev. Food Sci. Nutr. 2019, 59, 1486–1497. [Google Scholar] [CrossRef]
- Kunz, C. Historical Aspects of Human Milk Oligosaccharides. Adv. Nutr. 2012, 3, 430S–439S. [Google Scholar] [CrossRef] [PubMed] [Green Version]
- Locascio, R.G.; Ninonuevo, M.R.; Freeman, S.L.; Sela, D.A.; Grimm, R.; Lebrilla, C.B.; Mills, D.A.; German, J.B. Glycoprofiling of Bifidobacterial Consumption of Human Milk Oligosaccharides Demonstrates Strain Specific, Preferential Consumption of Small Chain Glycans Secreted in Early Human Lactation. J. Agric. Food Chem. 2007, 55, 8914–8919. [Google Scholar] [CrossRef] [PubMed]
- Smith-Brown, P.; Morrison, M.; Krause, L.; Davies, P.S.W. Mothers Secretor Status Affects Development of Childrens Microbiota Composition and Function: A Pilot Study. PLoS ONE 2016, 11, e0161211. [Google Scholar] [CrossRef]
- Asakuma, S.; Hatakeyama, E.; Urashima, T.; Yoshida, E.; Katayama, T.; Yamamoto, K.; Kumagai, H.; Ashida, H.; Hirose, J.; Kitaoka, M. Physiology of Consumption of Human Milk Oligosaccharides by Infant Gut-associated Bifidobacteria. J. Biol. Chem. 2011, 286, 34583–34592. [Google Scholar] [CrossRef] [Green Version]
- Morrow, A.L.; Ruiz-Palacios, G.M.; Altaye, M.; Jiang, X.; Guerrero, M.L.; Meinzen-Derr, J.K.; Farkas, T.; Chaturvedi, P.; Pickering, L.K.; Newburg, D.S. Human Milk Oligosaccharide Blood Group Epitopes and Innate Immune Protection against Campylobacter and Calicivirus Diarrhea in Breastfed Infants. Adv. Exp. Med. Biol. 2004, 554, 443–446. [Google Scholar] [CrossRef]
- Marcobal, A.; Barboza, M.; Froehlich, J.W.; Block, D.E.; German, J.B.; Lebrilla, C.B.; Mills, D.A. Consumption of Human Milk Oligosaccharides by Gut-Related Microbes. J. Agric. Food Chem. 2010, 58, 5334–5340. [Google Scholar] [CrossRef] [PubMed] [Green Version]
- Plaza-Díaz, J.; Fontana, L.; Gil, A. Human Milk Oligosaccharides and Immune System Development. Nutrients 2018, 10, 1038. [Google Scholar] [CrossRef] [Green Version]
- Donovan, S.M.; Comstock, S.S. Human Milk Oligosaccharides Influence Neonatal Mucosal and Systemic Immunity. Ann. Nutr. Metab. 2016, 69, 41–51. [Google Scholar] [CrossRef]
- Triantis, V.; Bode, L.; van Neerven, R. Immunological Effects of Human Milk Oligosaccharides. Front. Pediatr. 2018, 6, 190. [Google Scholar] [CrossRef]
- Ruiz-Palacios, G.M.; Cervantes, L.E.; Ramos, P.; Chavez-Munguia, B.; Newburg, D.S. Campylobacter jejuni Binds Intestinal H(O) Antigen (Fucα1, 2Galβ1, 4GlcNAc), and Fucosyloligosaccharides of Human Milk Inhibit Its Binding and Infection. J. Biol. Chem. 2003, 278, 14112–14120. [Google Scholar] [CrossRef] [Green Version]
- Yu, Z.-T.; Nanthakumar, N.N.; Newburg, D.S. The Human Milk Oligosaccharide 2′-Fucosyllactose Quenches Campylobacter jejuni–Induced Inflammation in Human Epithelial Cells HEp-2 and HT-29 and in Mouse Intestinal Mucosa. J. Nutr. 2016, 146, 1980–1990. [Google Scholar] [CrossRef] [PubMed]
- Le Doare, K.; Holder, B.; Bassett, A.; Pannaraj, P.S. Mother’s Milk: A Purposeful Contribution to the Development of the Infant Microbiota and Immunity. Front. Immunol. 2018, 9, 361. [Google Scholar] [CrossRef] [Green Version]
- Ma, J.; Li, Z.; Zhang, W.; Zhang, C.; Zhang, Y.; Mei, H.; Zhuo, N.; Wang, H.; Wang, L.; Wu, D. Comparison of gut mi-crobiota in exclusively breast-fed and formula-fed babies: A study of 91 term infants. Sci. Rep. 2020, 10, 1–11. [Google Scholar] [CrossRef]
- Akay, H.K.; Tokman, H.B.; Hatipoglu, N.; Hatipoglu, H.; Siraneci, R.; Demirci, M.; Borsa, B.A.; Yuksel, P.; Karakullukcu, A.; Kangaba, A.A.; et al. The relationship between bifidobacteria and allergic asthma and/or allergic dermatitis: A prospective study of 0–3 years-old children in Turkey. Anaerobe 2014, 28, 98–103. [Google Scholar] [CrossRef] [PubMed]
- Lewis, Z.T.; Totten, S.M.; Smilowitz, J.T.; Popovic, M.; Parker, E.; Lemay, D.; Van Tassell, M.L.; Miller, M.J.; Jin, Y.-S.; German, J.B.; et al. Maternal fucosyltransferase 2 status affects the gut bifidobacterial communities of breastfed infants. Microbiome 2015, 3, 1–21. [Google Scholar] [CrossRef] [Green Version]
- Urashima, T.; Taufik, E.; Fukuda, K.; Asakuma, S. Recent Advances in Studies on Milk Oligosaccharides of Cows and Other Domestic Farm Animals. Biosci. Biotechnol. Biochem. 2013, 77, 455–466. [Google Scholar] [CrossRef] [Green Version]
- György, P.; Norris, R.F.; Rose, C.S. Bifidus factor. I. A variant of Lactobacillus bifidus requiring a special growth factor. Arch. Biochem. Biophys. 1954, 48, 193–201. [Google Scholar] [CrossRef]
- Van Berlo, D.; Wallinga, A.E.; Van Acker, F.A.; Delsing, D.J. Safety assessment of biotechnologically produced 2′-Fucosyllactose, a novel food additive. Food Chem. Toxicol. 2018, 118, 84–93. [Google Scholar] [CrossRef] [PubMed]
- Baumgärtner, F.; Conrad, J.; Sprenger, G.A.; Albermann, C. Synthesis of the Human Milk Oligosaccharide Lacto-N-Tetraose in Metabolically Engineered, Plasmid-Free E. coli. ChemBioChem 2014, 15, 1896–1900. [Google Scholar] [CrossRef] [PubMed]
- Zhang, W.; Liu, Z.; Gong, M.; Li, N.; Lv, X.; Dong, X.; Liu, Y.; Li, J.; Du, G.; Liu, L. Metabolic engineering of Escherichia coli for the production of Lacto-N-neotetraose (LNnT). Syst. Microbiol. Biomanufactur. 2021, 1, 291–301. [Google Scholar] [CrossRef]
- Pitt, J.; Chan, M.; Gibson, C.; Hasselwander, O.; Lim, A.; Mukerji, P.; Mukherjea, R.; Myhre, A.; Sarela, P.; Tenning, P.; et al. Safety assessment of the biotechnologically produced human-identical milk oligosaccharide 3-Fucosyllactose (3-FL). Food Chem. Toxicol. 2019, 134, 110818. [Google Scholar] [CrossRef]
- Zeng, J.; Hu, Y.; Jia, T.; Zhang, R.; Su, T.; Sun, J.; Gao, H.; Li, G.; Cao, M.; Song, M. Chemoenzymatic synthesis of sialylated lactuloses and their inhibitory effects on Staphylococcus aureus. PLoS ONE 2018, 13, e0199334. [Google Scholar] [CrossRef] [Green Version]
- EFSA Panel on Dietetic Products Nutrition Allergies. Safety of 2′-O-fucosyllactose as a novel food ingredient pursuant to Regu-lation (EC) No 258/97. EFSA J. 2015, 13, 4184. [Google Scholar]
- EFSA Panel on Dietetic Products Nutrition Allergies; Turck, D.; Castenmiller, J.; De Henauw, S.; Hirsch-Ernst, K.I.; Kearney, J.; Maciuk, A.; Mangelsdorf, I.; McArdle, H.J. Safety of lacto-N-tetraose (LNT) as a novel food pursuant to Regulation (EU) 2015/2283. EFSA J. 2019, 17, e05907. [Google Scholar]
- EFSA Panel on Dietetic Products Nutrition Allergies; Turck, D.; Castenmiller, J.; De Henauw, S.; Hirsch-Ernst, K.I.; Kearney, J.; Maciuk, A.; Mangelsdorf, I.; McArdle, H.J.; Naska, A.; et al. Safety of 6′-Sialyllactose (6′-SL) sodium salt as a novel food pursuant to Regulation (EU) 2015/2283. EFSA J. 2020, 18, e06097. [Google Scholar]
- EFSA Panel on Dietetic Products Nutrition Allergies; Turck, D.; Castenmiller, J.; De Henauw, S.; Hirsch-Ernst, K.I.; Kearney, J.; Maciuk, A.; Mangelsdorf, I.; McArdle, H.J.; Naska, A.; et al. Safety of 2′-fucosyllactose/difucosyllactose mixture as a novel food pursuant to Regulation (EU) 2015/2283. EFSA J. 2019, 17, e05717. [Google Scholar] [PubMed] [Green Version]
- Goehring, K.C.; Marriage, B.J.; Oliver, J.S.; Wilder, J.; Barrett, E.G.; Buck, R.H. Similar to Those Who Are Breastfed, Infants Fed a Formula Containing 2′-Fucosyllactose Have Lower Inflammatory Cytokines in a Randomized Controlled Trial. J. Nutr. 2016, 146, 2559–2566. [Google Scholar] [CrossRef] [PubMed] [Green Version]
- Puccio, G.; Alliet, P.; Cajozzo, C.; Janssens, E.; Corsello, G.; Sprenger, N.; Wernimont, S.; Egli, D.; Gosoniu, L.; Steenhout, P. Effects of Infant Formula with Human Milk Oligosaccharides on Growth and Morbidity: A randomized multicenter trial. J. Pediatr. Gastroenterol. Nutr. 2017, 64, 624–631. [Google Scholar] [CrossRef] [Green Version]
- Vandenplas, Y.; Berger, B.; Carnielli, V.P.; Ksiazyk, J.; Lagström, H.; Luna, M.S.; Migacheva, N.; Mosselmans, J.-M.; Picaud, J.-C.; Possner, M.; et al. Human Milk Oligosaccharides: 2′-Fucosyllactose (2′-FL) and Lacto-N-Neotetraose (LNnT) in Infant Formula. Nutrients 2018, 10, 1161. [Google Scholar] [CrossRef] [Green Version]

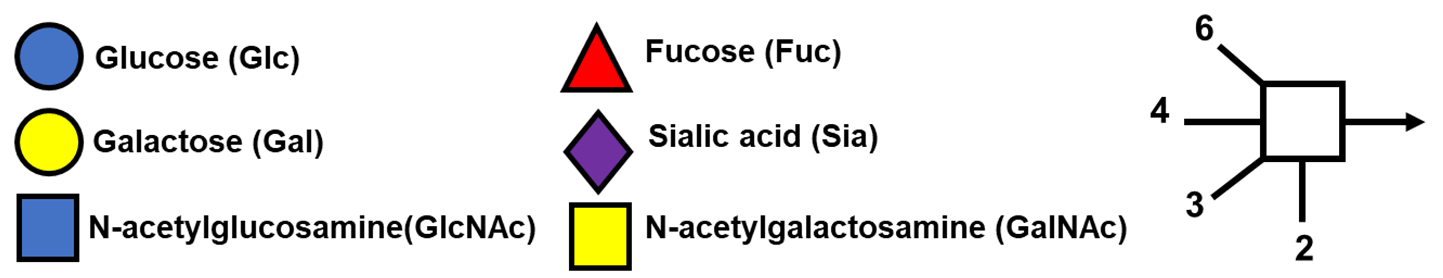
| Abbreviation | Name | Structure (Monomers and Linkages) | |
|---|---|---|---|
 | |||
| Neutral fucosylated | |||
| 2′-FL | 2′-fucosyllactose | Fucα1,2Galβ1,4Glc |  |
| 3-FL | 3-fucosyllactose | Galβ1,4(Fucα1,3)Glc |  |
| DFLac/LDFT | Lactodifucotetraose | Fucα1,2Galβ1,4(Fucα1,3)Glc |  |
| DFLNT | Difucosyllacto-N-tetrose | Fuc(α1-4)[Gal(β1-3)]GlcNAc(β1-3)Gal(β1-4)[Fuc(α1-3)]Glc | 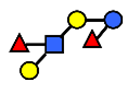 |
| DFLNH I | Difucosyllacto-N-hexaose I | Galβ1,4(Fucα1,3)GlcNAcβ1,6(Fucα1,2Galβ1,3GlcNAcβ1,3)Galβ1,4Glc | 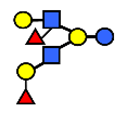 |
| DFLNH II | Difucosyllacto-N-hexaose II | Galβ1,4(Fucα1,3)GlcNAcβ1,6(Galβ1,3(Fucα1,4)GlcNAcβ1,3) Gal β1,4Glc | 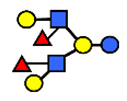 |
| LNDFH I | Lacto-N-difucohexaose I | Fucα1,2Galβ1,3(Fucα1,4)GlcNAcβ1,3Galβ1,4Glc | 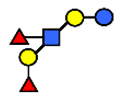 |
| LNDFH II | Lacto-N-difucohexaose II | Galβ1,3(Fucα1,4)GlcNAcβ1,3Galβ1,4(Fucα1,3)Glc | 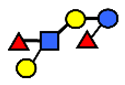 |
| LNnDFH | Lacto-N-neodifucohexaose | Galβ1,4(Fucα1,3)GlcNAcβ1,3Galβ1,4(Fucα1,3)Glc | 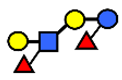 |
| LNFP I | Lacto-N-fucopentaose I | Fucα1,2Galβ1,3GlcNAcβ1,3Galβ1,4Glc | 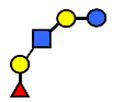 |
| LNFP II | Lacto-N-fucopentaose II | Galβ1,3(Fucα1,4)GlcNAcβ1,3Galβ1,4Glc | 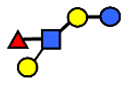 |
| LNFP III/LNnFP II | Lacto-N-fucopentaose III Lacto-N-fuconeopentaose II | Galβ1,4(Fucα1,3)GlcNAcβ1,3Galβ1,4Glc | 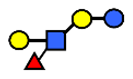 |
| LNFP V | Lacto-N-fuconeopentaose V | Galβ1,3GlcNAcβ1,3Galβ1,4(Fucα1,3)Glc | 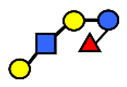 |
| LNnFP I | Lacto-N-neofucopentaose I | (Fucα1,2)Galβ1,4GlcNAcβ1,3Galβ1,4Glc | 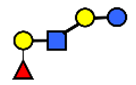 |
| LNnFP V | Lacto-N-neofucopentaose V | Galβ1,4GlcNAcβ1,3Galβ1,4(Fucα1,3)Glc |  |
| Neutral non-fucosylated | |||
| 3′-GOS/3′-GL | 3′-galactosyllactose | Galβ1,3Galβ1,4Glc | 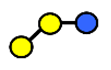 |
| 6′-GOS/6′-GL | 6′-galactosyllactose | Galβ1,6Galβ1,4Glc |  |
| LNT | Lacto-N-tetraose | Galβ1,3GlcNAcβ1,3Galβ1,4Glc | 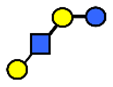 |
| LNnT | Lacto-N-neotetraose | Galβ1,4GlcNAcβ1,3Galβ1,4Glc |  |
| LNH | Lacto-N-hexaose | Galβ1,3GlcNAcβ1,3(Galβ1,4GlcNAcβ1,6)Galβ1,4Glc | 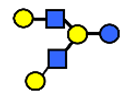 |
| LNnH | Lacto-N-neohexaose | Galβ1,4GlcNAcβ1,3(Galβ1,4GlcNAcβ1,6)Galβ1,4Glc | 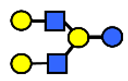 |
| MFLNH I/2-FLNH | Monofucosyllacto-N-hexaose I | Fucα1,2Galβ1,3GlcNAcβ1,3(Galβ1,4GlcNAcβ1,6)Galβ1,4Glc |  |
| MFLNH III/3-FLNH | Monofucosyllacto-N-hexaose III | Galβ1,3GlcNAcβ1,3(Galβ1,4(Fucα1,3)GlcNAcβ1,6)Galβ1,4Glc |  |
| Acidic | |||
| 3′SL | α2,3-Sialyllactose | NeuAcα2,3Galβ1,4Glc |  |
| 6′SL | α2,6-Sialyllactose | NeuAcα2,6Galβ1,4Glc |  |
| 3′S3FL | 3′-sialyl-3-fucosyllactose | NeuAcα2,3Galβ1,4(Fucα1,3)Glc | 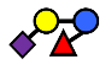 |
| 6′SLN | 6′-sialyl lactosamine | NeuAcα2,6Galβ1,4GlcNAc |  |
| LST a | α2,3-Sialyllacto-N-tetraose a | NeuAcα2,3Galβ1,3GlcNAcβ1,3Galβ1,4Glc | 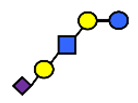 |
| LST b | α2,6-Sialyllacto-N-tetraose b | Galβ1,3(NeuAcα2,6)GlcNAcβ1,3Galβ1,4Glc | 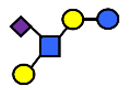 |
| LST c | α2,6-Sialyllacto-N-tetraose c | NeuAcα2,6Galβ1,4GlcNAcβ1,3Galβ1,4Glc | 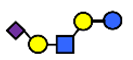 |
| DSLNT | Disialyllacto-N-tetraose | NeuAcα2,3Galβ1,3(NeuAcα2,6)GlcNAcβ1,3Galβ1,4Glc | 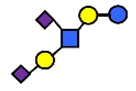 |
| S-LNnH II | α2,6-Sialyllacto-N-neohexaose | NeuAcα2,6Galβ1,4GlcNAcβ1,3(Galβ1,4GlcNAcβ1,6)Galβ1,4Glc |  |
| A-Tetra | A-tetrasaccharide | GalNAcα1,3(Fucα1,2)Galβ1,4Glc |  |
| SLNFP I | Sialyllacto-N-fucopentaose I | Fucα1,2Galβ1,3(NeuAcα2,6)GlcNAcβ1,3Galβ1,4Glc |  |
| SLNFP II | Sialyllacto-N-fucopentaose II | NeuAcα2,3Galβ1,3(Fucα1,4)GlcNAcβ1,3Galβ1,4Glc |  |
| Reference | Mothers | Quantification | |||
|---|---|---|---|---|---|
| Year of Publication | Country of Origin | Secretor Status | Number of Mothers | Methodology | |
| Studies Published (Post-2015) | |||||
| 2019 | [21] | Europe (Spain, France, Italy, Norway, Portugal, Romania and Sweden) | +/- | 9, 83, 13, 10, 95, 40, 40, respectively | UHPLC-FL |
| 2019 | [23] | UAE | +/- | 40 | HPLC-MRM-MS |
| 2019 | [24] | China (Beijing) | nr | 33 | UHPLC-FL |
| 2018 | [25] | China (Guangzhou), Malaysia | nr | 20 26 | HPLC-MRM-MS |
| 2018 | [26] | USA | nr | 10 | HPAEC-PAD |
| 2018 | [1] | China (Hohhot) The Netherlands | +/- | 30 28 | CE-LIF |
| 2018 | [27] | Canada | +/- | 427 | HPLC-FL |
| 2018 | [28] | China, South Africa, Finland, and Spain | nr | 20, 19, 20, 20, respectively | NMR |
| 2017 | [29] | Malawi USA | +/- | 88 45 | UHPLC/QqQ-MS |
| 2017 | [30] | Singapore | nr | 50 | HPAEC-PAD |
| 2017 | [31] | Spain (Valencia) | +/- | 14 | HPAEC-PAD |
| 2016 | [32] | China (Beijing, Suzhou, Guangzhou) | nr | 446 | UHPLC-FL |
| Studies reviewed by Thurl et al. [2] 1 | nr | ||||
| 2015 | [33] | The Netherlands | +/- | 7/5 | CE-FL |
| 2015 | [34] | USA | nr | 15/13 | NMR |
| 2014 | [35] | USA | +/- | 13/4 | LC-MS |
| 2014 | [36] | USA | +/- | 10/10 | LC-MS |
| 2014 | [37] | South Africa | +/- | 20/21 | HPLC-UV |
| 2013 | [38] | USA | + | 4 | LC-MS |
| 2013 | [39] | USA | +/- | 40/12 | NMR |
| 2011 | [40] | Italy | +/- | 16/23 | HPAEC-PAD |
| 2011 | [41] | Italy | +/- | 42/21 | HPAEC-PAD |
| 2010 | [42] | Samoa | nr | 16 | HPLC-UV |
| 2010 | [43] | Germany | + | 21 | HPAEC-PAD |
| 2008 | [44] | Japan | + | 12 | HPLC-UV |
| 2007 | [45] | Japan | nr | 20 | HPLC-UV |
| 2007 | [46] | USA | nr | 8 | CE-UV |
| 2003 | [47] | Spain | nr | 12 | HPLC-UV |
| 2003 | [48] | Japan | nr | 20 | HPLC-UV |
| 2001 | [49] | Mexico | + | 11 | HPLC-UV |
| 2000 | [8] | Various world regions | + | 197 | HPAEC-PAD |
| 1999 | [50] | Italy | + | 18 | HPAEC-PAD |
| 1999 | [51] | Germany | +/- | 2/2 | HPAEC-PAD |
| 1999 | [52] | USA | + | 12 | HPAEC-PAD |
| Reference | # HMOs/Monosaccharide Compositions | Mothers | Colostrum | Transition | Mature | |||||
|---|---|---|---|---|---|---|---|---|---|---|
| Measured | Country of Origin | (Day 1–7) | (Day 8–15) | 1 Month | 2 Months | 3 Months | 4 Months | 5 Months | 6 Months | |
| Samuel, 2019 [21] | 20 | Europe (Spain, France, Italy, Norway, Portugal, Romania and Sweden) | 12.5 ± 7.2 | 11.0 ± 6.0 | 9.6 ± 5.1 | 7.6 ± 4.1 | 6.9 ± 3.7 | 6.3 ± 3.4 | ||
| McJarrow, 2019 [23] | 12 | UAE | nr | 8.2 ± 2.4 | nr | nr | nr | nr | nr | 3.9 ± 1.4 |
| Huang, 2019 [24] | 15 | China (Beijing) | 9.6 ± 6.1 | 8.4 ± 5.0 | 6.6 ± 4.4 | nr | nr | nr | nr | nr |
| Austin, 2016 [32] 1 | 10 | China (Beijing, Suzhou, Guangzhou) | 5.0 ± 3.6~4.2 ± 2.7 | 3.5 ± 2.3 | 3.1 ± 2.0 | 3.0 ± 2.0 | ||||
| Ma, 2018 [25] | 12 | China (Guangzhou) | nr | 8.5 ± 4.4 | 6.1 ± 3.6 | 5.2 ± 3.1 | 5.4 ± 3.7 | 5.2 ± 3.2 | nr | 4.7 ± 2.9 |
| Ma, 2018 [25] | 12 | Malaysia | 12.5 ± 8.7 | nr | nr | 6.1 ± 3.3 | nr | nr | nr | 5.1 ± 3.2 |
| Nijman, 2018 [26] | 9 | USA | 9.1 ± 0.2 | nr | nr | 6.4 ± 0.29 | nr | nr | nr | nr |
| Elwakiel, 2018 [1] | 14 | China (Hohhot) | 22.4 ± 4.6 | 18.9 ± 3.9 | 14.6 ± 4.3 | 12.4 ± 3.8 | 10.0 ± 3.7 | nr | 7.8 ± 3.0 | nr |
| Elwakiel, 2018 [1] | 14 | The Netherlands | nr | nr | 14.7 ± 5.4 | nr | nr | nr | nr | nr |
| Azad, 2018 [27] | 19 | Canada (Asian and 73% Caucasian) | nr | nr | nr | nr | nr | 10.3 ± 6.7 | nr | nr |
| Xu, 2017 [29] | 32 | Malawi | nr | nr | nr | nr | nr | nr | nr | 6.2 ± 2.0 |
| Xu, 2017 [29] | 32 | USA | nr | 19.6 ± 2.9 | 16.3 ± 2.7 | nr | 10.4 ± 1.4 | 8.6 ± 1.3 | nr | nr |
| Kunz, 2017 [31] | 16 | Spain (Valencia) | 7.5 ± 4.1 | 9.1 ± 3.0 | 8.2 ± 2.8 | nr | nr | nr | nr | nr |
| Thurl, 2017 [2] 2 | 33 | Various | 16.3 ± 12.2 | 17.4 ± 12.2 | 15.1 ± 9.3 | 15.1 ± 12.1 | nr | 13.4 ± 11.5 | nr | nr |
| Spevacek, 2015 [34] | 15 | USA | 13.0 ± 3.9 | 10.7 ± 2.1 | 9.2 ± 2.0 | nr | nr | nr | nr | nr |
| Leo, 2010 [42] 3 | 17 | Samoa | nr | 15.6 ± 8.1 | 10.9 ± 9.7 | nr | ||||
| Thurl, 2010 [43] 3,4 | 20 | Germany | 11.7 | 11.9 | 10.7 | 8.4 | 8.0 | nr | nr | nr |
| Asakuma, 2007 and 2008 [44,45] 2 | 9, 10 | Japan | 10.2 ± 5.5 | nr | nr | nr | nr | nr | nr | nr |
| (a) Colostrum | Day 1 | Day 2 | Day 3 | Day 0–4 | Day 0–5 | Day 1–7 | |||||
|---|---|---|---|---|---|---|---|---|---|---|---|
| Reference Year | [44,45] 2007 and 2008 | [44,45] 2007 and 2008 | [25] 2018 | [21] 2019 | [44,45] 2007 and 2008 | [43] 2010 | [26] 2018 | [2] 2017 | [34] 2015 | [31] 2017 | [24] 2019 |
| Country | Japan | Japan | Malaysia /Chinese | 7 European countries | Japan | Germany | USA | Various | USA | Spain | China |
| 2′-FL | 2490 ± 1220 | 2010 ± 1070 | 2249 ± 1764 | 3691 ± 1941 | 1580 ± 730 | 4130 | 3750 ± 100 | 3230 ± 610 | 2652 ± 2222 | 2210 (0–4690) | 1705 ± 1101 |
| 3-FL | 260 ± 140 | 280 ± 260 | 429 ± 419 | 422 ± 453 | 200 ± 130 | 240 | nr | 240 ± 100 | 444 ± 513 | 750 (0–1190) | 353 ± 305 |
| LNDFH I | 1270 ± 540 | 1870 ± 1550 | nr | 1232 ± 519 | 1410 ± 660 | 1120 | 2100 ± 60 | 860 ± 240 | nr | 798 ± 570 | |
| LNDFH II | 17 ± 18 | 20 ± 25 | nr | nr | 19 ± 28 | 100 | nr | 80 ± 90 | nr | 60 (10–250) | nr |
| LDFT | 420 ± 420 | 280 ± 300 | nr | 607 ± 558 | 190 ± 140 | 490 | 360 ± 10 | 520 ± 270 | 159 ± 152 | 180 (0–400) | nr |
| LNT | 890 ± 430 | 1440 ± 700 | 2393 ± 2192 | 912 ± 802 | 1450 ± 730 | nr | 480 ± 0 | 660 ± 410 | 1054 ± 984 | 840 (620–1600) | 1123 ± 776 |
| LNnT | 400 ± 90 | 540 ± 140 | 1420 ± 1032 | 307 ± 132 | 420 ± 150 | nr | nr | 770 ± 830 | 255± 113 | 310 (140–450) | 616 ± 239 |
| LNFP I | 1470 ± 1010 | 2080 ± 1670 | 3563 ± 1920 2 | 1928 ± 903 | 1670 ± 1030 | 2000 | 1810 ± 30 | 1570 ± 300 | 1409 ± 1153 | 950 (0–1300) | 1509 ± 1032 |
| LNFP II | 380 ± 2401 1 | 450 ± 260 1 | 422 ± 518 | 420 ± 330 | 140 | nr | 220 ± 190 | 401 ± 461 | 150 (0–1510) | 365 ± 409 | |
| LNFP III | 445 ± 166 | 340 | nr | 260 ± 290 | 359 ± 188 | 380 (260–560) | nr | ||||
| LNFP V | nr | nr | 108 ±103 | nr | nr | nr | 3 ± 1223 | nr | nr | 60 ± 75 | |
| 3′-SL | 362± 103 | 269 ± 70 | 222 ± 83 | 254 ± 90 | 259 ± 80 | 350 | 110 ± 10 | 220 ± 140 | 228 ± 63 | 230 (160–330) | 228 ± 78 |
| 6′-SL | 342 ± 120 | 371 ± 115 | 651 ± 411 | 543 ± 168 | 397 ± 86 | 1310 | 340 ± 30 | 760 ± 580 | 520 ± 152 | 680 (500–800) | 1175 ± 495 |
| LST a | 107 ± 85 | 155 ± 118 | 160 ± 111 | nr | 162 ± 111 | 60 | nr | 120 ± 80 | nr | 150 (110–240) | nr |
| LST b | 68 ± 22 | 64 ± 25 | 79 ± 40 | 61 ± 27 | 50 | nr | 110 ± 160 | nr | 40 (20–50) | nr | |
| LST c | 659 ± 297 | 707 ± 261 | 1326 ± 641 | 497 ± 218 | 693 ± 243 | 480 | nr | 480 ± 150 | nr | 380 (290–440) | 743 ± 255 |
| DSLNT | 480 ± 126 | 447± 110 | nr | 405 ± 178 | 459 ± 151 | 290 | nr | 550 ± 510 | nr | 380 (240–540) | 804 ± 721 |
| SLNFP I | 76 ± 55 | 80 ± 37 | nr | nr | 78 ± 65 | nr | nr | nr | nr | nr | nr |
| 3′S3FL | 148 ± 44 | 156 ± 64 | 23.4 ± 32.2 | nr | 165 ± 44 | nr | nr | nr | nr | nr | nr |
| (b) Transitional | Day 5–15 | |||||||||
|---|---|---|---|---|---|---|---|---|---|---|
| Reference Year | [43] 2010 | [43] 2010 | [42] 2010 | [34] 2015 | [32] 2016 | [2] 2017 | [31] 2017 | [25] 2018 | [23] 2019 | [24] 2019 |
| Country | Germany (8 day) | Germany (15 day) | Samoa (5–10 day) | USA (14 day) | China (5–11 day) | Various (5–10 day) | Spain (8–15 day) | China (14 day) | UAE (5–15 day) | China (8–15 day) |
| 2′-FL | 3370 | 3040 | 220 ± 370 | 2061 ± 1416 | 2000 ± 1400 | 3050 ± 710 | 2340 (0–3860) | 1281 ± 1050 | 2021 ± 1776 | 1507 ± 898 |
| 3-FL | 260 | 380 | 1670 ± 820 | 933 ± 567 | 490 ± 600 | 270 ± 120 | 950 (0–1430) | 543 ± 501 | 581 ± 868 | 476 ± 397 |
| LNDFH I | 1300 | 1460 | 750 ± 680 | 690 ± 290 | 777 ± 548 | |||||
| LNDFH II | 170 | 230 | 860 ± 440 | 160 ± 120 | 120 (40–200) | |||||
| LDFT | 330 | 480 | 70± 60 | 178 ± 184 | 450 ± 330 | 220 (0–340) | ||||
| LNT | 3900 ± 1860 | 870 ± 623 | 880 ± 530 | 920 ± 650 | 1000 (770–2570) | 1979 ± 738 | 1429 ± 693 | 1207 ± 599 | ||
| LNnT | 460 ± 360 | 149 ± 71 | 180 ± 85 | 1080 ± 1220 | 200 (0–1260) | 1033 ± 445 | 765 ± 350 | 329 ± 153 | ||
| LNFP I | 2250 | 1640 | 280 ± 580 | 862 ± 734 | 910 ± 740 | 1910 ± 440 | 870 (0–1550) | 1147 ± 802 | ||
| LNFP II | 230 | 290 | 359 ± 384 | 360 ± 190 | 200 (0–1260) | 399 ± 377 | ||||
| LNFP III | 340 | 370 | 248 ± 111 | 340 ± 410 | 330 (270–420) | |||||
| 3′-SL | 300 | 270 | 163 ± 105 | 165 ± 38 | 110 ± 35 | 200 (140–300) | 100 ± 42 | 226 ± 107 | 154 ± 36 | |
| 6′-SL | 1770 | 1570 | 343 ± 235 | 558 ± 140 | 330 ± 140 | 470 ± 110 | 640 (530–970) | 592 ± 219 | 621 ± 212 | 1297 ± 426 |
| LST a | 90 | 50 | 78 ± 60 | 90 ± 30 | 160 (120–230) | 127 ± 86 | 104 ± 46 | |||
| LST b | 60 | 70 | 84 ± 43 | 40 (20–150) | ||||||
| LST c | 60 | 310 | 620 ± 458 | 500 ± 100 | 370 (230–510) | 941 ± 528 | 488 ± 224 | 367 ± 147 | ||
| DSLNT | 60 | 440 | 638 ± 484 | 320 (230–490) | 644 ± 552 | |||||
| (c1) Mature | 1 Month | ||||||||||
|---|---|---|---|---|---|---|---|---|---|---|---|
| Reference Year | [43] 2010 | [43] 2010 | [34] 2015 | [32] 2016 | [2] 2017 | [31] 2017 | [30] 2017 | [25] 2018 | [24] 2019 | [21] 2019 | [21] 2019 |
| Country | Germany (22 day) | Germany (1 month) | USA (28 day) | China (12–30 day) | Various (11–30 day) | Spain (16–30 day) | Singapore | China | China (28–34 day) | 7 European countries (17 day) | 7 European countries |
| 2′-FL | 3020 | 2960 | 1753 ± 1382 | 1900 ± 1200 | 2830 ± 500 | 2190 (0–3860) | 2170 ± 832 | 1371 ± 1121 | 1399 ± 860 | 2627 ± 1028 | 2450 ± 935 |
| 3-FL | 440 | 420 | 767 ± 654 | 570 ± 480 | 340 ± 90 | 1050 (0–1170) | 894 ± 718 | 732 ± 545 | 594 ± 554 | 720 ± 608 | |
| LNDFH I | 1550 | 1360 | 690 ± 200 | 626 ± 441 | 1275 ± 548 | 1105 ± 452 | |||||
| LNDFH II | 260 | 240 | 140 ± 80 | 110 (60–250) | |||||||
| LDFT | 360 | 370 | 140 ± 165 | 370 ± 230 | 190 (0–350) | 349 ± 379 | 277 ± 231 | ||||
| LNT | 750 ± 481 | 620 ± 340 | 760 ± 410 | 1010 (770–2100) | 979 ± 394 | 1225 ± 553 | 651 ± 316 | 1213 ± 720 | 1009 ± 591 | ||
| LNnT | 113 ± 71 | 120 ± 67 | 630 ± 850 | 180 (110–230) | 263 ± 99 | 708 ± 299 | 237 ± 143 | 177 ± 97 | 153 ± 80 | ||
| LNFP I | 1720 | 1480 | 546 ± 512 | 540 ± 400 | 1370 ± 290 | 920 (0–1560) | 1181 ± 578 | 701 ± 650 | 1431 ± 798 | 1071 ± 627 | |
| LNFP II | 300 | 240 | 367 ± 350 | 320 ± 110 | 190 (10–1240) | 275 ± 250 | 595 ± 630 | 549 ± 532 | |||
| LNFP III | 370 | 370 | 222 ± 77 | 320 ± 240 | 310 (190–460) | 320 ± 141 | 311 ± 98 | ||||
| LNFP V | 39 ± 41 | 80 ± 860 | 39 ± 41 | 124 ± 117 | 112 ± 99 | ||||||
| 3′-SL | 260 | 270 | 146 ± 32 | 94 ± 25 | 180 (140–220) | 217 ± 74 | 108.1 ± 37.4 | 651 ± 316 | 149 ± 38 | 141 ± 35 | |
| 6′-SL | 1420 | 1350 | 368 ± 108 | 250 ± 93 | 380 ± 90 | 650 (470–780) | 561 ± 200 | 365 ± 160 | 736 ± 450 | 649 ± 189 | 465 ± 162 |
| LST a | 30 | 30 | 70 ± 50 | 180 (110–230) | 58 ± 40 | ||||||
| LST b | 90 | 100 | 50 (20–230) | 80 ± 40 | 77 ± 38 | ||||||
| LST c | 250 | 240 | 240 ± 110 | 290 (190–440) | 159 ± 111 | 173 ± 132 | 258 ± 128 | 148 ± 72 | |||
| DSLNT | 410 | 410 | 310 (220–510) | 336 ± 222 | 385 ± 164 | 290 ± 135 | |||||
| 6′-GOS/6′GL | 22.3 ± 13.6 | 132 ± 47 | 26 ± 10 | ||||||||
| MFLNH-III/3-FLNH | 200 | 416 ± 208 | 358 ± 192 | ||||||||
| DFLNH/DFLNHa/DFLNH I/DFLNH II | 2700 ± 3880 | 278 ± 163 | 227 ± 147 | ||||||||
| (c2) Mature Milk | 2 Months | 3 Months | ||||||||||
|---|---|---|---|---|---|---|---|---|---|---|---|---|
| Reference Year | [43] 2010 | [32] 2016 | [2] 2017 | [30] 2017 | [25] 2018 | [25] 2018 | [21] 2019 | [26] 2018 | [43] 2010 | [2] 2017 | [25] 2018 | [21] 2019 |
| Country | Germany | China (1–2 months) | Various (1–2 months) | Singapore | China | Malaysia | 7 European countries | USA (42 day) | Germany | Various (2–3 months) | China | 7 European countries |
| 2′-FL | 2820 | 1700 ± 1100 | 2390 ± 710 | 1764 ± 635 | 1176 ± 1019 | 1286 ± 1034 | 2075 ± 840 | 2480 ± 130 | 2590 | 2210 ± 710 | 984 ± 894 | 1819 ± 739 |
| 3-FL | 560 | 720 ± 550 | 640 ± 150 | 1158 ± 864 | 762 ± 597 | 970 ± 692 | 670 | 670 ± 120 | 1366 ± 942 | 1140 ± 777 | ||
| LNDFH I | 1020 | 1100 ± 290 | 842 ± 327 | 1930 ± 50 | 1050 | 990 ± 290 | 719 ± 285 | |||||
| LNDFH II | 190 | 190 ± 130 | 170 | 180 ± 130 | ||||||||
| LDFT | 380 | 380 ± 460 | 280 ± 155 | 240 ± 10 | 480 | 350 ± 230 | 273 ± 131 | |||||
| LNT | 370 ± 220 | 1010 ± 530 | 633 ± 324 | 851 ± 319 | 1217 ± 651 | 700 ± 416 | 510 ± 30 | 730 ± 530 | 947 ± 602 | 599 ± 400 | ||
| LNnT | 83 ± 43 | 560 ± 1220 | 166 ± 72 | 569 ± 226 | 609 ± 285 | 128 ± 80 | 760 ± 1230 | 513 ± 419 | 108 ± 67 | |||
| LNFP I | 1060 | 340 ± 240 | 830 ± 450 | 950 ± 397 | 1660 ± 494 | 611 ± 423 | 580 ± 30 | 940 | 830 ± 440 | 1177 ± 679 | 469 ± 373 | |
| LNFP II | 180 | 240 ± 190 | 474 ± 402 | 170 | 210 ± 150 | 433 ± 332 | ||||||
| LNFP III | 400 | 400 ± 410 | 358 ± 110 | 440 | 440 ± 410 | 353 ± 92 | ||||||
| LNFP V | 26 ± 25 | 91 ± 72 | 85 ± 66 | |||||||||
| 3′-SL | 230 | 80 ± 22 | 195 ± 60 | 99 ± 21 | 112 ± 28 | 129 ± 31 | 120 ± 0 | 240 | 114 ± 29 | 130 ± 35 | ||
| 6′-SL | 630 | 140 ± 81 | 300 ± 150 | 280 ± 116 | 222 ± 105 | 251 ± 132 | 231 ± 101 | 250 ± 20 | 490 | 140 ± 130 | 137 ± 55 | 151 ± 87 |
| LST a | 10 | 10 ± 60 | 43 ± 32 | 60 ± 31 | 10 | 20 ± 50 | 40 ± 28 | |||||
| LST b | 80 | 64 ± 33 | 80 | 57 ± 31 | ||||||||
| LST c | 110 | 130 ± 90 | 152 ± 118 | 130 ± 77 | 70 ± 47 | 90 | 110 ± 110 | 85 ± 67 | 44 ± 42 | |||
| DSLNT | 230 | 169 ± 83 | 210 | 136 ± 72 | ||||||||
| SLNFP I | ||||||||||||
| 3′S3FL | 8.5 ± 9.1 | 5.5 ± 3.5 | 7.5 ± 4.8 | |||||||||
| LNH | 80 ± 80 | 160 ± 10 | 120 ± 100 | |||||||||
| MFLNH I/ 2 FLNH | 130 | 110 ± 10 | 100 | |||||||||
| MFLNH III/ 3 FLNH | 120 | 208 ± 127 | 90 | 143 ± 94 | ||||||||
| DFLNH/DFLNHa/DFLNH I/DFLNH II | 2840 ± 548 | 120 ± 97 | 98 ± 80 | |||||||||
| (c3) Mature Milk | 4 Months | 6 Months | ||||||
|---|---|---|---|---|---|---|---|---|
| Study | [42] 2010 | [32] 2016 | [30] 2017 | [27] 2018 | [25] 2018 | [25] 2018 | [25] 2018 | [23] 2019 |
| Country | Samoa (22–155 day) | China (2–4 months) | Singapore | Canada (Caucasian and Asian mothers) (3–4 months) | China | China | Malaysia | UAE |
| 2′-FL | 690 ± 810 | 1300 ± 900 | 1376 ± 594 | 2256 ± 1846 | 866 ± 891 | 704 ± 752 | 1003 ± 803 | 997 ± 885 |
| 3-FL | 2350 ± 1390 | 1100 ± 610 | 267 ± 171 | 1427 ± 892 | 1476 ± 790 | 1146 ± 869 | 1194 ± 106 | |
| LNT | 1310 ± 590 | 290 ± 170 | 407 ± 200 | 1047 ± 479 | 866 ± 443 | 785 ± 497 | 867 ± 426 | 504 ± 337 |
| LNnT | 200 ± 290 | 65 ± 39 | 108 ± 76 | 285 ± 246 | 525 ± 315 | 446 ± 234 | 571 ± 321 | 250 ± 188 |
| LNFP I | 350 ± 450 | 180 ± 140 | 788 ± 754 | 1228 ± 557 | 945 ± 436 | 1036 ± 492 | 650 ± 416 | |
| LNFP II | 2770 ± 2140 | 1853 ± 879 | ||||||
| LNFP III | 92 ± 51 | |||||||
| LNFP V | 25 ± 25 | |||||||
| 3′-SL | 133 ± 56 | 79 ± 20 | 198 ± 59 | 361 ± 231 | 126 ± 36 | 127 ± 39 | 135 ± 51 | 134 ± 69 |
| 6′-SL | 189 ± 265 | 78 ± 40 | 120 ± 45 | 162 ±128 | 97 ± 33.2 | 83 ± 54 | 84 ± 34 | 91 ± 108 |
| LST a | 44 ± 62 | 36 ± 23 | 33 ± 17 | 84 ± 55 | 11 ± 8 | |||
| LST b | 193 ± 215 | 118 ± 69 | ||||||
| LST c | 201 ± 316 | 43 ± 42 | 56 ± 41 | 47 ± 58 | 145 ± 160 | |||
| DSLNT | 317 ± 409 | 315 ± 246 | ||||||
| 3′S3FL | 9.1 ± 7.5 | 10.5 ± 6.9 | 9.0 ± 6.5 | 10 ± 14 | ||||
| 6′SLN | 4.0 ± 2.3 | 2.0 ± 2.1 | 3.6 ± 2.8 | 5 ± 1 | ||||
| Increasing over Lactation | Decreasing over Lactation | No Significant Trend |
|---|---|---|
| 3-FL (3-Fucosyllactose) 3′S3FL | 2′-FL (2′-fucosyllactose) LNT (Lacto-N-tetraose) LNnT (Lacto-N-neotetraose) LNFP I (Lacto-N-fucopentaose I) Lacto-N-fucopentaose III (LNFP III) Lacto-N-fucopentaose V (LNFP V) 3′-SL (α2,3-Sialyllactose) 1 6′-SL (α2,6-Sialyllactose) LST a/b (Sialyllacto-N-tetraose) LST c (Sialyllacto-N-neotetraose) | LDFT (Lactodifucotetraose) LNFP II (Lacto-N-fucopentaose II) A-Tetra LNnFP II (Lacto-N-neofucopentaose II) DSLNT |
| Country | Total Number | Secretors (%) | Reference |
|---|---|---|---|
| USA-Washington state | 41 | 68 | [6] |
| USA-California (Hispanic) | 19 | 95 | [6] |
| USA | 79 | 68 | [8] |
| 45 | 66–77 | [29] | |
| Canada (73% are Caucasian) | 427 | 72 | [27] |
| Chile | 44 | 84 | [8] |
| Mexico | 156 | 100 | [8] |
| Peru | 43 | 98 | [6] |
| Germany | 30 | 73 | [43] |
| 18 | 83 | [8] | |
| France | 22 | 91 | [8] |
| Italy | 29 | 86 | [8] |
| Spain | 41 | 76 | [6] |
| Sweden | 7 | 100 | [8] |
| 24 | 79 | [6] | |
| China | 20 | 67 | [25] |
| 30 | 73 | [1] | |
| 32 | 78 | [8] | |
| 650 | 79 | [32] | |
| Philippines | 22 | 46 | [8] |
| Singapore | 26 | 72 | [8] |
| Republic of Malawi | 88 | 78 | [29] |
| Ethiopia rural | 40 | 65 | [6] |
| Ethiopia urban | 40 | 78 | [6] |
| Kenya | 42 | 81 | [6] |
| Gambia rural | 40 | 65 | [6] |
| Gambia urban | 40 | 85 | [6] |
| Ghana | 40 | 68 | [6] |
| United Arab Emirates | 81 | 74 | [23] |
Publisher’s Note: MDPI stays neutral with regard to jurisdictional claims in published maps and institutional affiliations. |
© 2021 by the authors. Licensee MDPI, Basel, Switzerland. This article is an open access article distributed under the terms and conditions of the Creative Commons Attribution (CC BY) license (https://creativecommons.org/licenses/by/4.0/).
Share and Cite
Thum, C.; Wall, C.R.; Weiss, G.A.; Wang, W.; Szeto, I.M.-Y.; Day, L. Changes in HMO Concentrations throughout Lactation: Influencing Factors, Health Effects and Opportunities. Nutrients 2021, 13, 2272. https://doi.org/10.3390/nu13072272
Thum C, Wall CR, Weiss GA, Wang W, Szeto IM-Y, Day L. Changes in HMO Concentrations throughout Lactation: Influencing Factors, Health Effects and Opportunities. Nutrients. 2021; 13(7):2272. https://doi.org/10.3390/nu13072272
Chicago/Turabian StyleThum, Caroline, Clare Rosemary Wall, Gisela Adrienne Weiss, Wendan Wang, Ignatius Man-Yau Szeto, and Li Day. 2021. "Changes in HMO Concentrations throughout Lactation: Influencing Factors, Health Effects and Opportunities" Nutrients 13, no. 7: 2272. https://doi.org/10.3390/nu13072272
APA StyleThum, C., Wall, C. R., Weiss, G. A., Wang, W., Szeto, I. M.-Y., & Day, L. (2021). Changes in HMO Concentrations throughout Lactation: Influencing Factors, Health Effects and Opportunities. Nutrients, 13(7), 2272. https://doi.org/10.3390/nu13072272