Article

Sexual Dimorphism in Body Weight Loss, Improvements in Cardiometabolic Risk Factors and Maintenance of Beneficial Effects 6 Months after a Low-Calorie Diet: Results from the Randomized Controlled DiOGenes Trial

1
Top Institute Food and Nutrition (TIFN), 6708 PW Wageningen, The Netherlands
2
Department of Human Biology, NUTRIM School of Nutrition and Translational Research in Metabolism, Maastricht University Medical Center+, 6229 ER Maastricht, The Netherlands
3
Department of Nutrition, Exercise and Sports, Faculty of Science, University of Copenhagen, 1165 Copenhagen, Denmark
*
Author to whom correspondence should be addressed.
Nutrients 2021, 13(5), 1588; https://doi.org/10.3390/nu13051588
Submission received: 29 March 2021 / Revised: 3 May 2021 / Accepted: 5 May 2021 / Published: 10 May 2021
(This article belongs to the Special Issue Glucose Metabolism and Weight Management)

Abstract

:
A low-calorie diet (LCD) is an effective strategy to lose weight and improve cardiometabolic risk factors, however, sexual dimorphism may be present. This study aims to investigate sexual dimorphism in cardiometabolic risk factors following weight loss and after weight maintenance. 782 overweight/obese participants (65% women) of the DiOGenes trial followed an 8-week LCD (~800 kcal/day), with a 6-months follow-up weight maintenance period on ad libitum diets varying in protein content and glycemic index. Men lost more body weight during the LCD period (−12.8 ± 3.9 vs. −10.1 ± 2.8 kg, respectively, p < 0.001), but regained more weight during the follow-up period than women (1.5 ± 5.4 vs. −0.5 ± 5.5 kg, respectively, p < 0.001). Even though beneficial LCD-induced changes in cardiometabolic risk factors were found for both sexes, improvements in HOMA-IR, muscle and hepatic insulin sensitivity, triacylglycerol, HDL−, LDL− and total cholesterol, diastolic blood pressure, cholesterol esters, sphingomyelins and adiponectin were more pronounced in men than women (std. ß range: 0.073–0.144, all q < 0.05), after adjustment for weight change. During follow-up, women demonstrated a lower rebound in HDL-cholesterol, triacylglycerol and diacylglycerol (std. ß range: 0.114–0.164, all q < 0.05), independent of changes in body weight. Overall, we demonstrated sexual dimorphism in LCD-induced changes in body weight and cardiometabolic risk profile, which may be attributed to differences in body fat distribution and metabolic status.

1. Introduction

Obesity is as a metabolic disease with major implications for the development and progression of several chronic diseases, including cardiovascular diseases and type 2 diabetes mellitus [1]. With the increasing worldwide prevalence of obesity, interventions targeting obesity and its cardiometabolic complications are increasingly warranted. Weight loss resulting from a low-calorie diet (LCD) is seen as an effective strategy to improve obesity and its related metabolic risk factors [2]. Nevertheless, weight maintenance after successful weight loss is one of the biggest challenges in the management of obesity, while it is of utmost importance to maintain improvements in cardiometabolic risk factors [3]. Interestingly, men and women show distinct responses to a LCD, both in relation to the amount of weight loss, the associated improvements in cardiometabolic risk factors and also how well these improvements are maintained during follow-up [2,4,5].
Firstly, distinct sex steroid hormone concentrations may contribute to sex-specific differences in glucose homeostasis, body composition and energy balance, as evidenced by the deleterious impact of the decreasing estrogen concentrations during menopause on cardiometabolic risk factors [4,6]. Furthermore, women generally have a greater subcutaneous lipid storage capacity as reflected by the larger gluteal-femoral subcutaneous adipose tissue (SAT) depot compared to men [7], which seems protective against the development of several cardiometabolic diseases [8]. In line, differences in plasma lipid(ome) profile are present between overweight and obese men and women [9,10]. In recent years, it has become clearer that these differences may reflect tissue-specific and/or whole-body lipid metabolism [10]. Altogether, these differences appear to be important determinants of sexual dimorphisms in weight loss and its associated metabolic adaptations [5,11,12] and may explain the distinct responses following LCDs that have been reported between men and women [12,13,14]. However, often it is not clear whether sex-specific metabolic responses to LCDs are independent of difference in weight loss or weight regain, or whether differences can be ascribed to sexual dimorphism in baseline (metabolic) characteristics.
A better understanding of the complex interplay between sex and changes in cardiometabolic risk profile following weight loss and during weight maintenance may contribute to the development of more targeted dietary interventions to prevent and treat overweight/obesity and related cardiometabolic complications [4,15]. In the present study, we therefore investigated sex-specific differences in diet-induced weight loss and cardiometabolic risk parameters, including plasma lipidome profile and indicators of insulin sensitivity, in overweight and obese individuals in the large pan-European multicenter DiOGenes study.

2. Materials and Methods

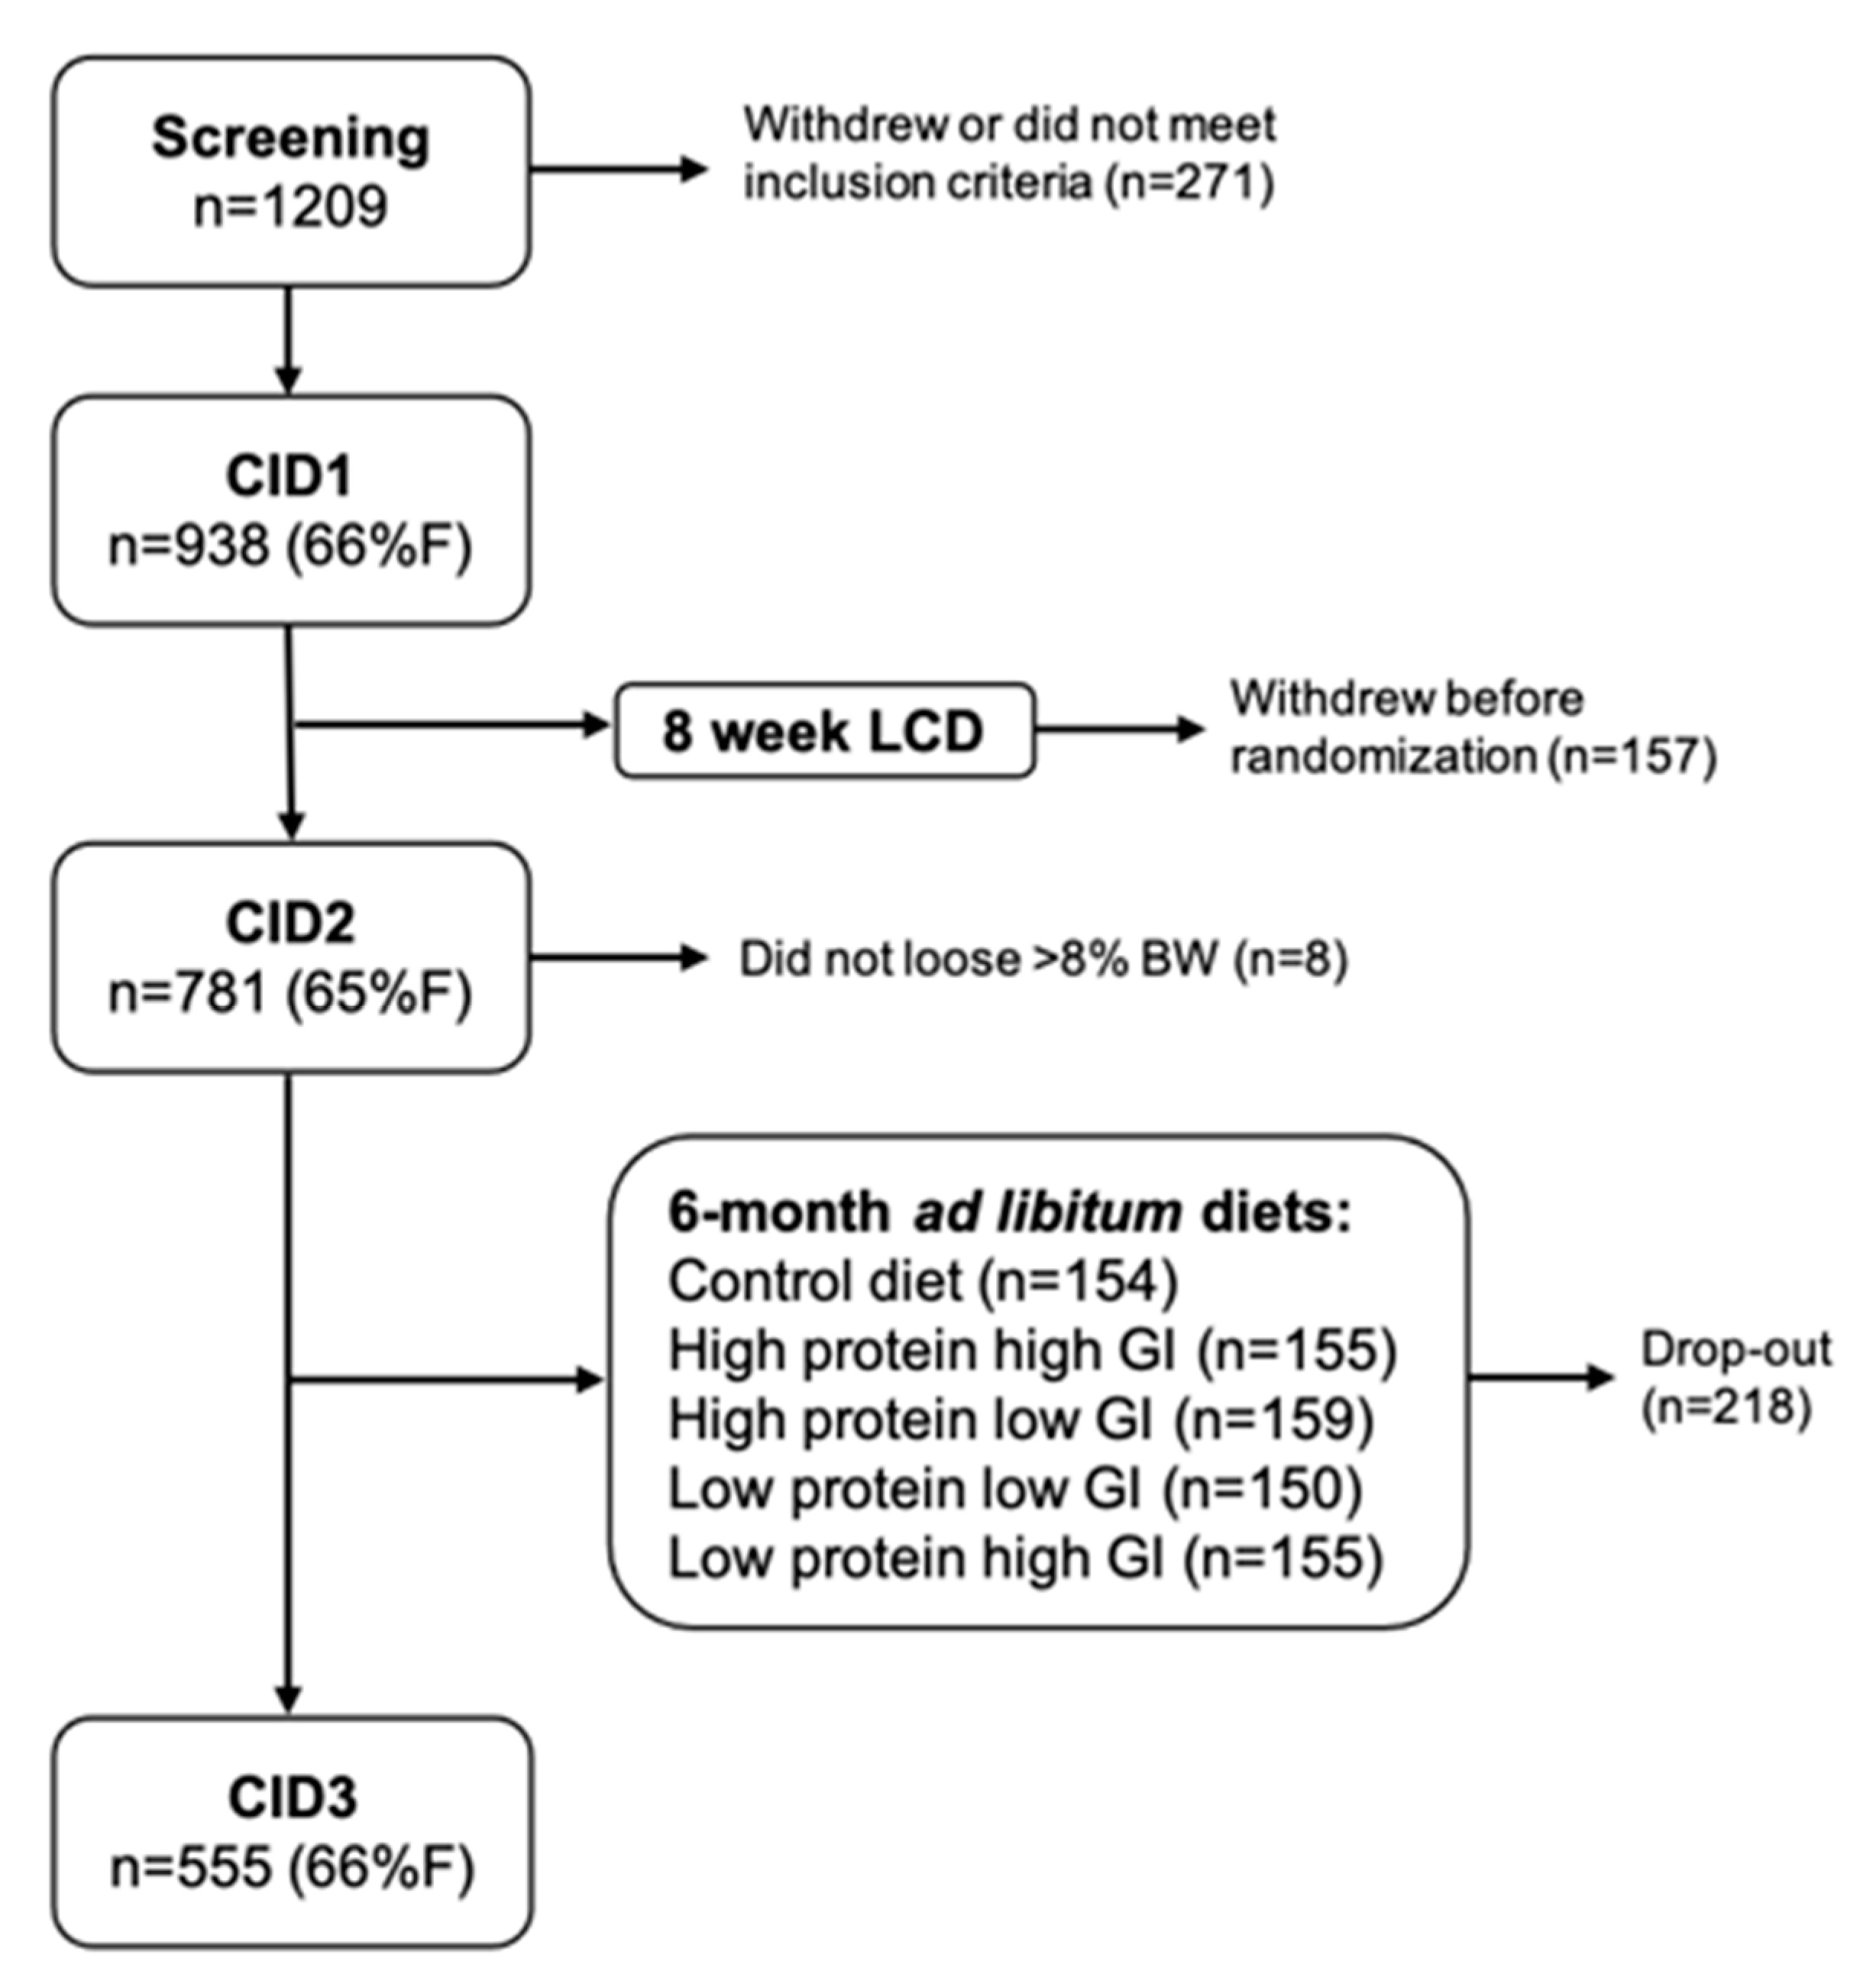
2.1. Study Design and Population

The DiOGenes study is a large randomized controlled dietary intervention study executed in 8 different European cities. Detailed description of the specific study objective, methods and sample size calculation are described elsewhere [16,17]. Briefly, 938 participants followed an 8-week LCD consisting of ~800 kcal/d (Modifast®, Nutrition et Santé, Belgium) to achieve weight loss. When ≥8% of the initial body weight was lost during the weight loss phase, the participant was randomly assigned to follow one of 5 ad libitum diets, differing in protein content and glycemic index, for 6 months (n = 555) (Figure 1). The latter period was aimed at weight maintenance. Weight stable adults with a BMI of ≥27 kg/m2 and ≤40 kg/m2 and <65 years of age and fasting blood glucose concentrations <6.1 mmol/L without history of cardiovascular disease or diseases affecting body weight control were recruited. Local ethics committees approved the study (MEC 05–097), and all participants gave written informed consent before participation in the study. The study was carried out in accordance with the principles of the Declaration of Helsinki. The study is registered under the ClinicalTrials.gov Identifier: NCT00390637.

2.2. Clinical Visits

Data of three clinical investigation days (CIDs) were included in this study. CID1 was performed before the start of the 8-week weight loss phase, CID2 after the weight loss phase and CID3 after the 6-month weight maintenance phase. During all CIDs weight and height, waist and hip circumference and blood pressure were determined. Furthermore, after an overnight fast, participants underwent an oral glucose tolerance test (OGTT). Venous blood was sampled before (t = 0 min) and at 30, 60, 90, 120 min after ingestion of the glucose drink. Physical activity was assessed using the validated BAECKE questionnaire, including domains of work, leisure and sports [18].

2.3. Biochemical Analysis

Venous plasma and serum samples were stored at −80 °C and analyzed. Both fasting and postprandial glucose and insulin and fasting lipid parameters (free fatty acids (FFA), triacylglycerol (total TAG), HDL-cholesterol, LDL-cholesterol and total cholesterol), C-reactive protein (CRP) and adiponectin were analyzed. Furthermore, plasma lipidome profiles were analyzed (see ‘2.5 Plasma lipidomics’ below for method of analysis). All samples were sent to a central laboratory, depending on the type of analysis.

2.4. Insulin Sensitivity

Whole-body insulin sensitivity was estimated using HOMA-IR, which was calculated using the following formula: (glucoset=0 (mmol/L) × insulint=0 (mU/L))/22.5. Furthermore, tissue-specific insulin resistance was estimated according to the method of Abdul-Ghani et al. [19], and validated against the hyperinsulinemic euglycemic clamp technique. Previous studies have demonstrated that, using these indices, muscle, liver and adipose tissue insulin resistance are related to distinct cardiometabolic disease risk profiles (for example a distinct lipidome profile) [10,20,21], and have been found to be different in men and women [10,20,22].
Hepatic IR and muscle insulin sensitivity can be estimated based on glucose and insulin values during a 5-point OGTT, using the hepatic insulin resistance index (HIRI) and muscle insulin sensitivity index (MISI), respectively [10,19,20]. HIRI was estimated using the square root of the product of the area under curves (AUCs) for glucose and insulin during the first 30 min of the OGTT using the formula: HIRI = √(glucose0–30 [AUC] * insulin0–30 [AUC]). MISI was calculated using the following formula: MISI = (dG/dt)/mean insulin during the OGTT. Here, dG/dt is the rate of decay of plasma glucose concentrations during the OGTT, calculated as the slope of the least square fit to the decline in plasma glucose concentration from peak to nadir. MISI and HIRI have been validated against the gold standard hyperinsulinemic-euglycemic clamp, where MISI was validated against the glucose disposal rate and HIRI with the endogenous glucose production [19]. The adipose tissue insulin resistance index (ATIRI) was calculated as fasting insulin (μU/L) × fasting non-esterified fatty acids (μmol/L)/1000.

2.5. Plasma Lipidomics

Fasting plasma lipidome analysis was performed for all three clinical visits using liquid chromatography-mass spectrometry as described previously [11]. Briefly, a mixture of internal standards and calibration standards were added to each sample. Then, liquid-liquid extraction was performed using a dichloromethane-methanol (2:1) mixture. Following, lipids were separated on a Ascentis Express C8 2.1 9 150-mm (2.7-μm particle size) column (Sigma-Aldrich, Bellefonte, PA, USA) with the use of an Acquity UPLC system (Waters, Prague, Czech Republic) and visualized and quantified using quadrupole time-of-flight mass spectrometry (Agilent Technologies, Santa Clara, CA, USA) [11]. A total of 140 lipids were detected based on the actual presence of target compounds in a LC-MS raw data file. The target compounds are previously identified by LC-high resolution MS, using the FT-ICR-MS and (relative) retention time [23], resulting in a high degree of certainty [24]
The lipids were grouped into 11 lipid groups species according to Lipid Maps nomenclature (http://www.lipidmaps.org (accessed on 5 April 2020)). The lipid groups are defined as follows: TAG (n = 55), diacylglycerols (DAG; n = 2), cholesterol esters (CholE; n = 3), lysophosphatidylcholine (LPC; n = 11), lysoalkylphosphatidylcholine (LPCO; n = 2), lysophosphatidylethanolamine (LPE; n = 1), phosphatidylcholine (PC; n = 25), alkyl-phosphatidylcholine (PCO; n = 15), phosphatidylethanolamine (PE; n = 3), alkylphosphatidylethanolamine (PEO; n = 3) and sphingomyelins (SM; n = 20). The TAG species was further sub-divided into potential metabolically relevant sub-groups based on composition, saturation and chain length of TAGs as they have been shown to be differentially related to cardio-metabolic risk factors in men and women [10].

2.6. Statistical Analysis

In this exploratory analysis, differences in characteristics between men and women were assessed using an independent sample t-test. Linear mixed-model analyses were performed to assess the differences in change in cardiometabolic risk parameters between men and women following weight loss (from CID1 to CID2) and after weight maintenance (from CID2 to CID3). The linear mixed-model was performed with cardiometabolic risk parameters as the dependent variable, sex as fixed effect and study center as random effect. Age, body weight at baseline, weight loss and baseline value of the dependent variable were included as covariates in the analyses for the change following weight loss (from CID1 to CID2). For the weight maintenance phase (from CID2 to CID3), age, baseline weight, baseline value of the dependent variable, change of the dependent variable during weight loss, weight change during the weight loss phase and weight maintenance phase, and diet were included as covariates. Since physical activity level was not different between men and women, and was not significantly altered during the intervention, physical activity was not included in the analyses. In case data were not normally distributed, data were Ln-transformed to approximate normality. Z-scores were calculated in order to standardize effect sizes, allowing direct comparison of different variables. To correct for multiple comparisons and limit false positive outcomes, p-values were corrected for False Discovery Rate (FDR) using the Benjamini-Hochberg method. FDR-adjusted p-Values (q-Values) were used to describe the data with a significance set at q ≤ 0.05. Only results of the fully adjusted models are shown (depicted as ‘adj.’). The statistical analysis was performed using the IBM SPSS Statistics software (version 25).

3. Results

3.1. Clinical Characteristics of the Study Population

782 participants were included in the analysis of the weight loss phase, of which 555 also participated in the weight maintenance phase. Of the total population, 506 (=64.7%) were women. A detailed overview of the clinical characteristics of the men and women in the study are listed in Table 1. Briefly, the average age of men in the study was 42.5 ± 6.0 years (mean ± standard deviation (SD)), compared to 41.0 ± 6.3 years in women (significant different, p = 0.001). At baseline, women had lower values for waist-hip ratio, systolic (SBP) and diastolic blood pressure (DBP), fasting glucose, 2-hr glucose, fasting insulin, HOMA-IR, HIRI, total cholesterol, LDL-cholesterol, triglycerides and adiponectin compared to men while HDL-cholesterol, FFA and CRP were higher in women (all p < 0.01). BMI, physical activity, 2-hr glucose, MISI and ATIRI, were not significantly different between men and women. The clinical characteristics of the 555 participants participating in the weight maintenance phase are comparable with the complete population characteristics (data not shown).

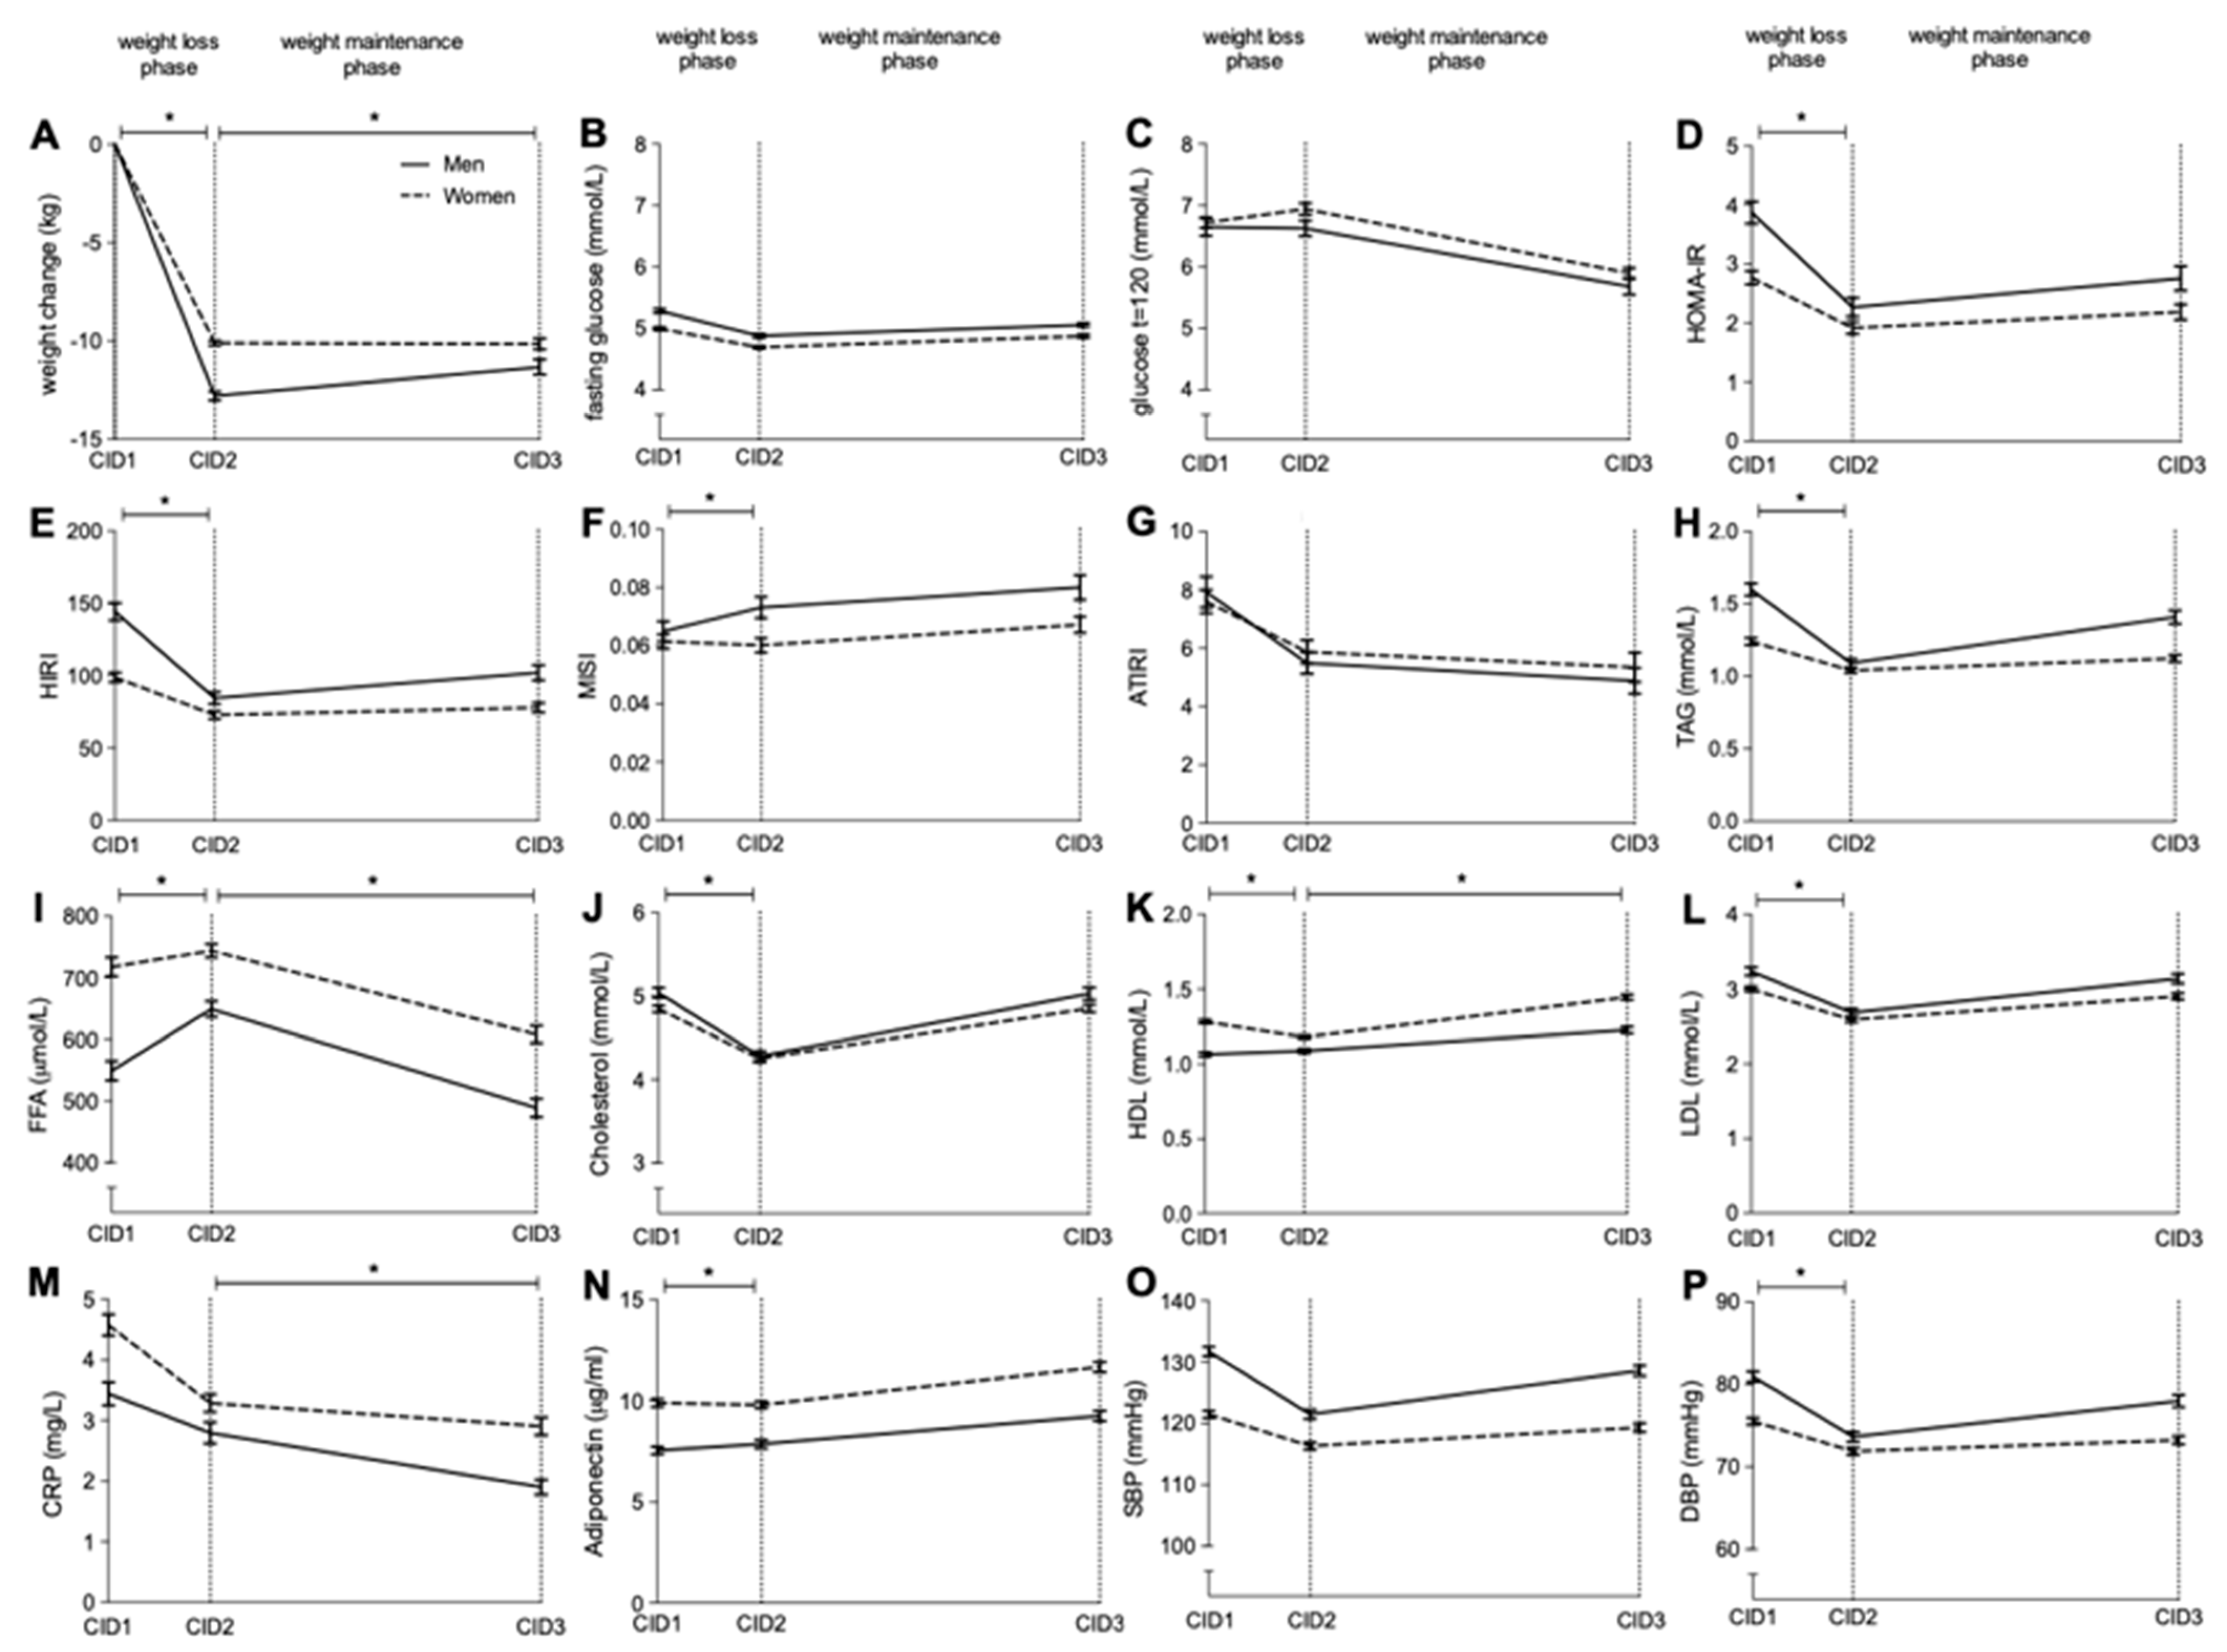
3.2. Weight Change Following LCD

On average, men lost significantly more body weight following the weight loss phase than women (12.8 ± 3.9 vs. 10.1 ± 2.8 kg or 11.7 ± 3.0 vs. 10.6 ± 2.5%, both p < 0.001, respectively) (Figure 2A). This difference remained significant after adjustment for age and body weight at baseline (adj. p < 0.001). Men regained on average 1.6 ± 5.3 kg following the weight maintenance phase whereas women lost −0.5 ± 5.5 kg. The difference in weight change during the weight maintenance phase remained significant after adjustment for age, weight at baseline and weight lost during the weight loss phase (adj. p < 0.001).

3.3. Changes in Insulin Sensitivity Following Weight Loss

Several differential changes in glucose homeostasis parameters between men and women were observed following the weight loss phase in the fully adjusted model (see ‘Statistical analysis’ for details). For both HOMA-IR, HIRI and MISI, men significantly improved more following the weight loss phase compared to women (adj. stdβ = 0.104, 0.073 and −0.116, q = 0.008, q = 0.028 and q = 0.015, respectively) (Figure 2D–F). There was a significant decrease in fasting glucose, 2hr glucose and ATIRI in both men and women following LCD-induced weight loss with no differences between sexes (Figure 2B,C,G). During the weight maintenance phase, no significant differences were found between men and women regarding parameters related to glucose homeostasis (Figure 2B–G).

3.4. Changes in Lipid Profile and Blood Pressure Following Weight Loss

Following LCD-induced weight loss, men demonstrated a more pronounced decrease in TAG (adj. stdβ = 0.105, q < 0.001), total cholesterol (adj. stdβ = 0.083, q = 0.030), HDL-cholesterol (adj. stdβ = −0.135, q < 0.001), LDL-cholesterol (adj. stdβ = 0.088, q = 0.028), adiponectin (adj. stdβ = 0.083, q = 0.030) and DBP (adj. stdβ = 0.091, q = 0.025), and a greater increase in HDL-cholesterol (adj. stdβ = −0.135, q < 0.001) compared to women (Figure 2H,J,K,N,P). In contrast, following the weight maintenance phase, in the fully adjusted model, a greater worsening in HDL-cholesterol (adj. stdβ = 0.164, q < 0.001) and a trend for greater worsening in HIRI (adj. stdβ = −0.125, q = 0.075), TAG (adj. stdβ = −0.096, q = 0.066) and SBP (adj. stdβ = −0.097, q = 0.060) were observed in men compared to women (Figure 2E,H,K,O). CRP concentrations decrease more in the weight maintenance phase in men compared to women (adj. stdβ = 0.139, q = 0.008). The changes in FFA, total cholesterol, LDL-cholesterol, adiponectin and DBP did not significantly differ between men and women during the weight maintenance phase (Figure 2I–K,P).

3.5. Changes in Plasma Lipidome Profile Following Weight Loss

Before the start of the LCD (CID1), men showed significantly higher relative abundance of TAG, DAG and PEO, but lower relative abundance (expressed as percentage of total plasma lipids) of CholE, LPE, PC, PCO, PE and SM than women (Table 2). Furthermore, higher relative abundance of saturated, even and very long TAG species were observed at CID1 in men. Sex-specific changes in the sum scores of plasma lipids were found during the weight loss as well as weight maintenance phase. In the fully adjusted model, men showed a greater decrease in TAG (adj. stdβ = 0.077, q = 0.031), CholE (adj. stdβ = 0.113, q = 0.008) and SM (adj. stdβ = 0.119, q = 0.008) following LCD-induced weight loss compared to women (Figure 3A). In contrast, women demonstrated a greater decrease in LPC (adj. stdβ = −0.162, q < 0.001), LPCO (adj. stdβ = −0.140, q < 0.001) and a trend for greater decrease in LPE (adj. stdβ = −0.075, q = 0.073) following the weight loss phase than men (Figure 3A). For the weight maintenance phase, women showed a less pronounced increase in TAG (adj. stdβ = −0.153, q < 0.001), DAG (adj. stdβ = −0.114, q = 0.006) and LPC (adj. stdβ = −0.186, q < 0.001) compared to men, whilst men showed a smaller increase in SM (adj. stdβ = 0.122, q = 0.004) (Figure 3B). Standardized betas for the link between sex and individual lipid species of the lipids within a statistically significant lipid subclass are depicted in Supplemental Table S1.

4. Discussion

The present study demonstrates sexual dimorphism in LCD-induced body weight loss, improvements in cardiometabolic risk factors, and maintenance of beneficial effects 6 months after weight loss in the large pan-European DiOGenes trial. More specific, men showed greater weight loss and greater improvements in several cardiometabolic risk factors following an 8-week LCD (~800 kcal/day), whereas women demonstrated lower regain of weight, and smaller deterioration of several cardiometabolic risk factors, independent of weight change and diet, during the weight maintenance period 6 months after the weight loss. Interestingly, plasma lipidomic analysis revealed that several lipid species respond in a sex-specific manner to weight loss and weight maintenance, independent from changes in body weight. These findings may have important implications for the development of more targeted dietary interventions to prevent or delay the progression of cardiometabolic complications associated with obesity.
We found more pronounced weight loss following the LCD in men compared to women. One could argue that this may be attributed to a greater energy restriction in men, given the on average greater energy requirements than women. Interestingly, however, men improved more in HOMA-IR, HIRI, MISI, TAG, HDL-, LDL- and total cholesterol, diastolic blood pressure, triglycerides, cholesterol esters, sphingomyelins and adiponectin compared to women, independent of body weight loss. Importantly, the observed differences are also independent of the more beneficial cardiometabolic risk profile at baseline as observed in women compared to men, which is reflected in greater (whole body and liver) insulin sensitivity, higher HDL-cholesterol concentration, lower blood pressure and lower concentration of several lipid species including (saturated and even chain) TAG and DAG. Furthermore, during the 6-month weight maintenance phase, HDL-cholesterol, TAG and DAG had a lower rebound in women, independent of body weight change and diet. These findings suggest that other factors than weight change per se are important determinants of the cardiometabolic changes that occur during weight loss and weight maintenance in men and women.
Based on the present findings, women appear to be less responsive to the dietary intervention with respect to cardiometabolic outcomes. These findings are in line with several previous studies, showing that following weight loss, men lose more weight and improve more in amongst others blood pressure, cholesterol concentration, plasma TAG and HbA1c compared to women [12,13,14,25,26]. It is tempting to postulate that the smaller fluctuations in cardiometabolic risk factors in premenopausal women may be due to sex-differences in metabolic homeostasis and result in a relative protection against metabolic perturbations. Indeed, for a given BMI, women are relatively protected against lipid-induced insulin resistance [27,28] and show higher HDL-cholesterol and lower TAG concentration compared to men [29]. This relative metabolic protection may relate to differences in body fat distribution and ectopic fat storage as a result of differences in substrate supply and utilization, and storage and mobilization of excess lipids, as reviewed elsewhere [4]. Following weight loss, more pronounced changes in intra-abdominal or visceral adipose tissue (VAT) are generally observed in men, whereas women show a more pronounced decrease in (lower body) SAT [30,31,32]. In line, VAT area increased more with weight regain in young overweight men compared to women when expressed as percentage weight regain [33]. VAT mass is positively associated with cardiometabolic risk factors such as insulin resistance and dyslipidemia [34,35], while the expandability of SAT is a critical factor in the prevention of cardiometabolic diseases, and seems to act as an important ‘metabolic lipid sink’ [7,36]. Unfortunately, we have no data on changes in VAT mass available in the current study.
Sexual dimorphism in metabolic homeostasis is also observed in relation to (tissue-specific) insulin sensitivity and glucose homeostasis [4,10]. In the present study, women showed lower whole-body and liver insulin resistance, with similar muscle insulin sensitivity compared to men. Interestingly, women responded less favorable to weight loss with regard to HOMA-IR, HIRI and MISI (independent of baseline insulin sensitivity). It can be speculated that a greater VAT mass loss in men following weight loss, as previously reported, could explain the observed differences in tissue-specific insulin resistance. Insulin signaling in VAT is generally more disturbed compared to SAT [37] and greater VAT mass is linked to the development of liver insulin resistance via FFA release from VAT into the portal vein, affecting glucose and lipid metabolism within the liver [38].
The present plasma lipidomic analyses revealed that LPC decreased more pronounced following weight loss and increased less during weight maintenance in women compared to men. Previously, reduced concentration of LPC have been linked to (muscle) insulin resistance and type 2 diabetes mellitus [10,39]. Moreover, baseline SM concentrations were higher, and SM concentrations decreased less during weight loss and increased more during follow-up in women than men. In contrast to LPC, higher concentrations of SM seem to be related to a more detrimental metabolic health profile including insulin resistance [40,41]. These observations seem to contrast to the more beneficial cardiometabolic profile observed in women. An explanation for this is currently lacking but may possibly reflect a sexual dimorphism in the relationship of these lipidome components and insulin resistance and/or cardiometabolic risk, as previously reported for relationship of TAG and DAG species and hepatic insulin resistance [10]. Interestingly, also diet composition seems to mediate the effect on certain lipid species in both sexes, with the high-protein diets inducing more pronounced increases in PCO and PEO. Further research should elucidate the relationship between LPC and SM and cardiometabolic disease risk in men and women, as well as the impact of diet composition.
To our knowledge, this is the first study to report sex-specific changes in plasma lipid species and tissue-specific insulin resistance following weight loss and during follow-up weight maintenance, independent of the differences in weight change. More detailed measures of body composition are needed to elucidate whether the observed sex-specific changes are at least partly driven by differences in (changes in) body fat distribution. Additionally, sex hormones may affect differences in lipid handling and insulin sensitivity. In the present study, we could not directly explain our results by hormonal status, since most women were in the premenopausal state. Additionally, more subtle effects of sex hormones could not be determined since no data was available on sex hormones or phase of menstrual cycle. Nevertheless, the present findings contribute to a better understanding of the metabolic underpinnings of sex-specific changes following weight loss and weight maintenance.
In conclusion, in this study we observed that overweight or obese men lose more weight and improve more in several cardiometabolic risk parameters following a low-calorie diet but are less able to maintain several of the improvements after 6 months of follow up compared to premenopausal women. Furthermore, several plasma lipid species changed in a sex-specific manner, independently of the direction of the weight loss, which may have implications for the sex-specific development of cardiometabolic diseases. Altogether, these findings may provide directions for more sex-targeted dietary interventions in the prevention of cardiometabolic diseases.

Supplementary Materials

The following is available online at https://www.mdpi.com/article/10.3390/nu13051588/s1, Table S1: Standardized beta’s of the link between sex and the changes in individual lipid species following loss and weight maintenance.

Author Contributions

Conceptualization and methodology, I.T., G.H.G. and E.E.B.; formal analysis, visualization and writing—original draft preparation, I.T.; supervision G.H.G. and E.E.B.; writing—review and editing G.H.G., W.H.M.S., A.A. and E.E.B. All authors have read and agreed to the published version of the manuscript.

Funding

The Diogenes project, coordinated by Professor Wim Saris, Maastricht University, The Netherlands, is funded by a grant of 14.5 million Euros of EU funding under the Food Quality and Safety Priority of the Sixth Framework Programme for Research and Technological Development of the European Union (2005–2009), through the Directorate-General for Research of the European Commission. Financial contributions from local sponsors were also provided to the shop centers, which also received a number of foods free of charge from food manufacturers. A full list of these sponsors can be seen at http://www.diogenes-eu.org/sponsors/.

Institutional Review Board Statement

The study was conducted according to the guidelines of the Declaration of Helsinki and approved by the local ethical committees in the respective countries. The study is registered under the Clinical Trial registration number: NCT00390637 (website: www.clinicaltrials.gov).

Informed Consent Statement

Informed consent was obtained from all subjects involved in the study.

Data Availability Statement

Data described in the manuscript will be made available upon request pending.

Acknowledgments

The authors like to thank all study participants for participating in the DiOGenes study.

Conflicts of Interest

The project is organized by and executed under the auspices of TiFN, a public -private partnership on precompetitive research in food and nutrition. The authors have declared that no competing interests exist in the writing of this publication. Funding for this research was obtained from the Netherlands Organization for Scientific Research.

References

  1. Jastreboff, A.M.; Kotz, C.M.; Kahan, S.; Kelly, A.S.; Heymsfield, S.B. Obesity as a Disease: The Obesity Society 2018 Position Statement. Obesity 2019, 27, 7–9. [Google Scholar] [CrossRef] [Green Version]
  2. Bray, G.; Frühbeck, G.; Ryan, D.H.; Wilding, J.P.H. Management of obesity. Lancet 2016, 387, 1947–1956. [Google Scholar] [CrossRef] [Green Version]
  3. Anderson, J.W.; Konz, E.C.; Frederich, R.C.; Wood, C.L. Long-term weight-loss maintenance: A meta-analysis of US studies. Am. J. Clin. Nutr. 2001, 74, 579–584. [Google Scholar] [CrossRef] [PubMed]
  4. Goossens, G.H.; Jocken, J.W.E.; Blaak, E.E. Sexual dimorphism in cardiometabolic health: The role of adipose tissue, muscle and liver. Nat. Rev. Endocrinol. 2021, 17, 47–66. [Google Scholar] [CrossRef]
  5. Meyer, A.; Montastier, E.; Hager, J.; Saris, W.H.M.; Astrup, A.; Viguerie, N.; Valsesia, A. Plasma metabolites and lipids predict insulin sensitivity improvement in obese, nondiabetic individuals after a 2-phase dietary intervention. Am. J. Clin. Nutr. 2018, 108, 13–23. [Google Scholar] [CrossRef]
  6. Geer, E.B.; Shen, W. Gender differences in insulin resistance, body composition, and energy balance. Gend. Med. 2009, 6, 60–75. [Google Scholar] [CrossRef] [Green Version]
  7. Goossens, G.H. The Metabolic Phenotype in Obesity: Fat Mass, Body Fat Distribution, and Adipose Tissue Function. Obes. Facts 2017, 10, 207–215. [Google Scholar] [CrossRef]
  8. Karpe, F.; Pinnick, K.E. Biology of upper-body and lower-body adipose tissue—link to whole-body phenotypes. Nat. Rev. Endocrinol. 2015, 11, 90–100. [Google Scholar] [CrossRef] [PubMed]
  9. Wang, X.; Magkos, F.; Mittendorfer, B. Sex differences in lipid and lipoprotein metabolism: It’s not just about sex hormones. J. Clin. Endocrinol. Metab. 2011, 96, 885–893. [Google Scholar] [CrossRef] [PubMed] [Green Version]
  10. van der Kolk, B.W.; Vogelzangs, N.; Jocken, J.W.E.; Valsesia, A.; Hankemeier, T.; Astrup, A.; Saris, W.H.M.; Arts, I.C.W.; van Greevenbroek, M.M.J.; Blaak, E.E.; et al. Plasma lipid profiling of tissue-specific insulin resistance in human obesity. Int. J. Obes. 2019, 43, 989–998. [Google Scholar] [CrossRef]
  11. Valsesia, A.; Saris, W.H.; Astrup, A.; Hager, J.; Masoodi, M. Distinct lipid profiles predict improved glycemic control in obese, nondiabetic patients after a low-caloric diet intervention: The Diet, Obesity and Genes randomized trial. Am. J. Clin. Nutr. 2016, 104, 566–575. [Google Scholar] [CrossRef] [Green Version]
  12. Wadden, T.A.; Neiberg, R.H.; Wing, R.R.; Clark, J.M.; Delahanty, L.M.; Hill, J.O.; Krakoff, J.; Otto, A.; Ryan, D.H.; Vitolins, M.Z.; et al. Four-Year Weight Losses in the Look AHEAD Study: Factors Associated with Long-Term Success. Obesity 2011, 19, 1987–1998. [Google Scholar] [CrossRef] [Green Version]
  13. Christensen, P.; Larsen, T.M.; Westerterp-Plantenga, M.; Macdonald, I.; Martinez, J.A.; Handjiev, S.; Poppitt, S.; Hansen, S.; Ritz, C.; Astrup, A.; et al. Men and women respond differently to rapid weight loss: Metabolic outcomes of a multi-centre intervention study after a low-energy diet in 2500 overweight, individuals with pre-diabetes (PREVIEW). Diabetes Obes. Metab. 2018, 20, 2840–2851. [Google Scholar] [CrossRef] [PubMed] [Green Version]
  14. Navas-Carretero, S.; Holst, C.; Saris, W.H.; Van Baak, M.A.; Jebb, S.A.; Kafatos, A.; Papadaki, A.; Pfeiffer, A.F.H.; Handjieva-Darlenska, T.; Hlavaty, P.; et al. The Impact of Gender and Protein Intake on the Success of Weight Maintenance and Associated Cardiovascular Risk Benefits, Independent of the Mode of Food Provision: The DiOGenes Randomized Trial. J. Am. Coll. Nutr. 2016, 35, 20–30. [Google Scholar] [CrossRef] [PubMed]
  15. Trouwborst, I.; Bowser, S.M.; Goossens, G.H.; Blaak, E.E. Ectopic Fat Accumulation in Distinct Insulin Resistant Phenotypes; Targets for Personalized Nutritional Interventions. Front. Nutr. 2018, 5, 77. [Google Scholar] [CrossRef] [PubMed]
  16. Larsen, T.M.; Dalskov, S.; Van Baak, M.; Jebb, S.; Kafatos, A.; Pfeiffer, A.; Martinez, J.A.; Handjieva-Darlenska, T.; Kuneå¡ovã¡, M.; Holst, C.; et al. The Diet, Obesity and Genes (Diogenes) Dietary Study in eight European countries a comprehensive design for long-term intervention. Obes. Rev. 2009, 11, 76–91. [Google Scholar] [CrossRef] [PubMed]
  17. Larsen, T.M.; Dalskov, S.-M.; Van Baak, M.; Jebb, S.A.; Papadaki, A.; Pfeiffer, A.F.; Martinez, J.A.; Handjieva-Darlenska, T.; Kunešová, M.; Pihlsgård, M.; et al. Diets with High or Low Protein Content and Glycemic Index for Weight-Loss Maintenance. N. Engl. J. Med. 2010, 363, 2102–2113. [Google Scholar] [CrossRef] [Green Version]
  18. Baecke, J.; Burema, J.; Frijters, J.E. A short questionnaire for the measurement of habitual physical activity in epidemiological studies. Am. J. Clin. Nutr. 1982, 36, 936–942. [Google Scholar] [CrossRef]
  19. Abdul-Ghani, M.A.; Matsuda, M.; Balas, B.; DeFronzo, R.A. Muscle and Liver Insulin Resistance Indexes Derived from the Oral Glucose Tolerance Test. Diabetes Care 2006, 30, 89–94. [Google Scholar] [CrossRef] [Green Version]
  20. Vogelzangs, N.; The Diogenes Consortium; Van Der Kallen, C.J.H.; Van Greevenbroek, M.M.J.; Van Der Kolk, B.W.; Jocken, J.W.E.; Goossens, G.H.; Schaper, N.C.; Henry, R.M.A.; Eussen, S.J.P.M.; et al. Metabolic profiling of tissue-specific insulin resistance in human obesity: Results from the Diogenes study and the Maastricht Study. Int. J. Obes. 2020, 44, 1376–1386. [Google Scholar] [CrossRef] [PubMed]
  21. Gastaldelli, A.; Gaggini, M.; DeFronzo, R.A. Role of Adipose Tissue Insulin Resistance in the Natural History of Type 2 Diabetes: Results from the San Antonio Metabolism Study. Diabetes 2017, 66, 815–822. [Google Scholar] [CrossRef] [Green Version]
  22. Valsesia, A.; Chakrabarti, A.; Hager, J.; Langin, D.; Saris, W.H.M.; Astrup, A.; Blaak, E.E.; Viguerie, N.; Masoodi, M. Integrative phenotyping of glycemic responders upon clinical weight loss using multi-omics. Sci. Rep. 2020, 10, 1–14. [Google Scholar] [CrossRef]
  23. Hu, C.; van Dommelen, J.; van der Heijden, R.; Spijksma, G.; Reijmers, T.H.; Wang, M.; Slee, E.; Lu, X.; Xu, G.; van der Greef, J.; et al. RPLC-Ion-Trap-FTMS Method for Lipid Profiling of Plasma: Method Validation and Application to p53 Mutant Mouse Model. J. Proteome Res. 2008, 7, 4982–4991. [Google Scholar] [CrossRef] [PubMed]
  24. Szymańska, E.; van Dorsten, F.A.; Troost, J.; Paliukhovich, I.; van Velzen, E.J.J.; Hendriks, M.M.W.B.; Trautwein, E.A.; van Duynhoven, J.P.M.; Vreeken, R.J.; Smilde, A.K. A lipidomic analysis approach to evaluate the response to cholesterol-lowering food intake. Metabolomics 2012, 8, 894–906. [Google Scholar] [CrossRef] [PubMed] [Green Version]
  25. Hjorth, M.F.; Ritz, C.; Blaak, E.; Saris, W.H.; Langin, D.; Poulsen, S.K.; Larsen, T.M.; Sørensen, T.I.; Zohar, Y.; Astrup, A. Pretreatment fasting plasma glucose and insulin modify dietary weight loss success: Results from 3 randomized clinical trials. Am. J. Clin. Nutr. 2017, 106, 499–505. [Google Scholar] [CrossRef] [Green Version]
  26. Berger, S.E.; Huggins, G.S.; McCaffery, J.M.; Jacques, P.F.; Lichtenstein, A.H. Change in Cardiometabolic Risk Factors Associated with Magnitude of Weight Regain 3 Years After a 1-Year Intensive Lifestyle Intervention in Type 2 Diabetes Mellitus: The Look AHEAD Trial. J. Am. Hear. Assoc. 2019, 8, e010951. [Google Scholar] [CrossRef]
  27. Vistisen, B.; Hellgren, L.; Vadset, T.; Scheede-Bergdahl, C.; Helge, J.W.; Dela, F.; Stallknecht, B.M. Effect of gender on lipid-induced insulin resistance in obese subjects. Eur. J. Endocrinol. 2008, 158, 61–68. [Google Scholar] [CrossRef] [Green Version]
  28. Frias, J.P.; Macaraeg, G.B.; Ofrecio, J.; Yu, J.G.; Olefsky, J.M.; Kruszynska, Y.T. Decreased Susceptibility to Fatty Acid–Induced Peripheral Tissue Insulin Resistance in Women. Diabetes 2001, 50, 1344–1350. [Google Scholar] [CrossRef] [Green Version]
  29. Schorr, M.; Dichtel, L.E.; Gerweck, A.V.; Valera, R.D.; Torriani, M.; Miller, K.K.; Bredella, M.A. Sex differences in body composition and association with cardiometabolic risk. Biol. Sex Differ. 2018, 9, 28. [Google Scholar] [CrossRef]
  30. Gasteyger, C.; Larsen, T.M.; Vercruysse, F.; Pedersen, D.; Toubro, S.; Astrup, A. Visceral fat loss induced by a low-calorie diet: A direct comparison between women and men. Diabetes, Obes. Metab. 2009, 11, 596–602. [Google Scholar] [CrossRef] [PubMed]
  31. Wirth, A.; Steinmetz, B. Gender Differences in Changes in Subcutaneous and Intra-abdominal Fat during Weight Reduction: An Ultrasound Study. Obes. Res. 1998, 6, 393–399. [Google Scholar] [CrossRef] [PubMed]
  32. Machann, J.; Thamer, C.; Stefan, N.; Schwenzer, N.F.; Kantartzis, K.; Häring, H.-U.; Claussen, C.D.; Fritsche, A.; Schick, F. Follow-up Whole-Body Assessment of Adipose Tissue Compartments during a Lifestyle Intervention in a Large Cohort at Increased Risk for Type 2 Diabetes. Radiology 2010, 257, 353–363. [Google Scholar] [CrossRef] [Green Version]
  33. Bosy-Westphal, A.; Schautz, B.; Lagerpusch, M.; Pourhassan, M.; Braun, W.; Goele, K.; Heller, M.; Glüer, C.-C.; Müller, M.J. Effect of weight loss and regain on adipose tissue distribution, composition of lean mass and resting energy expenditure in young overweight and obese adults. Int. J. Obes. 2013, 37, 1371–1377. [Google Scholar] [CrossRef] [PubMed] [Green Version]
  34. Kwon, H.; Kim, D.; Kim, J.S. Body Fat Distribution and the Risk of Incident Metabolic Syndrome: A Longitudinal Cohort Study. Sci. Rep. 2017, 7, 1–8. [Google Scholar] [CrossRef] [Green Version]
  35. Lee, M.-J.; Wu, Y.; Fried, S.K. Adipose tissue heterogeneity: Implication of depot differences in adipose tissue for obesity complications. Mol. Asp. Med. 2013, 34, 1–11. [Google Scholar] [CrossRef] [PubMed] [Green Version]
  36. Virtue, S.; Vidal-Puig, A. Adipose tissue expandability, lipotoxicity and the Metabolic SyndromeߞAn allostatic perspective. Biochim. Biophys. Acta 2010, 1801, 338–349. [Google Scholar] [CrossRef]
  37. Ibrahim, M.M. Subcutaneous and visceral adipose tissue: Structural and functional differences. Obes. Rev. 2010, 11, 11–18. [Google Scholar] [CrossRef]
  38. Jensen, M.D. Is Visceral Fat Involved in the Pathogenesis of the Metabolic Syndrome? Human Model. Obesity 2006, 14, 20S–24S. [Google Scholar] [CrossRef] [Green Version]
  39. Barber, M.N.; Risis, S.; Yang, C.; Meikle, P.J.; Staples, M.; Febbraio, M.A.; Bruce, C.R. Plasma Lysophosphatidylcholine Levels Are Reduced in Obesity and Type 2 Diabetes. PLoS ONE 2012, 7, e41456. [Google Scholar] [CrossRef] [Green Version]
  40. Rauschert, S.; Uhl, O.; Koletzko, B.; Mori, T.A.; Beilin, L.J.; Oddy, W.H.; Hellmuth, C. Sex differences in the association of phospholipids with components of the metabolic syndrome in young adults. Biol. Sex Differ. 2017, 8, 1–13. [Google Scholar] [CrossRef] [Green Version]
  41. Hannun, Y.A.; Obeid, L.M. Sphingolipids and their metabolism in physiology and disease. Nat. Rev. Mol. Cell Biol. 2018, 19, 175–191. [Google Scholar] [CrossRef] [PubMed]
Figure 1. Schematic overview of participant inclusion and study design of the DiOGenes study. %F = percentage of females.
Nutrients 13 01588 g001
Figure 2. Mean metabolic changes in men and women following an 8-week weight loss phase (from CID1 to CID2) and after 6 months of weight maintenance (CID2 to CID3) ± standard error. Change in weight (A), fasting glucose (B), glucose t = 120, |(C), HOMA-IR (D), HIRI (E), MISI (F), ATIRI (G), TAG (H), FFA (I), cholesterol (J), HDL (K), LDL (L), CRP (M), adiponectin (N), SBP (O) and DBP(P) are presented.The black line represents men and the dotted line represents women. * Indicates a significant difference in change between men and women (q < 0.05) in a linear mixed model corrected for age, body weight (changes) and baseline differences.
Nutrients 13 01588 g002
Figure 3. Standardized Beta’s ± 95% confidence interval (CI) for the association between sex and the change in lipid groups following weight loss (from CID1 to CID2) (A) and after 6 months of weight maintenance (from CID2 to CID3) (B). A negative Standardized Beta indicates a greater decrease (A) or smaller increase in women (B) compared to men and vice versa. * Indicates a significant difference in change between men and women (q < 0.05 (=False Discovery Rate p-Value)) in a linear mixed model corrected for age, body weight (changes) and baseline differences.
Nutrients 13 01588 g003
Table 1. Participant characteristics.
nMenWomenTotal Groupp-Value
Sex (%)78235.364.7 *100<0.001
Age (years)78242.5 ± 6.041.0 ± 6.3 *41.5 ± 6.260.001
BMI (kg/m2)78234.3 ± 0.534.5 ± 5.034.4 ± 4.90.108
Body weight (kg)
 CID1782109.3 ± 17.495.0 ± 15.6 *100.1 ± 17.6<0.001
 Weight loss CID2-CID1782−12.8 ± 3.9−10.1 ± 2.8 *−11.0 ± 3.50<0.001
 Weight maintenance CID3-CID25551.6 ± 5.3−0.5 ± 5.5 *0.5 ± 5.48<0.001
Physical activity (Baecke)7187.9 ± 0.98.0 ± 0.98.0 ± 0.90.090
Waist:hip ratio7691.01 ± 0.050.88 ± 0.07 *0.92 ± 0.09<0.001
Systolic BP (mmHg)758132.0 ± 12.8121.9 ± 14.4 *118.2 ± 13.3<0.001
Diastolic BP (mmHg)75881.4 ± 10.675.9 ± 10.6 *72.49 ± 9.72<0.001
Fasting glucose (mmol/L)7495.27 ± 0.625.00 ± 0.66 *5.10 ± 0.66<0.001
2 hr glucose (mmol/L)7416.58 ± 2.376.74 ± 2.026.68 ± 2.160.333
Fasting insulin (μIU/mL)72313.9 ± 11.310.5 ± 9.4 *11.7 ± 10.3<0.001
HOMA-IR (A.U.)7333.87 ± 3.232.77 ± 2.64 *3.16 ± 2.91<0.001
MISI (A.U.)6490.063 ± 0.0520.060 ± 0.0520.061 ± 0.0520.488
HIRI (A.U.) 686144.8 ± 101.898.9 ± 76.0 *115.9 ± 89.1<0.001
ATIRI (A.U.)7207.92 ± 8.957.69 ± 8.387.72 ± 8.610.625
Total cholesterol (mmol/L)7685.05 ± 1.084.84 ± 0.96 *4.92 ± 1.010.008
HDL cholesterol (mmol/L)7701.07 ± 0.281.29 ± 0.33 *1.21 ± 0.33<0.001
LDL cholesterol (mmol/L)7643.24 ± 0.933.00 ± 0.84 *3.08 ± 0.88<0.001
TAG (mmol/L)7591.60 ± 0.701.23 ± 0.57 *1.36 ± 0.64<0.001
FFA (μmol/L)672552.3 ± 281.6711.54 ± 326.7 *646.8 ± 318.7<0.001
C-reactive protein (mg/L)7473.78 ± 3.184.54 ± 4.13 *4.12 ± 3.86<0.001
Adiponectin (μg/mL) 7687.46 ± 3.179.96 ± 4.71 *9.08 ± 4.40<0.001
Values are represented as mean ± standard deviation (SD) unless otherwise indicated. * Significant difference compared to men (p < 0.05) CID: clinical investigation day, CID1: baseline measurements, CID2: measurements following the weight loss phase, CID3 measurements following the weight maintenance, BP = blood pressure, HOMA-IR = homeostatic model assessment for insulin resistance, MISI = muscle insulin sensitivity index, HIRI = hepatic insulin resistance index, ATIRI = adipose tissue insulin resistance index, TAG = triacylglycerol, FFA = free fatty acid.
Table 2. Relative abundance individual lipid groups at baseline (CID1).
Men
(n = 258)
Women
(n = 474)
Total Group
(n = 732)
p-Value
TAG50.9 ± 8.244.8 ± 8.9 *47.0 ± 9.2<0.001
 Odd5.7 ± 1.16.4 ± 1.3 *6.2 ± 1.3<0.001
 even94.3 ± 1.193.6 ± 1.3 *93.8 ± 1.3<0.001
 Sat2.5 ± 1.12.3 ± 1.0 *2.4 ± 1.070.022
 Usat76.0 ± 5.276.2 ± 5.676.1 ± 5.40.649
 Psat21.5 ± 5.721.5 ± 6.021.5 ± 5.90.992
 Long95.6 ± 1.295.9 ± 1.3 *95.8 ± 1.30.004
 very long4.4 ± 1.24.1 ± 1.3 *4.2 ± 1.30.004
DAG0.040 ± 0.0140.037 ± 0.015 *0.038 ± 0.0150.047
CholE0.13 ± 0.040.15 ± 0.04 *0.14 ± 0.04<0.001
LPC5.7 ± 1.55.8 ± 1.85.8 ± 1.70.758
LPCO0.035 ± 0.0110.037 ± 0.0140.036 ± 0.0130.098
LPE0.033 ± 0.014 0.037 ± 0.018 *0.036 ± 0.0130.003
PC34.1 ± 5.438.6 ± 5.9 *37.0 ± 6.1<0.001
PCO1.33 ± 0.421.45 ± 0.43 *1.40 ± 0.43<0.001
PE1.73 ± 0.432.08 ± 0.50 *1.95 ± 0.51<0.001
PEO0.37 ± 0.150.34 ± 0.12 *0.35 ± 0.130.047
SM5.6 ± 1.46.6 ± 1.7 *6.3 ± 1.6<0.001
Lipid groups are represented as percentage of all lipids ± standard deviation (SD) except for TAG subgroups who are expressed as percentage of total TAG ± SD. * Significant difference compared to men (p < 0.05). TAG = triacylglycerol (n = 55), TAGodd = with an odd number of carbon atoms, TAGeven = with an even number of carbon atoms, TAGsat = without double bonds, TAGusat = with 1–3 double bonds, TAGpsat = with ≥4 double bonds, TAGlong = with <56 carbon atoms, TAGverylong = with ≥56 carbon atoms, DAG = diacylglycerols (n = 2), CholE = cholesterol esters (n = 3), LPC = lysophosphatidylcholine (n = 11), LPCO = lysoalkylphosphatidylcholine (n = 2), LPE = lysophosphatidylethanolamine (n = 1), PC = phosphatidylcholine (n = 25), PCO = alkyl-phosphatidylcholine (n = 15), PE = phosphatidylethanolamine (n = 3), PEO = alkylphosphatidylethanolamine (n = 3) and SM = sphingomyelins (n = 20).
Publisher’s Note: MDPI stays neutral with regard to jurisdictional claims in published maps and institutional affiliations.

