

Multi-Modal Design, Synthesis, and Biological Evaluation of Novel Fusidic Acid Derivatives

 and
and
Abstract
1. Introduction
2. Results and Discussion
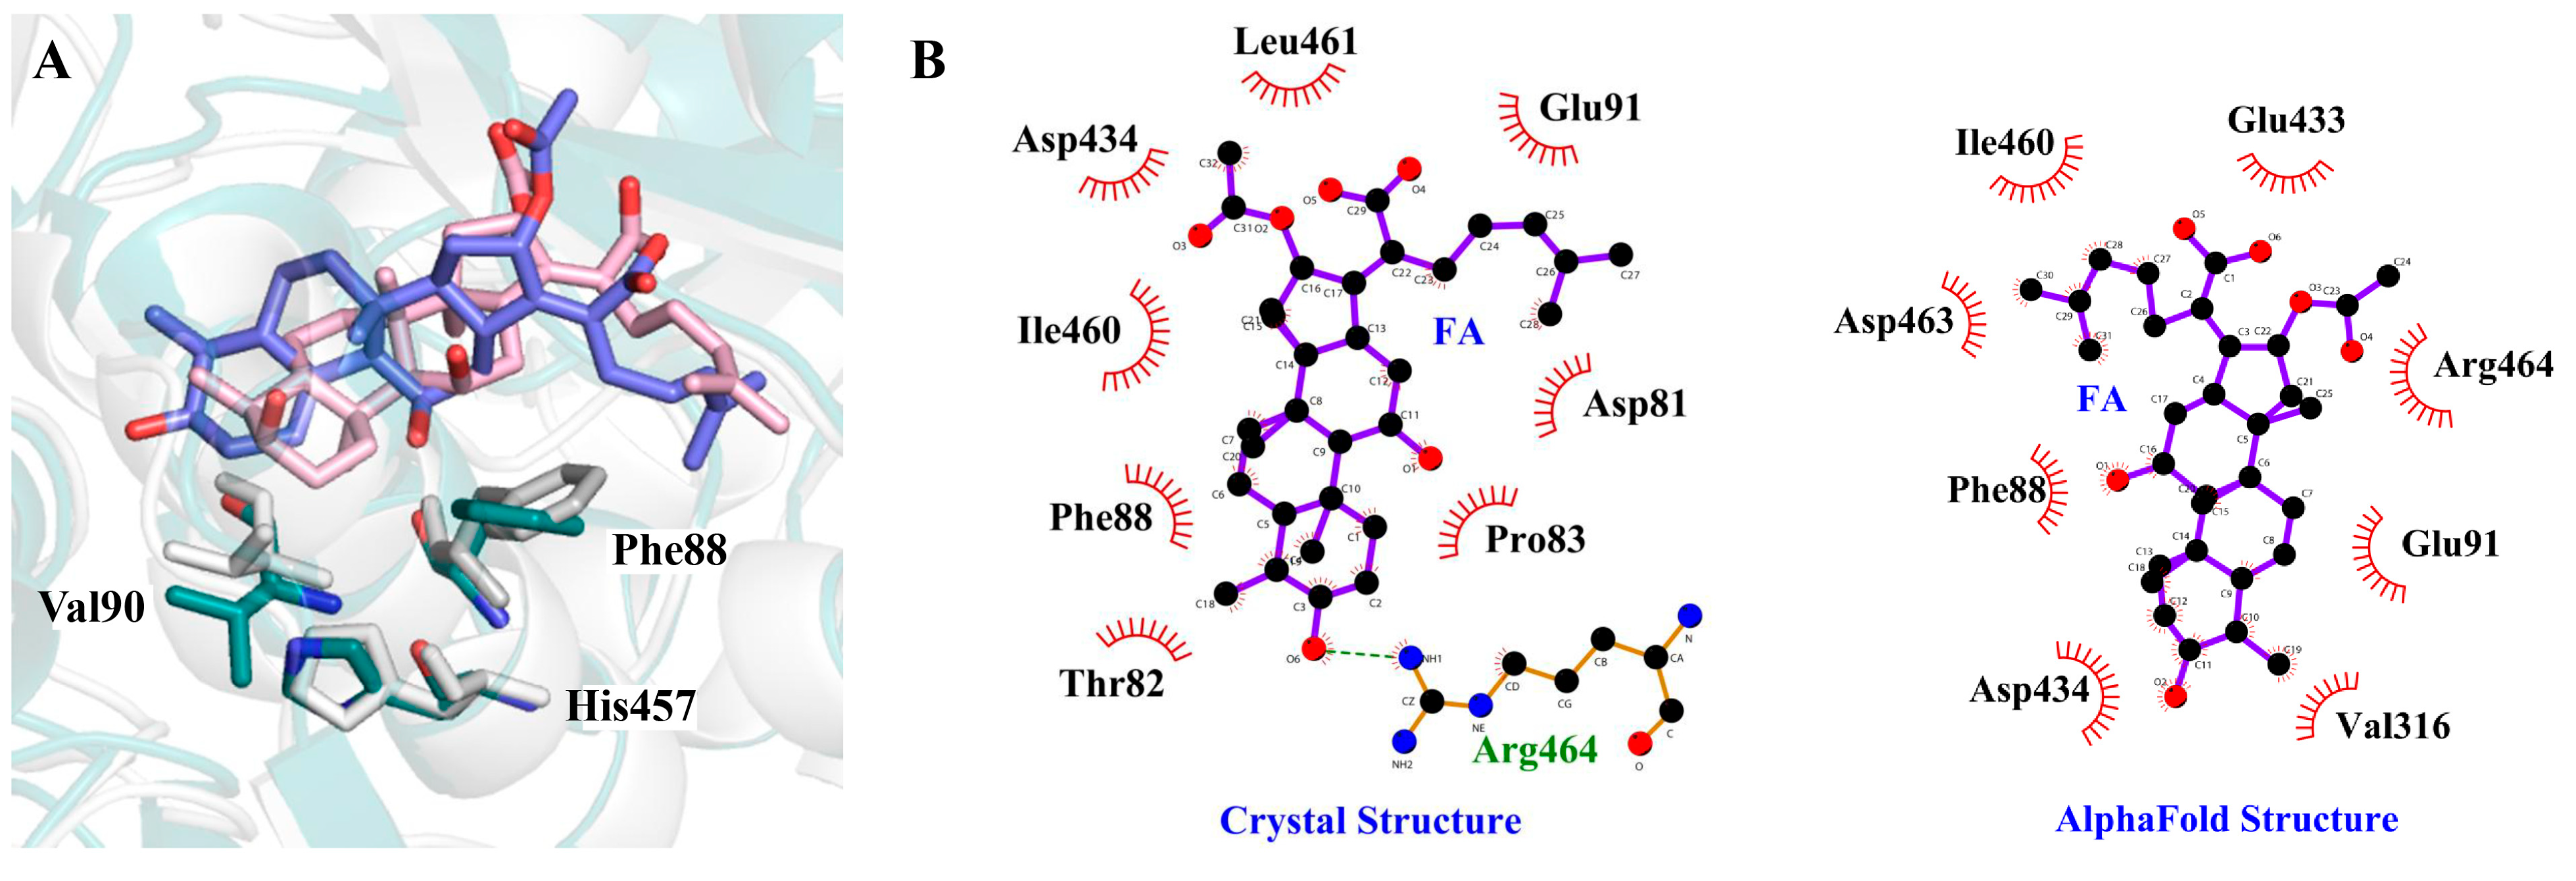
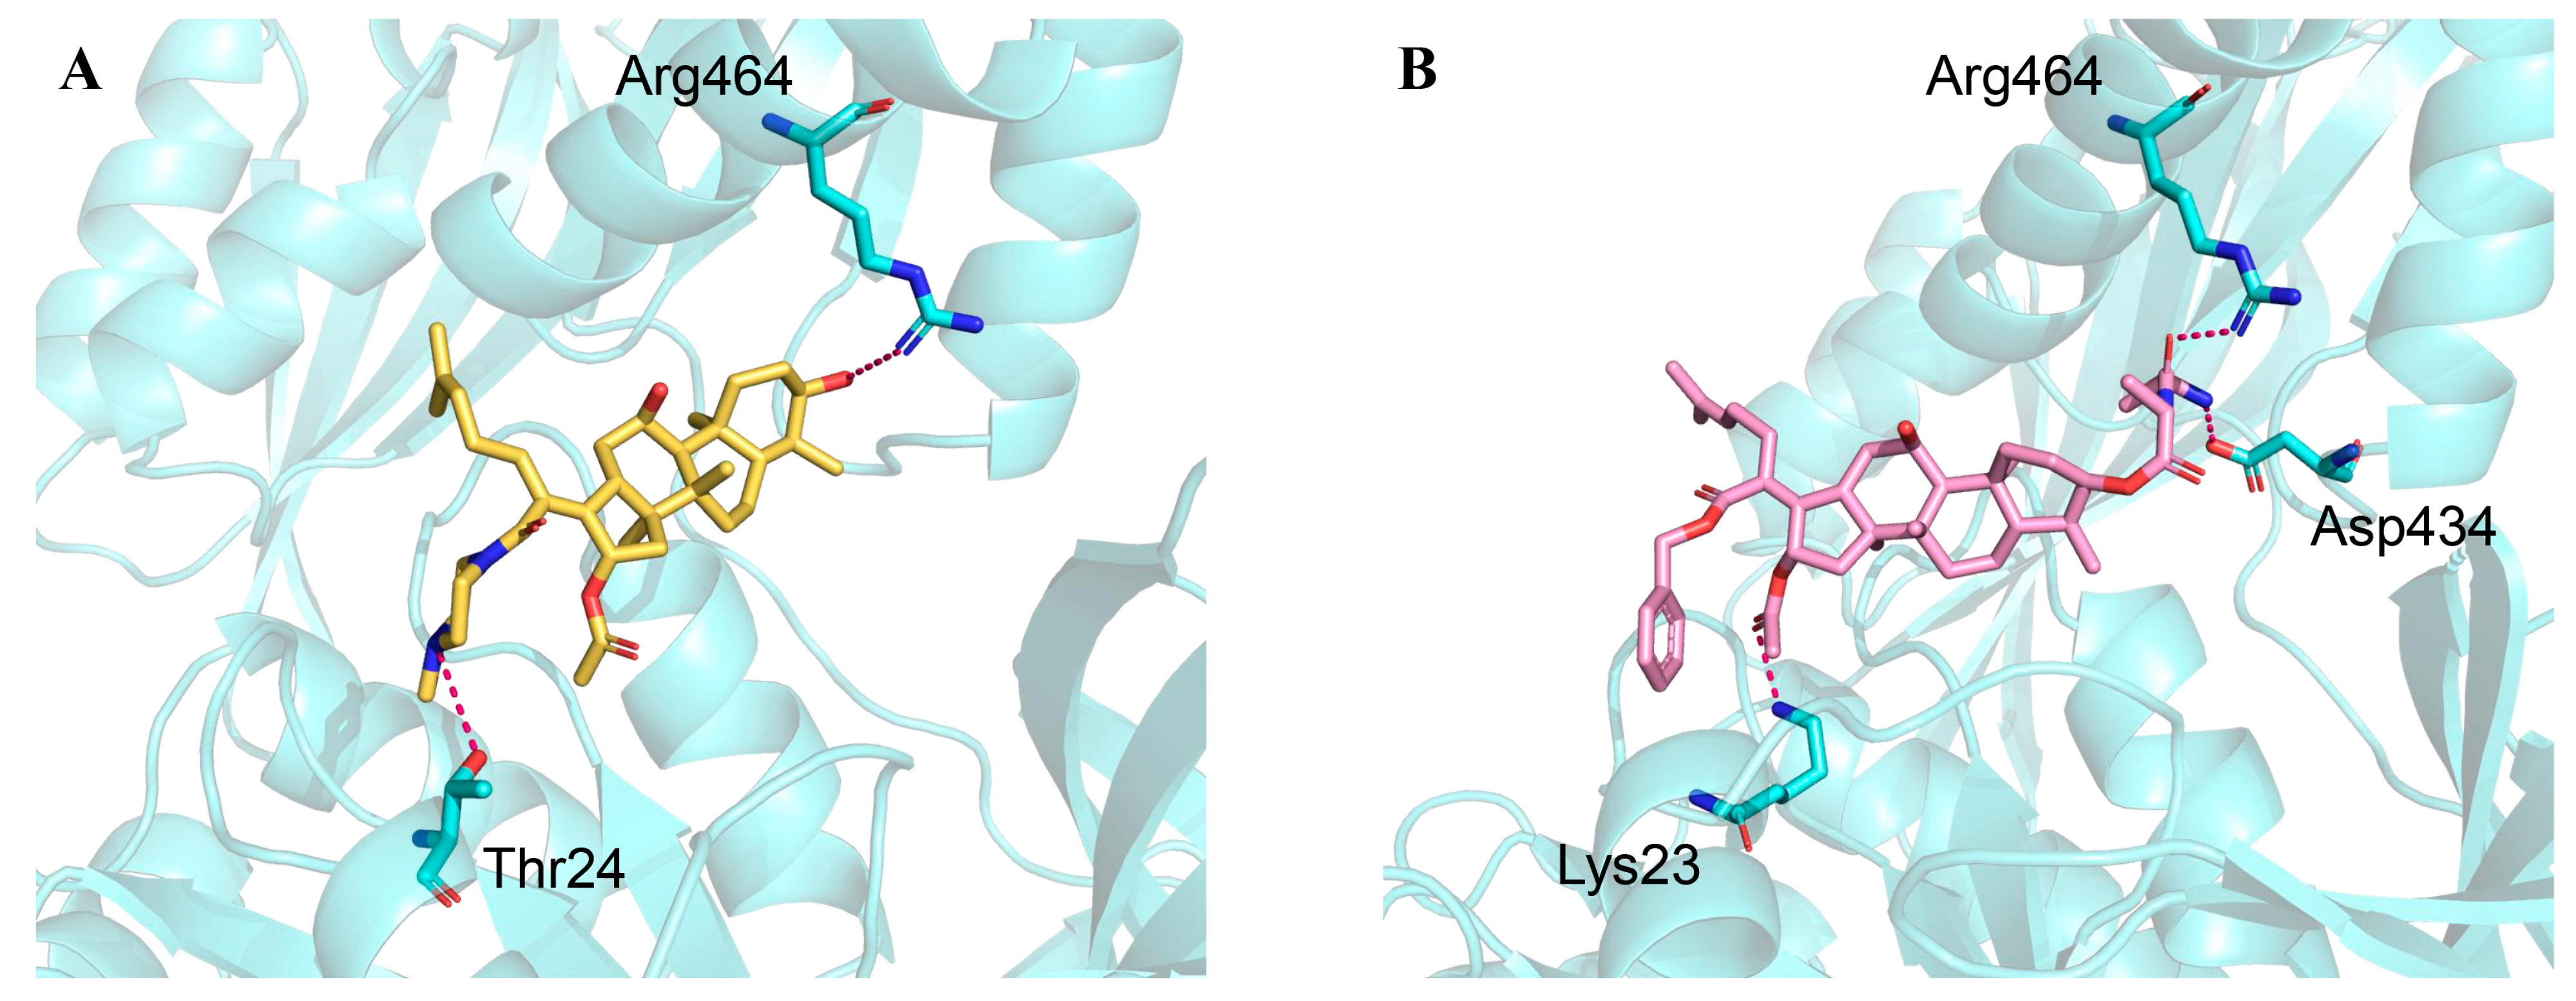
2.1. Structural Basis of EF-G∙FA
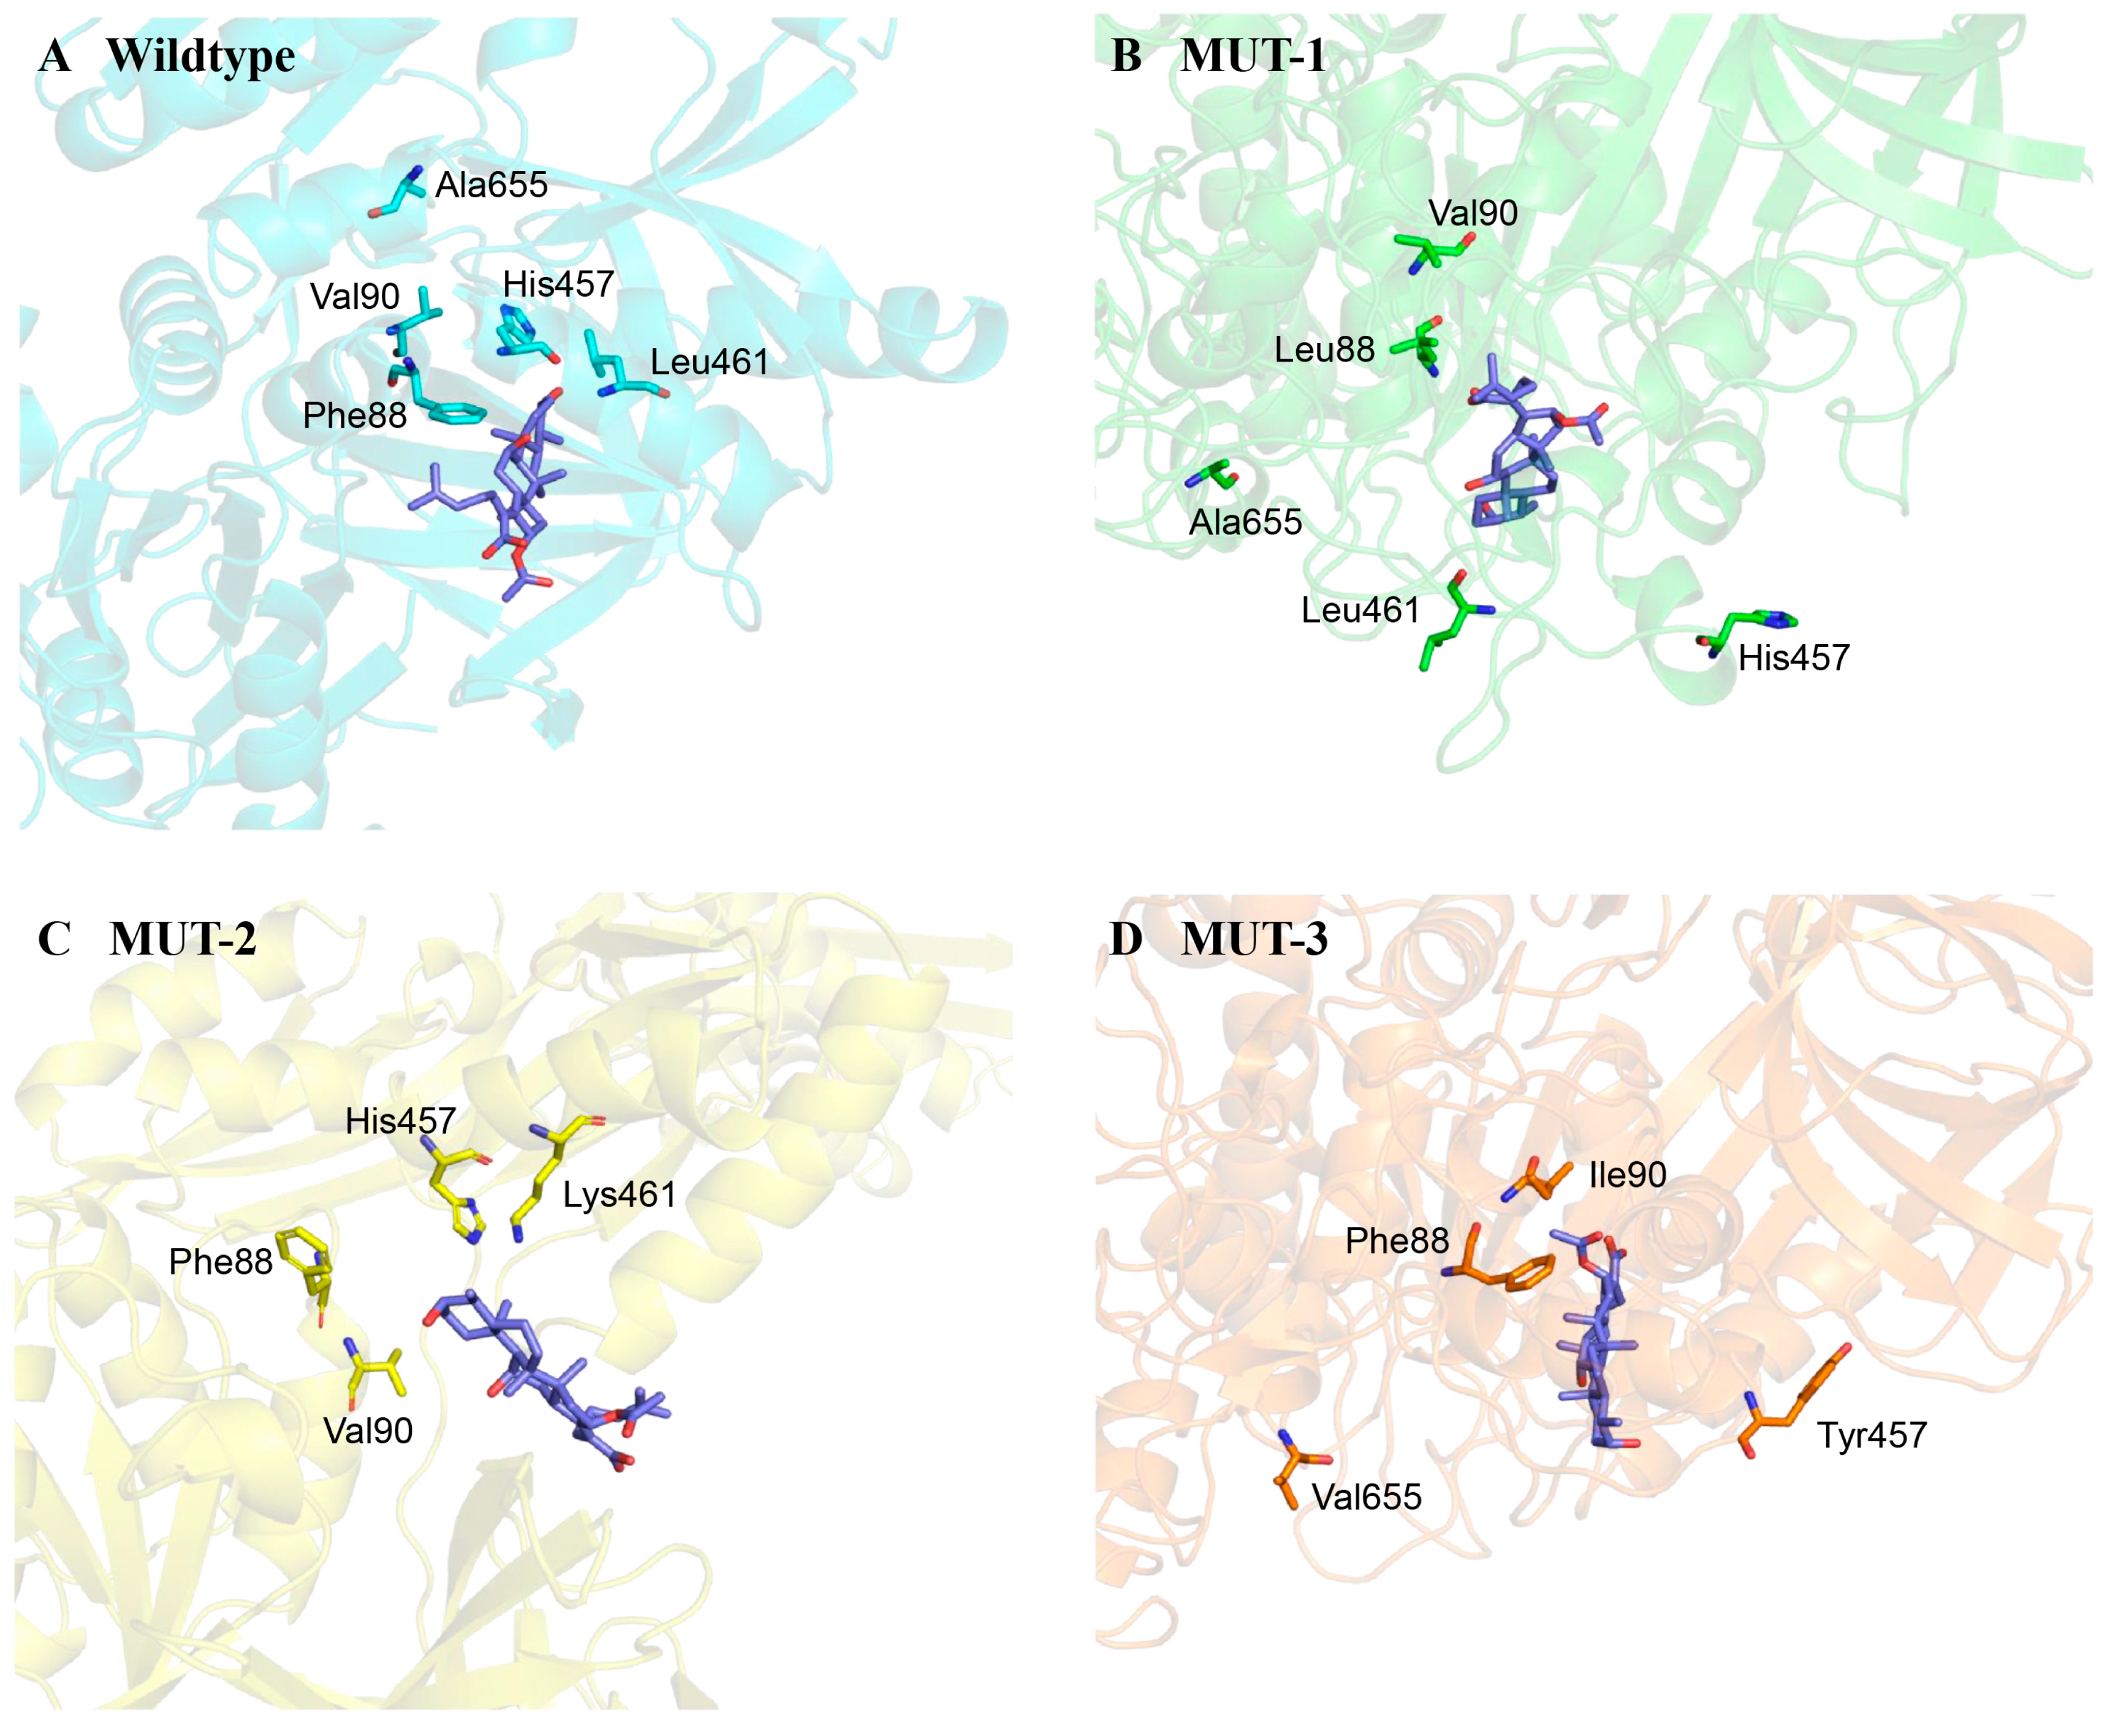
2.2. Comparison Between Wildtype and Mutant EF-Gs
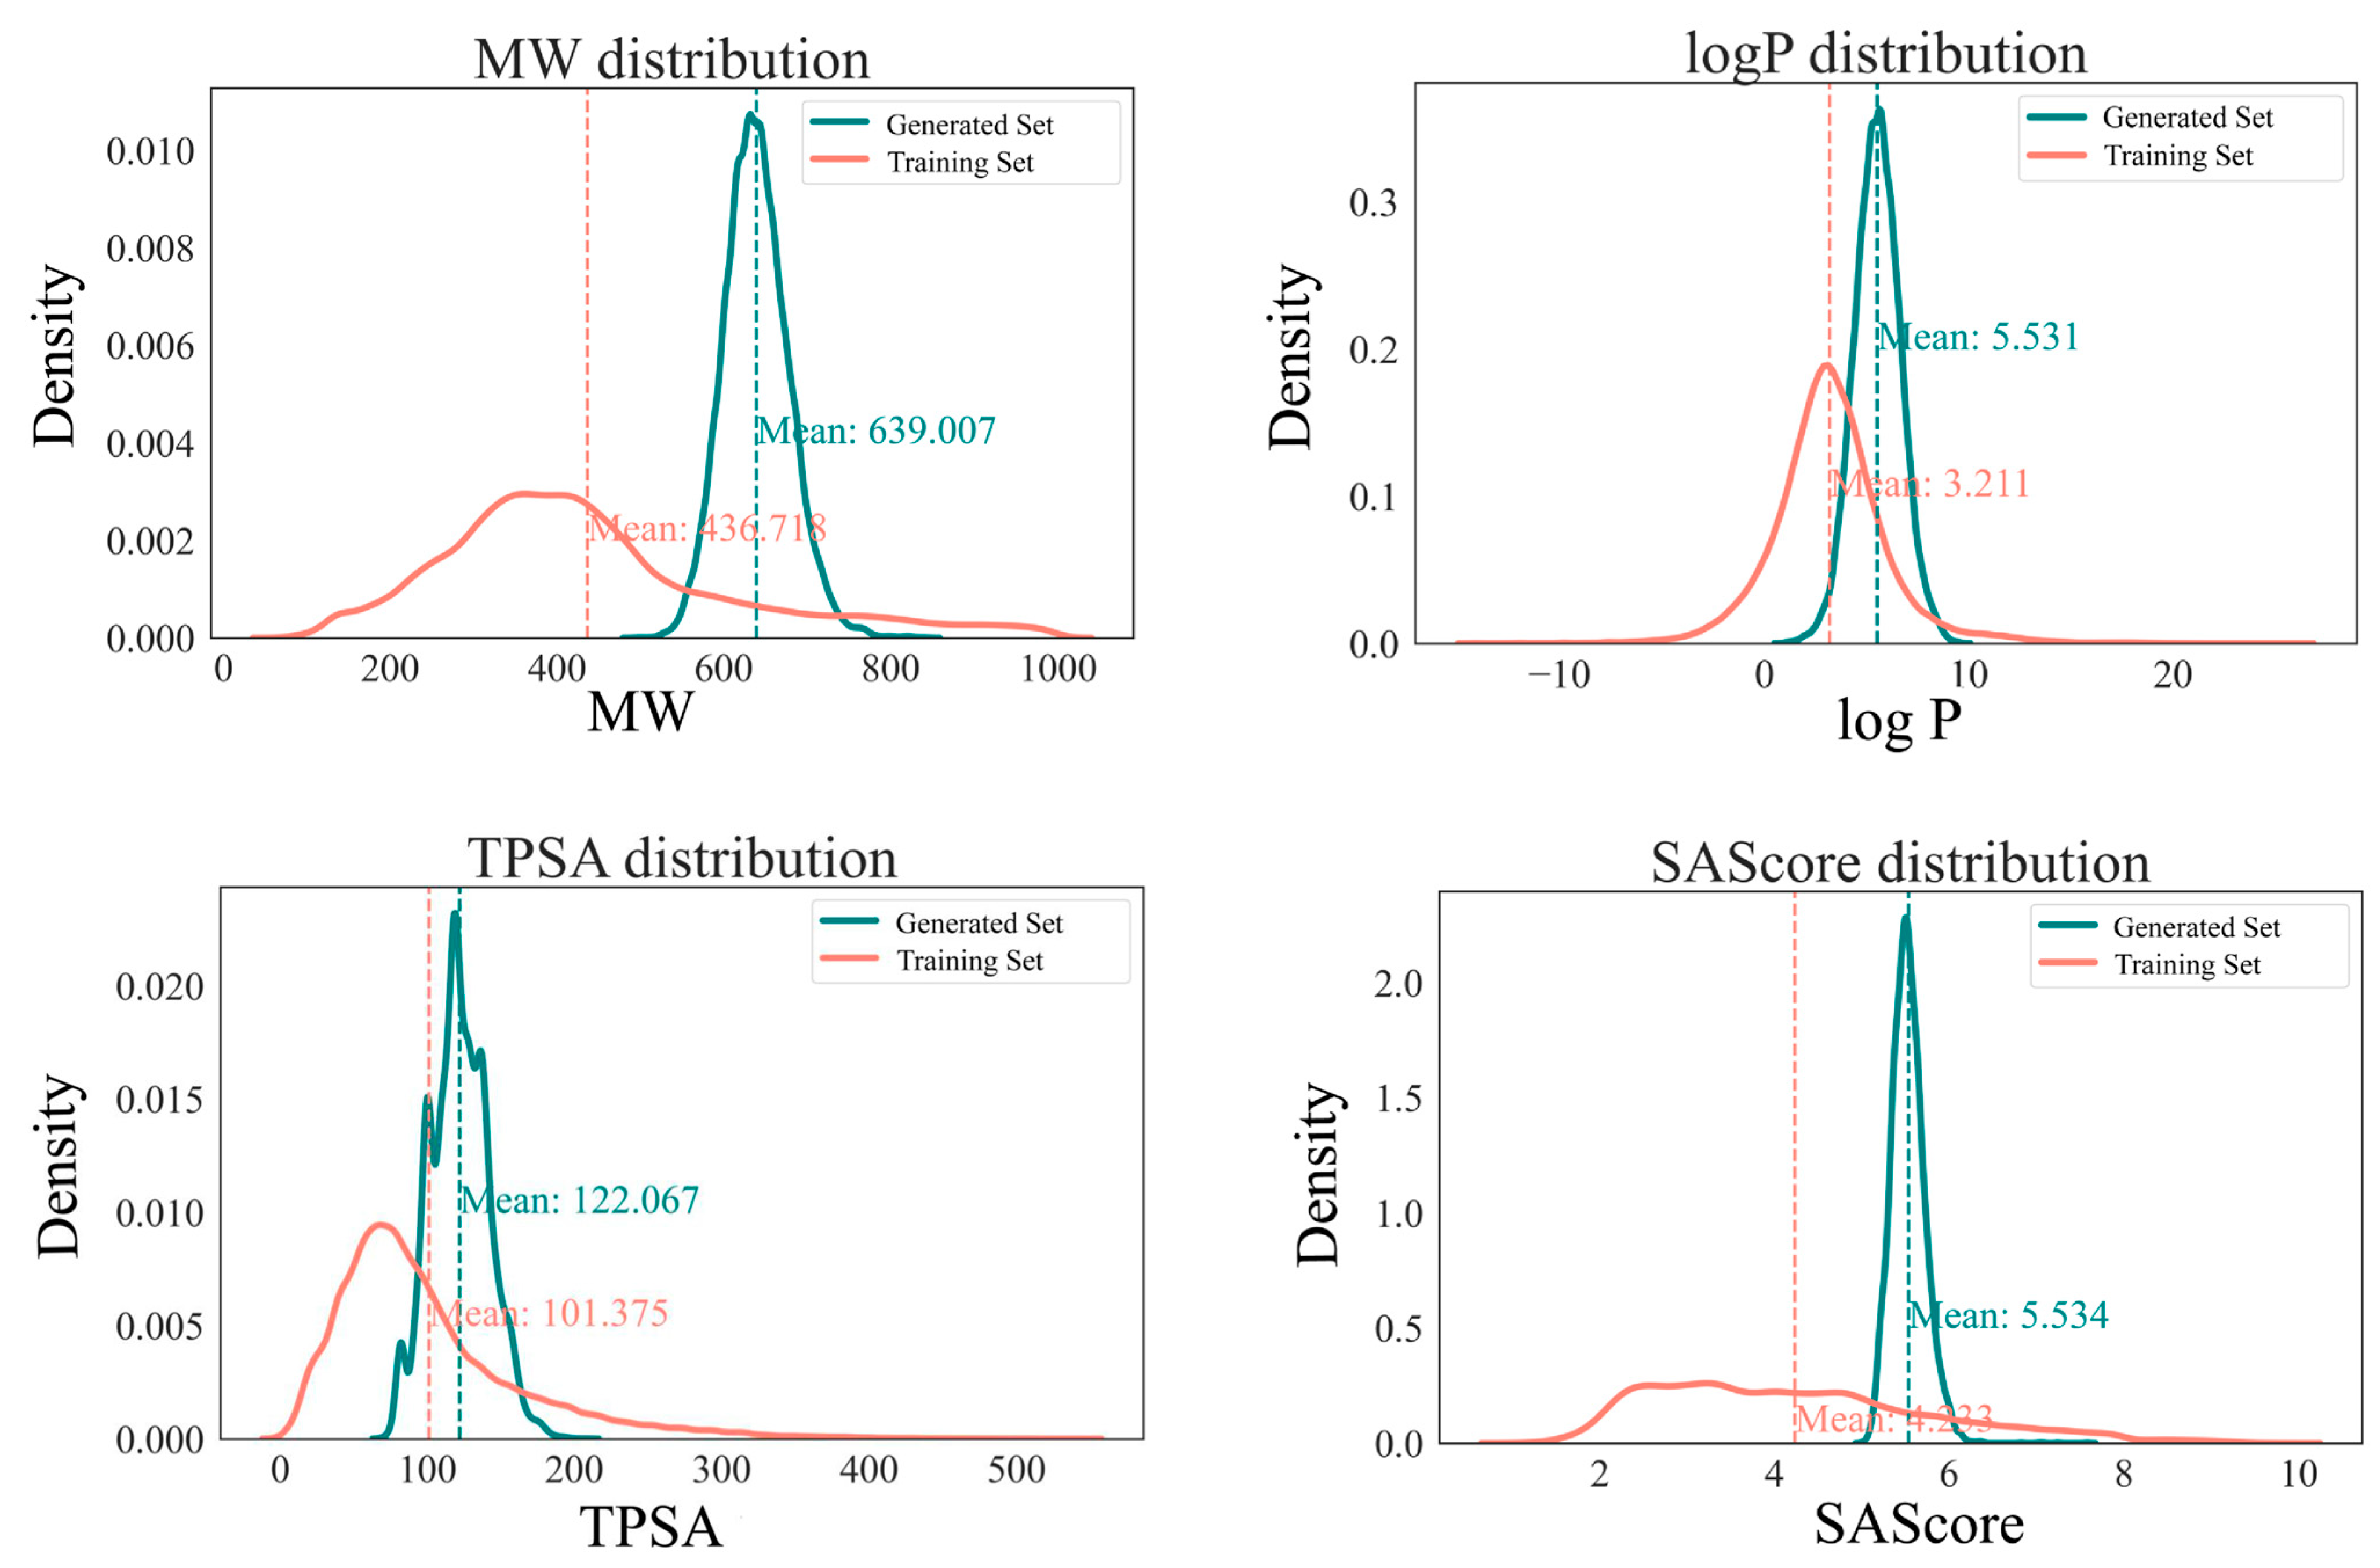
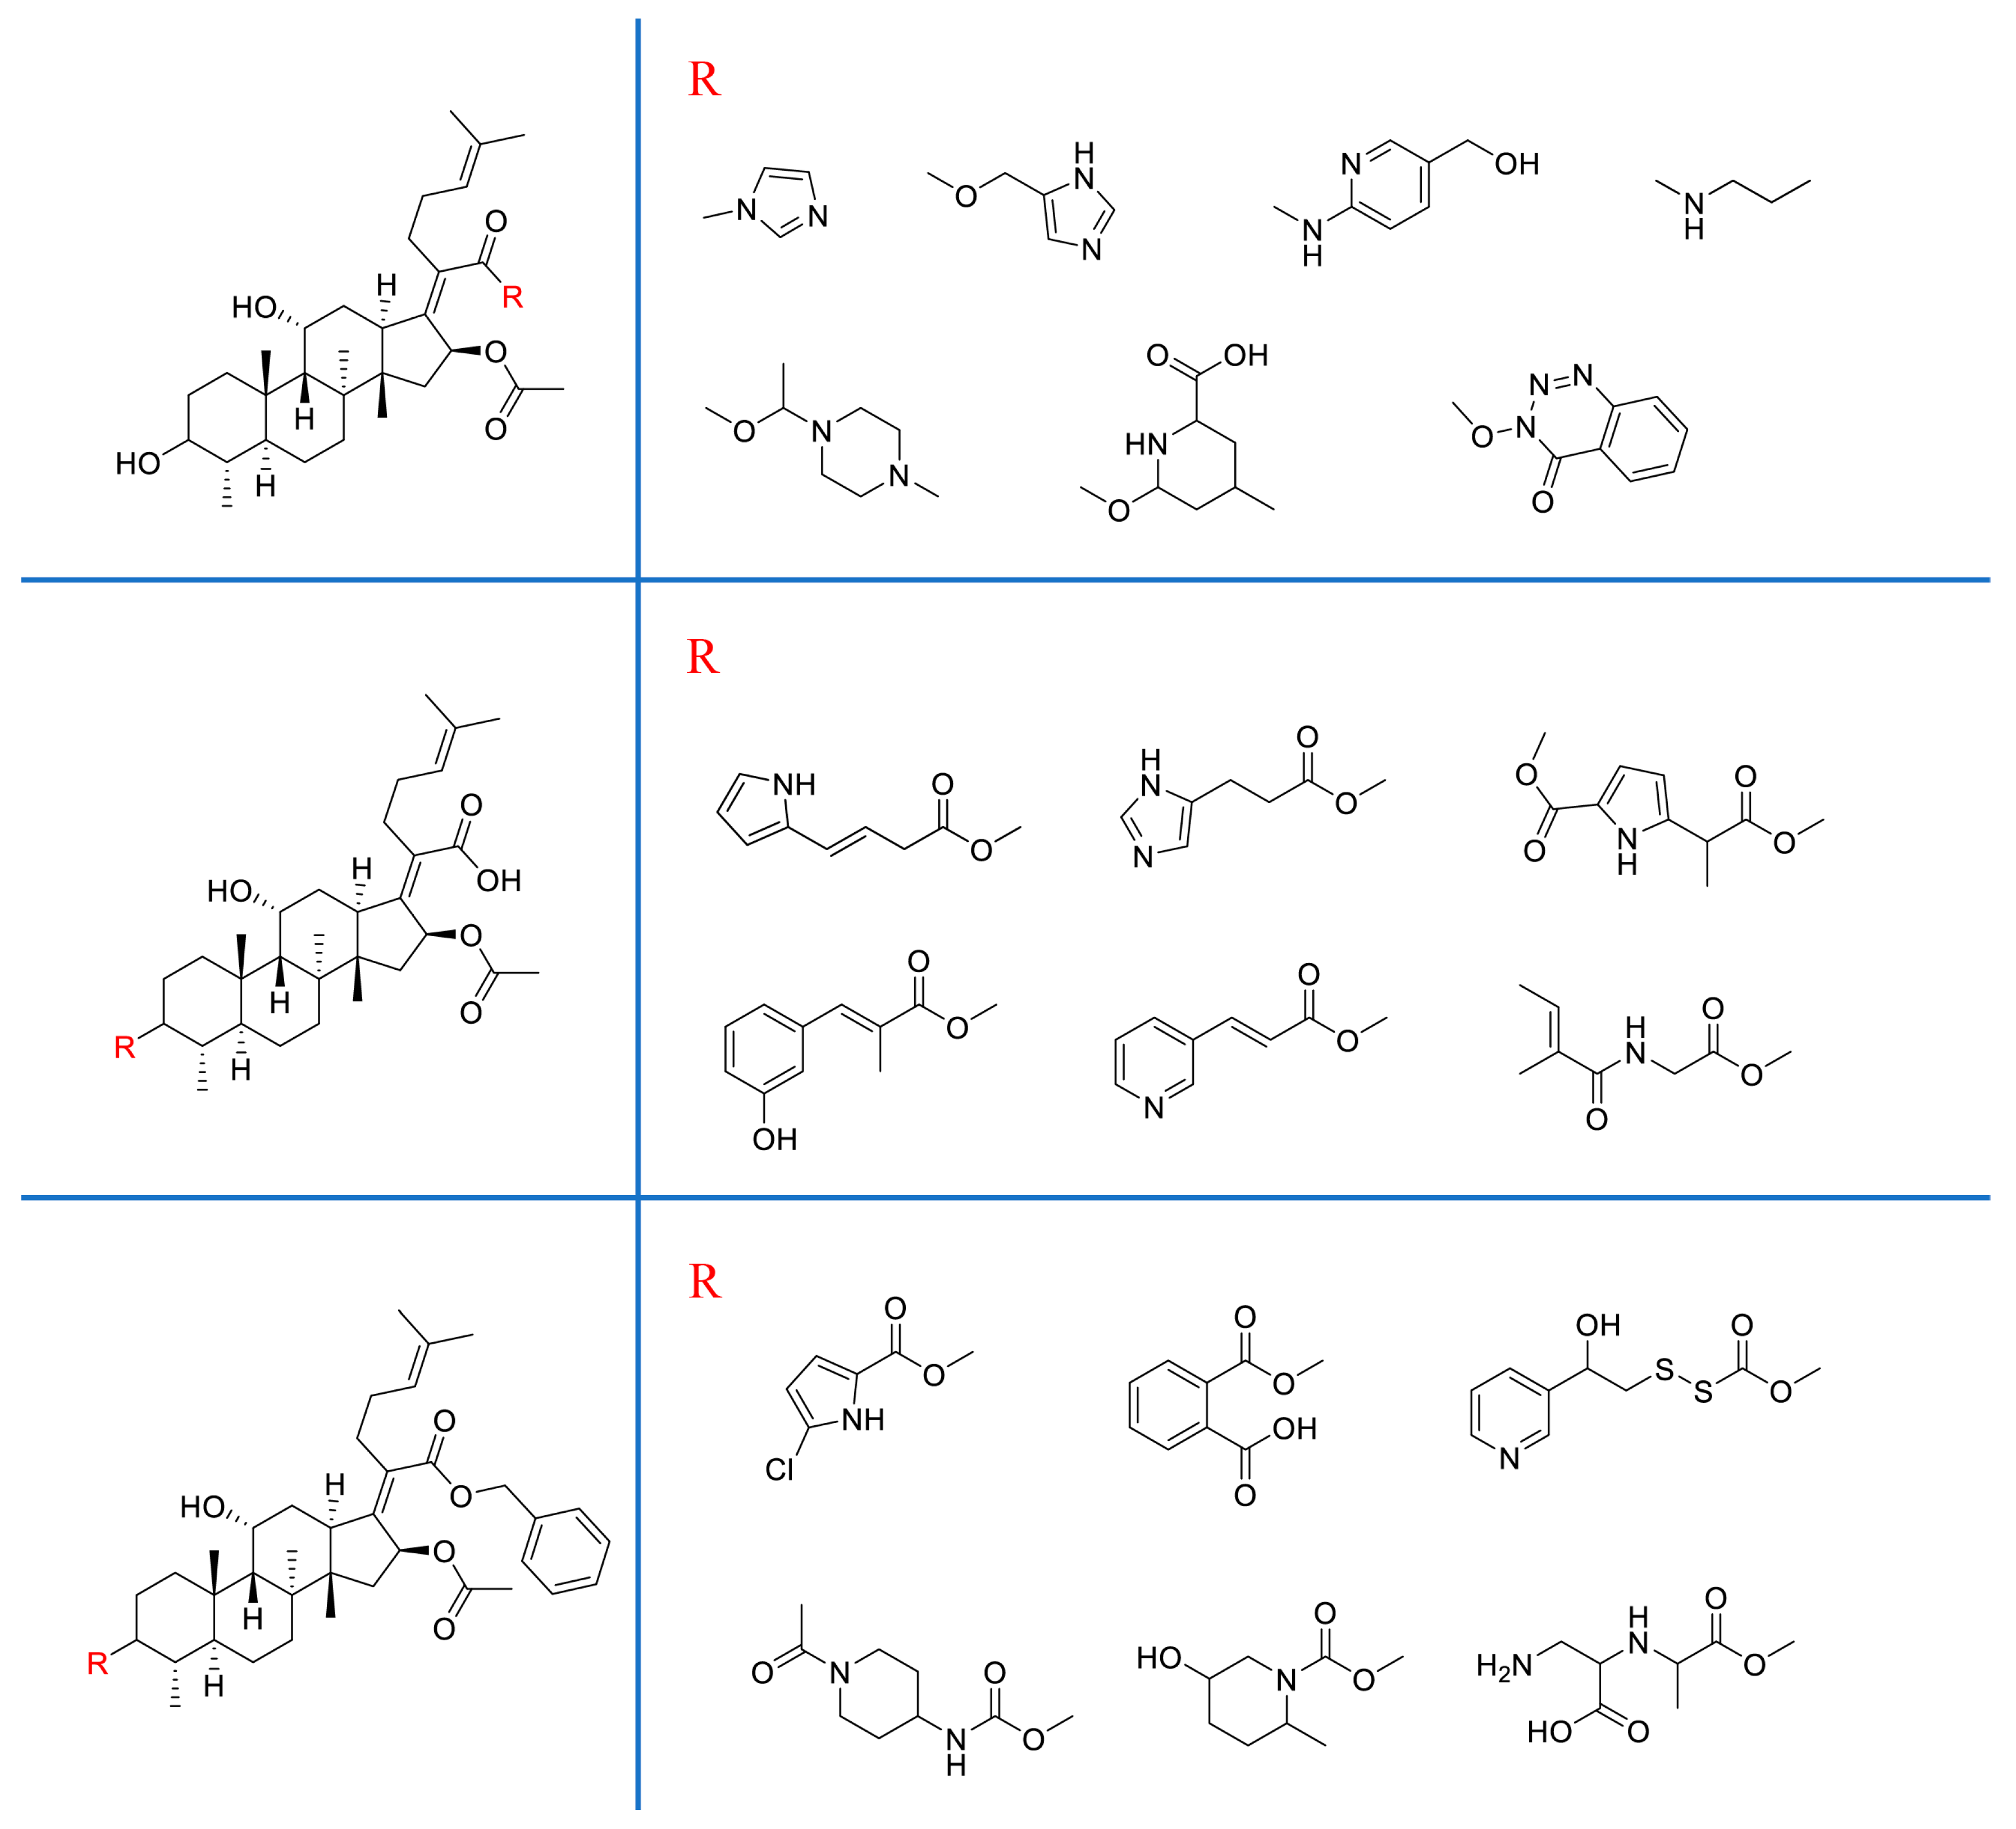
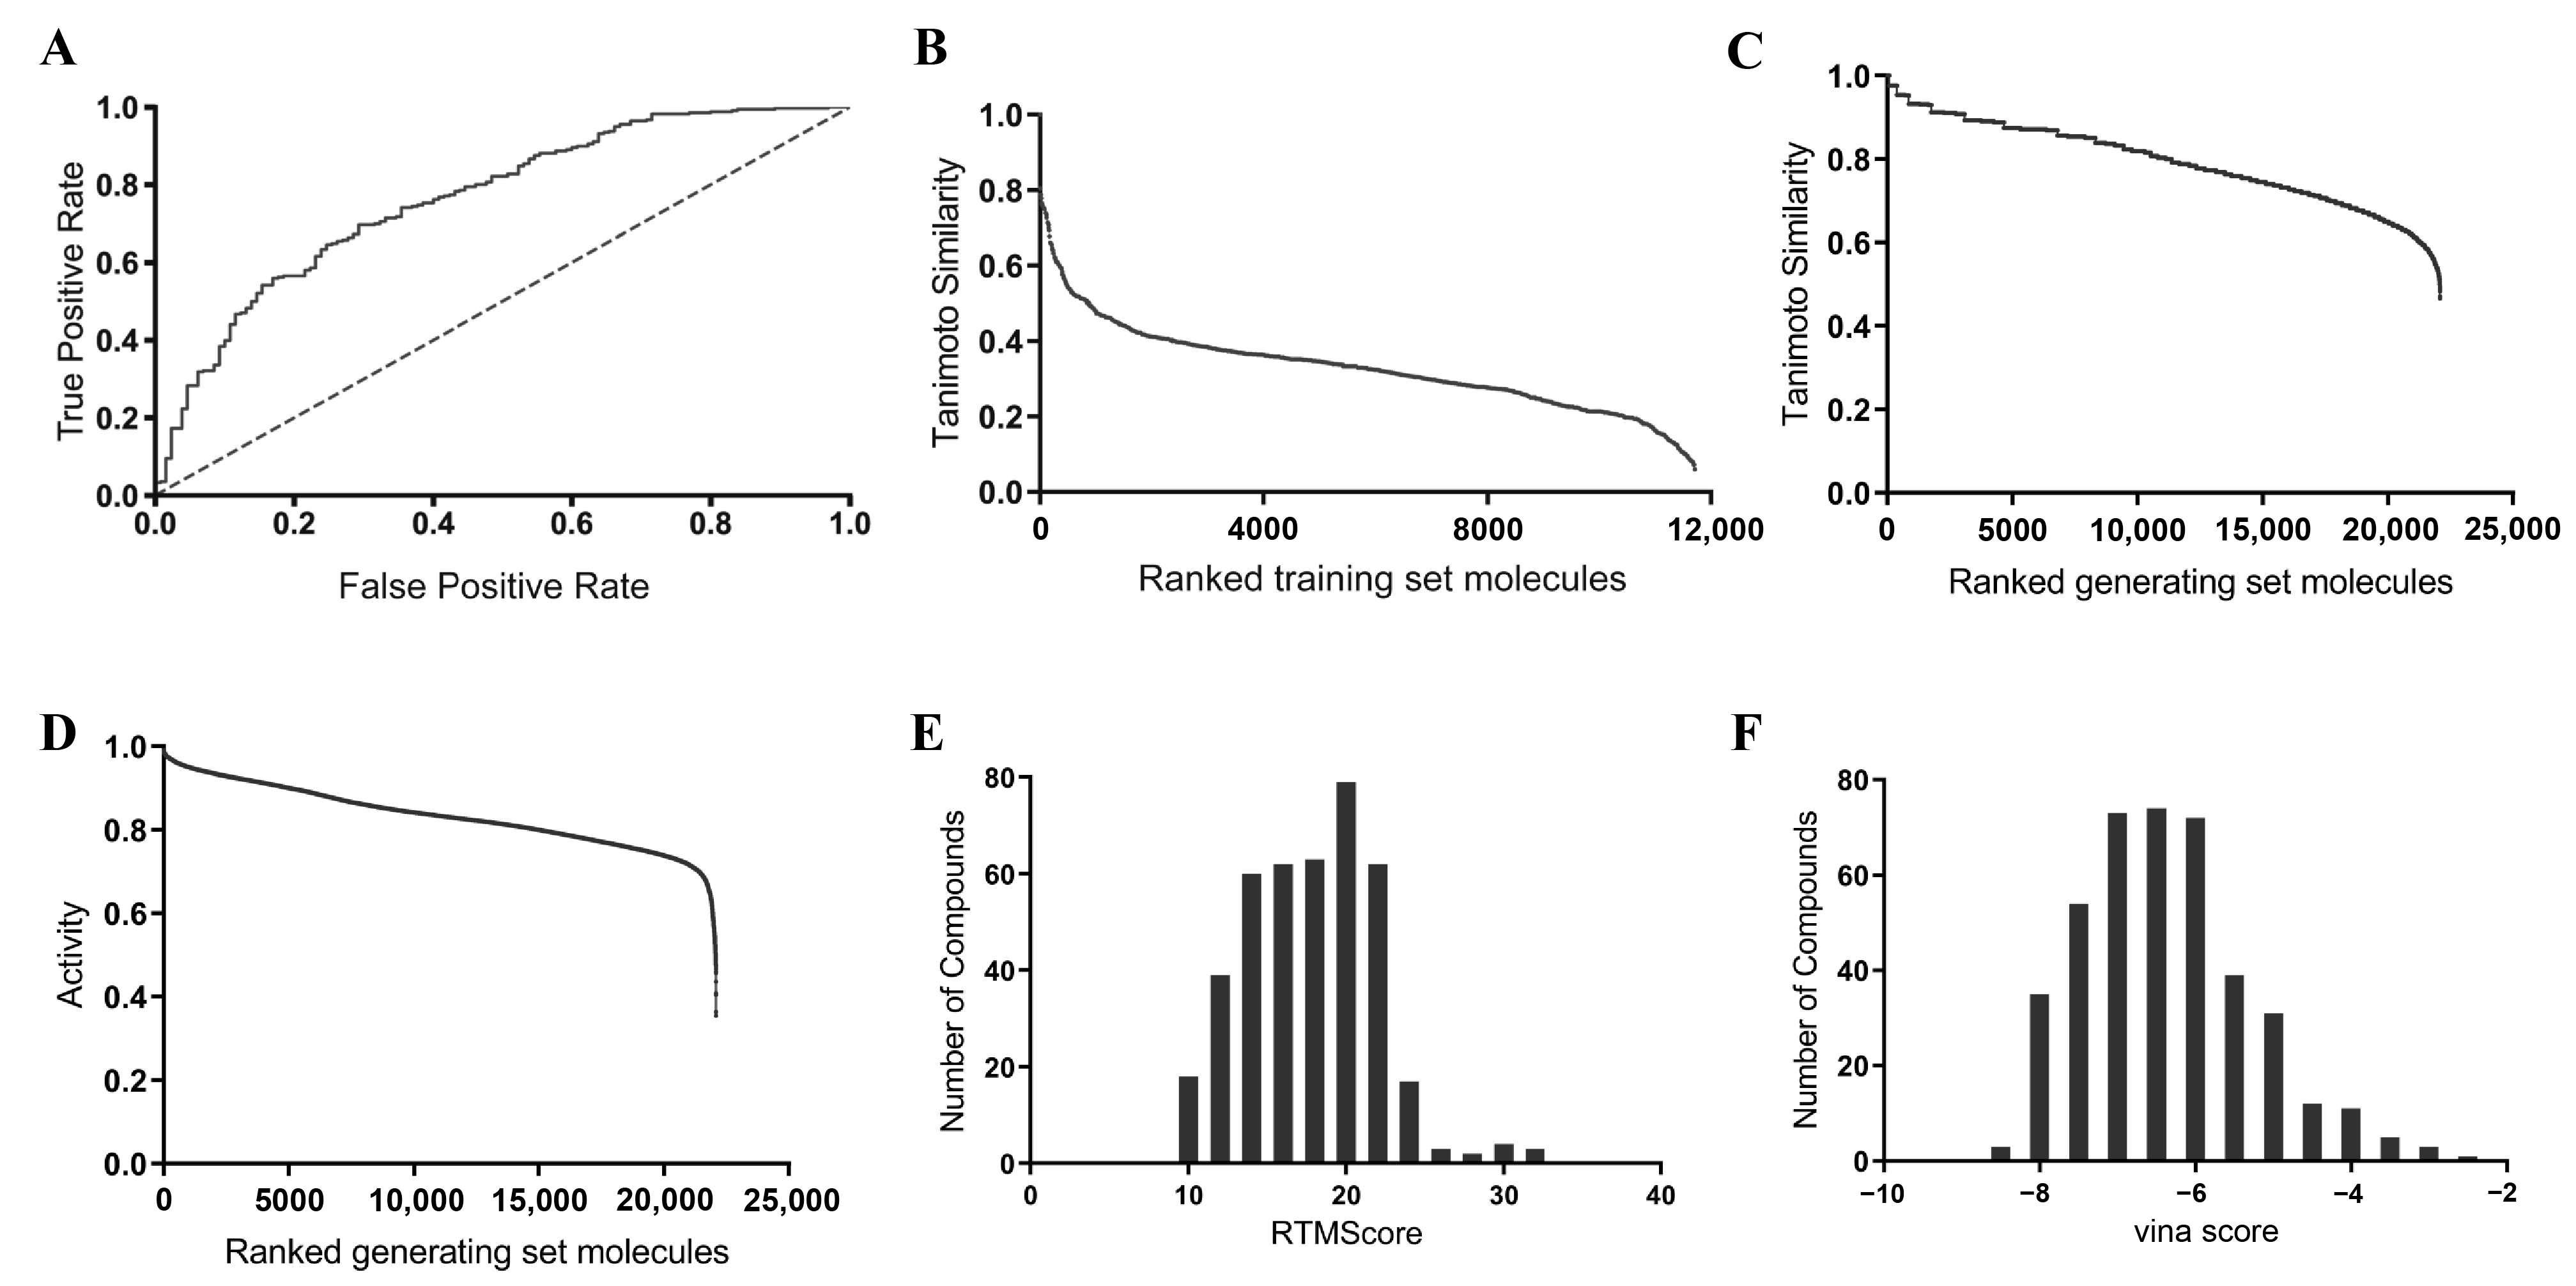
2.3. Property Distributions: Differences Between the Generated Compounds and the Reference Compounds
2.4. Virtual Screening of the Generated Set
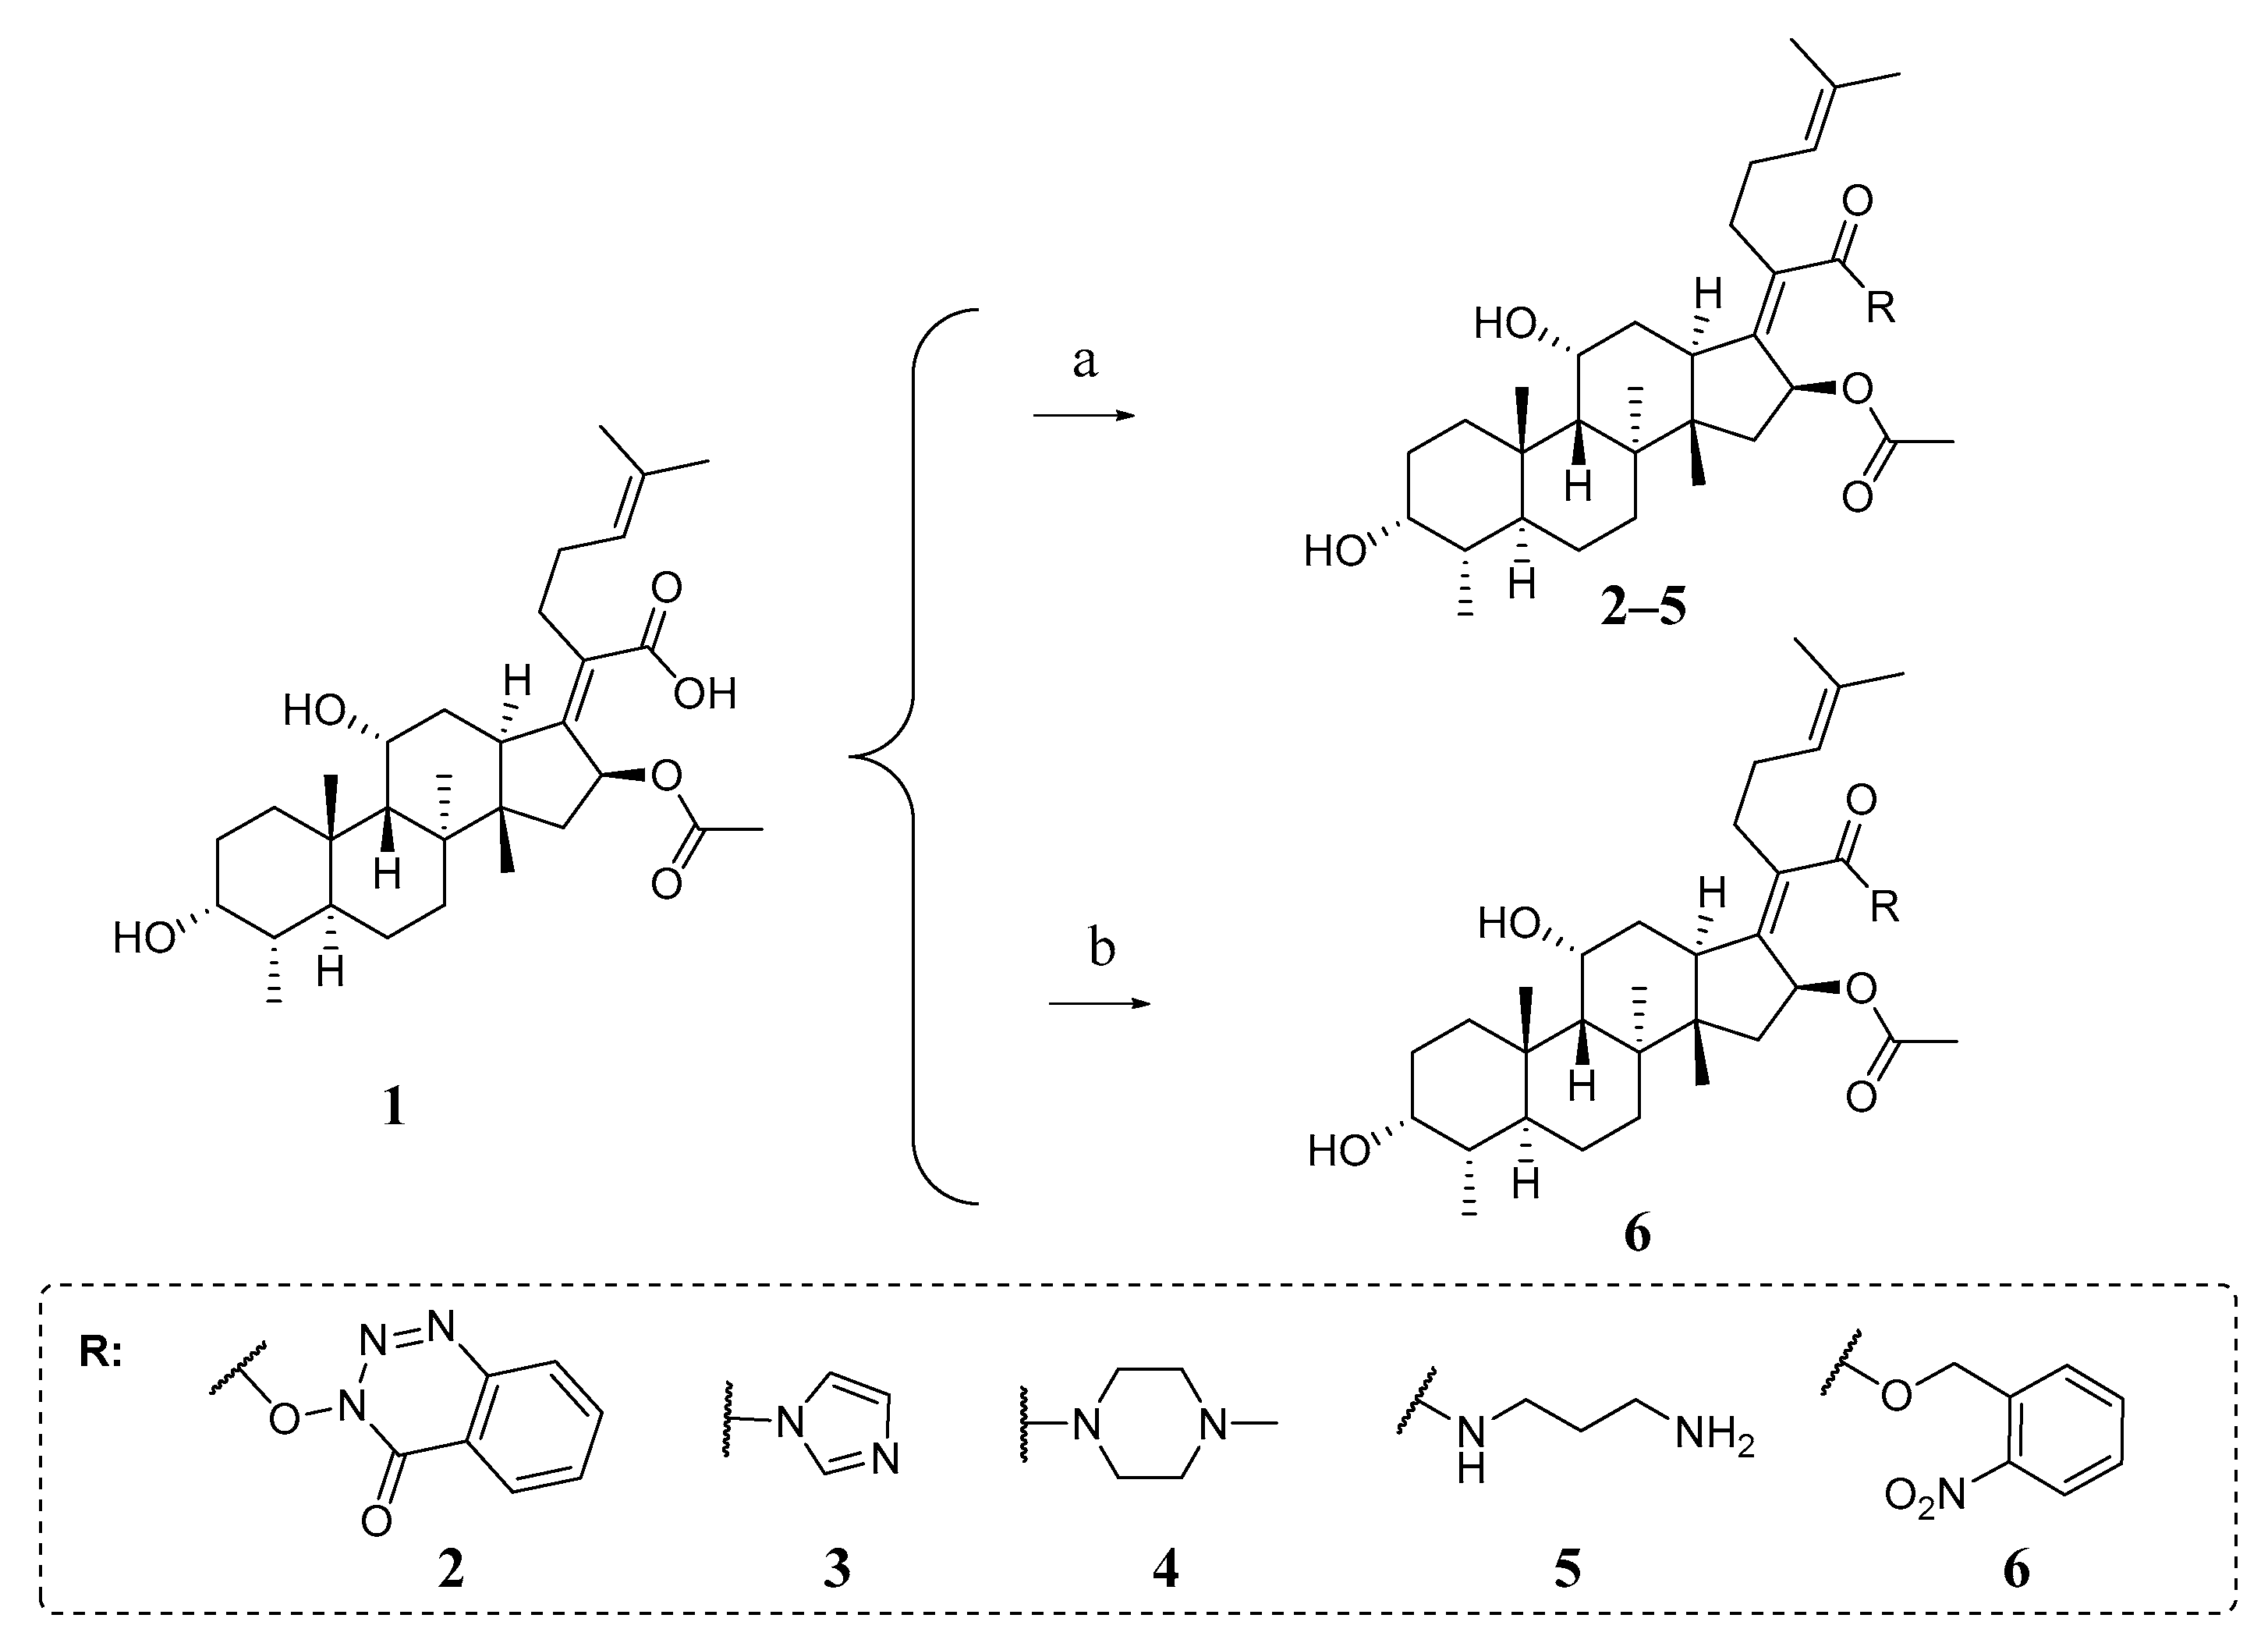
2.5. Chemistry
2.6. Structure–Activity Relationship of FA Derivatives
3. Materials and Methods
3.1. Homology Modeling of Wildtype and Mutant EF-Gs from S. Aureus
- Mutant 2 (MUT-2) with L461K in EF-G. FA showed no directed interactions with EF-G in the Cryo-EM complex [36]. However, the L461K alteration was one of the most common FA resistance determinants, belonging to fusA and fusD mutations, which influence FA binding and EF-G stability [37,38,39]. L461 has been confirmed to lead to high-level resistance of FA with MIC > 256 μg/mL in clinical strains of S. aureus [18,37].
3.2. Molecular Docking
3.3. Molecular Dynamics (MD) Simulation
3.4. Scaffold Generator-Decorator
3.5. Chemprop
3.6. RTMScore
3.7. Detailed Synthetic Procedure
3.7.1. General Procedure for the Synthesis of 1–6
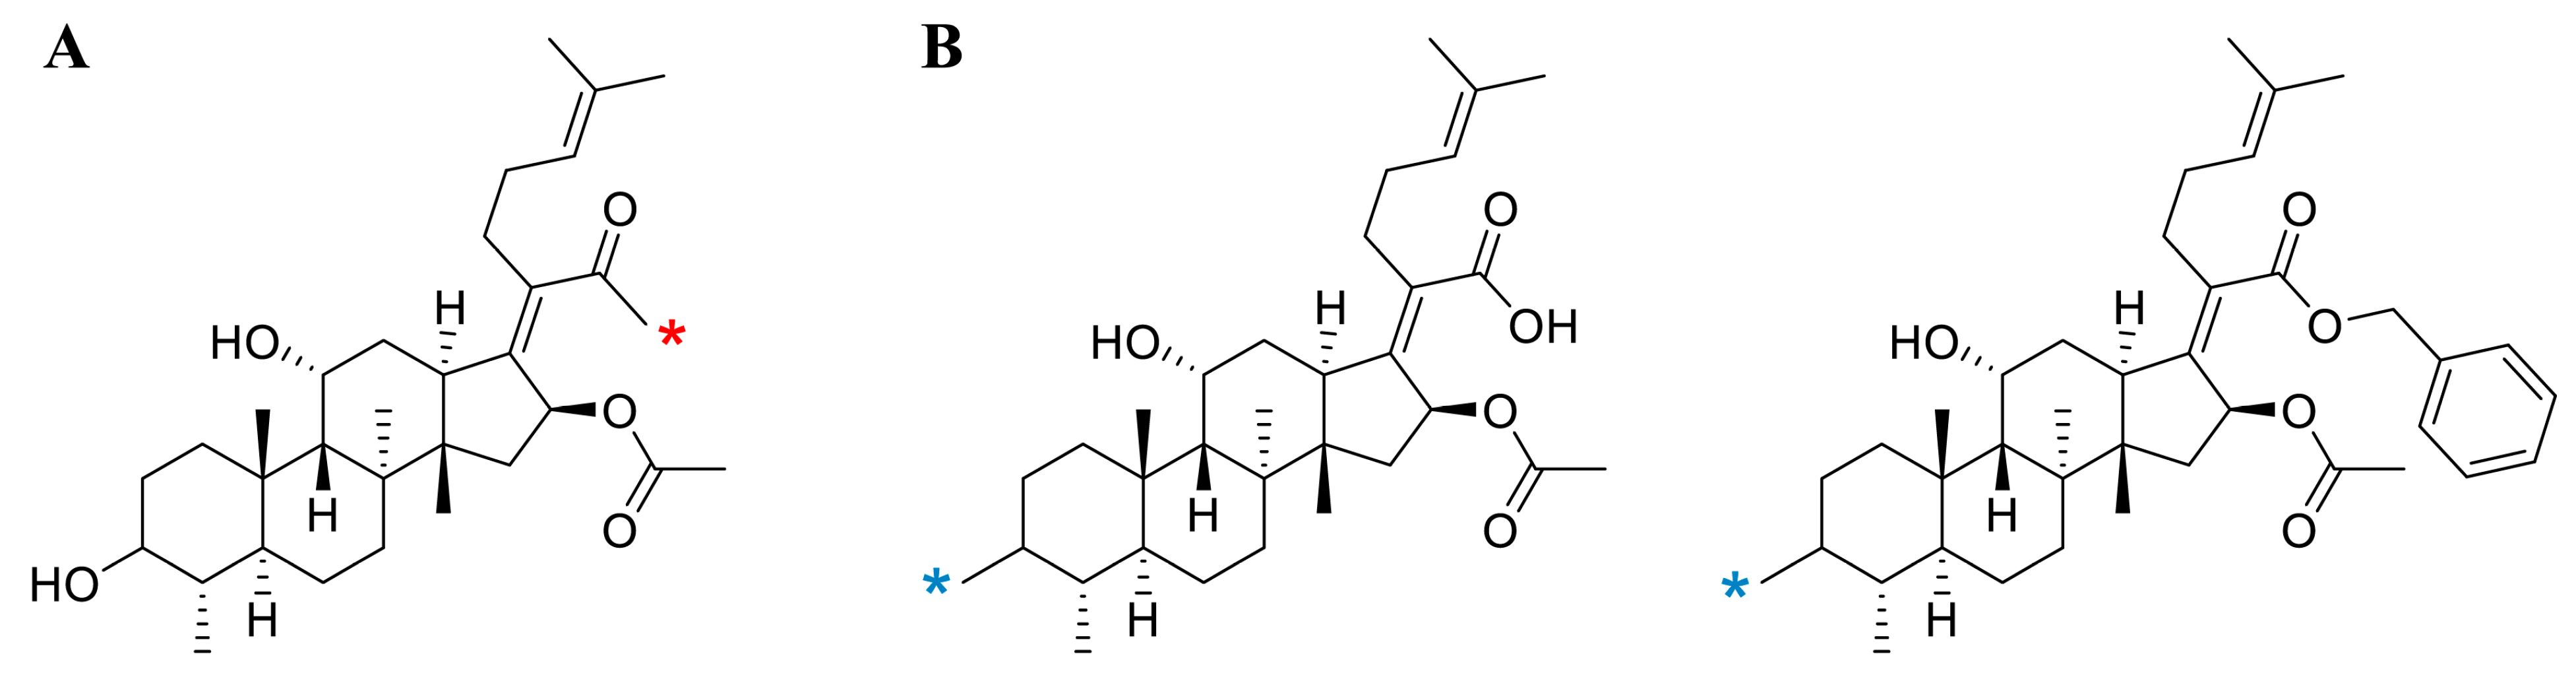
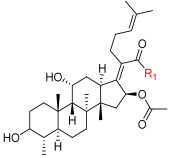
- Fusidic acid (1)
- 4-oxobenzo[d][1,2,3]triazin-3(4H)-yl(Z)-2-((3R,4S,5S,8S,9S,10S,11R,13R,14S,16S)-16-acetoxy-3,11-dihydroxy-4,8,10,14-tetramethylhexadecahydro-17H-cyclopenta[a]phenanthren-17-ylidene)-6-methylhept-5-enoate (2).
- (3R,4S,5S,8S,9S,10S,11R,13R,14S,16S,Z)-17-(1-(1H-imidazol-1-yl)-6-methyl-1-oxohept-5-en-2-ylidene)-3,11-dihydroxy-4,8,10,14-tetramethylhexadecahydro-1H-cyclopenta[a]phenanthren-16-ylacetate (3).
- (3R,4S,5S,8S,9S,10S,11R,13R,14S,16S,Z)-3,11-dihydroxy-4,8,10,14-tetramethyl-17-(6-methyl-1-(4-methylpiperazin-1-yl)-1-oxohept-5-en-2-ylidene)hexadecahydro-1H-cyclopenta[a]phenanthren-16-ylacetate (4).
- (3R,4S,5S,8S,9S,10S,11R,13R,14S,16S,Z)-17-(1-((3-aminopropyl)amino)-6-methyl-1-oxohept-5-en-2-ylidene)-3,11-dihydroxy-4,8,10,14-tetramethylhexadecahydro-1H-cyclopenta[a]phenanthren-16-ylacetate (5).
- 2-nitrobenzyl(Z)-2-((3R,4S,5S,8S,9S,10S,11R,13R,14S,16S)-16-acetoxy-3,11-dihydroxy-4,8,10,14-tetramethylhexadecahydro-17H-cyclopenta[a]phenanthren-17-ylidene)-6-methylhept-5-enoate (6).
3.7.2. General Procedure for the Synthesis of 7–11
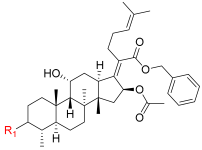
- 3-((((3R,4S,5S,8S,9S,10S,11R,13R,14S,16S,Z)-16-acetoxy-17-(1-(benzyloxy)-6-methyl-1-oxohept-5-en-2-ylidene)-11-hydroxy-4,8,10,14-tetramethylhexadecahydro-1H-cyclopenta[a]phenanthren-3-yl)oxy)carbonyl)pyrazine-2-carboxylic acid (7).
- benzyl(Z)-2-((3R,4S,5S,8S,9S,10S,11R,13R,14S,16S)-16-acetoxy-11-hydroxy-4,8,10,14-tetramethyl-3-((4-oxo-4-(1H-pyrazol-1-yl)butanoyl)oxy)hexadecahydro-17H-cyclopenta[a]phenanthren-17-ylidene)-6-methylhept-5-enoate (8).
- benzyl(Z)-2-((3R,4S,5S,8S,9S,10S,11R,13R,14S,16S)-16-acetoxy-11-hydroxy-4,8,10,14-tetramethyl-3-((4-(4-methylpiperazin-1-yl)-4-oxobutanoyl)oxy)hexadecahydro-17H-cyclopenta[a]phenanthren-17-ylidene)-6-methylhept-5-enoate (9).
- benzyl(Z)-2-((3R,4S,5S,8S,9S,10S,11R,13R,14S,16S)-3-((L-alanyl-L-alanyl)oxy)-16-acetoxy-11-hydroxy-4,8,10,14-tetramethylhexadecahydro-17H-cyclopenta[a]phenanthren-17-ylidene)-6-methylhept-5-enoate (10).
- 3-((3-(((3R,4S,5S,8S,9S,10S,11R,13R,14S,16S,Z)-16-acetoxy-17-(1-(benzyloxy)-6-methyl-1-oxohept-5-en-2-ylidene)-11-hydroxy-4,8,10,14-tetramethylhexadecahydro-1H-cyclopenta[a]phenanthren-3-yl)oxy)-3-oxopropyl)disulfaneyl)propanoic acid (11).
3.8. Biological Activity Evaluation
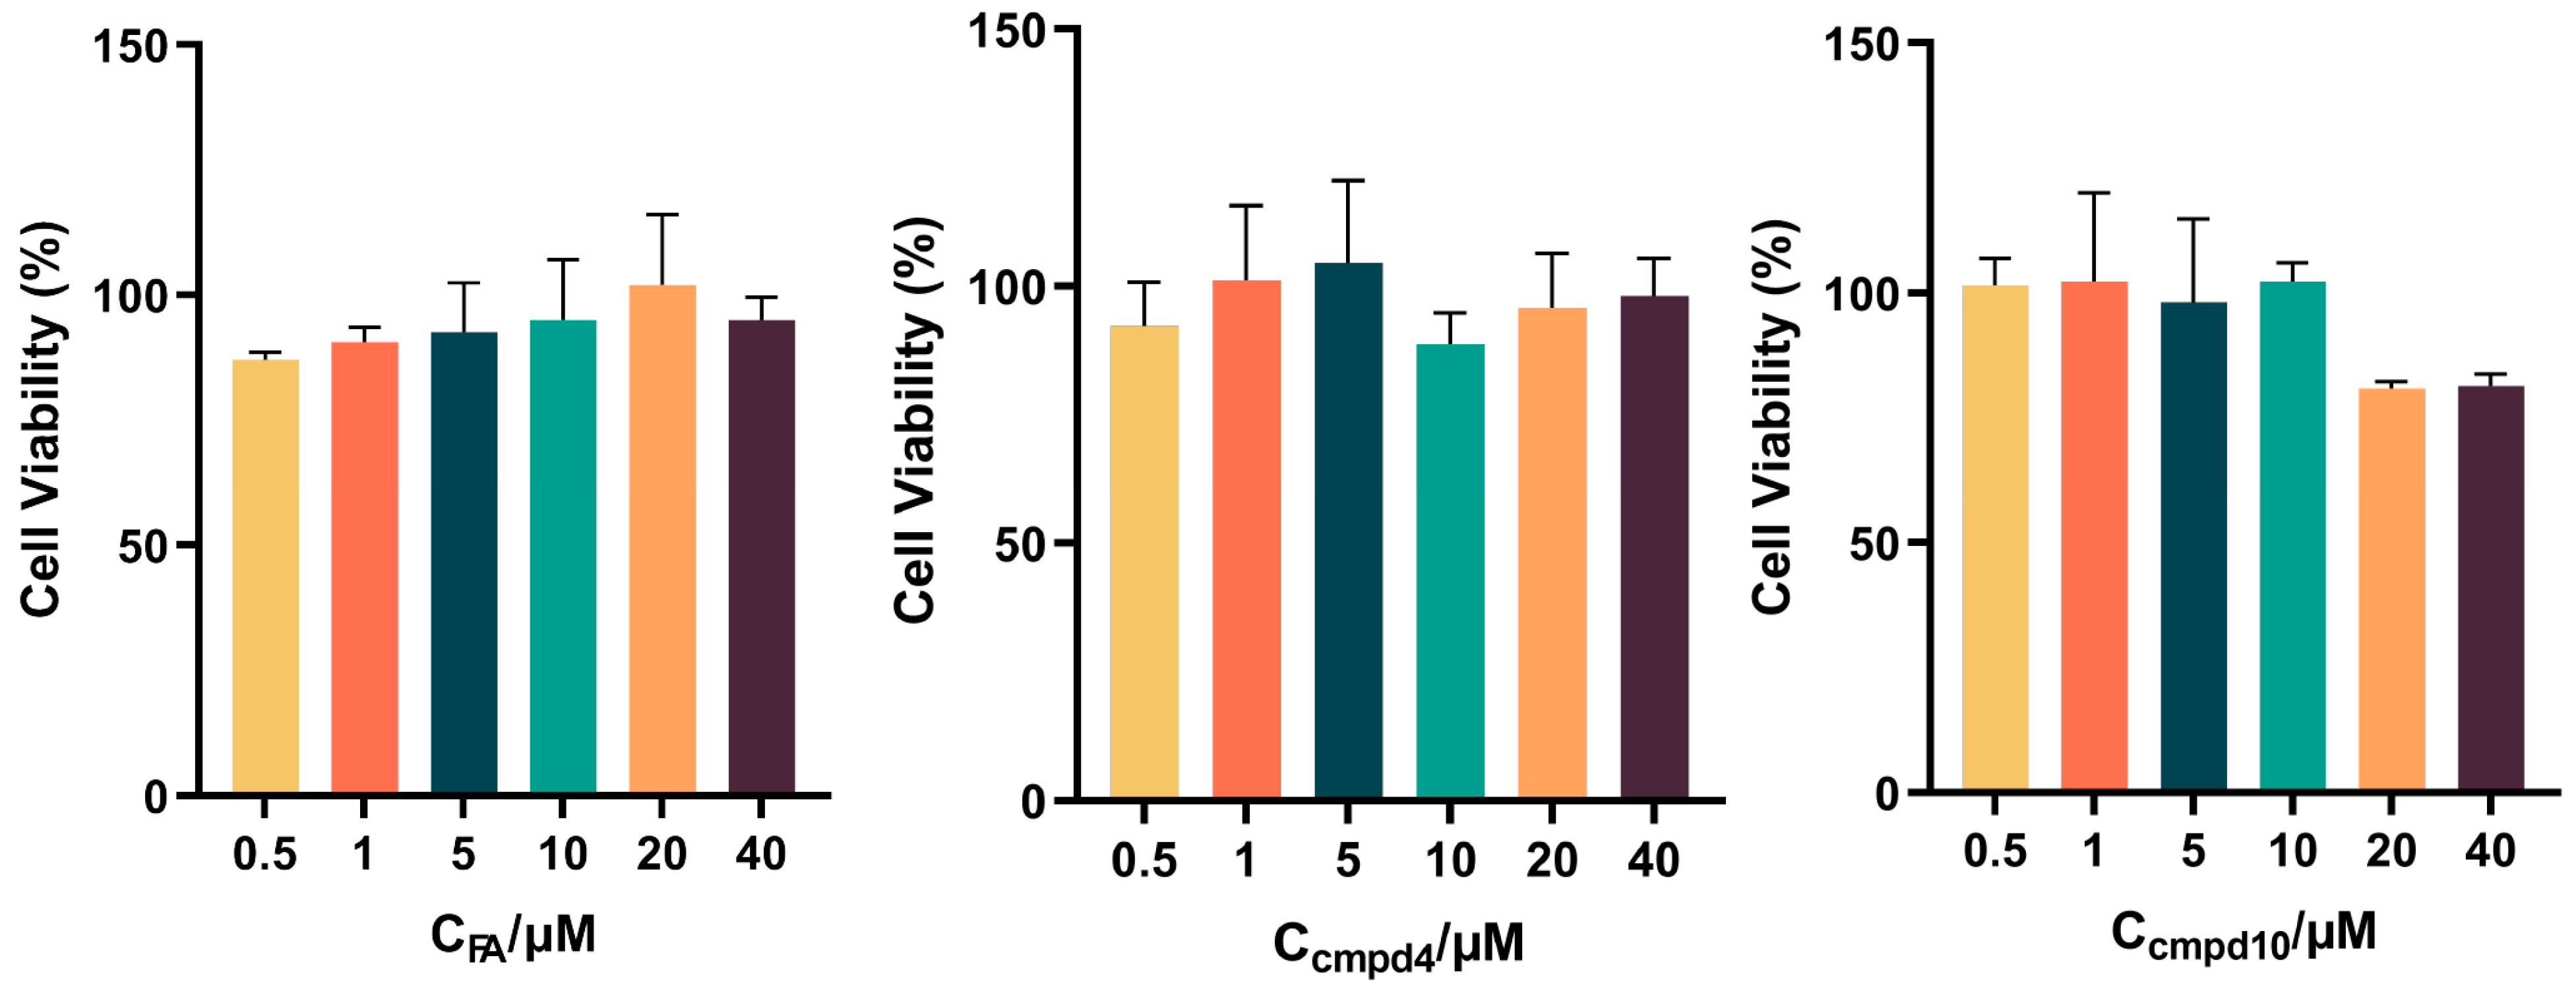
3.9. Cell Cytotoxicity Assay
4. Conclusions
Supplementary Materials
Author Contributions
Funding
Institutional Review Board Statement
Informed Consent Statement
Data Availability Statement
Conflicts of Interest
References
- Lowy, F.D. Staphylococcus aureus infections. N. Engl. J. Med. 1998, 339, 520–532. [Google Scholar] [CrossRef]
- Ahmad-Mansour, N.; Loubet, P.; Pouget, C.; Dunyach-Remy, C.; Sotto, A.; Lavigne, J.P.; Molle, V. Staphylococcus aureus Toxins: An Update on Their Pathogenic Properties and Potential Treatments. Toxins 2021, 13, 677. [Google Scholar] [CrossRef] [PubMed]
- Wi, Y.M.; Rhee, J.Y.; Kang, C.I.; Chung, D.R.; Song, J.H.; Peck, K.R. Clinical predictors of methicillin-resistance and their impact on mortality associated with Staphylococcus aureus bacteraemia. Epidemiol. Infect. 2018, 146, 1326–1336. [Google Scholar] [CrossRef] [PubMed]
- Shrivastava, S.R.; Shrivastava, P.S.; Ramasamy, J. World Health Organization releases global priority list of antibiotic-resistant bacteria to guide research, discovery, and development of new antibiotics. J. Med. Soc. 2018, 32, 76–77. [Google Scholar] [CrossRef]
- Itani, K.M.; Dryden, M.S.; Bhattacharyya, H.; Kunkel, M.J.; Baruch, A.M.; Weigelt, J.A. Efficacy and safety of linezolid versus vancomycin for the treatment of complicated skin and soft-tissue infections proven to be caused by methicillin-resistant Staphylococcus aureus. Am. J. Surg. 2010, 199, 804–816. [Google Scholar] [CrossRef]
- Esposito, S.; Bassetti, M.; Concia, E.; De Simone, G.; De Rosa, F.G.; Grossi, P.; Novelli, A.; Menichetti, F.; Petrosillo, N.; Tinelli, M. Diagnosis and management of skin and soft-tissue infections (SSTI). A literature review and consensus statement: An update. J. Cheminformatics 2017, 29, 197–214. [Google Scholar] [CrossRef]
- Bounthavong, M.; Hsu, D.I. Efficacy and safety of linezolid in methicillin-resistant Staphylococcus aureus (MRSA) complicated skin and soft tissue infection (cSSTI): A meta-analysis. Curr. Med. Res. Opin. 2010, 26, 407–421. [Google Scholar] [CrossRef]
- Dadashi, M.; Sharifian, P.; Bostanshirin, N.; Hajikhani, B.; Bostanghadiri, N.; Khosravi-Dehaghi, N.; Van Belkum, A.; Darban-Sarokhalil, D. The global prevalence of daptomycin, tigecycline, and linezolid-resistant Enterococcus faecalis and Enterococcus faecium strains from human clinical samples: A systematic review and meta-analysis. Front. Med. 2021, 8, 720647. [Google Scholar] [CrossRef]
- Holmes, N.E.; Tong, S.Y.; Davis, J.S.; Van Hal, S.J. Treatment of methicillin-resistant Staphylococcus aureus: Vancomycin and beyond. Semin. Respir. Crit. Care Med. 2015, 36, 017–030. [Google Scholar] [CrossRef]
- Bruniera, F.; Ferreira, F.; Saviolli, L.; Bacci, M.; Feder, D.; Pedreira, M.; Peterlini, M.S.; Azzalis, L.; Junqueira, V.C.; Fonseca, F. The use of vancomycin with its therapeutic and adverse effects: A review. Eur. Rev. Med. Pharmacol. Sci. 2015, 19, 694–700. [Google Scholar]
- Hashemian, S.M.; Farhadi, T.; Ganjparvar, M. Linezolid: A review of its properties, function, and use in critical care. Drug Des. Dev. Ther. 2018, 12, 1759–1767. [Google Scholar] [CrossRef] [PubMed]
- Godtfredsen, W.O.; Jahnsen, S.; Lorck, H.; Roholt, K.; Tybring, L. Fusidic acid: A new antibiotic. Nature 1962, 193, 987. [Google Scholar] [CrossRef] [PubMed]
- Howden, B.P.; Grayson, M.L. Dumb and dumber—The potential waste of a useful antistaphylococcal agent: Emerging fusidic acid resistance in Staphylococcus aureus. Clin. Infect. Dis. 2006, 42, 394–400. [Google Scholar] [CrossRef] [PubMed]
- Schöfer, H.; Simonsen, L. Fusidic acid in dermatology: An updated review. Eur. J. Dermatol. 2010, 20, 6–15. [Google Scholar] [CrossRef]
- Jones, R.N.; Mendes, R.E.; Sader, H.S.; Castanheira, M. In Vitro Antimicrobial Findings for Fusidic Acid Tested Against Contemporary (2008–2009) Gram-Positive organisms Collected in the United States. Clin. Infect. Dis. 2011, 52, S477–S486. [Google Scholar] [CrossRef]
- Gao, Y.; Selmer, M.; Dunham, C.M.; Weixlbaumer, A.; Kelley, A.C.; Ramakrishnan, V. The structure of the ribosome with elongation factor G trapped in the posttranslocational state. Science 2009, 326, 694–699. [Google Scholar] [CrossRef]
- Wood, G.E.; Lee, J.W.; Peramuna, T.; Wendt, K.L.; Kim, C.M.; Aguila, L.K.T.; Calderon, C.L.; Cichewicz, R.H. The fungal natural product fusidic acid demonstrates potent activity against Mycoplasma genitalium. Antimicrob. Agents Chemother. 2024, 68, e0100624. [Google Scholar] [CrossRef]
- Fernandes, P. Fusidic acid: A bacterial elongation factor inhibitor for the oral treatment of acute and Chronic staphylococcal infections. Cold Spring Harb. Perspect. Med. 2016, 6, a025437. [Google Scholar] [CrossRef]
- Duvold, T.; Sorensen, M.D.; Björkling, F.; Henriksen, A.S.; Rastrup-Andersen, N. Synthesis and conformational analysis of fusidic acid side chain derivatives in relation to antibacterial activity. J. Med. Chem. 2001, 44, 3125–3131. [Google Scholar] [CrossRef]
- Duvold, T.; Jorgensen, A.; Andersen, N.R.; Henriksen, A.S.; Dahl Sorensen, M.; Bjorkling, F. 17S,20S-Methanofusidic acid, a new potent semi-synthetic fusidane antibiotic. Bioorganic Med. Chem. Lett. 2002, 12, 3569–3572. [Google Scholar] [CrossRef]
- von Daehne, W.; Godtfredsen, W.O.; Rasmussen, P.R. Structure-activity relationships in fusidic acid-type antibiotics. Adv. Appl. Microbiol. 1979, 25, 95–146. [Google Scholar] [PubMed]
- Lu, J.; Ni, J.; Wang, J.; Liu, Z.; Shang, K.; Bi, Y. Integration of multiscale molecular modeling approaches with the design and discovery of fusidic acid derivatives. Future Med. Chem. 2019, 11, 1427–1442. [Google Scholar] [CrossRef] [PubMed]
- Kaur, G.; Singh, K.; Pavadai, E.; Njoroge, M.; Espinoza-Moraga, M.; De Kock, C.; Smith, P.J.; Wittlin, S.; Chibale, K. Synthesis of fusidic acid bioisosteres as antiplasmodial agents and molecular docking studies in the binding site of elongation factor-G. MedChemComm 2015, 6, 2023–2028. [Google Scholar] [CrossRef]
- Wu, P.; He, H.; Hong, W.D.; Wu, T.; Huang, G.; Zhong, Y.; Tu, B.; Gao, M.; Zhou, J.; Zhao, S. The biological evaluation of fusidic acid and its hydrogenation derivative as antimicrobial and anti-inflammatory agents. Infect. Drug Resist. 2018, 11, 1945–1957. [Google Scholar] [CrossRef]
- Ni, J.X.; Guo, M.Q.; Cao, Y.C.; Lei, L.; Liu, K.L.; Wang, B.H.; Lu, F.F.; Zhai, R.; Gao, X.W.; Yan, C.H.; et al. Discovery, synthesis of novel fusidic acid derivatives possessed amino-terminal groups at the 3-hydroxyl position with anticancer activity. Eur. J. Med. Chem. 2019, 162, 122–131. [Google Scholar] [CrossRef]
- Long, J.; Ji, W.; Zhang, D.; Zhu, Y.; Bi, Y. Bioactivities and structure—Activity relationships of fusidic acid derivatives: A review. Infect. Drug Resist. 2021, 12, 759220. [Google Scholar] [CrossRef]
- Yang, K.; Swanson, K.; Jin, W.; Coley, C.; Eiden, P.; Gao, H.; Guzman-Perez, A.; Hopper, T.; Kelley, B.; Mathea, M. Analyzing learned molecular representations for property prediction. J. Chem. Inf. Model. 2019, 59, 3370–3388. [Google Scholar] [CrossRef]
- Shen, C.; Zhang, X.; Deng, Y.; Gao, J.; Wang, D.; Xu, L.; Pan, P.; Hou, T.; Kang, Y. Boosting protein–ligand binding pose prediction and virtual screening based on residue–atom distance likelihood potential and graph transformer. J. Med. Chem. 2022, 65, 10691–10706. [Google Scholar] [CrossRef]
- Chen, Y.; Koripella, R.K.; Sanyal, S.; Selmer, M. Staphylococcus aureus elongation factor G—Structure and analysis of a target for fusidic acid. FEBS J. 2010, 277, 3789–3803. [Google Scholar] [CrossRef]
- Nagaev, I.; Björkman, J.; Andersson, D.I.; Hughes, D. Biological cost and compensatory evolution in fusidic acid-resistant Staphylococcus aureus. Mol. Microbiol. 2001, 40, 433–439. [Google Scholar] [CrossRef]
- Ertl, P.; Schuffenhauer, A. Estimation of synthetic accessibility score of drug-like molecules based on molecular complexity and fragment contributions. J. Cheminformatics 2009, 1, 8. [Google Scholar] [CrossRef] [PubMed]
- ISO 10993-5:2009; Biological Evaluation of Medical Devices—Part 5: Tests for In Vitro Cytotoxicity. International Organization for Standardization: Geneva, Switzerland, 2009.
- Varadi, M.; Anyango, S.; Deshpande, M.; Nair, S.; Natassia, C.; Yordanova, G.; Yuan, D.; Stroe, O.; Wood, G.; Laydon, A. AlphaFold Protein Structure Database: Massively expanding the structural coverage of protein-sequence space with high-accuracy models. Nucleic Acids Res. 2022, 50, D439–D444. [Google Scholar] [CrossRef] [PubMed]
- Yang, Z.; Zeng, X.; Zhao, Y.; Chen, R. AlphaFold2 and its applications in the fields of biology and medicine. Signal Transduct. Target. Ther. 2023, 8, 115. [Google Scholar] [CrossRef]
- Touati, A.; Bellil, Z.; Barache, D.; Mairi, A. Fitness Cost of Antibiotic Resistance in Staphylococcus aureus: A Systematic Review. Microb. Drug Resist. 2021, 27, 1218–1231. [Google Scholar] [CrossRef]
- González-López, A.; Larsson, D.S.; Koripella, R.K.; Cain, B.N.; Chavez, M.G.; Hergenrother, P.J.; Sanyal, S.; Selmer, M. Structures of the Staphylococcus aureus ribosome inhibited by fusidic acid and fusidic acid cyclopentane. Sci. Rep. 2024, 14, 14253. [Google Scholar] [CrossRef]
- Garcia Chavez, M.; Garcia, A.; Lee, H.Y.; Lau, G.W.; Parker, E.N.; Komnick, K.E.; Hergenrother, P.J. Synthesis of fusidic acid derivatives yields a potent antibiotic with an improved resistance profile. ACS Infect. Dis. 2021, 7, 493–505. [Google Scholar] [CrossRef]
- Farrell, D.J.; Castanheira, M.; Chopra, I. Characterization of global patterns and the genetics of fusidic acid resistance. Clin. Infect. Dis. 2011, 52, S487–S492. [Google Scholar] [CrossRef]
- Castanheira, M.; Watters, A.A.; Mendes, R.E.; Farrell, D.J.; Jones, R.N. Occurrence and molecular characterization of fusidic acid resistance mechanisms among Staphylococcus spp. from European countries (2008). J. Antimicrob. Chemother. 2010, 65, 1353–1358. [Google Scholar] [CrossRef]
- Sprenger, K.; Jaeger, V.W.; Pfaendtner, J. The general AMBER force field (GAFF) can accurately predict thermodynamic and transport properties of many ionic liquids. J. Phys. Chem. B 2015, 119, 5882–5895. [Google Scholar] [CrossRef]
- Lu, T. Sobtop, Version 1.0. Available online: http://sobereva.com/soft/sobtop (accessed on 6 March 2024).
- Lindorff-Larsen, K.; Piana, S.; Palmo, K.; Maragakis, P.; Klepeis, J.L.; Dror, R.O.; Shaw, D.E. Improved side-chain torsion potentials for the Amber ff99SB protein force field. Proteins 2010, 78, 1950–1958. [Google Scholar] [CrossRef]
- Abraham, M.J.; Murtola, T.; Schulz, R.; Páll, S.; Smith, J.C.; Hess, B.; Lindahl, E. GROMACS: High performance molecular simulations through multi-level parallelism from laptops to supercomputers. Software X 2015, 1–2, 19–25. [Google Scholar] [CrossRef]
- Bussi, G.; Donadio, D.; Parrinello, M. Canonical sampling through velocity rescaling. J. Chem. Phys. 2007, 126, 014101. [Google Scholar] [CrossRef] [PubMed]
- Aoki, K.; Yonezawa, F. Constant-pressure molecular-dynamics simulations of the crystal-smectic transition in systems of soft parallel spherocylinders. Phys. Rev. A 1992, 46, 6541. [Google Scholar] [CrossRef] [PubMed]
- Parrinello, M.; Rahman, A. Polymorphic transitions in single crystals: A new molecular dynamics method. Dalton Trans. 1981, 52, 7182–7190. [Google Scholar] [CrossRef]
- Hess, B.; Bekker, H.; Berendsen, H.J.; Fraaije, J.G. LINCS: A linear constraint solver for molecular simulations. J. Comput. Chem. 1997, 18, 1463–1472. [Google Scholar] [CrossRef]
- Darden, T.; York, D.; Pedersen, L. Particle mesh Ewald: An N⋅32 log (N) method for Ewald sums in large systems. J. Chem. Phys. 1993, 98, 10089–10092. [Google Scholar] [CrossRef]
- Daura, X.; Gademann, K.; Jaun, B.; Seebach, D.; Van Gunsteren, W.F.; Mark, A.E. Peptide folding: When simulation meets experiment. Angew. Chem. Int. Ed. 1999, 38, 236–240. [Google Scholar] [CrossRef]
- Wallace, A.C.; Laskowski, R.A.; Thornton, J.M. LIGPLOT: A program to generate schematic diagrams of protein-ligand interactions. Protein Eng. Des. Sel. 1995, 8, 127–134. [Google Scholar] [CrossRef]
- Arús-Pous, J.; Patronov, A.; Bjerrum, E.J.; Tyrchan, C.; Reymond, J.; Chen, H.; Engkvist, O. SMILES-based deep generative scaffold decorator for de-novo drug design. J. Cheminformatics 2020, 12, 38. [Google Scholar] [CrossRef]
- Lewell, X.Q.; Judd, D.B.; Watson, S.P.; Hann, M.M. Recap retrosynthetic combinatorial analysis procedure: A powerful new technique for identifying privileged molecular fragments with useful applications in combinatorial chemistry. J. Chem. Inf. Comput. Sci. 1998, 38, 511–522. [Google Scholar] [CrossRef]
- Arús-Pous, J.; Johansson, S.V.; Prykhodko, O.; Bjerrum, E.J.; Tyrchan, C.; Reymond, J.; Chen, H.; Engkvist, O. Randomized SMILES strings improve the quality of molecular generative models. J. Cheminformatics 2019, 11, 71. [Google Scholar] [CrossRef] [PubMed]
- Saising, J.; Dube, L.; Ziebandt, A.-K.; Voravuthikunchai, S.P.; Nega, M.; Götz, F. Activity of gallidermin on Staphylococcus aureus and Staphylococcus epidermidis biofilms. Antimicrob. Agents Chemother. 2012, 56, 5804–5810. [Google Scholar] [CrossRef] [PubMed]
- Dai, H.; Dai, B.; Song, L. Discriminative embeddings of latent variable models for structured data. In Proceedings of the 33rd International Conference on Machine Learning, New York, NY, USA, 20–22 June 2016; pp. 2702–2711. [Google Scholar]
- The European Committee on Antimicrobial Susceptibility Testing. Breakpoint Tables for Interpretation of MICs and Zone Diameters. Version 15.0. 2025. Available online: https://www.eucast.org (accessed on 1 February 2025).
- Salimova, E.V.; Parfenova, L.V.; Ishmetova, D.V.; Zainullina, L.F.; Vakhitova, Y.V. Synthesis of fusidane triterpenoid Mannich bases as potential antibacterial and antitumor agents. Nat. Prod. Res. 2023, 37, 3956–3963. [Google Scholar] [CrossRef]
- Laskowski, R.A.; Swindells, M.B. LigPlot+: Multiple ligand-protein interaction diagrams for drug discovery. J. Chem. Inf. Model. 2011, 51, 2778–2786. [Google Scholar] [CrossRef]


 | |||||
|---|---|---|---|---|---|
| NO. | R1 | Chemprop | RTMScore | Inhibition Rate (%) | MIC90 (μg/mL) |
| FA (1) |  | 0.860 | 20.3 | 100 | 32 |
| 2 |  | 0.990 | 27.5 | 2.16 | - |
| 3 |  | 0.990 | 24.9 | 1.08 | - |
| 4 |  | 0.989 | 25.3 | 100 | 16 |
| 5 |  | 0.977 | 26.8 | 100 | 32 |
| 6 |  | 0.992 | 30.4 | 2.16 | - |
 | |||||
|---|---|---|---|---|---|
| NO. | R1 | Chemprop | RTMScore | Inhibition Rate (%) | MIC90 (μg/mL) |
| FA (1) |  | 0.860 | 20.3 | 100 | 32 |
| 7 |  | 0.987 | 32.1 | 100 | 32 |
| 8 | 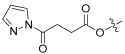 | 0.993 | 29.9 | 93.13 | 128 |
| 9 | 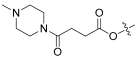 | 0.991 | 30.3 | 99.98 | 32 |
| 10 | 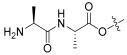 | 0.978 | 25.8 | 100 | 16 |
| 11 | 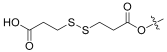 | 0.979 | 28.7 | 99.98 | 32 |
Disclaimer/Publisher’s Note: The statements, opinions and data contained in all publications are solely those of the individual author(s) and contributor(s) and not of MDPI and/or the editor(s). MDPI and/or the editor(s) disclaim responsibility for any injury to people or property resulting from any ideas, methods, instructions or products referred to in the content. |
© 2025 by the authors. Licensee MDPI, Basel, Switzerland. This article is an open access article distributed under the terms and conditions of the Creative Commons Attribution (CC BY) license (https://creativecommons.org/licenses/by/4.0/).
Share and Cite
Wang, L.; Geng, Z.; Liu, Y.; Cao, L.; Liu, Y.; Zhang, H.; Bi, Y.; Lu, J. Multi-Modal Design, Synthesis, and Biological Evaluation of Novel Fusidic Acid Derivatives. Molecules 2025, 30, 1983. https://doi.org/10.3390/molecules30091983
Wang L, Geng Z, Liu Y, Cao L, Liu Y, Zhang H, Bi Y, Lu J. Multi-Modal Design, Synthesis, and Biological Evaluation of Novel Fusidic Acid Derivatives. Molecules. 2025; 30(9):1983. https://doi.org/10.3390/molecules30091983
Chicago/Turabian StyleWang, Luqi, Zhiyuan Geng, Yuhang Liu, Linhui Cao, Yao Liu, Hourui Zhang, Yi Bi, and Jing Lu. 2025. "Multi-Modal Design, Synthesis, and Biological Evaluation of Novel Fusidic Acid Derivatives" Molecules 30, no. 9: 1983. https://doi.org/10.3390/molecules30091983
APA StyleWang, L., Geng, Z., Liu, Y., Cao, L., Liu, Y., Zhang, H., Bi, Y., & Lu, J. (2025). Multi-Modal Design, Synthesis, and Biological Evaluation of Novel Fusidic Acid Derivatives. Molecules, 30(9), 1983. https://doi.org/10.3390/molecules30091983