
Rare-Earth Metal Complexes of the Antibacterial Drug Oxolinic Acid: Synthesis, Characterization, DNA/Protein Binding and Cytotoxicity Studies


 , , , , and
Abstract
:
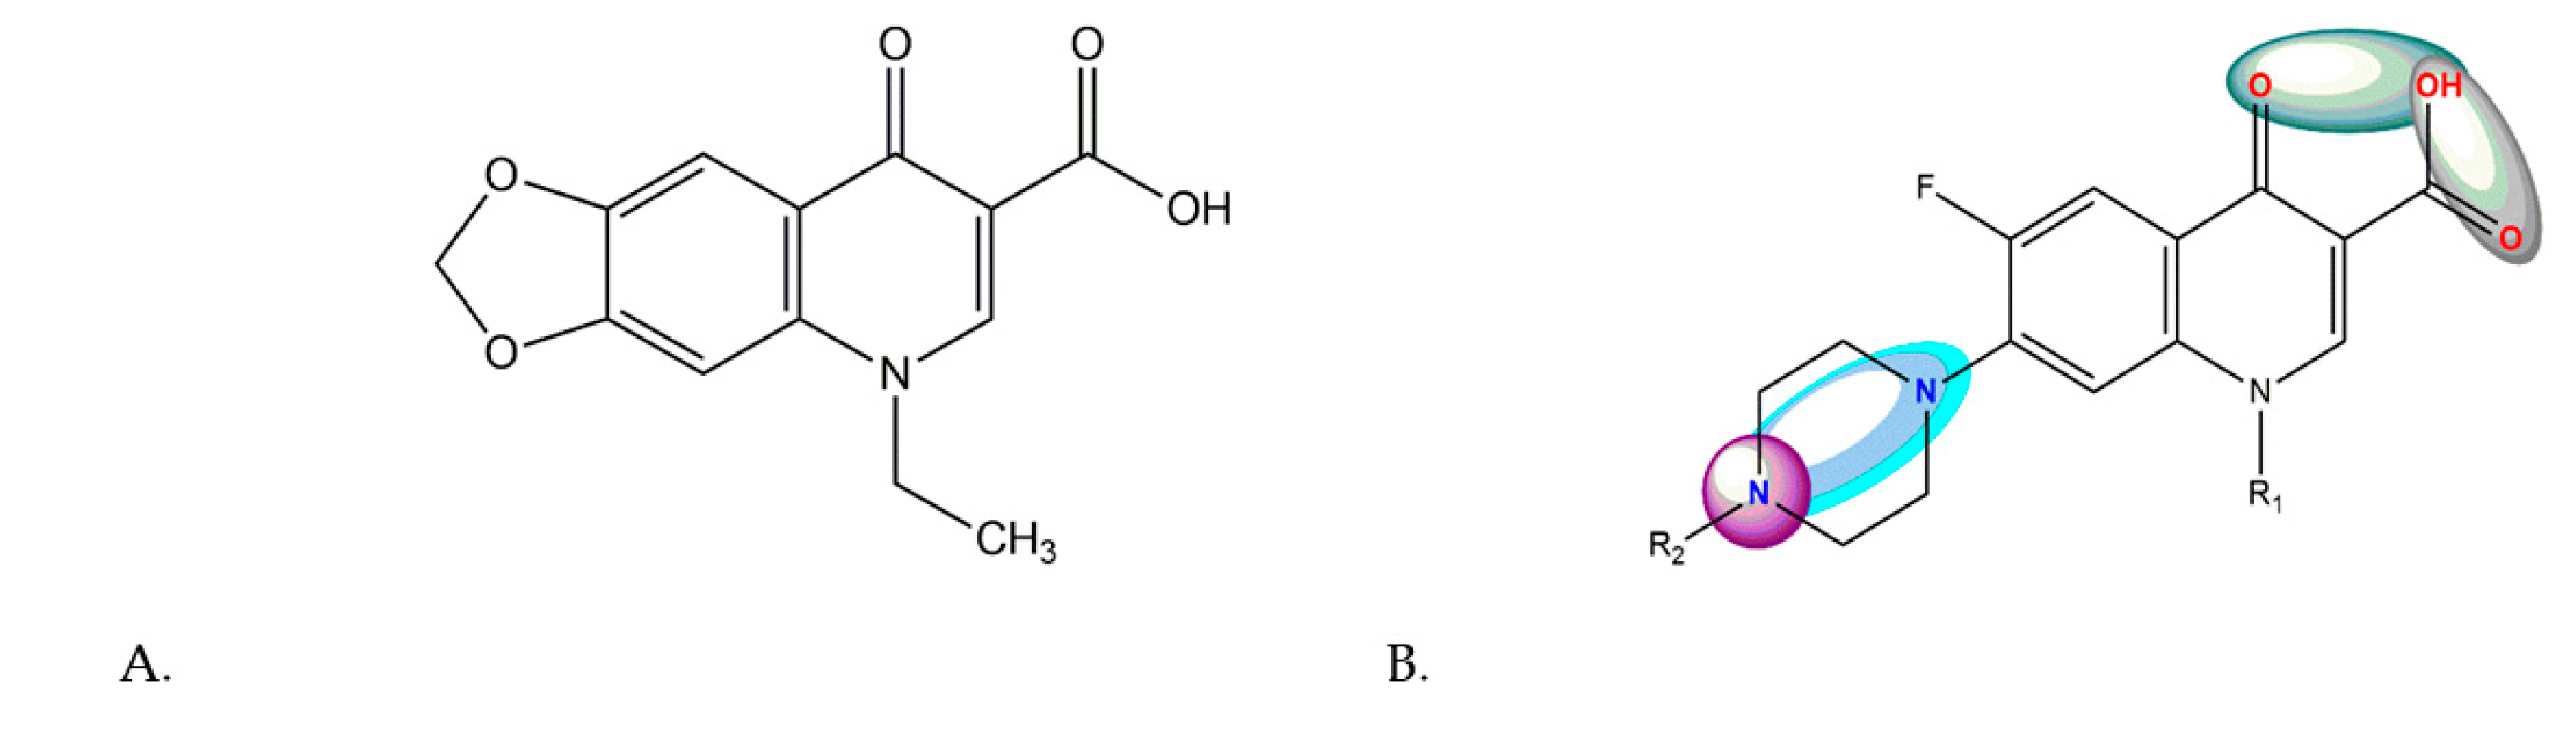
1. Introduction
2. Results and Discussion
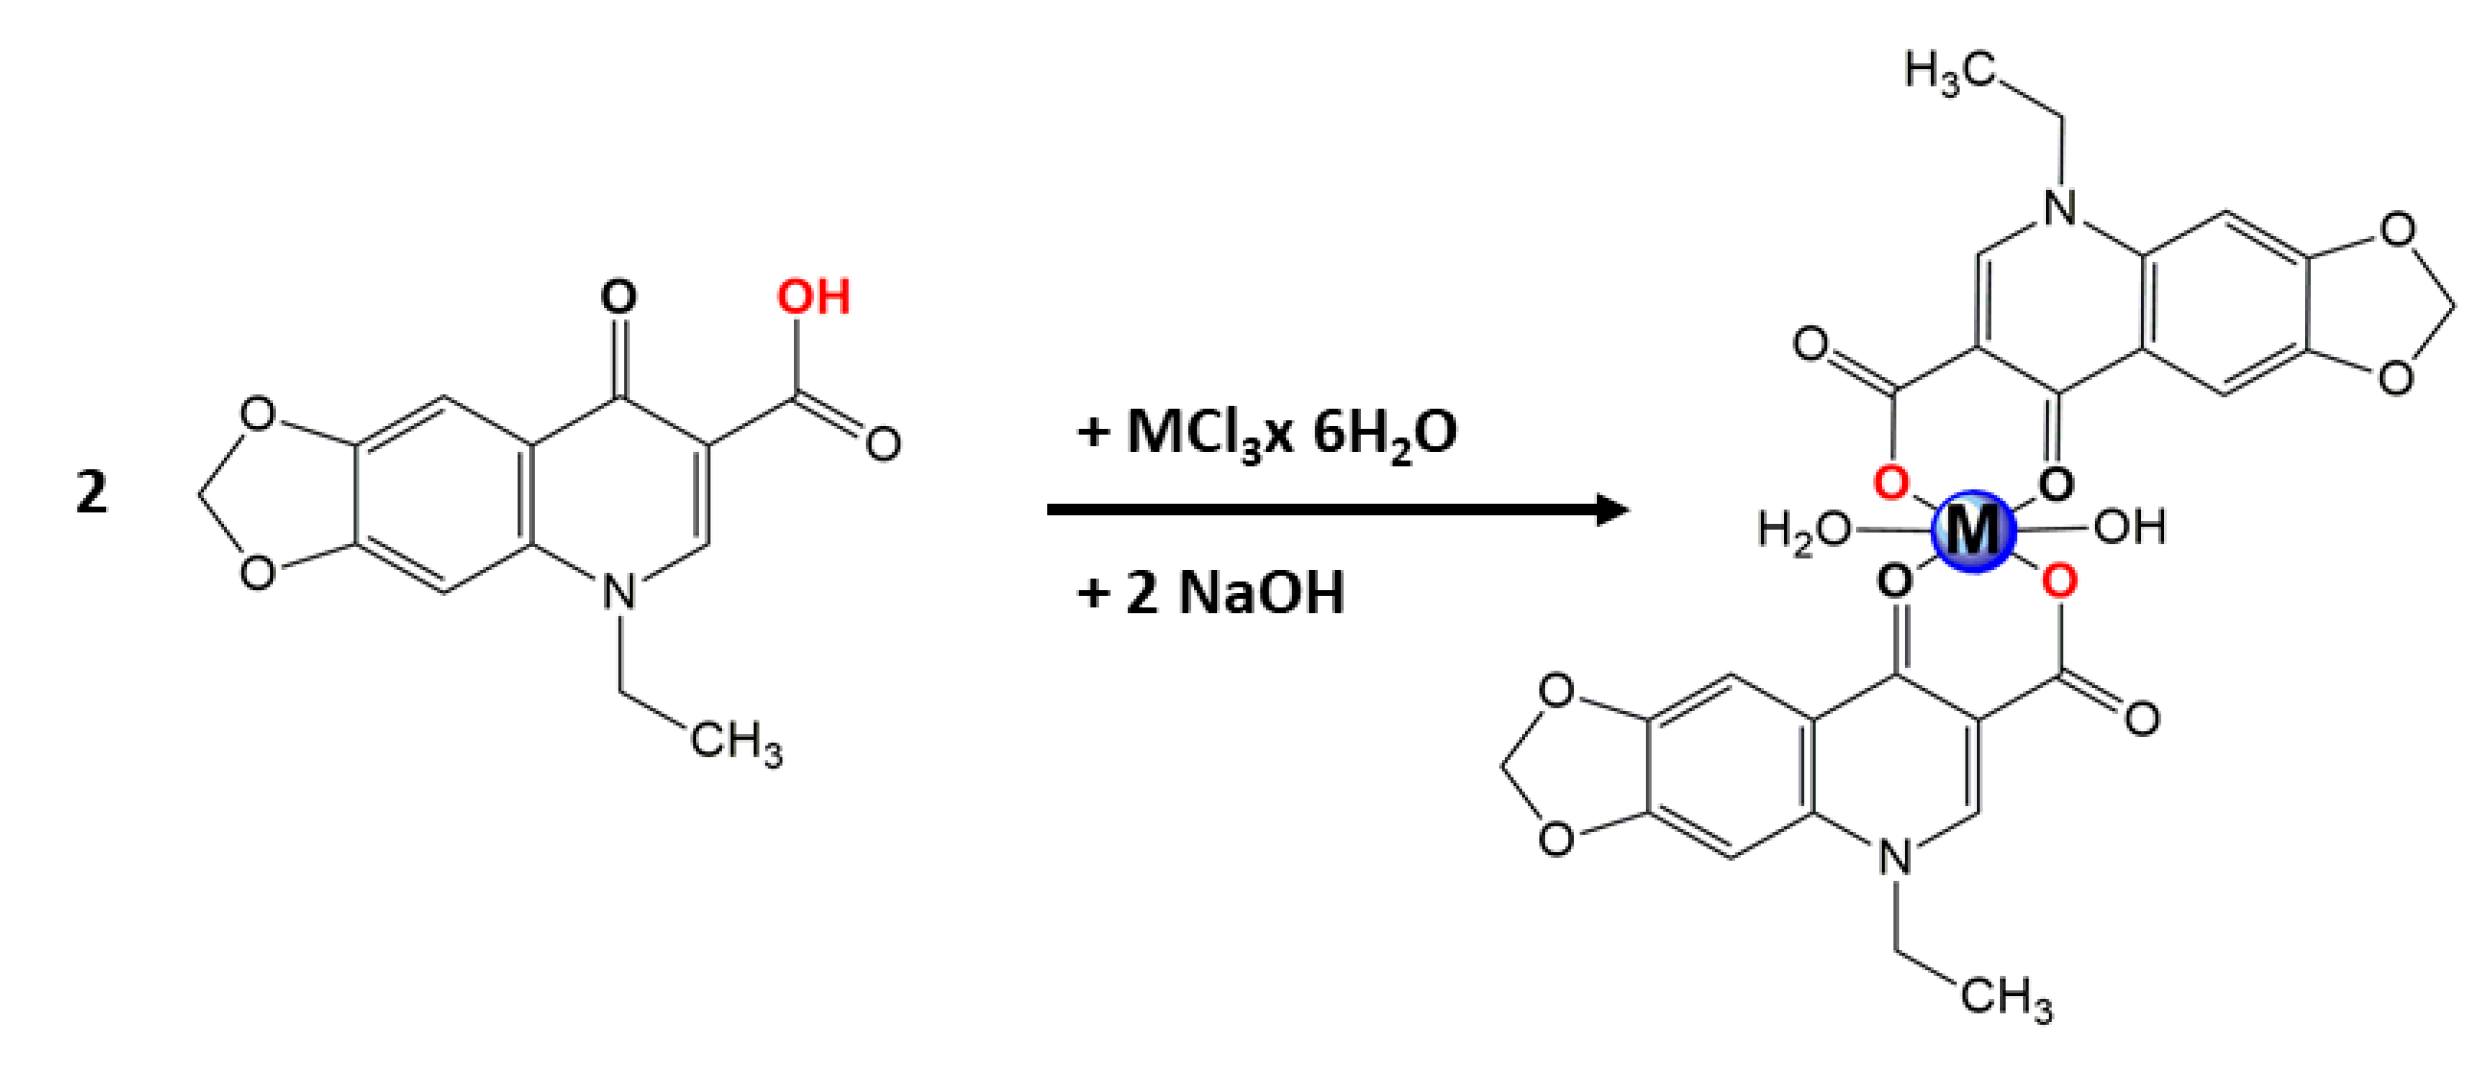
2.1. Syntheses of the Complexes
2.2. Physicochemical Characterization of the Complexes
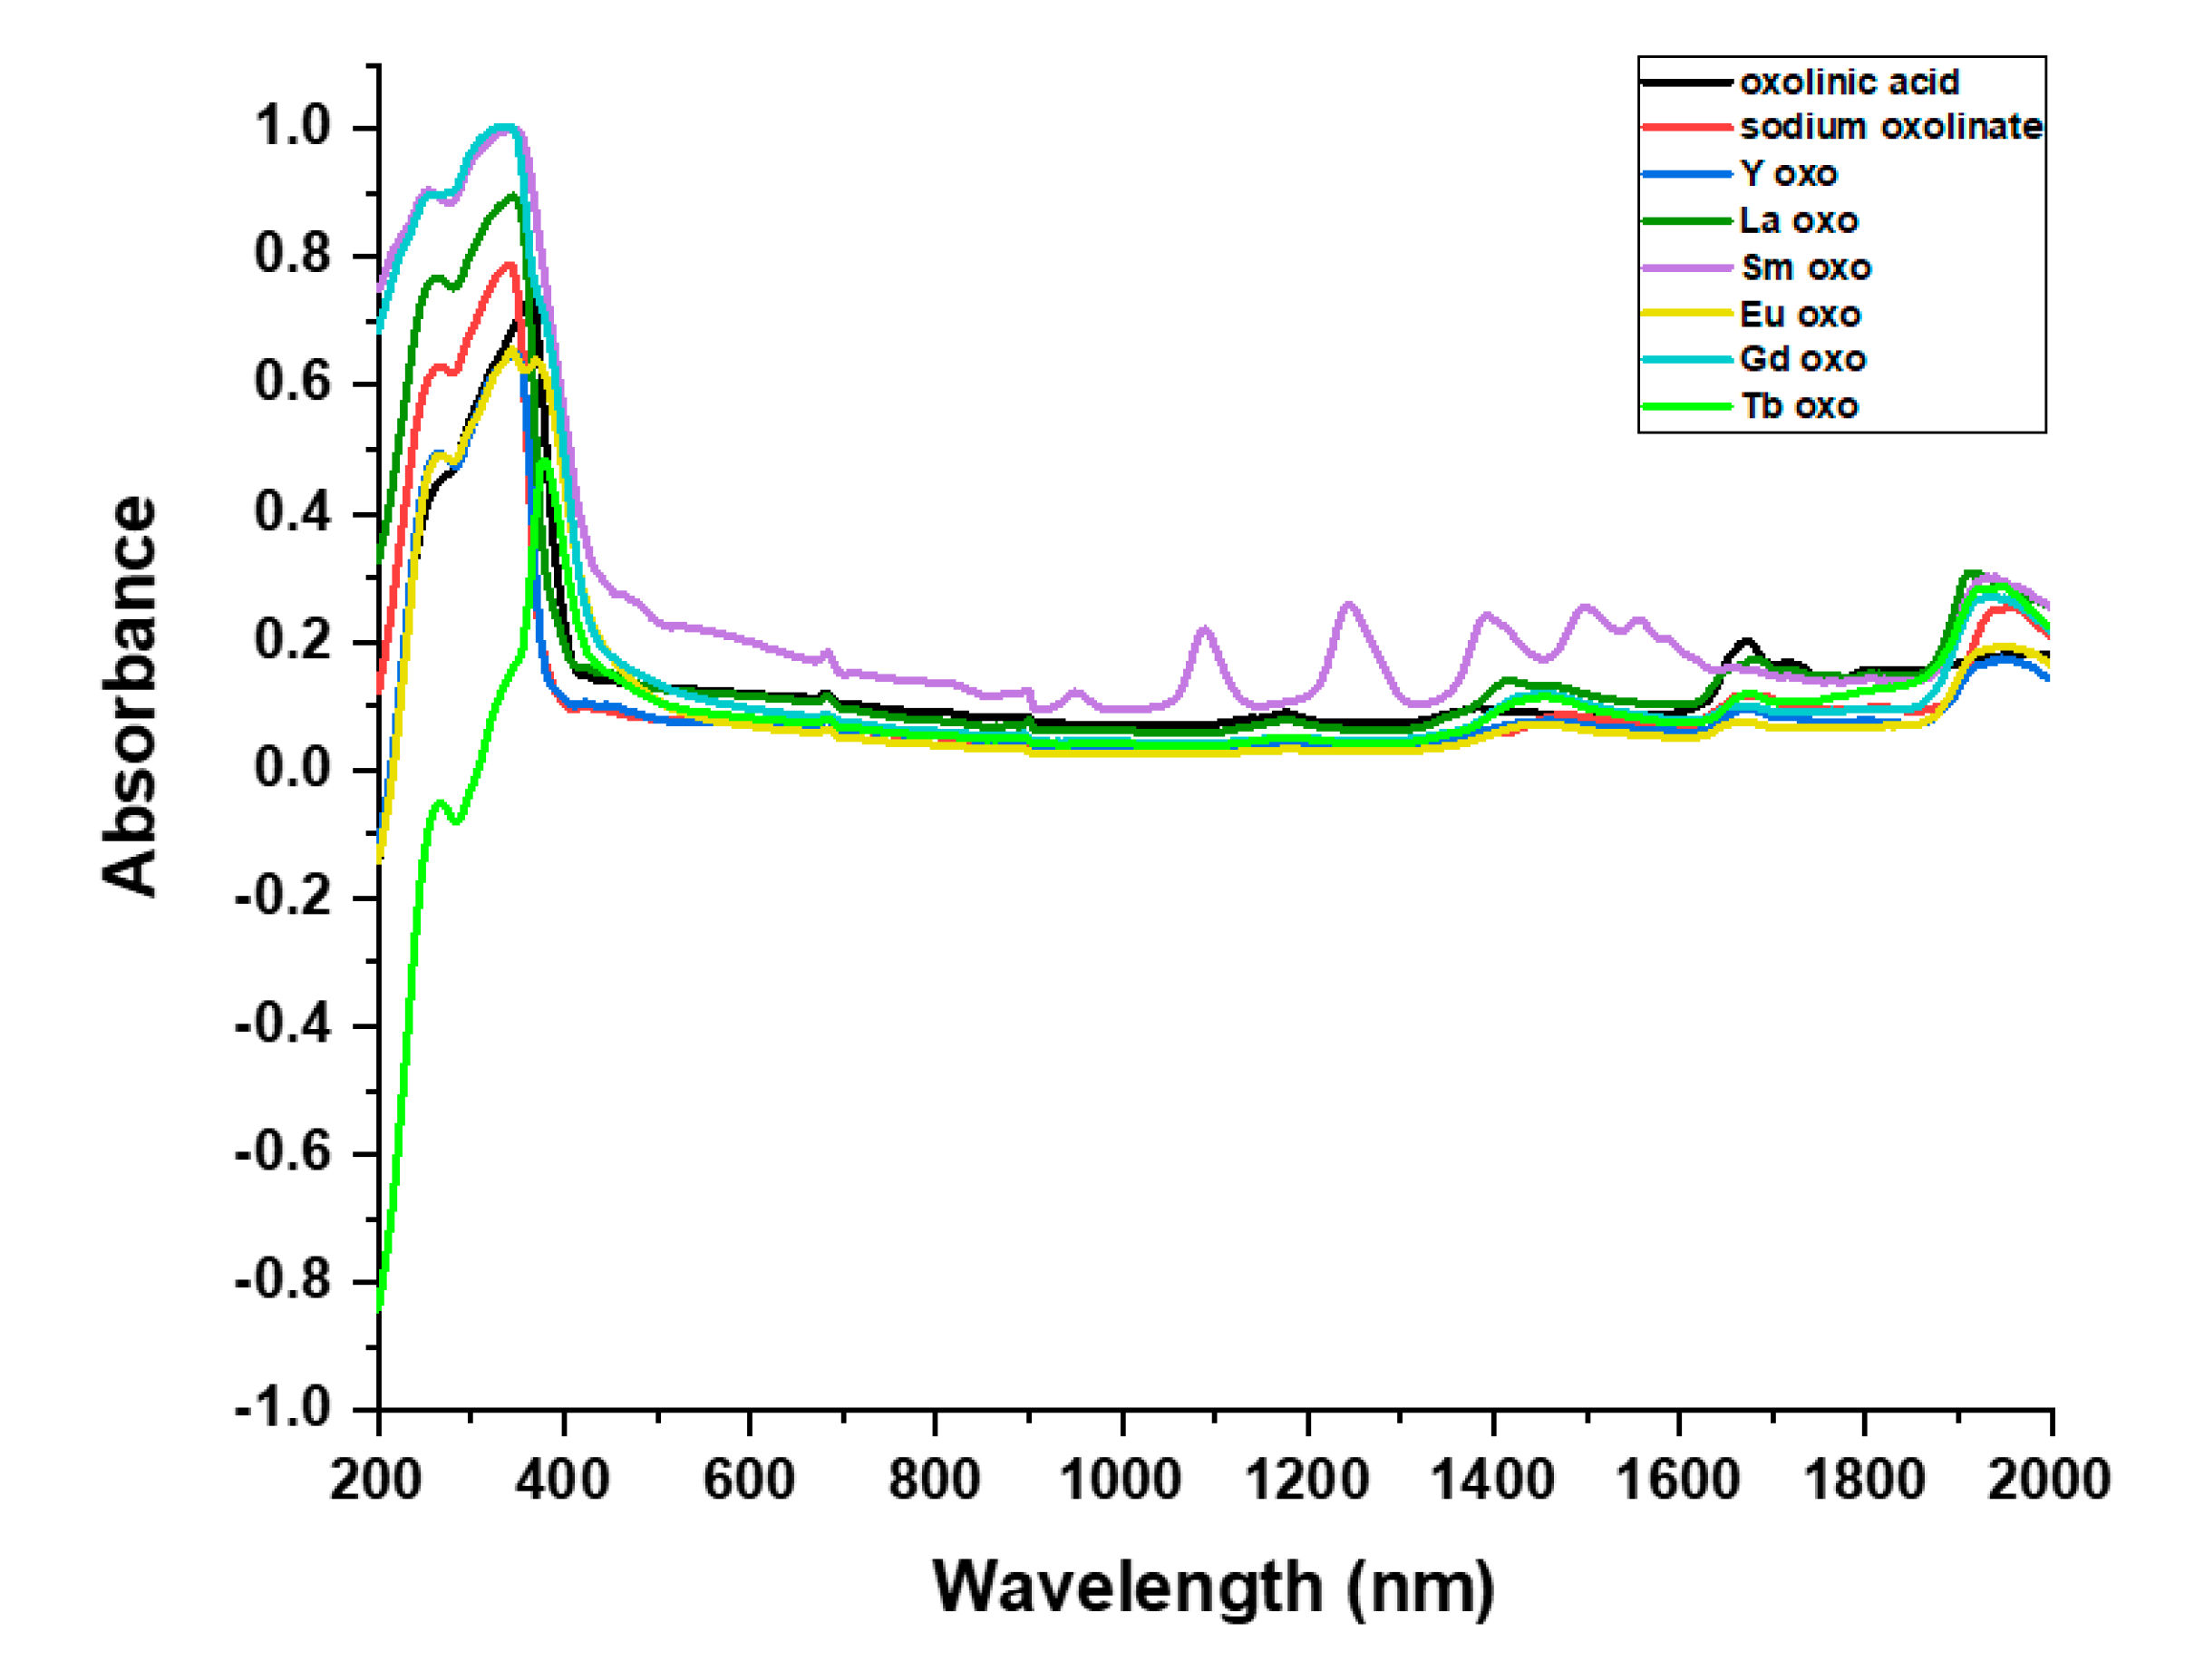
2.2.1. UV-Vis-NIR Spectra
2.2.2. FT-IR Spectra
2.2.3. Mass Spectra
2.2.4. Thermal Behavior
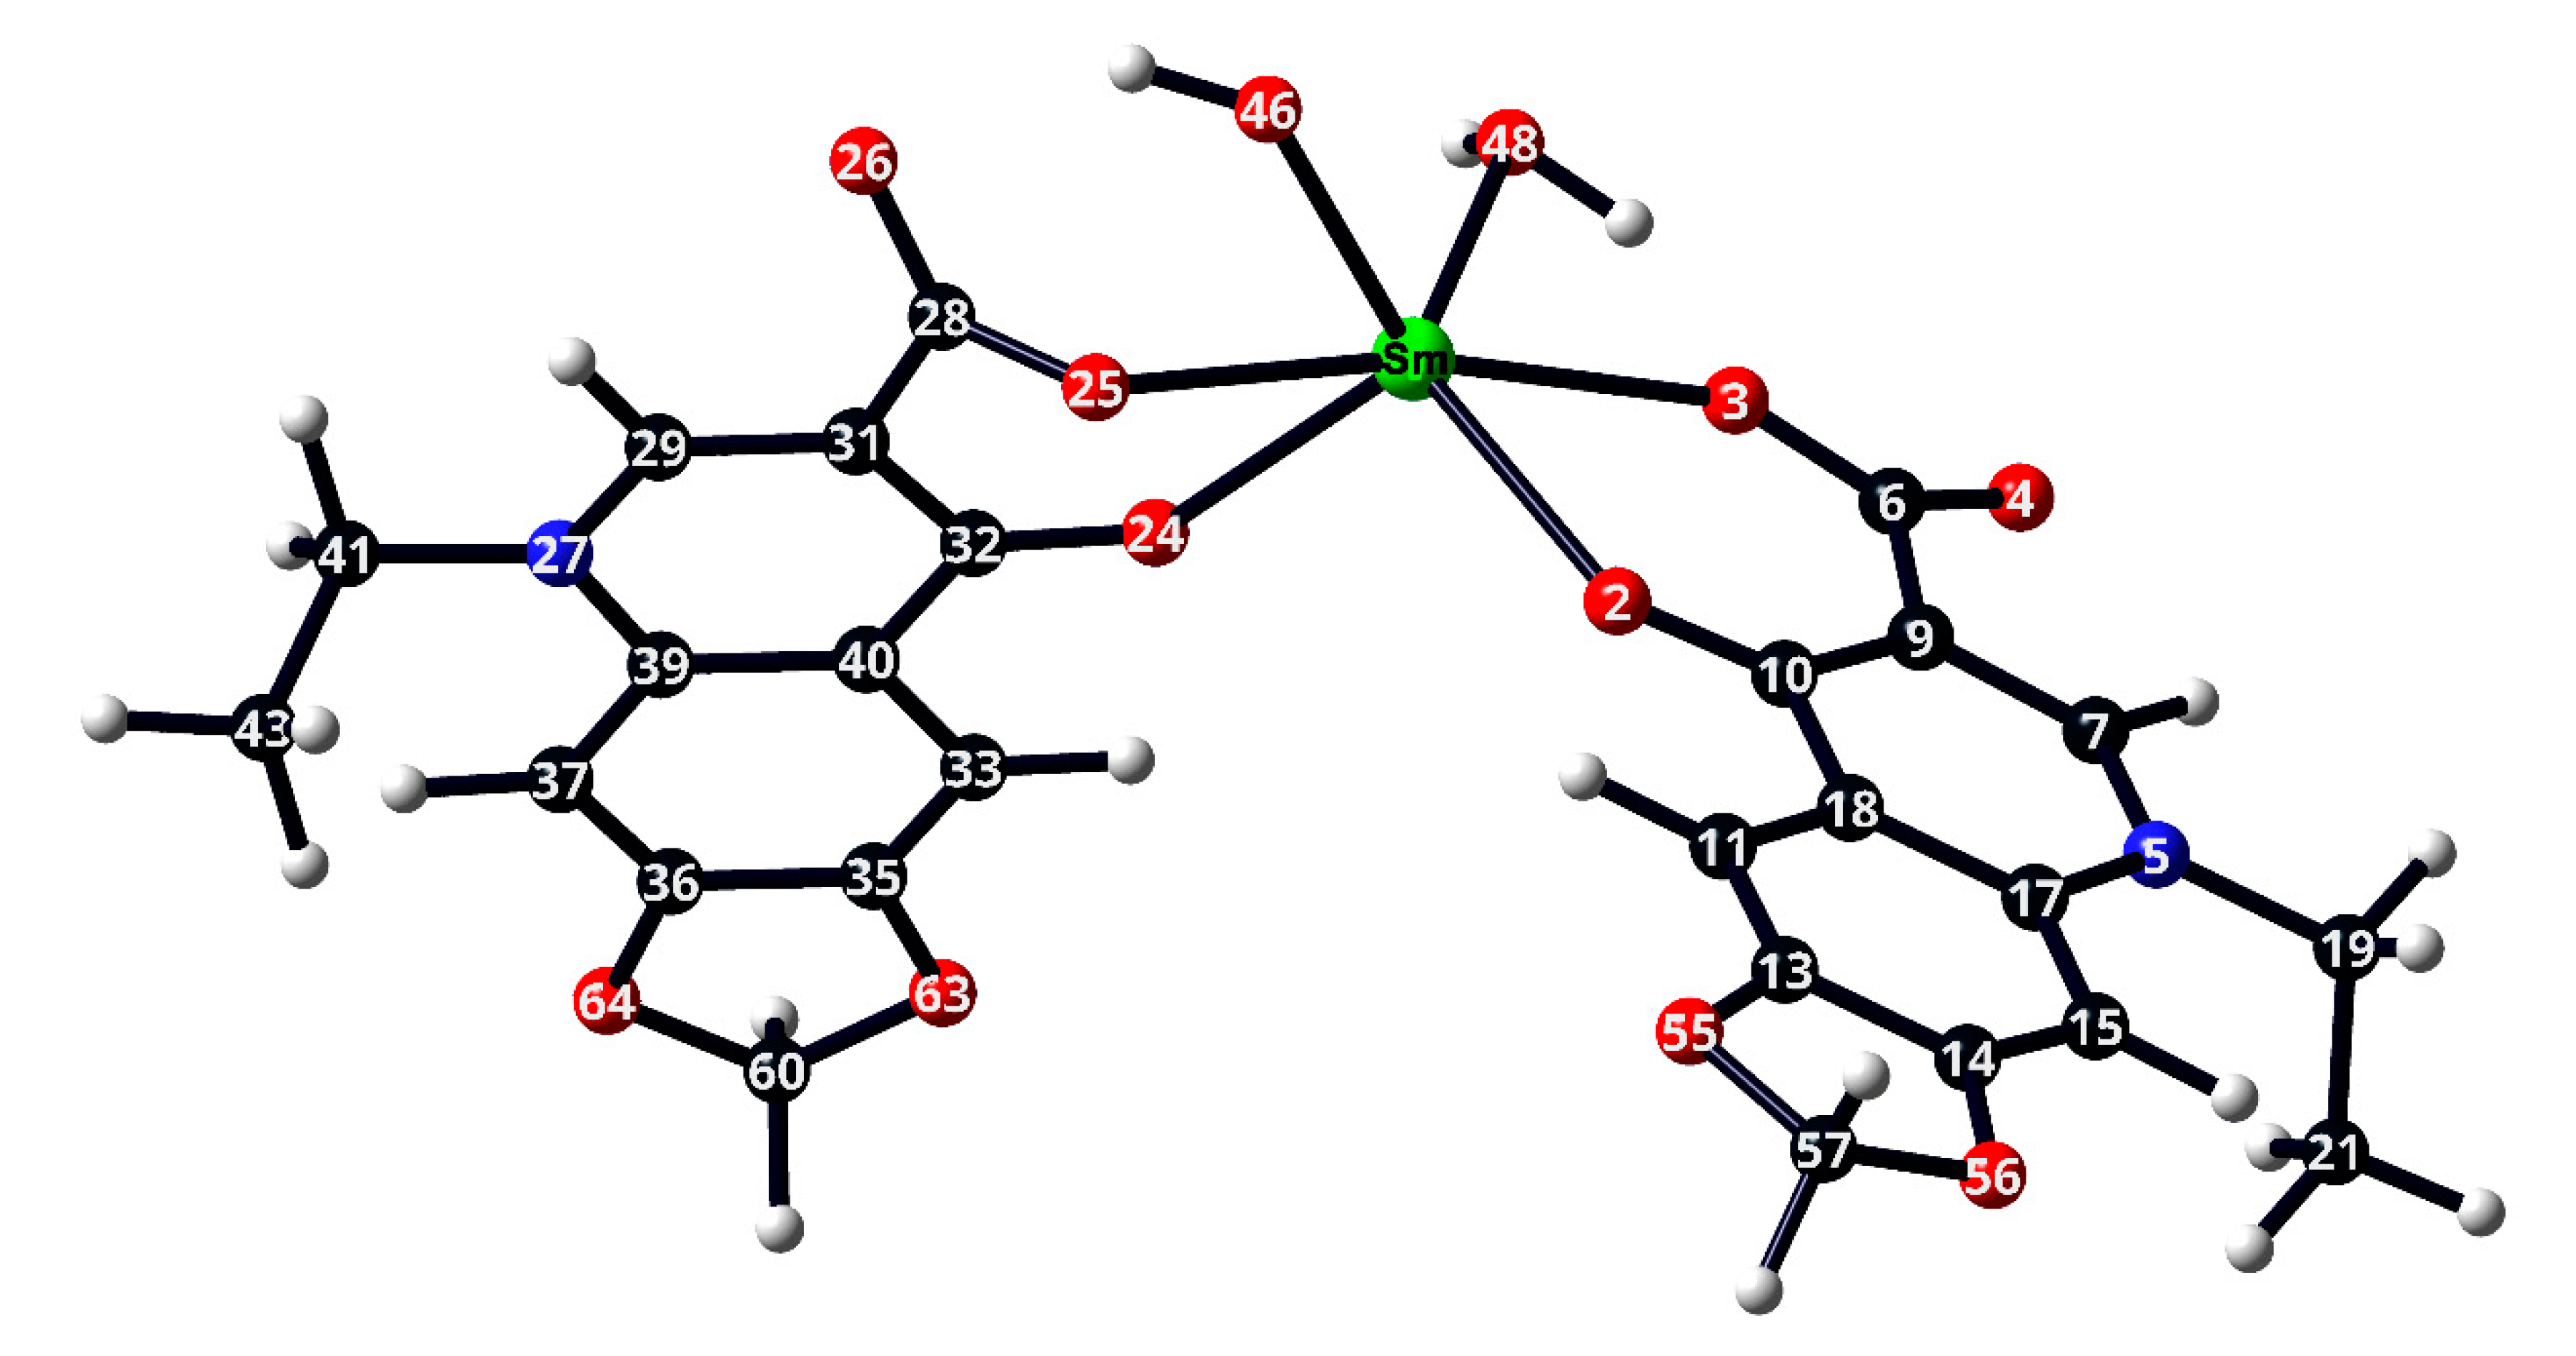
2.3. DFT Calculations
2.4. Biological Studies
2.4.1. Cytotoxicity Studies
2.4.2. Studies on DNA Binding
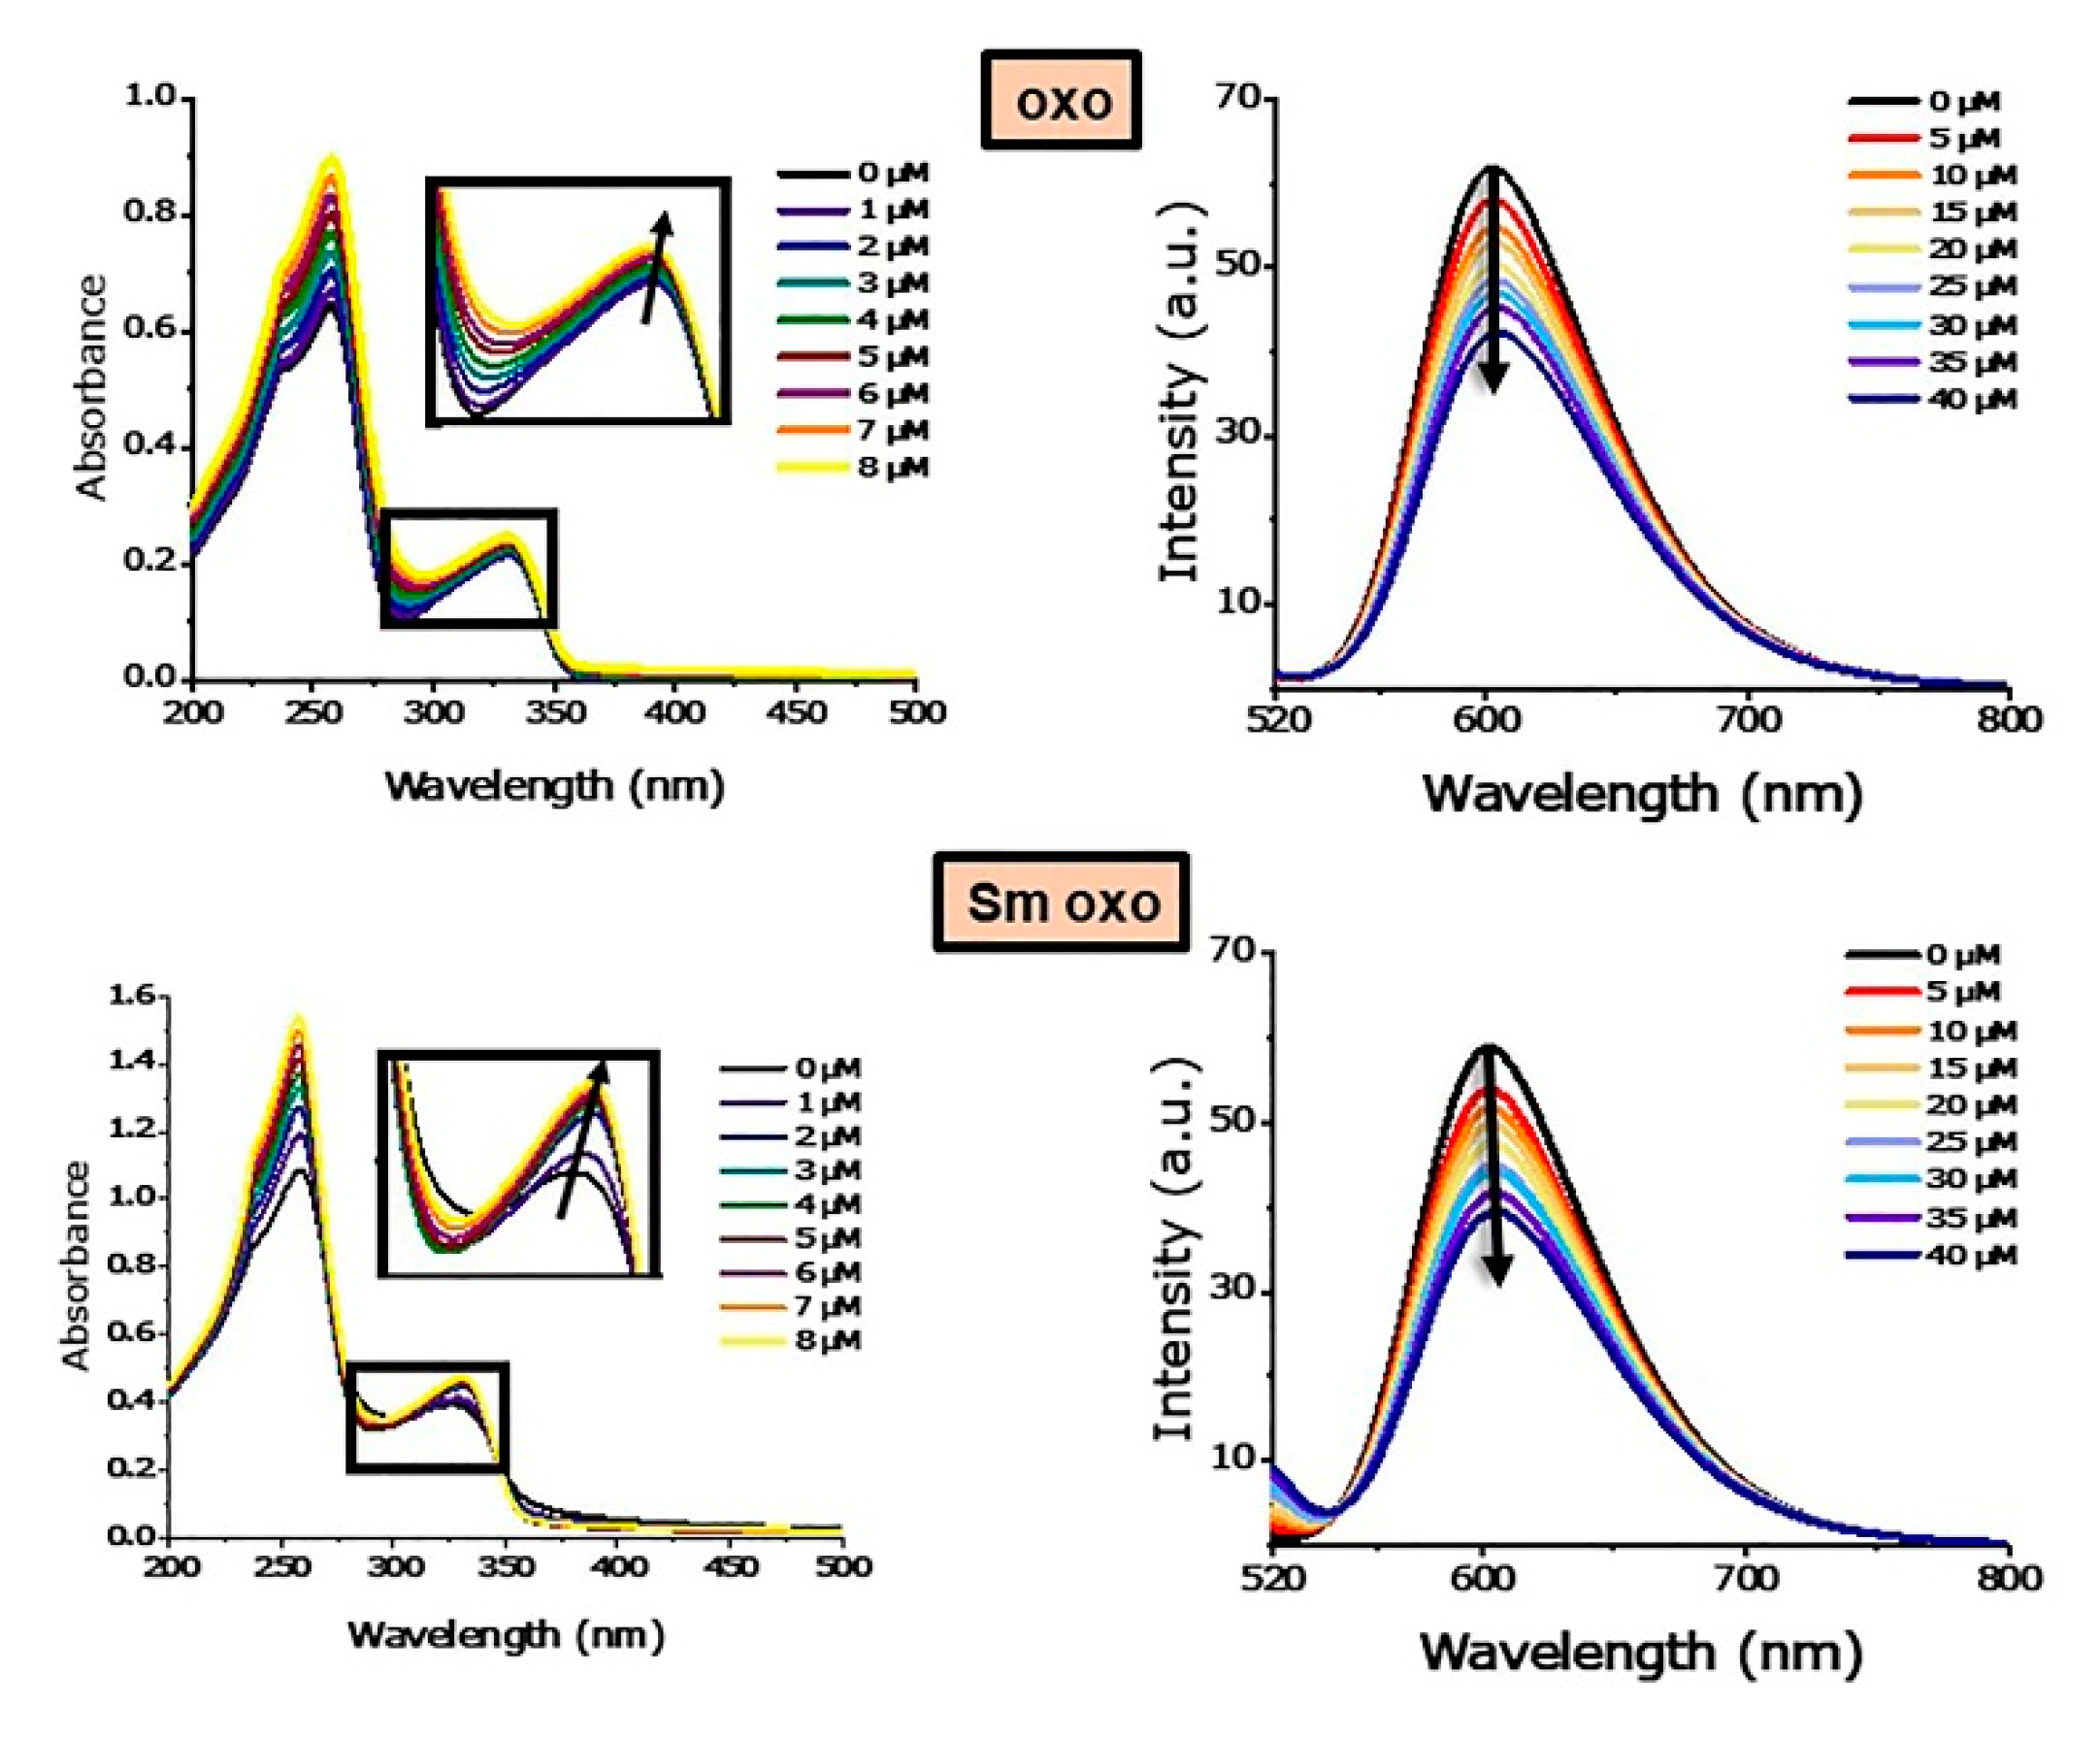
UV-Vis Spectra
Competitive Binding Assay with Ethidium Bromide (EB) through Fluorescence Spectroscopy
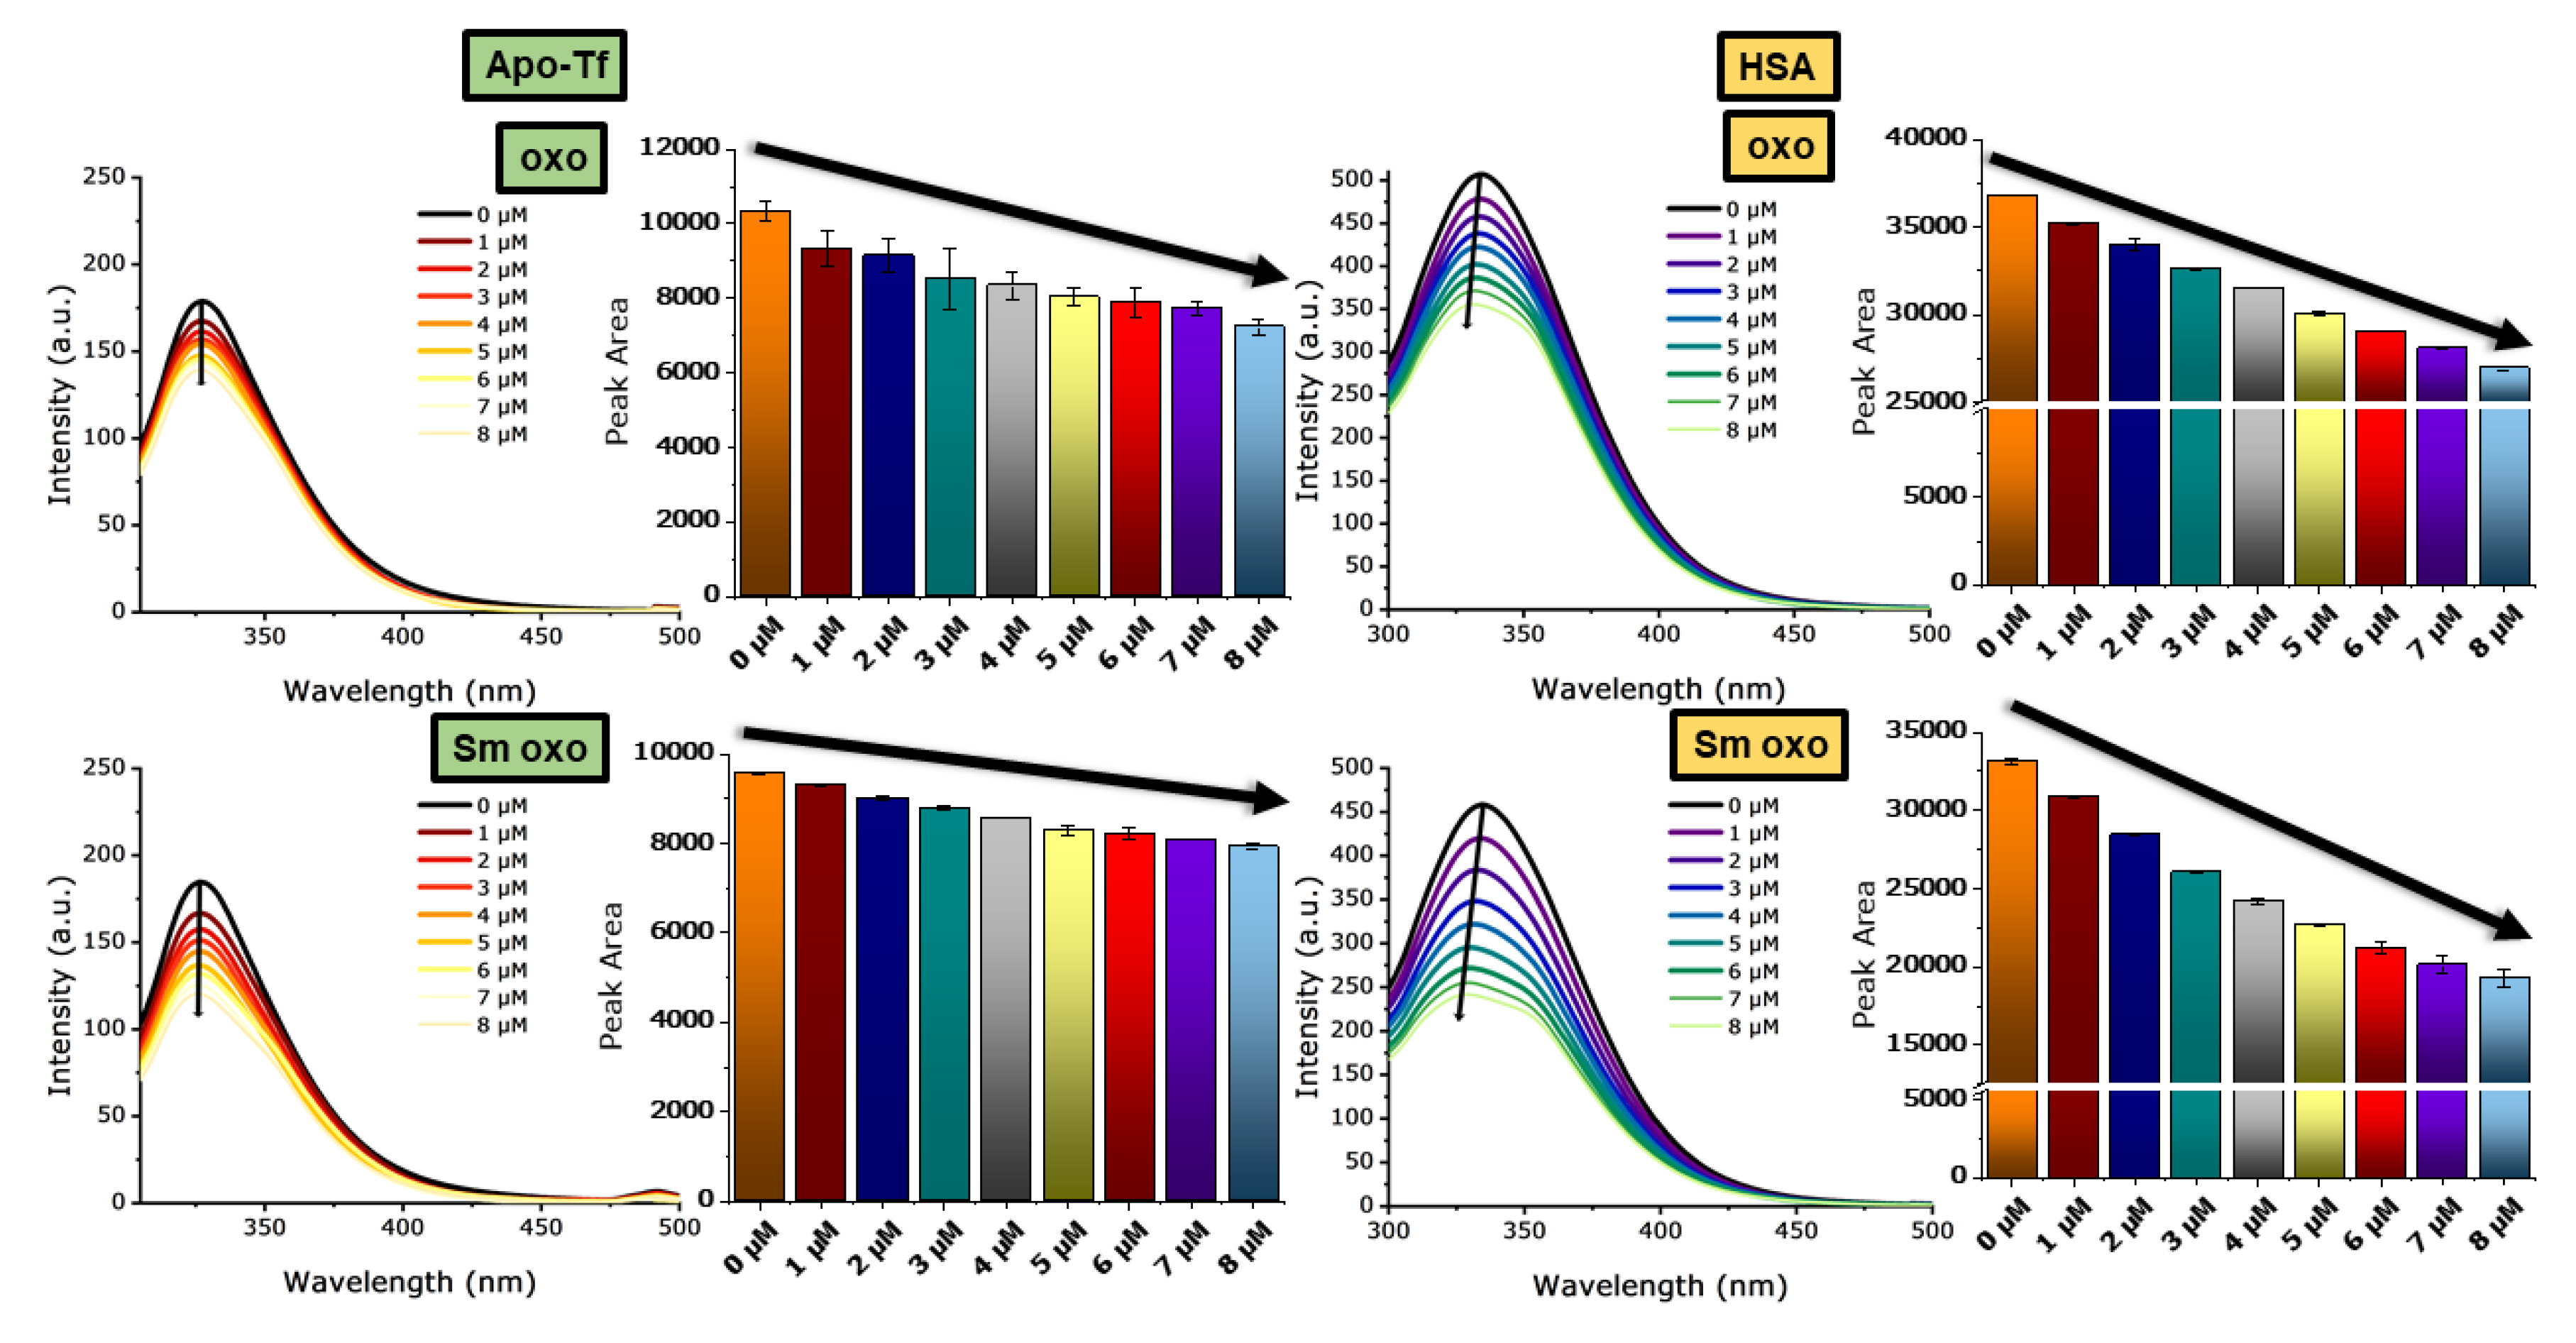
2.4.3. Interactions with Human Serum Albumin (HSA) and Apo-Transferrin (apo-Tf)
Studies Regarding the Fluorescence Quenching Mechanism
Studies on Conformational Changes of HSA and Apo-Tf Due to the Interaction with the Tested Compounds
3. Materials and Methods
3.1. Materials
3.2. Synthesis
- Y oxo—Y(C26H20N2O10)(OH)(H2O), MW = 644.37 g/mol; Elemental analysis found (calculated): %C 48.97 (48.46), %H 3.53 (3.60), N% 3.89 (4.35); Molar conductance (DMSO, Ω−1∙cm2∙mol−1): 2.1; MS (ESI+): m/z: 761.04 ([Y(oxo)2(DMSO)2]+); UV-vis (nm): 1945, 345, 265; FT-IR (cm−1): 3724 (w, ν(O-H) coordinated water molecule), 3055 (w, (ν(O-H) lattice water), 2973 (w, ν(C-H)), 2924 (ν(C-H)), 1630 (s, ν(O-C-O)as), 1594 (s, ν(C=O)pyridone), 1338 (s, ν(O-C-O)s).
- La oxo—La(C26H20N2O10)(OH)(H2O), MW = 694.37 g/mol; Elemental analysis found (calculated): %C 44.95 (44.97), %H 3.08 (3.34), N% 4.16 (4.03); Molar conductance (DMSO, Ω−1∙cm2∙mol−1): 6.6; MS (ESI+): m/z: 815.05 ([La(oxo)2(DMSO)2]+); UV-vis (nm): 1910, 345, 266; FT-IR (cm−1): 3392 (w, ν(O-H) coordinated water molecule), 3060 (w, ν(C-H)), 2982 (w, ν(C-H)), 1632 (s, ν(O-C-O)as), 1577 (s, ν(C=O)pyridone), 1340 (s, ν(O-C-O)s).
- Sm oxo—[Sm(C26H20N2O10)(OH)(H2O) · H2O, MW = 723.84 g/mol; Elemental analysis found (calculated): %C 41.13 (43.14), %H 3.19 (3.48), N% 4.47 (3.87); Molar conductance (DMSO, Ω−1∙cm2∙mol−1): 2.7; MS (ESI+): m/z: 828.05 ([Sm(oxo)2(DMSO)2]+), 750.04 ([Sm(oxo)2(DMSO)]+), 672.02 ([Sm(oxo)2]+); UV-vis (nm): 1940, 1930, 1555, 1500, 1390, 1245, 1090, 345, 255; FT-IR (cm−1): 3345 (w, ν(O-H) coordinated water molecule), 2917 (w, ν(C-H)), 1634 (s, ν(O-C-O)as), 1576 (s, ν(C=O)pyridone), 1340 (s, ν(O-C-O)s).
- Eu oxo—Eu(C26H20N2O10)(OH)(H2O), MW = 707.43 g/mol; Elemental analysis found (calculated): %C 43.91 (44.14), %H 2.92 (3.28), N% 4.24 (3.96); Molar conductance (DMSO, Ω−1∙cm2∙mol−1): 3.5; MS (ESI+): m/z: 829.05 ([Eu(oxo)2(DMSO)2]+), 751.04 ([Eu(oxo)2(DMSO)]+), 671.02 ([Eu(oxo)2]+); UV-vis (nm): 1945, 345, 270; FT-IR (cm−1): 3389 (w, ν(O-H) coordinated water molecule), 2984 (w, ν(C-H)), 1633 (s, ν(O-C-O)as), 1579 (s, ν(C=O)pyridone), 1340 (s, ν(O-C-O)s).
- Gd oxo—[Gd(C26H20N2O10)(OH)(H2O)] · 0.5H2O, MW = 721.72 g/mol; Elemental analysis found (calculated): %C 43.52 (43.26), %H 3.17 (3.35), N% 4.17 (3.88); Molar conductance (DMSO, Ω−1∙cm2∙mol−1): 2.1; MS (ESI+): m/z: 834.05 ([Gd(oxo)2(DMSO)2]+), 756.04 ([Gd(oxo)2(DMSO)]+), 676.03 ([Gd(oxo)2]+); UV-vis (nm): 1950, 1940, 340, 260; FT-IR (cm−1): 3378 (w, ν(O-H) coordinated water molecule), 3059 (w, (ν(O-H) lattice water), 1633 (s, ν(O-C-O)as), 1579 (s, ν(C=O)pyridone), 1341 (s, ν(O-C-O)s).
- Tb oxo—[Tb(C26H20N2O10)(OH)(H2O)] ·0.5H2O, MW = 723.40 g/mol; Elemental analysis found (calculated): %C 43.31 (43.16), %H 3.39 (3.35), N% 4.18 (3.87); Molar conductance (DMSO, Ω−1∙cm2∙mol−1): 3.2; MS (ESI+): m/z: 835.07 ([Tb(oxo)2(DMSO)2]+); UV-vis: 1945, 380; FT-IR (cm−1): 3391 (w, ν(O-H) coordinated water molecule), 3057 (w, (ν(O-H) lattice water), 2976 (w, ν(C-H)), 2921 (w, ν(C-H)), 1631 (s, ν(O-C-O)as), 1562 (s, ν(C=O)pyridone), 1336 (s, ν(O-C-O)s).
3.3. Physico-Chemical Characterization
3.4. Geometry Optimization Study
3.4.1. Cytotoxicity
3.4.2. Studies on DNA Binding
UV-Vis Spectra
Competitive Binding Assay with Ethidium Bromide (EB) through Fluorescence Spectroscopy
3.4.3. Interactions with Human Serum Albumin (HSA) and Apo-Transferrin (apo-Tf)
Studies on Fluorescence Quenching Mechanism
Studies on Conformational Changes of HSA and Apo-Tf Conformation Due to the Interaction with the Tested Compounds
4. Conclusions
Supplementary Materials
Author Contributions
Funding
Conflicts of Interest
References
- Yadav, V.; Talwar, P. Repositioning of fluoroquinolones from antibiotic to anti-cancer agents: An underestimated truth. Biomed. Pharmacother. 2019, 111, 934–946. [Google Scholar] [CrossRef]
- Guerra, W.; Silva-Caldeira, P.P.; Terenzi, H.; Pereira-Maia, E.C. Impact of metal coordination on the antibiotic and non-antibiotic activities of tetracycline-based drugs. Coord. Chem. Rev. 2016, 327, 188–199. [Google Scholar] [CrossRef]
- Möhler, J.S.; Kolmar, T.; Synnatschke, K.; Hergert, M.; Wilson, L.A.; Ramu, S.; Elliott, A.G.; Blaskovich, M.A.T.; Sidjabat, H.E.; Paterson, D.L. Enhancement of antibiotic-activity through complexation with metal ions-Combined ITC, NMR, enzymatic and biological studies. J. Inorg. Biochem. 2017, 167, 134–141. [Google Scholar] [CrossRef] [PubMed] [Green Version]
- Zhang, G.-F.; Zhang, S.; Pan, B.; Liu, X.; Feng, L.-S. 4-Quinolone derivatives and their activities against Gram positive pathogens. Eur. J. Med. Chem. 2018, 143, 710–723. [Google Scholar] [CrossRef] [PubMed]
- Kocsis, B.; Domokos, J.; Szabo, D. Chemical structure and pharmacokinetics of novel quinolone agents represented by avarofloxacin, delafloxacin, finafloxacin, zabofloxacin and nemonoxacin. Ann. Clin. Microbiol. Antimicrob. 2016, 15, 34. [Google Scholar] [CrossRef] [PubMed] [Green Version]
- Dhiman, P.; Arora, N.; Thanikachalam, P.V.; Monga, V. Recent advances in the synthetic and medicinal perspective of quinolones: A review. Bioorg. Chem. 2019, 92, 103291. [Google Scholar] [CrossRef] [PubMed]
- Nagaraja, V.; Godbole, A.A.; Henderson, S.R.; Maxwell, A. DNA topoisomerase I and DNA gyrase as targets for TB therapy. Drug Discov. Today 2017, 22, 510–518. [Google Scholar] [CrossRef] [PubMed] [Green Version]
- Charrier, C.; Salisbury, A.-M.; Savage, V.J.; Duffy, T.; Moyo, E.; Chaffer-Malam, N.; Ooi, N.; Newman, R.; Cheung, J.; Metzger, R.; et al. Novel bacterial topoisomerase inhibitors with potent broad-spectrum activity against drug-resistant bacteria. Antimicrob. Agents Chemother. 2017, 61, e02100-16. [Google Scholar] [CrossRef] [Green Version]
- Kato, J.; Nishimura, Y.; Imamura, R.; Niki, H.; Hiraga, S.; Suzuki, H. New topoisomerase essential for chromosome segregation in E. coli. Cell 1990, 63, 393–404. [Google Scholar] [CrossRef]
- Idowu, T.; Schweizer, F. Ubiquitous nature of fluoroquinolones: The oscillation between antibacterial and anticancer activities. Antibiotics 2017, 6, 26. [Google Scholar] [CrossRef] [Green Version]
- Drlica, K.; Malik, M.; Kerns, R.J.; Zhao, X. Quinolone-mediated bacterial death. Antimicrob. Agents Chemother. 2008, 52, 385–392. [Google Scholar] [CrossRef] [PubMed] [Green Version]
- Dwyer, D.J.; Kohanski, M.A.; Hayete, B.; Collins, J.J. Gyrase inhibitors induce an oxidative damage cellular death pathway in Escherichia coli. Mol. Syst. Biol. 2007, 3, 91. [Google Scholar] [CrossRef] [PubMed]
- Blower, T.R.; Williamson, B.H.; Kerns, R.J.; Berger, J.M. Crystal structure and stability of gyrase-fluoroquinolone cleaved complexes from Mycobacterium tuberculosis. Proc. Natl. Acad. Sci. USA. 2016, 113, 1706–1713. [Google Scholar] [CrossRef] [Green Version]
- Wohlkonig, A.; Chan, P.F.; Fosberry, A.P.; Homes, P.; Huang, J.; Kranz, M.; Leydon, V.R.; Miles, T.J.; Pearson, N.D.; Perera, R.L.; et al. Structural basis of quinolone inhibition of type IIA topoisomerases and target-mediated resistance. Nat. Struct. Mol. Biol. 2010, 17, 1152–1153. [Google Scholar] [CrossRef] [PubMed]
- Dalhoff, A.; Shalit, I. Immunomodulatory effects of quinolones. Lancet. Infect. Dis. 2003, 3, 359–371. [Google Scholar] [CrossRef]
- Mukherjee, P.; Mandal, E.R.; Das, S.K. Evaluation of antiproliferative activity of enoxacin on a human breast cancer cell line. Int. J. Hum. Genet. 2005, 5, 57–63. [Google Scholar] [CrossRef]
- Yu, M.; Li, R.; Zhang, J. Repositioning of antibiotic levofloxacin as a mitochondrial biogenesis inhibitor to target breast cancer. Biochem. Biophys. Res. Commun. 2016, 471, 639–645. [Google Scholar] [CrossRef]
- Perucca, P.; Savio, M.; Cazzalini, O.; Mocchi, R.; Maccario, C.; Sommatis, S.; Ferraro, D.; Pizzala, R.; Pretali, L.; Fasani, E. Structure–activity relationship and role of oxygen in the potential antitumour activity of fluoroquinolones in human epithelial cancer cells. J. Photochem. Photobiol. B Biol. 2014, 140, 57–68. [Google Scholar] [CrossRef]
- Sousa, E.J.; Graca, I.; Baptista, T.; Vieira, F.Q.; Palmeira, C.; Henrique, R.; Jeronimo, C. Enoxacin inhibits growth of prostate cancer cells and effectively restores microRNA processing. Epigenetics 2013, 8, 548–558. [Google Scholar] [CrossRef] [Green Version]
- Aranha, O.; Grignon, R.; Fernandes, N.; McDonnell, T.J.; Wood, D.P.; Sarkar, F.H. Suppression of human prostate cancer cell growth by ciprofloxacin is associated with cell cycle arrest and apoptosis. Int. J. Oncol. 2003, 22, 787–794. [Google Scholar] [CrossRef]
- Aranha, O.; Wood, D.P.; Sarkar, F.H. Ciprofloxacin mediated cell growth inhibition, S/G2-M cell cycle arrest, and apoptosis in a human transitional cell carcinoma of the bladder cell line. Clin. Cancer Res. 2000, 6, 891–900. [Google Scholar] [PubMed]
- Chen, T.-C.; Hsu, Y.-L.; Tsai, Y.-C.; Chang, Y.-W.; Kuo, P.-L.; Chen, Y.-H. Gemifloxacin inhibits migration and invasion and induces mesenchymal–epithelial transition in human breast adenocarcinoma cells. J. Mol. Med. 2014, 92, 53–64. [Google Scholar] [CrossRef] [PubMed]
- Kan, J.-Y.; Hsu, Y.-L.; Chen, Y.-H.; Chen, T.-C.; Wang, J.-Y.; Kuo, P.-L. Gemifloxacin, a fluoroquinolone antimicrobial drug, inhibits migration and invasion of human colon cancer cells. Biomed Res. Int. 2013, 2013. [Google Scholar] [CrossRef] [PubMed]
- Gleckman, R.; Alvarez, S.; Joubert, D.W.; Matthews, S.J. Drug therapy reviews: Oxolinic acid. Am. J. Hosp. Pharm. 1979, 36, 1077–1079. [Google Scholar] [CrossRef]
- Pianotti, R.S.; Mohan, R.R.; Schwartz, B.S. Biochemical effects of oxolinic acid on Proteus vulgaris. J. Bacteriol. 1968, 95, 1622–1626. [Google Scholar] [CrossRef] [Green Version]
- Klein, D.; Matsen, J.M. In vitro susceptibility comparisons and recommendations for oxolinic acid. Antimicrob. Agents Chemother. 1976, 9, 649–654. [Google Scholar] [CrossRef] [Green Version]
- Neussel, H.; Linzenmeier, G. In vitro investigations with oxolinic acid, a new chemotherapeutic agent. Chemotherapy 1973, 18, 253–261. [Google Scholar] [CrossRef]
- Mannisto, P.T.; PT, M. Comparison of oxolinic acid, trimethoprim, and trimethoprim-sulfamethoxazole in the treatment and long-term control of urinary tract infection. Curr. Ther. Res. Clin. Exp. 1976, 20, 645–654. [Google Scholar]
- Ghatikar, K.N. A multicentric trial of a new synthetic antibacterial in urinary infections. Curr. Ther. Res. Clin. Exp. 1974, 16, 130. [Google Scholar]
- Clark, H.; Brown, N.K.; Wallace, J.F.; Turck, M. Emergence of resistant organisms as a function of dose in oxolinic acid therapy. Am. J. Med. Sci. 1971, 261, 145–148. [Google Scholar] [CrossRef]
- Barrón, D.; Jiménez-Lozano, E.; Bailac, S.; Barbosa, J. Simultaneous determination of flumequine and oxolinic acid in chicken tissues by solid phase extraction and capillary electrophoresis. Anal. Chim. Acta 2003, 477, 21–27. [Google Scholar] [CrossRef]
- Kwon, H.R.; Choi, G.J.; Choi, Y.H.; Jang, K.S.; Sung, N.; Kang, M.S.; Moon, Y.; Lee, S.K.; Kim, J. Suppression of pine wilt disease by an antibacterial agent, oxolinic acid. Pest Manag. Sci. Former. Pestic. Sci. 2010, 66, 634–639. [Google Scholar] [CrossRef] [PubMed]
- Sadeek, S.; El-Shwiniy, W.; El-Attar, M. Synthesis, characterization and antimicrobial investigation of some moxifloxacin metal complexes. Spectrochim. Acta. A Mol. Biomol. Spectrosc. 2011, 84, 99–110. [Google Scholar] [CrossRef] [PubMed]
- Li, Y.-X.; Chen, Z.-F.; Xiong, R.-G.; Xue, Z.; Ju, H.-X.; You, X.-Z. A mononuclear complex of norfloxacin with silver (I) and its properties. Inorg. Chem. Commun. 2003, 6, 819–822. [Google Scholar] [CrossRef]
- Gao, F.; Yang, P.; Xie, J.; Wang, H. Synthesis, characterization and antibacterial activity of novel Fe (III), Co (II), and Zn (II) complexes with norfloxacin. J. Inorg. Biochem. 1995, 60, 61–67. [Google Scholar]
- Song, G.; Yan, Q.; He, Y. Studies on interaction of norfloxacin, Cu2+, and DNA by spectral methods. J. Fluoresc. 2005, 15, 673. [Google Scholar] [CrossRef]
- Drevensek, P.; Turel, I.; Poklar Ulrih, N. Influence of copper(II) and magnesium(II) ions on the ciprofloxacin binding to DNA. J. Inorg. Biochem. 2003, 96, 407–415. [Google Scholar] [CrossRef]
- Guo, D.-S.; Jing, B.-Y.; Yuan, X.-Y. Influence of Mg+2 and Cu+2 on the interaction between quinolone and calf thymus DNA. J. Fluoresc. 2011, 21, 113–118. [Google Scholar] [CrossRef]
- Robles, J.; Martín-Polo, J.; Alvarez-Valtierra, L.; Hinojosa, L.; Mendoza-Díaz, G. A Theoretical-experimental study on the structure and activity of certain quinolones and the interaction of their Cu(II)-complexes on a DNA model. Met. Based. Drugs 2000, 7, 301–311. [Google Scholar] [CrossRef] [Green Version]
- Uivarosi, V. Metal complexes of quinolone antibiotics and their applications: An update. Molecules 2013, 18, 11153–11197. [Google Scholar] [CrossRef]
- Rusu, A.; Hancu, G.; Cristina Munteanu, A.; Uivarosi, V. Development perspectives of silver complexes with antibacterial quinolones: Successful or not? J. Organomet. Chem. 2017, 839, 19–30. [Google Scholar] [CrossRef]
- Saha, D.K.; Padhye, S.; Anson, C.E.; Powell, A.K. Hydrothermal synthesis, crystal structure, spectroscopy, electrochemistry and antimycobacterial evaluation of the copper (II) ciprofloxacin complex: [Cu(cf)2(BF4)2]·6H2O. Inorg. Chem. Commun. 2002, 5, 1022–1027. [Google Scholar] [CrossRef]
- El-Halim, H.F.A.; Mohamed, G.G.; El-Dessouky, M.M.I.; Mahmoud, W.H. Ligational behaviour of lomefloxacin drug towards Cr(III), Mn(II), Fe(III), Co(II), Ni(II), Cu(II), Zn(II), Th(IV) and UO2(VI) ions: Synthesis, structural characterization and biological activity studies. Spectrochim. Acta Part A Mol. Biomol. Spectrosc. 2011, 82, 8–19. [Google Scholar] [CrossRef] [PubMed]
- Patitungkho, S.; Adsule, S.; Dandawate, P.; Padhye, S.; Ahmad, A.; Sarkar, F.H. Synthesis, characterization and anti-tumor activity of moxifloxacin-copper complexes against breast cancer cell lines. Bioorg. Med. Chem. Lett. 2011, 21, 1802–1806. [Google Scholar] [CrossRef] [PubMed]
- Batista, D.d.G.J.; da Silva, P.B.; Stivanin, L.; Lachter, D.R.; Silva, R.S.; Felcman, J.; Louro, S.R.W.; Teixeira, L.R.; Soeiro, M.d.N.C. Co(II), Mn(II) and Cu(II) complexes of fluoroquinolones: Synthesis, spectroscopical studies and biological evaluation against Trypanosoma cruzi. Polyhedron 2011, 30, 1718–1725. [Google Scholar] [CrossRef]
- Regiel-Futyra, A.; Dąbrowski, J.M.; Mazuryk, O.; Śpiewak, K.; Kyzioł, A.; Pucelik, B.; Brindell, M.; Stochel, G. Bioinorganic antimicrobial strategies in the resistance era. Coord. Chem. Rev. 2017, 351, 76–117. [Google Scholar] [CrossRef]
- Efthimiadou, E.K.; Thomadaki, H.; Sanakis, Y.; Raptopoulou, C.P.; Katsaros, N.; Scorilas, A.; Karaliota, A.; Psomas, G. Structure and biological properties of the copper (II) complex with the quinolone antibacterial drug N-propyl-norfloxacin and 2, 2′-bipyridine. J. Inorg. Biochem. 2007, 101, 64–73. [Google Scholar] [CrossRef]
- Shingnapurkar, D.; Butcher, R.; Afrasiabi, Z.; Sinn, E.; Ahmed, F.; Sarkar, F.; Padhye, S. Neutral dimeric copper–sparfloxacin conjugate having butterfly motif with antiproliferative effects against hormone independent BT20 breast cancer cell line. Inorg. Chem. Commun. 2007, 10, 459–462. [Google Scholar] [CrossRef]
- Lazarević, T.; Rilak, A.; Bugarčić, Ž.D. Platinum, palladium, gold and ruthenium complexes as anticancer agents: Current clinical uses, cytotoxicity studies and future perspectives. Eur. J. Med. Chem. 2017, 142, 8–31. [Google Scholar] [CrossRef]
- Gouvea, L.R.; Garcia, L.S.; Lachter, D.R.; Nunes, P.R.; de Castro Pereira, F.; Silveira-Lacerda, E.P.; Louro, S.R.W.; Barbeira, P.J.S.; Teixeira, L.R. Atypical fluoroquinolone gold (III) chelates as potential anticancer agents: Relevance of DNA and protein interactions for their mechanism of action. Eur. J. Med. Chem. 2012, 55, 67–73. [Google Scholar] [CrossRef]
- Măciucă, A.-M.; Munteanu, A.-C.; Uivarosi, V. Quinolone complexes with lanthanide ions: An insight into their analytical applications and biological activity. Molecules 2020, 25, 1347. [Google Scholar] [CrossRef] [PubMed] [Green Version]
- Montgomery, C.P.; New, E.J.; Parker, D.; Peacock, R.D. Enantioselective regulation of a metal complex in reversible binding to serum albumin: Dynamic helicity inversion signalled by circularly polarised luminescence. Chem. Commun. (Camb.) 2008, 4261–4263. [Google Scholar] [CrossRef] [PubMed]
- Hermann, P.; Kotek, J.; Kubíček, V.; Lukeš, I. Gadolinium(III) complexes as MRI contrast agents: Ligand design and properties of the complexes. Dalt. Trans. 2008, 3027–3047. [Google Scholar] [CrossRef] [PubMed]
- Xiao, Y.-D.; Paudel, R.; Liu, J.; Cong, M.; Zhang, Z.-S.; Zhou, S.-K. MRI contrast agents: Classification and application (Review). Int. J. Mol. Med. 2016, 38, 1319–1326. [Google Scholar] [CrossRef] [PubMed] [Green Version]
- Kim, H.-K.; Lee, G.H.; Chang, Y. Gadolinium as an MRI contrast agent. Future Med. Chem. 2018, 10, 639–661. [Google Scholar] [CrossRef] [PubMed]
- Franklin, S.J. Lanthanide-mediated DNA hydrolysis. Curr. Opin. Chem. Biol. 2001, 5, 201–208. [Google Scholar] [CrossRef]
- Komiyama, M.; Takeda, N.; Shigekawa, H. Hydrolysis of DNA and RNA by lanthanide ions: Mechanistic studies leading to new applications. Chem. Commun. 1999, 1443–1451. [Google Scholar] [CrossRef]
- Hussain, A.; Chakravarty, A.R. Photocytotoxic lanthanide complexes. J. Chem. Sci. 2012, 124, 1327–1342. [Google Scholar] [CrossRef] [Green Version]
- Liu, C.; Wang, M.; Zhang, T.; Sun, H. DNA hydrolysis promoted by di-and multi-nuclear metal complexes. Coord. Chem. Rev. 2004, 248, 147–168. [Google Scholar] [CrossRef]
- Sreedhara, A.; Cowan, J.A. Catalytic hydrolysis of DNA by metal ions and complexes. JBIC J. Biol. Inorg. Chem. 2001, 6, 337–347. [Google Scholar] [CrossRef]
- Xu, M.; Chen, F.-J.; Huang, L.; Xi, P.; Zeng, Z. Binding of rare earth metal complexes with an ofloxacin derivative to bovine serum albumin and its effect on the conformation of protein. J. Lumin. 2011, 131, 1557–1565. [Google Scholar] [CrossRef]
- Xu, M.; Zhang, Y.; Xu, Z.; Zeng, Z. Crystal structure, biological studies of water-soluble rare earth metal complexes with an ofloxacin derivative. Inorganica Chim. Acta 2012, 384, 324–332. [Google Scholar] [CrossRef]
- Fu, P.K.-L.; Turro, C. Energy transfer from nucleic acids to Tb (III): Selective emission enhancement by single DNA mismatches. J. Am. Chem. Soc. 1999, 121, 1–7. [Google Scholar] [CrossRef]
- Xu, L.; Zhou, L.; Chen, X.; Shen, X.; Wang, J.; Zhang, J.; Pei, R. Luminescence sensitization of Tb3+-DNA complexes by Ag+. Spectrochim. Acta Part A Mol. Biomol. Spectrosc. 2017, 180, 85–90. [Google Scholar] [CrossRef]
- White, G.F.; Litvinenko, K.L.; Meech, S.R.; Andrews, D.L.; Thomson, A.J. Multiphoton-excited luminescence of a lanthanide ion in a protein complex: Tb3+ bound to transferrin. Photochem. Photobiol. Sci. 2004, 3, 47–55. [Google Scholar] [CrossRef]
- Lim, S.; Franklin, S.J. Lanthanide-binding peptides and the enzymes that might have been. Cell. Mol. Life Sci. C. 2004, 61, 2184–2188. [Google Scholar] [CrossRef]
- Cotton, S. Coordination chemistry of the lanthanides. In Lanthanide and Actinide Chemistry; Wiley Online Books; John Wiley & Sons, Ltd.: Hoboken, NJ, USA, 2006; pp. 35–60. ISBN 9780470010082. [Google Scholar]
- Tarushi, A.; Lafazanis, K.; Kljun, J.; Turel, I.; Pantazaki, A.A.; Psomas, G.; Kessissoglou, D.P. First- and second-generation quinolone antibacterial drugs interacting with zinc(II): Structure and biological perspectives. J. Inorg. Biochem. 2013, 121, 53–65. [Google Scholar] [CrossRef]
- Skyrianou, K.C.; Perdih, F.; Papadopoulos, A.N.; Turel, I.; Kessissoglou, D.P.; Psomas, G. Nickel–quinolones interaction: Part 5—Biological evaluation of nickel (II) complexes with first-, second-and third-generation quinolones. J. Inorg. Biochem. 2011, 105, 1273–1285. [Google Scholar] [CrossRef]
- Zampakou, M.; Akrivou, M.; Andreadou, E.G.; Raptopoulou, C.P.; Psycharis, V.; Pantazaki, A.A.; Psomas, G. Structure, antimicrobial activity, DNA-and albumin-binding of manganese (II) complexes with the quinolone antimicrobial agents oxolinic acid and enrofloxacin. J. Inorg. Biochem. 2013, 121, 88–99. [Google Scholar] [CrossRef]
- Skyrianou, K.C.; Perdih, F.; Turel, I.; Kessissoglou, D.P.; Psomas, G. Nickel–quinolones interaction. Part 2—Interaction of nickel (II) with the antibacterial drug oxolinic acid. J. Inorg. Biochem. 2010, 104, 161–170. [Google Scholar] [CrossRef]
- Tarushi, A.; Psomas, G.; Raptopoulou, C.P.; Kessissoglou, D.P. Zinc complexes of the antibacterial drug oxolinic acid: Structure and DNA-binding properties. J. Inorg. Biochem. 2009, 103, 898–905. [Google Scholar] [CrossRef] [PubMed]
- Psomas, G.; Tarushi, A.; Efthimiadou, E.K.; Sanakis, Y.; Raptopoulou, C.P.; Katsaros, N. Synthesis, structure and biological activity of copper (II) complexes with oxolinic acid. J. Inorg. Biochem. 2006, 100, 1764–1773. [Google Scholar] [CrossRef] [PubMed]
- Mendoza-Díaz, G.; Martínez-Aguilera, L.M.R.; Moreno-Esparza, R.; Pannell, K.H.; Cervantes-Lee, F. Some mixed-ligand complexes of copper (II) with drugs of the quinolone family and (N-N) donors. Crystal structure of [Cu (phen)(Cnx)(H2O)] NO3· H2O. J. Inorg. Biochem. 1993, 50, 65–78. [Google Scholar] [CrossRef]
- Tarushi, A.; Efthimiadou, E.K.; Christofis, P.; Psomas, G. Neutral mononuclear dioxomolybdenum (VI) and dioxouranium (VI) complexes of oxolinic acid: Characterization and biological evaluation. Inorganica Chim. Acta 2007, 360, 3978–3986. [Google Scholar] [CrossRef]
- Tarushi, A.; Psomas, G.; Raptopoulou, C.P.; Psycharis, V.; Kessissoglou, D.P. Structure and DNA-binding properties of bis (quinolonato) bis (pyridine) zinc (II) complexes. Polyhedron 2009, 28, 3272–3278. [Google Scholar] [CrossRef]
- Irgi, E.P.; Geromichalos, G.D.; Balala, S.; Kljun, J.; Kalogiannis, S.; Papadopoulos, A.; Turel, I.; Psomas, G. Cobalt (II) complexes with the quinolone antimicrobial drug oxolinic acid: Structure and biological perspectives. RSC Adv. 2015, 5, 36353–36367. [Google Scholar] [CrossRef]
- Al-Saif, F.A.; Alibrahim, K.A.; Alfurhood, J.A.; Refat, M.S. Synthesis, spectroscopic, thermal, biological, morphological and molecular docking studies of the different quinolone drugs and their cobalt (II) complexes. J. Mol. Liq. 2018, 249, 438–453. [Google Scholar] [CrossRef]
- Tarushi, A.; Christofis, P.; Psomas, G. Synthesis, characterization and interaction with DNA of mononuclear metal complexes with oxolinic acid. Polyhedron 2007, 26, 3963–3972. [Google Scholar] [CrossRef]
- Kim, Y.-S.; Kim, K.M.; Song, R.; Jun, M.J.; Sohn, Y.S. Synthesis, characterization and antitumor activity of quinolone–platinum (II) conjugates. J. Inorg. Biochem. 2001, 87, 157–163. [Google Scholar] [CrossRef]
- Ahmed, I.; Atta, A.H.; Refat, M.S. Complexation of gadolinium (III) and terbium (III) with nalidixicacid (NDX): Molar conductivity, thermal and spectral investigation. Int. J. Electrochem. Sci. 2014, 9, 5187–5203. [Google Scholar]
- Na, B.; Zhang, X.; Shi, W.; Zhang, Y.; Wang, B.; Gao, C.; Gao, S.; Cheng, P. Six-coordinate lanthanide complexes: Slow relaxation of magnetization in the dysprosium (III) complex. Chem. Eur. J. 2014, 20, 15975–15980. [Google Scholar] [CrossRef] [PubMed]
- Neugebauer, U.; Szeghalmi, A.; Schmitt, M.; Kiefer, W.; Popp, J.; Holzgrabe, U. Vibrational spectroscopic characterization of fluoroquinolones. Spectrochim. Acta Part A Mol. Biomol. Spectrosc. 2005, 61, 1505–1517. [Google Scholar] [CrossRef] [PubMed]
- Munteanu, A.-C.; Badea, M.; Olar, R.; Silvestro, L.; Dulea, C.; Negut, C.-D.; Uivarosi, V. Synthesis and structural investigation of new bio-relevant complexes of lanthanides with 5-hydroxyflavone: DNA binding and protein interaction studies. Molecules 2016, 21, 1737. [Google Scholar] [CrossRef] [Green Version]
- Sastri, V.R.; Perumareddi, J.R.; Rao, V.R.; Rayudu, G.V.S.; Bünzli, J.-C. Modern Aspects of Rare Earths and Their Complexes; Elsevier: Amsterdam, The Netherlands, 2003; ISBN 0080536689. [Google Scholar]
- Sadeek, S.A.; El-Shwiniy, W.H. Metal complexes of the fourth generation quinolone antimicrobial drug gatifloxacin: Synthesis, structure and biological evaluation. J. Mol. Struct. 2010, 977, 243–253. [Google Scholar] [CrossRef]
- Sadeek, S.A.; El-Shwiniy, W.H.; Zordok, W.A.; El-Didamony, A.M. Spectroscopic, structure and antimicrobial activity of new Y(III) and Zr(IV) ciprofloxacin. Spectrochim. Acta Part A Mol. Biomol. Spectrosc. 2011, 78, 854–867. [Google Scholar] [CrossRef] [PubMed]
- Nakamoto, K. Infrared and Raman Spectra of Inorganic and Coordination Compounds, Part B: Applications in Coordination, Organometallic, and Bioinorganic Chemistry; John Wiley & Sons, Ltd.: Hoboken, NJ, USA, 2009; ISBN 047174493X. [Google Scholar]
- Uivarosi, V.; Barbuceanu, S.F.; Aldea, V.; Arama, C.-C.; Badea, M.; Olar, R.; Marinescu, D. Synthesis, spectral and thermal studies of new rutin vanadyl complexes. Molecules 2010, 15, 1578–1589. [Google Scholar] [CrossRef] [PubMed]
- Badea, M.; Olar, R.; Marinescu, D.; Uivarosi, V.; Aldea, V.; Nicolescu, T. Thermal stability of new vanadyl complexes with flavonoid derivatives as potential insulin-mimetic agents. J. Therm. Anal. Calorim. 2010, 99, 823–827. [Google Scholar] [CrossRef]
- Emelina, T.B.; Freidzon, A.Y.; Bagaturyants, A.A.; Karasev, V.E. Electronic structure and energy transfer in europium(III)–ciprofloxacin complexes: A theoretical study. J. Phys. Chem. A 2016, 120, 7529–7537. [Google Scholar] [CrossRef]
- Joshi, R.; Pandey, N.; Tilak, R.; Yadav, S.K.; Mishra, H.; Pokharia, S. New triorganotin(IV) complexes of quinolone antibacterial drug sparfloxacin: Synthesis, structural characterization, DFT studies and biological activity. Appl. Organomet. Chem. 2018, 32, e4324. [Google Scholar] [CrossRef]
- Kumar, M.; Kumar, G.; Mogha, N.K.; Jain, R.; Hussain, F.; Masram, D.T. Structure, DNA/proteins binding, docking and cytotoxicity studies of copper(II) complexes with the first quinolone drug nalidixic acid and 2,2′-dipyridylamine. Spectrochim. Acta Part A Mol. Biomol. Spectrosc. 2019, 212, 94–104. [Google Scholar] [CrossRef]
- Andrews, P.C.; Beck, T.; Fraser, B.H.; Junk, P.C.; Massi, M. Synthesis and structural characterisation of cationic, neutral and hydroxo-bridged lanthanoid (La, Gd, Ho, Yb, Y) bis 5-(2-pyridyl)tetrazolate complexes. Polyhedron 2007, 26, 5406–5413. [Google Scholar] [CrossRef]
- Clarkson, I.; Dickins, R.; de Sousa, A. Non-radiative deactivation of the excited states of europium, terbium and ytterbium complexes by proximate energy-matched OH, NH and CH oscillators: An improved luminescence method for establishing solution hydration states. J. Chem. Soc. Perkin Trans. 1999, 2, 493–504. [Google Scholar] [CrossRef]
- Tomczyk, M.D.; Walczak, K.Z. l, 8-Naphthalimide based DNA intercalators and anticancer agents. A systematic review from 2007 to 2017. Eur. J. Med. Chem. 2018, 159, 393–422. [Google Scholar] [CrossRef] [PubMed]
- Buchtik, R.; Trávníček, Z.; Vančo, J.; Herchel, R.; Dvořák, Z. Synthesis, characterization, DNA interaction and cleavage, and in vitro cytotoxicity of copper (II) mixed-ligand complexes with 2-phenyl-3-hydroxy-4 (1H)-quinolinone. Dalt. Trans. 2011, 40, 9404–9412. [Google Scholar] [CrossRef] [Green Version]
- Wu, S.-S.; Yuan, W.-B.; Wang, H.-Y.; Zhang, Q.; Liu, M.; Yu, K.-B. Synthesis, crystal structure and interaction with DNA and HSA of (N, N′-dibenzylethane-1, 2-diamine) transition metal complexes. J. Inorg. Biochem. 2008, 102, 2026–2034. [Google Scholar] [CrossRef]
- Yin, B.-T.; Yan, C.-Y.; Peng, X.-M.; Zhang, S.-L.; Rasheed, S.; Geng, R.-X.; Zhou, C.-H. Synthesis and biological evaluation of α-triazolyl chalcones as a new type of potential antimicrobial agents and their interaction with calf thymus DNA and human serum albumin. Eur. J. Med. Chem. 2014, 71, 148–159. [Google Scholar] [CrossRef]
- Du, H.; Xiang, J.; Zhang, Y.; Tang, Y. A spectroscopic and molecular modeling study of sinomenine binding to transferrin. Bioorg. Med. Chem. Lett. 2007, 17, 1701–1704. [Google Scholar] [CrossRef]
- Kratz, F.; Beyer, U.; Roth, T.; Tarasova, N.; Collery, P.; Lechenault, F.; Cazabat, A.; Schumacher, P.; Unger, C.; Falken, U. Transferrin conjugates of doxorubicin: Synthesis, characterization, cellular uptake, and in vitro efficacy. J. Pharm. Sci. 1998, 87, 338–346. [Google Scholar] [CrossRef]
- Li, H.; Qian, Z.M. Transferrin/transferrin receptor-mediated drug delivery. Med. Res. Rev. 2002, 22, 225–250. [Google Scholar] [CrossRef]
- Wagner, E.; Curiel, D.; Cotten, M. Delivery of drugs, proteins and genes into cells using transferrin as a ligand for receptor-mediated endocytosis. Adv. Drug Deliv. Rev. 1994, 14, 113–135. [Google Scholar] [CrossRef] [Green Version]
- Kawabata, H. Transferrin and transferrin receptors update. Free Radic. Biol. Med. 2019, 133, 46–54. [Google Scholar] [CrossRef] [PubMed]
- Hu, Y.-J.; Liu, Y.; Wang, J.-B.; Xiao, X.-H.; Qu, S.-S. Study of the interaction between monoammonium glycyrrhizinate and bovine serum albumin. J. Pharm. Biomed. Anal. 2004, 36, 915–919. [Google Scholar] [CrossRef] [PubMed]
- Deepa, S.; Mishra, A.K. Fluorescence spectroscopic study of serum albumin–bromadiolone interaction: Fluorimetric determination of bromadiolone. J. Pharm. Biomed. Anal. 2005, 38, 556–563. [Google Scholar] [CrossRef]
- Lakowicz, J.R. Quenching of fluorescence. In Principles of Fluorescence Spectroscopy; Lakowicz, J.R., Ed.; Springer: Boston, MA, USA, 2006; pp. 277–330. ISBN 978-0-387-31278-1. [Google Scholar]
- Weiss, J.N. The Hill equation revisited: Uses and misuses. FASEB J. 1997, 11, 835–841. [Google Scholar] [CrossRef] [PubMed]
- Zhang, G.; Wang, Y.; Zhang, H.; Tang, S.; Tao, W. Human serum albumin interaction with paraquat studied using spectroscopic methods. Pestic. Biochem. Physiol. 2007, 87, 23–29. [Google Scholar] [CrossRef]
- Frisch, M.J.; Trucks, G.W.; Schlegel, H.B.; Scuseria, G.E.; Robb, M.A.; Cheeseman, J.R.; Scalmani, G.; Barone, V.; Mennucci, B.; Petersson, G.A.; et al. (Eds.) Gaussian 09, Revision E.01; Gaussian, Inc.: Wallingford, CT, USA, 2009. [Google Scholar]
- Frisch, M.J.; Trucks, G.W.; Schlegel, H.B.; Scuseria, G.E.; Robb, M.A.; Cheeseman, J.R.; Scalmani, G.; Barone, V.; Petersson, G.A.; Nakatsuji, H.; et al. (Eds.) Gaussian 16, Revision C.01; Gaussian, Inc.: Wallingford, CT, USA, 2016. [Google Scholar]
- Macrae, C.F.; Sovago, I.; Cottrell, S.J.; Galek, P.T.A.; McCabe, P.; Pidcock, E.; Platings, M.; Shields, G.P.; Stevens, J.S.; Towler, M.; et al. Mercury 4.0: From visualization to analysis, design and prediction. J. Appl. Crystallogr. 2020, 53, 226–235. [Google Scholar] [CrossRef] [Green Version]
- Navarro, M.; Hernández, C.; Colmenares, I.; Hernández, P.; Fernández, M.; Sierraalta, A.; Marchán, E. Synthesis and characterization of [Au(dppz)2]Cl3. DNA interaction studies and biological activity against Leishmania (L) mexicana. J. Inorg. Biochem. 2007, 101, 111–116. [Google Scholar] [CrossRef]
- Lakowicz, J.R.; Weber, G. Quenching of fluorescence by oxygen. Probe for structural fluctuations in macromolecules. Biochemistry 1973, 12, 4161–4170. [Google Scholar] [CrossRef]
- Munteanu, A.-C.; Badea, M.; Olar, R.; Silvestro, L.; Mihaila, M.; Brasoveanu, L.I.; Musat, M.G.; Andries, A.; Uivarosi, V. Cytotoxicity studies, DNA interaction and protein binding of new Al (III), Ga (III) and In (III) complexes with 5-hydroxyflavone. Appl. Organomet. Chem. 2018, 32, e4579. [Google Scholar] [CrossRef] [Green Version]
- Fu, X.-B.; Lin, Z.-H.; Liu, H.-F.; Le, X.-Y. A new ternary copper (II) complex derived from 2-(2′-pyridyl) benzimidazole and glycylglycine: Synthesis, characterization, DNA binding and cleavage, antioxidation and HSA interaction. Spectrochim. Acta Part A Mol. Biomol. Spectrosc. 2014, 122, 22–33. [Google Scholar] [CrossRef]


| Oxo | Oxo−Na+ | Y oxo | La oxo | Sm oxo | Eu oxo | Gd oxo | Tb oxo | Assignments |
|---|---|---|---|---|---|---|---|---|
| - | - | 3725 vw 3399 w | 3622 w 3359 w | 3345 wb | 3389 wb | 3378 wb | 3391 wb | ν(O-H); COOH, H2O |
| 3061 w | 3280 w,b | 3056 w | 3057 w | 3059 w | 3059 w | 3060 w | 3057 w | ν(C-H) aromatic |
| 2983 w 2930 w | 2975 w 2910 w | 2974 w 2925 w | 2909 w | 2916 w | 2984 w | - | 2976 w 2921 w | ν (C-H) aliphatic |
| 1698 ms | - | - | - | - | - | - | ν(C=O) COOH | |
| - | 1634 vs | 1631 s | 1632 | 1634 | 1633 | 1633 | 1632 s | ν as (COO−) |
| 1632 ms | 1592 s | 1594 s | 1577 s | 1576 s | 1578 s | 1579 s | 1582 s | ν(C=O) pyridone |
| 1438 vs | 1498 ms 1473 s | 1497 s 1469 s | 1496 w 1469 vs | 1495 m 1465 s | 1493 s 1479 s 1465 vs | 1496 s 1466 vs | 1496 s 1468 vs | ν (-CH); δ (-CH2) |
| 1384 m | 1391 s | 1387 m | 1413 m | 1412 m | 1416 m | 1416 m | 1387 m | δ (C-H) methyl group |
| 1338 vs | 1339 s | 1341 s | 1340 s | 1340 | 1341 m | 1336 s | ν s(COO-) | |
| - | 297 | 292 | 292 | 294 | 293 | 292 | 295 | Δ = ν as (COO-)- ν s(COO-) |
| 1147 m | 1188 ms | 1192 m | 1193 | 1191 m | 1194 m | 1194 m | 1193 m | ν (C-N) |
| 1075 m 1093 m | 1091 mw | 1088 w | 1089 w | 1084 w | 1092 w | 1092 w | 1088 w | ν (O-CH2-O) |
| 772 m 754 m | 768 m 742 | 770 s 744 | 771 744 | 772 s 745 m | 773 ms 744 m | 773 ms 744 m | 770 ms 743 m | δ (COO-) |
| 645 s | 639 m | 649 m | 640 m | 646 m | 643 m | 644 m | 647 m | ring deformation |
| 606 m | 607 m | 611 m | 608 m | 610 m | 609 m | 609 m | 610 m | |
| 556 m | 547 m | 559 m | 553 m | 557 m | 556 m | 556 m | 558 m | |
| - | 513 m | - | - | - | - | - | - | |
| 499 m | 499 m | 500 m | 497 s | 500 m | - | - | - | |
| 448 w | 459 w | - | - | - | 453 m | 445 m | 459 mw | |
| 431 w | - | 428 m | 431 w | - | - | - | - | |
| 418 m | 416 m | 416 m | - | - | - | 413 ms | 412 m | |
| - | - | - | 408 s | 407 s | 410 s | - | - | |
| - | - | 401 m | 400 s | - | - | - | - | |
| - | - | 512 s | - | 513 s | 512 s | 511 s | 511 s | ν (M-O) |
| - | - | - | 485 s | 484 m | 483 s | 483 s | 499 s | |
| - | - | 468 w | 456 m | 456 m | - | - | - | |
| - | - | - | - | - | 421 s | 423 m | 422 m |
| Complex | Step | Thermal Effect | Temperature Range/°C | Δmexp/% | Δmcalc/% |
|---|---|---|---|---|---|
| Y oxo | 1 | Endothermic | 125–280 | 2.40 | 2.80 |
| 2 | Exothermic | 280–900 | 79.90 | 79.70 | |
| Residue (1/2 Y2O3) | 17.70 | 17.50 | |||
| La oxo | 1 | Endothermic | 75–150 | 2.70 | 2.60 |
| 2 | Exothermic | 150–900 | 73.50 | 73.90 | |
| Residue (1/2 La2O3) | 23.80 | 23.50 | |||
| Sm oxo | 1 | Endothermic | 75–220 | 4.60 | 5.00 |
| 2 | Exothermic | 220–950 | 71.40 | 70.90 | |
| Residue (1/2 Sm2O3) | 24.00 | 24.10 | |||
| Eu oxo | 1 | Endothermic | 125–240 | 2.60 | 2.50 |
| 2 | Exothermic | 240–875 | 72.40 | 72.60 | |
| Residue (1/2 Eu2O3) | 25.00 | 24.90 | |||
| Gd oxo | 1 | Endothermic | 110–250 | 3.80 | 3.70 |
| 2 | Exothermic | 250–880 | 70.80 | 71.20 | |
| Residue (1/2 Gd2O3) | 25.40 | 25.10 | |||
| Tb oxo | 1 | Endothermic | 60–160 | 3.60 | 3.70 |
| 2 | Exothermic | 280–980 | 70.50 | 70.50 | |
| Residue (1/4 Tb4O7) | 25.90 | 25.80 | |||
| Bond Length (Å) | Sm oxo | Charge | Sm oxo |
| Sm-O2 | 2.517 | Sm | 1.092 |
| Sm-O3 | 2.506 | O2 | −0.586 |
| Sm-O24 | 2.582 | O3 | −0.536 |
| Sm-O25 | 2.519 | O4 | −0.504 |
| Sm-O46 | 2.557 | O24 | −0.594 |
| Sm-O48 | 2.664 | O25 | −0.530 |
| Bond angle (°) | Sm oxo | O26 | −0.498 |
| O2-Sm-O3 | 69.233 | O46 | −0.480 |
| O24-Sm-O25 | 68.477 | O48 | −0.593 |
| O46-Sm-O48 | 102.286 | N5 | −0.435 |
| O46-Sm-O25 | 53.623 | N7 | −0.437 |
| O3-Sm-O48 | 134.706 | C5 | 0.116 |
| O2-Sm-O24 | 110.618 | C9 | 0.116 |
| Sm-O25-C28 | 119.094 | C12 | −0.023 |
| Sm-O3-C6 | 144.027 | Total energy (a.u.) | −2045.743 |
| Dihedral angle | Sm oxo | ||
| O46-Sm-O25-C28 | 87.515 | ||
| O48-Sm-O3-C6 | −176.277 | ||
| O48-Sm-O24-C32 | −116.492 | ||
| O46-Sm-O2-C10 | −130.417 | ||
| Sm-O25-C28-O26 | −101.279 | ||
| Sm-O3-C6-O4 | 169.368 |
| Assignments | Experimental Data | B3LYP/6-31G(d,p)/ ECP52MWB |
|---|---|---|
| ν(O-H); COOH, H2O | 3345 w, b | 3617 w 3309 s |
| ν(C-H) aromatic | 3059 w | 3134 w 3097 w |
| ν(C-H) aliphatic | 2916 w | 3060 w 3059 w 3043 w 3034 w |
| ν as(COO-) | 1634 | 1758 s 1695 s |
| ν(C=O) pyridone | 1576 s | 1608 s |
| ν(-CH); δ(-CH2) | 1495 m 1465 s | 1527 s 1510 m |
| δ(C-H) methyl group | 1412 m | 1433 w 1428 w |
| ν s(COO-) | 1340 s | 1360 s |
| ν(C-N) | 1191 m | 1224 w |
| ν (O-CH2-O) | 1084 w | 1073 w |
| δ(COO-) | 772 m 745 m | 784 w 757 w |
| ring deformation | 646 m | 637 m |
| 610 m | 614 w | |
| 557 m | 517 w | |
| 500 m | 503 w | |
| 407 s | - | |
| ν (M-O) | 513 s | 513 w |
| 484 m | 503 w | |
| 456 m | 425 w | |
| 513 s 484 m 456 m | 513 w 503 w 425 w |
| Compound | IC50 (μM) | ||
|---|---|---|---|
| LoVo (Human Colon Adenocarcinoma) | MDA-MB 231 (Human Breast Adenocarcinoma) | HUVEC (Normal, Human Umbilical Vein Endothelial Cells) | |
| oxo | >200 μM | 43.49 ± 4.94 | >200 μM |
| Y oxo | 90.41 ± 9.30 | 33.22 ± 14.92 | >200 μM |
| La oxo | 52.10 ± 5.54 | >100 μM | >200 μM |
| Sm oxo | 41.51 ± 15.28 | 40.42 ± 6.27 | >200 μM |
| Eu oxo | 106.60 ± 16.04 | 73.65 ± 19.80 | >200 μM |
| Gd oxo | 56.49 ± 3.83 | 73.79 ± 18.50 | >200 μM |
| Tb oxo | 40.59 ± 7.43 | >200 μM | >200 μM |
| Cis-Pt | 40.15 ± 13.94 | - | 28.46 ± 6.28 |
| ADR | - | 7.85 ± 0.70 | - |
| Kb (L∙mol−1) | Ksv (×104) | EB Displacement Assay | ||
|---|---|---|---|---|
| Compound | K50 (µM) | n | ||
| oxo | (0.46 ± 0.14) × 104 | (1.05 ± 0.02) × 104 | 42.07 ± 18.48 | 2.98 ± 1.14 |
| Y-oxo | (4.02 ± 1.41) × 105 | (8.38 ± 0.29) × 103 | 28.07 ± 4.44 | 1.92 ± 0.45 |
| La-oxo | (2.57 ± 0.17) × 105 | (1.27 ± 0.03) × 104 | 37.05 ± 8.86 | 3.44 ± 0.94 |
| Sm-oxo | (9.33 ± 1.46) × 104 | (1.21 ± 0.03) × 104 | 41.55 ± 19.32 | 2.44 ± 0.82 |
| Eu-oxo | (10.72 ± 2.47) × 105 | (1.26 ± 0.02) × 104 | 40.15 ± 11.82 | 2.65 ± 0.73 |
| Gd-oxo | (5.77 ± 1.07) × 105 | (1.18 ± 0.01) × 104 | 47.75 ± 25.22 | 1.66 ± 0.47 |
| Tb-oxo | (9.84 ± 3.83) × 105 | (1.18 ± 0.00) × 104 | 20.28 ± 1.15 | 2.68 ± 0.19 |
| Complex | T (K) | Ksv (M−1) | Kq (M−1∙s−1) | Ka (M−1) | n (Number of Binding Sites) | Kd (μM) | n (Hill Coefficient) |
|---|---|---|---|---|---|---|---|
| Apo-Tf | |||||||
| oxo | 298 | (17.45 ± 0.95) × 104 (fa = 0.36±0.01) | 17.45 × 10¹² | (0.73 ± 0.07) × 103 | 0.67 ± 0.00 | 8.11 ± 7.34 | 1.89 ± 1.35 |
| Y-oxo | 298 | (6.52 ± 0.56) × 104 (fa = 1.15 ± 0.07) | 6.52 × 10¹² | (4.40 ± 1.09) × 104 | 0.94 ± 0.01 | 8.34 ± 1.71 | 1.58 ± 0.23 |
| La-oxo | 298 | (14.13 ± 1.46) × 104 (fa = 0.68 ± 0.03) | 14.13 × 10¹² | (0.53 ± 0.23) × 104 | 0.77 ± 0.03 | 8.89 ± 2.11 | 1.71 ± 0.21 |
| Sm-oxo | 298 | (9.34 ± 0.66) × 104 (fa = 0.85 ± 0.05) | 9.34 × 10¹² | (4.16 ± 1.09) × 104 | 0.95 ± 0.02 | 5.73 ± 0.55 | 2.03 ± 0.32 |
| Eu-oxo | 298 | (16.55 ± 0.94) × 104 (fa = 0.81 ± 0.02) | 16.55 × 10¹² | (2.74 ± 0.41) × 104 | 0.88 ± 0.01 | 8.27 ± 4.17 | 0.95 ± 0.21 |
| Gd-oxo | 298 | (17.51 ± 1.06) × 104 (fa = 0.73 ± 0.02) | 17.51 × 10¹² | (0.58 ± 0.25) × 104 | 0.76 ± 0.03 | 8.80 ± 6.57 | 1.24 ± 0.45 |
| Tb-oxo | 298 | (19.45 ± 1.10) × 104 (fa = 0.77 ± 0.01) | 19.45 × 10¹² | (1.28 ± 0.17) × 104 | 0.81 ± 0.01 | 5.57 ± 1.22 | 1.57 ± 0.33 |
| HSA | |||||||
| oxo | 298 | (1.95 ± 0.38) × 104 (fa = 1.92 ± 0.35) | 1.95 × 10¹² | (1.08 ± 0.22) × 104 | 0.90 ± 0.01 | 7.26 ± 2.66 | 1.62 ± 0.39 |
| Y-oxo | 298 | (10.53 ± 0.95) × 104 (fa = 1.07 ± 0.05) | 10.53 × 10¹² | (2.04 ± 0.74) × 105 | 1.44 ± 0.03 | 6.30 ± 2.47 | 1.52 ± 0.47 |
| La-oxo | 298 | (6.82 ± 0.74) × 104 (fa = 1.26 ± 0.11) | 6.82 × 10¹² | (5.80 ± 2.01) × 105 | 1.14 ± 0.02 | 6.22 ± 1.05 | 1.74 ± 0.21 |
| Sm-oxo | 298 | (6.56 ± 0.90) × 104 (fa = 1.44 ± 0.15) | 6.56 × 10¹² | (4.28 ± 2.12) × 105 | 1.11 ± 0.04 | 4.69 ± 0.87 | 1.55 ± 0.37 |
| Eu-oxo | 298 | (11.25 ± 0.92) × 104 (fa = 0.94 ± 0.04) | 11.25 × 10¹² | (4.75 ± 0.80) × 105 | 1.11 ± 0.01 | 5.56 ± 0.86 | 1.33 ± 0.18 |
| Gd-oxo | 298 | (5.77 ± 0.84) × 104 (fa = 1.39 ± 0.15) | 5.77 × 10¹² | (1.98 ± 0.82) × 105 | 1.06 ± 0.03 | 5.32 ± 0.69 | 1.81 ± 0.26 |
| Tb-oxo | 298 | (2.84 ± 0.70) × 104 (fa = 2.13 ± 0.45) | 2.84 × 10¹² | (6.83 ± 1.33) × 105 | 1.18 ± 0.01 | 5.97 ± 0.89 | 1.58 ± 0.20 |
Sample Availability: Samples of all compounds synthesized in this study are available from the authors. | |
Publisher’s Note: MDPI stays neutral with regard to jurisdictional claims in published maps and institutional affiliations. |
© 2020 by the authors. Licensee MDPI, Basel, Switzerland. This article is an open access article distributed under the terms and conditions of the Creative Commons Attribution (CC BY) license (http://creativecommons.org/licenses/by/4.0/).
Share and Cite
Maciuca, A.-M.; Munteanu, A.-C.; Mihaila, M.; Badea, M.; Olar, R.; Nitulescu, G.M.; Munteanu, C.V.A.; Bostan, M.; Uivarosi, V. Rare-Earth Metal Complexes of the Antibacterial Drug Oxolinic Acid: Synthesis, Characterization, DNA/Protein Binding and Cytotoxicity Studies. Molecules 2020, 25, 5418. https://doi.org/10.3390/molecules25225418
Maciuca A-M, Munteanu A-C, Mihaila M, Badea M, Olar R, Nitulescu GM, Munteanu CVA, Bostan M, Uivarosi V. Rare-Earth Metal Complexes of the Antibacterial Drug Oxolinic Acid: Synthesis, Characterization, DNA/Protein Binding and Cytotoxicity Studies. Molecules. 2020; 25(22):5418. https://doi.org/10.3390/molecules25225418
Chicago/Turabian StyleMaciuca, Ana-Madalina, Alexandra-Cristina Munteanu, Mirela Mihaila, Mihaela Badea, Rodica Olar, George Mihai Nitulescu, Cristian V. A. Munteanu, Marinela Bostan, and Valentina Uivarosi. 2020. "Rare-Earth Metal Complexes of the Antibacterial Drug Oxolinic Acid: Synthesis, Characterization, DNA/Protein Binding and Cytotoxicity Studies" Molecules 25, no. 22: 5418. https://doi.org/10.3390/molecules25225418