This section provides an overview of the by-products utilized as raw materials for geopolymer synthesis, sourced from various industries, including mining, brick manufacturing, olive biomass production, and steel manufacturing. It also outlines the experimental methodology used to evaluate the feasibility of slate stone cutting sludge (SSCS) (Pizarras Matacouta, S.A, Leon, Spain), chamotte (CH) (Baiceram, Bailen (Jaen), Spain), and olive biomass bottom ash (OSBA) (Bioelectrica de Linares, Valoriza Group, Linares (Jaen), Spain), as novel geopolymer precursors. The experimental phase aims to assess the potential of combining raw materials from different origins: (i) slate stone cutting sludge and chamotte served as aluminosilicate precursors; (ii) olive biomass bottom ash, along with sodium silicate, acted as the alkali activation solution; and (iii) steel slag (Siderúrgica Sevillana, Seville, Spain), was used as a recycled aggregate. The control geopolymer was prepared using an alkali activation solution consisting of sodium hydroxide and sodium silicate.
2.4. Chemical and Physical Characterization of SSCS, CH, OSBA, and SGS
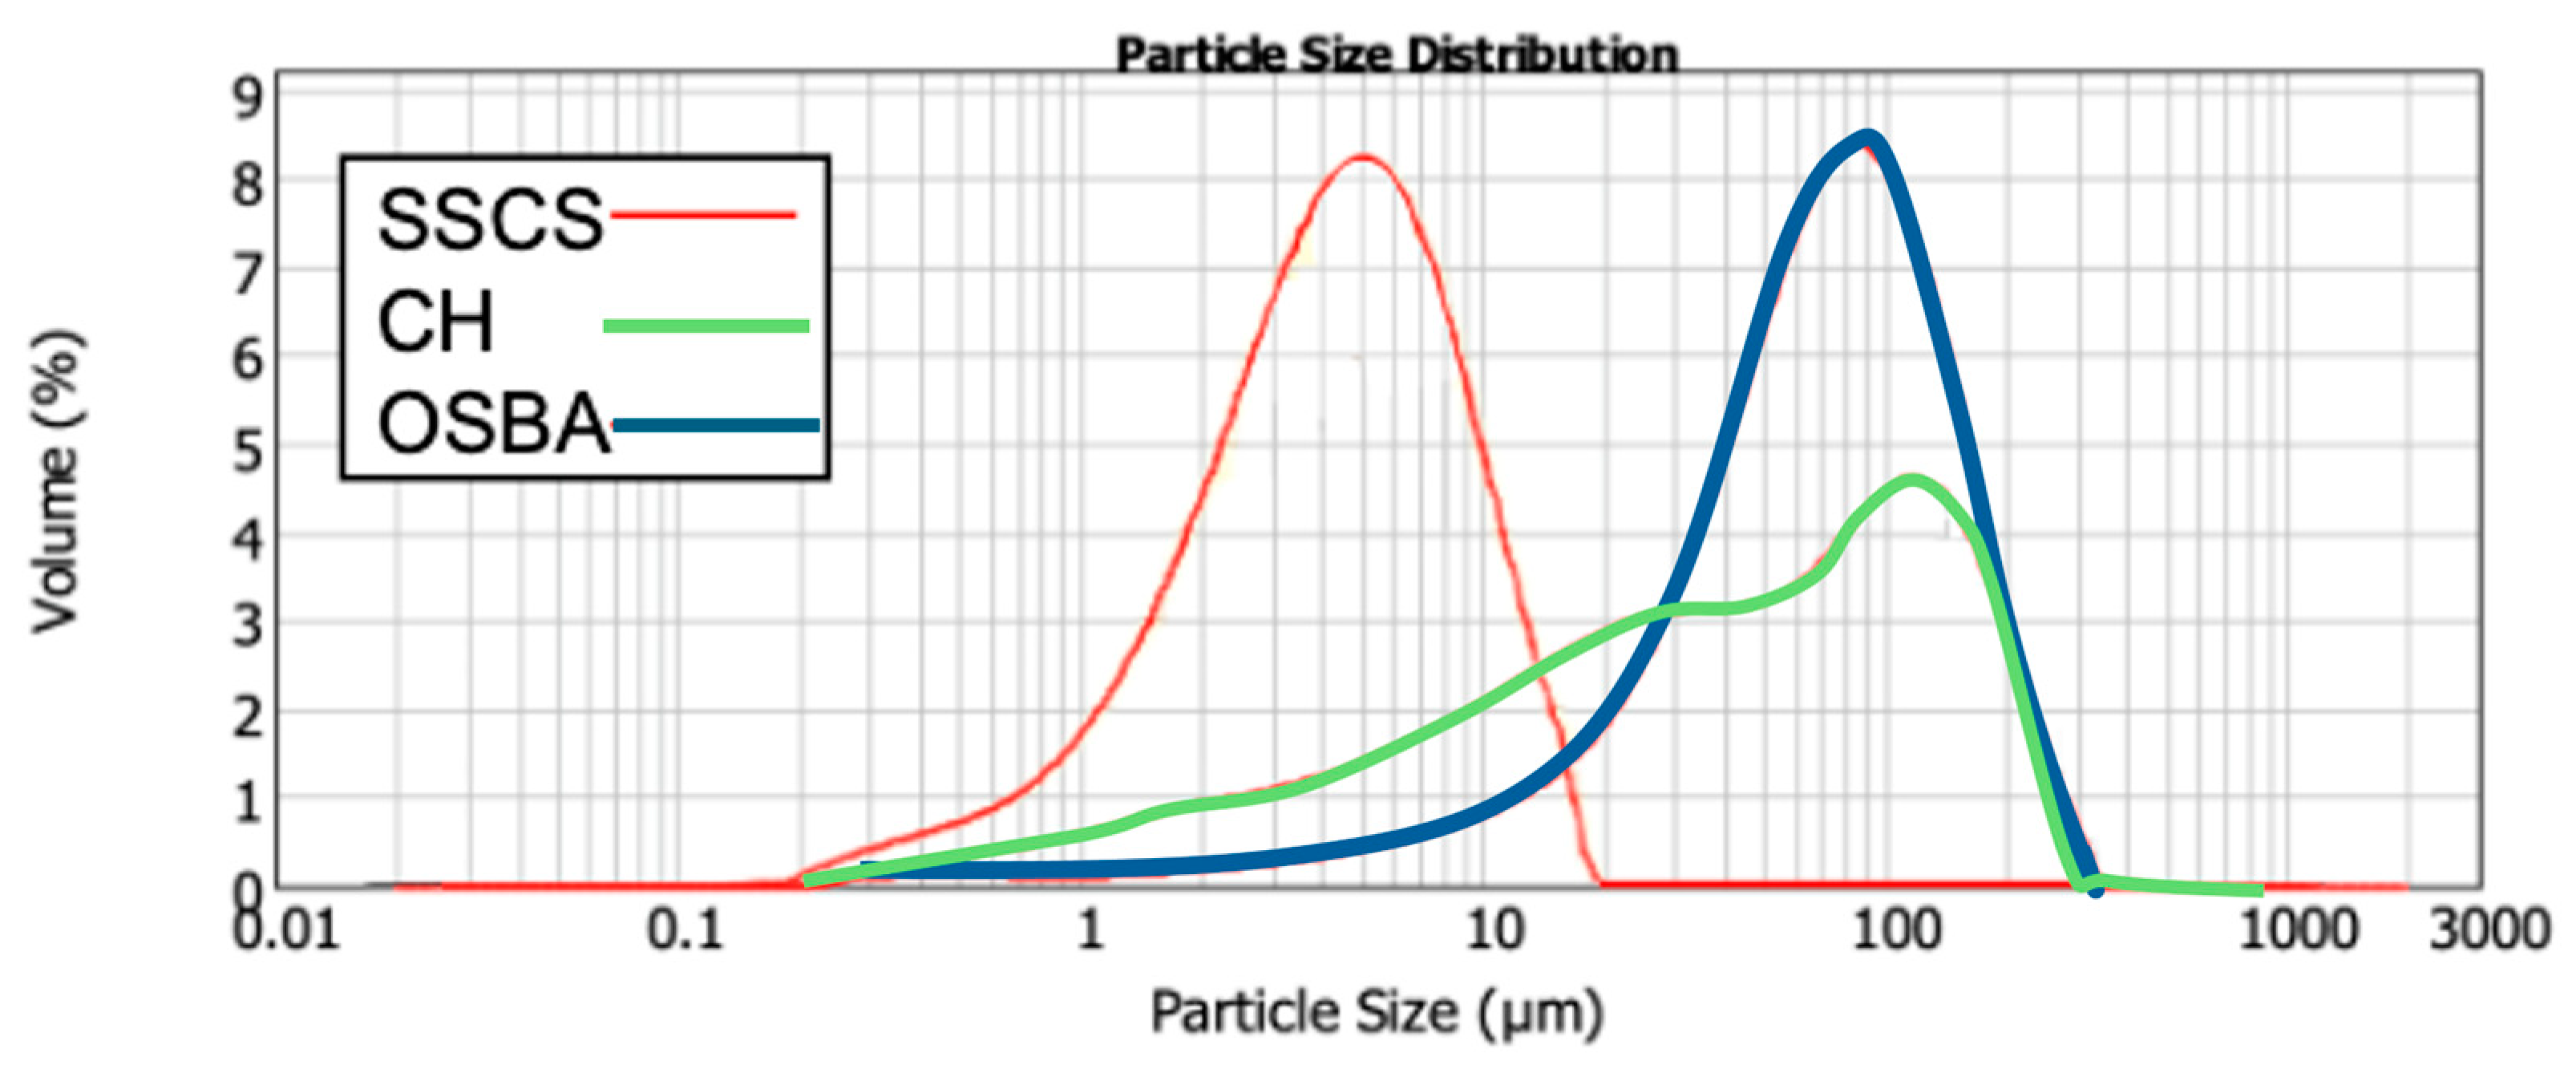
The physical characterization phase began with an analysis of the particle sizes of SSCS, CH, OSBA, and SGS to evaluate whether they were appropriate for ensuring the effective activation of the precursor materials during the geopolymerization process. A laser particle size distribution test was conducted in accordance with the UNE-EN 933-1:2012 standard [
54] using a Malvern Mastersizer Bruker D8 Venture instrument (Malvern Instruments Ltd., Malvern, UK).
Figure 1 presents the particle size distribution for SSCS, CH, and OSBA, with all particles being smaller than 300 µm. The small particle size of SSCS improves its reactivity in the geopolymerization process due to its large specific surface area (1.88 m
2/g) [
55]. In contrast, CH and OSBA exhibited lower surface areas of 0.794 m
2/g and 0.321 m
2/g, respectively.
Table 1 shows the particle size distribution at D10, D50, and D90. It is evident that all three raw materials, being fine powders, possess suitable grain sizes that facilitate easy material mixing, which in turn supports the geopolymerization process.
Figure 2 displays the graphical distribution of SGS particle size.
The chemical characterization phase began with an analysis of the mineralogical and chemical compositions of the mining, ceramic, and biomass waste materials from power generation. Carbon, hydrogen, nitrogen, and sulfur percentages were determined using a CHNS analyzer (Leco TruSpec Micro Model, St. Joseph, MI, USA). The first step in the chemical characterization involved measuring the nitrogen, carbon, and hydrogen content of the various raw material samples. The results of the elemental analysis for the waste materials used are presented in
Table 2.
The results from the elemental analysis tests for slate stone cutting sludge, chamotte, and steel granulated slag, presented in
Table 2, show relatively low carbon percentages, all below 1.003%. However, the olive stone bottom ash (OSBA) sample exhibited a notable carbon percentage of 6.145%. This higher carbon content may be attributed to the calcination process that the OSBA samples underwent during the experiment. During calcination at 950 °C, potassium carbonate (K
2CO
3) decomposes into potassium oxide (K
2O) and carbon dioxide (CO
2). The fact that the four raw material samples contained negligible carbon percentages and that all samples had a sulfur content of zero suggests that there was no negative impact on the geopolymerization reaction that could potentially affect the properties of the geopolymer concrete. X-ray fluorescence (XRF), determined using a Bruker M4 Tornado spectrometer (Bruker, Billerica, MA, USA), was employed to determine the chemical composition of SSCS, OSBA, CH, and SGS. The obtained values, expressed as weight percentages (wt.%), are presented in
Table 3.
The slate stone contains significant amounts of silica (SiO
2) and alumina (Al
2O
3), which promote an effective geopolymerization reaction in the presence of an alkaline activator solution. This observation is supported by the SSCS sample, which is primarily composed of silica (52.85 wt.%) and alumina (21.35 wt.%), yielding a SiO
2/Al
2O
3 ratio of 2.47. This indicates that alkali gel formation will occur [
56], contributing to the mechanical properties of the target geopolymer [
57]. Other oxides, such as iron oxide (10.74 wt.%) and magnesium oxide (2.82 wt.%), were also found to play important roles in the development of suitable mechanical characteristics for the geopolymer. The calculated loss on ignition (LOI) was 5.02 wt.%.
Regarding the ceramic waste, the chamotte was predominantly composed of SiO
2 (59.72 wt.%), Al
2O
3 (16.20 wt.%), and CaO (7.41 wt.%), indicating a chemical composition typical of pozzolanic activity. Its LOI was 3.45 wt.%. The OSBA was characterized by notable amounts of potassium oxide (K
2O) (28.23 wt.%) and calcium oxide (CaO) (24.67 wt.), making it a suitable candidate for the alkaline activator in combination with commercial activators such as sodium hydroxide (NaOH), potassium hydroxide (KOH), and sodium silicate (Na
2SiO
4) [
58]. As previously studied [
23,
59], CH enhances the reactivity of olive stone biomass ash, which is less reactive than fly ash [
60].
Finally, the SGS composition includes several oxides, including SiO2 (22.54 wt.%), Al2O3 (10.81 wt.%), CaO (27.13 wt.%), and Fe2O3 (23.71 wt.%).
Comparing the elemental analysis with the chemical composition of the raw materials, it is evident that the LOI is significantly higher than the elemental carbon content. This suggests that the mass loss is not primarily due to the oxidation of organic carbon but rather to other processes, such as the decomposition of carbonates.
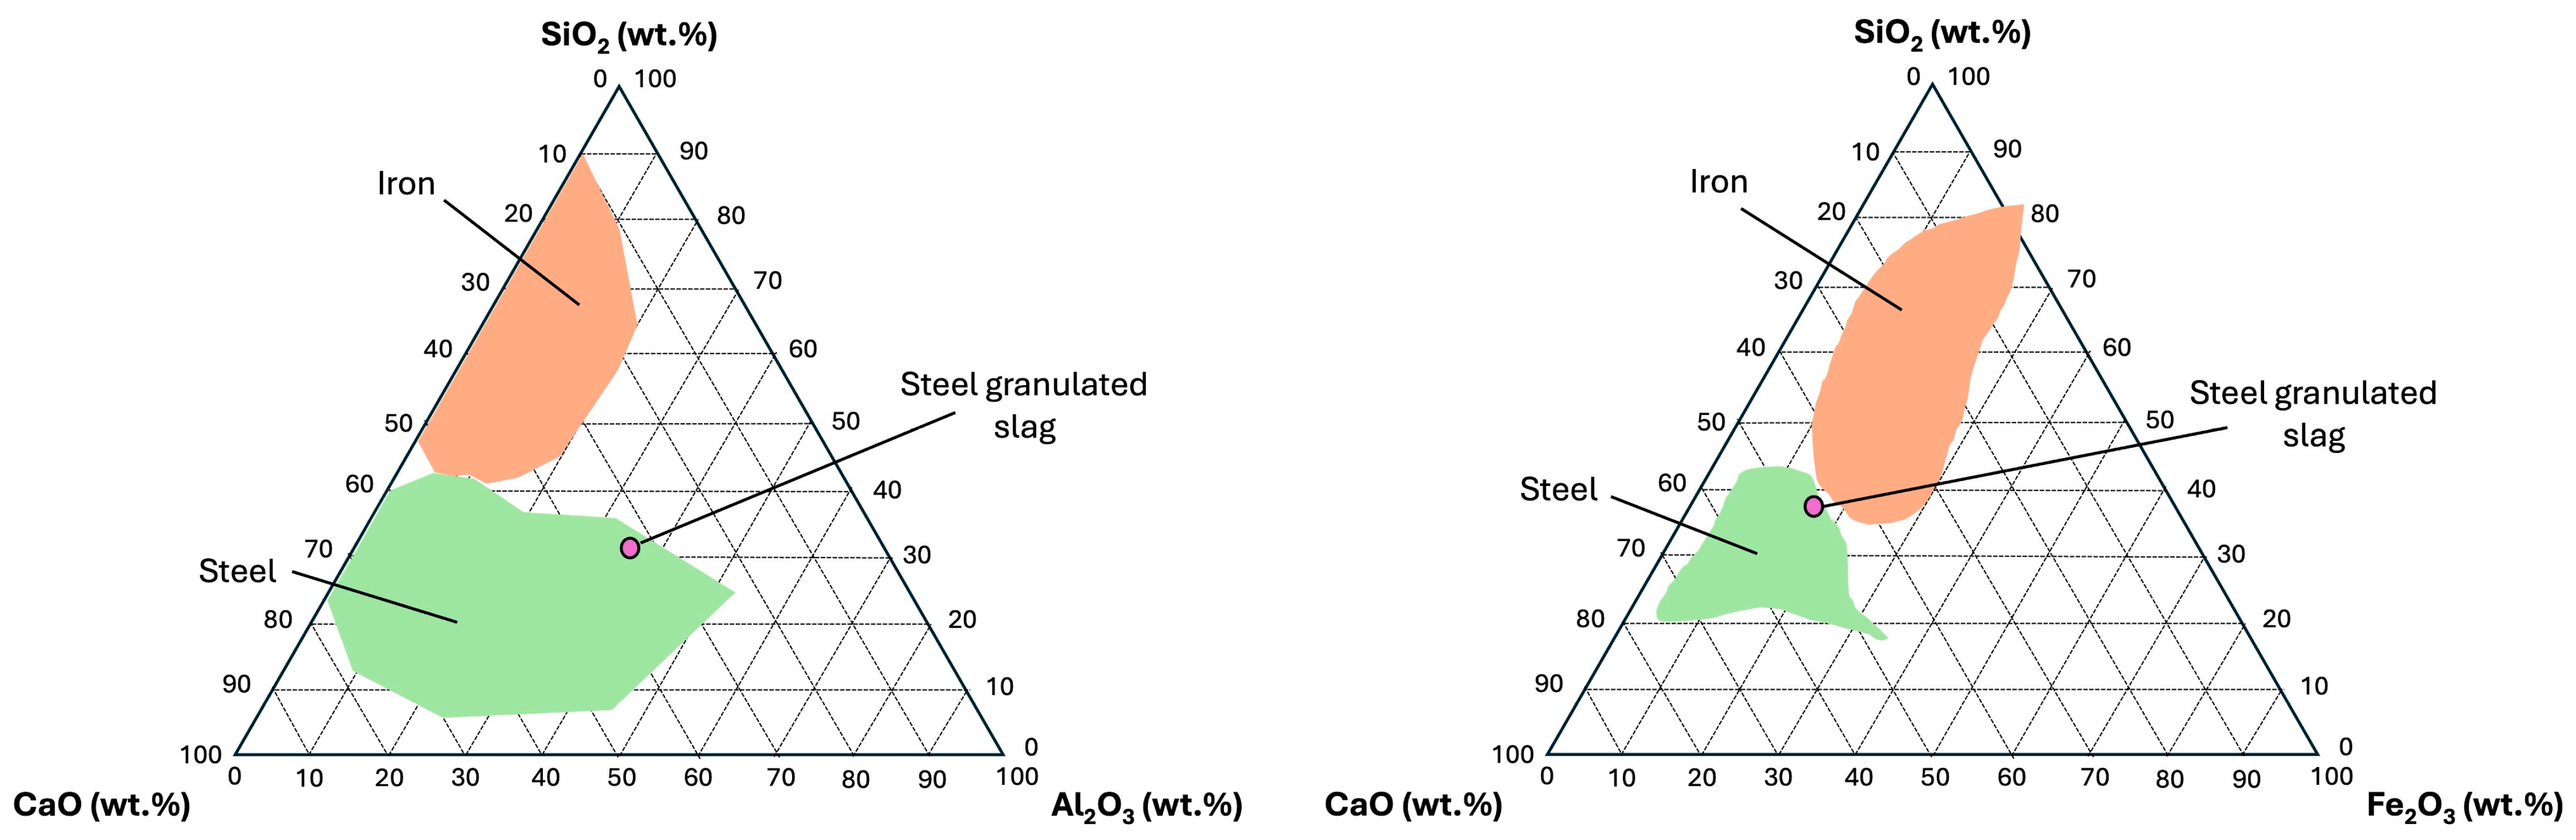
From the data obtained, the major components of SGS were selected for use in the phase equilibrium diagram. The main four oxides were SiO
2, CaO, Al
2O
3, and Fe
2O
3. The components, in two groups of three oxides, were readjusted to 100% to be represented in a ternary diagram. Since the four oxides cannot be represented in the same diagram, it was decided to split the oxides in two groups of three oxides and then use the available diagrams for SiO
2–CaO–Al
2O
3 and SiO
2–CaO–Fe
2O
3. For each group of oxides, conversion data at 100% of the main oxides are shown for SiO
2–CaO–Al
2O
3 (
Table 4) and SiO
2–CaO–Fe
2O
3 (
Table 5).
The
Figure 3 shows both ternary diagrams representing SiO
2–CaO–Al
2O
3 and SiO
2–CaO–Fe
2O
3 to determine the origin of slabs based on majority of compounds (
Table 3). In both ternary diagram scenarios and following the slag classification [
26,
61,
62,
63], SGS samples were more closely aligned with typical values for steel slag.
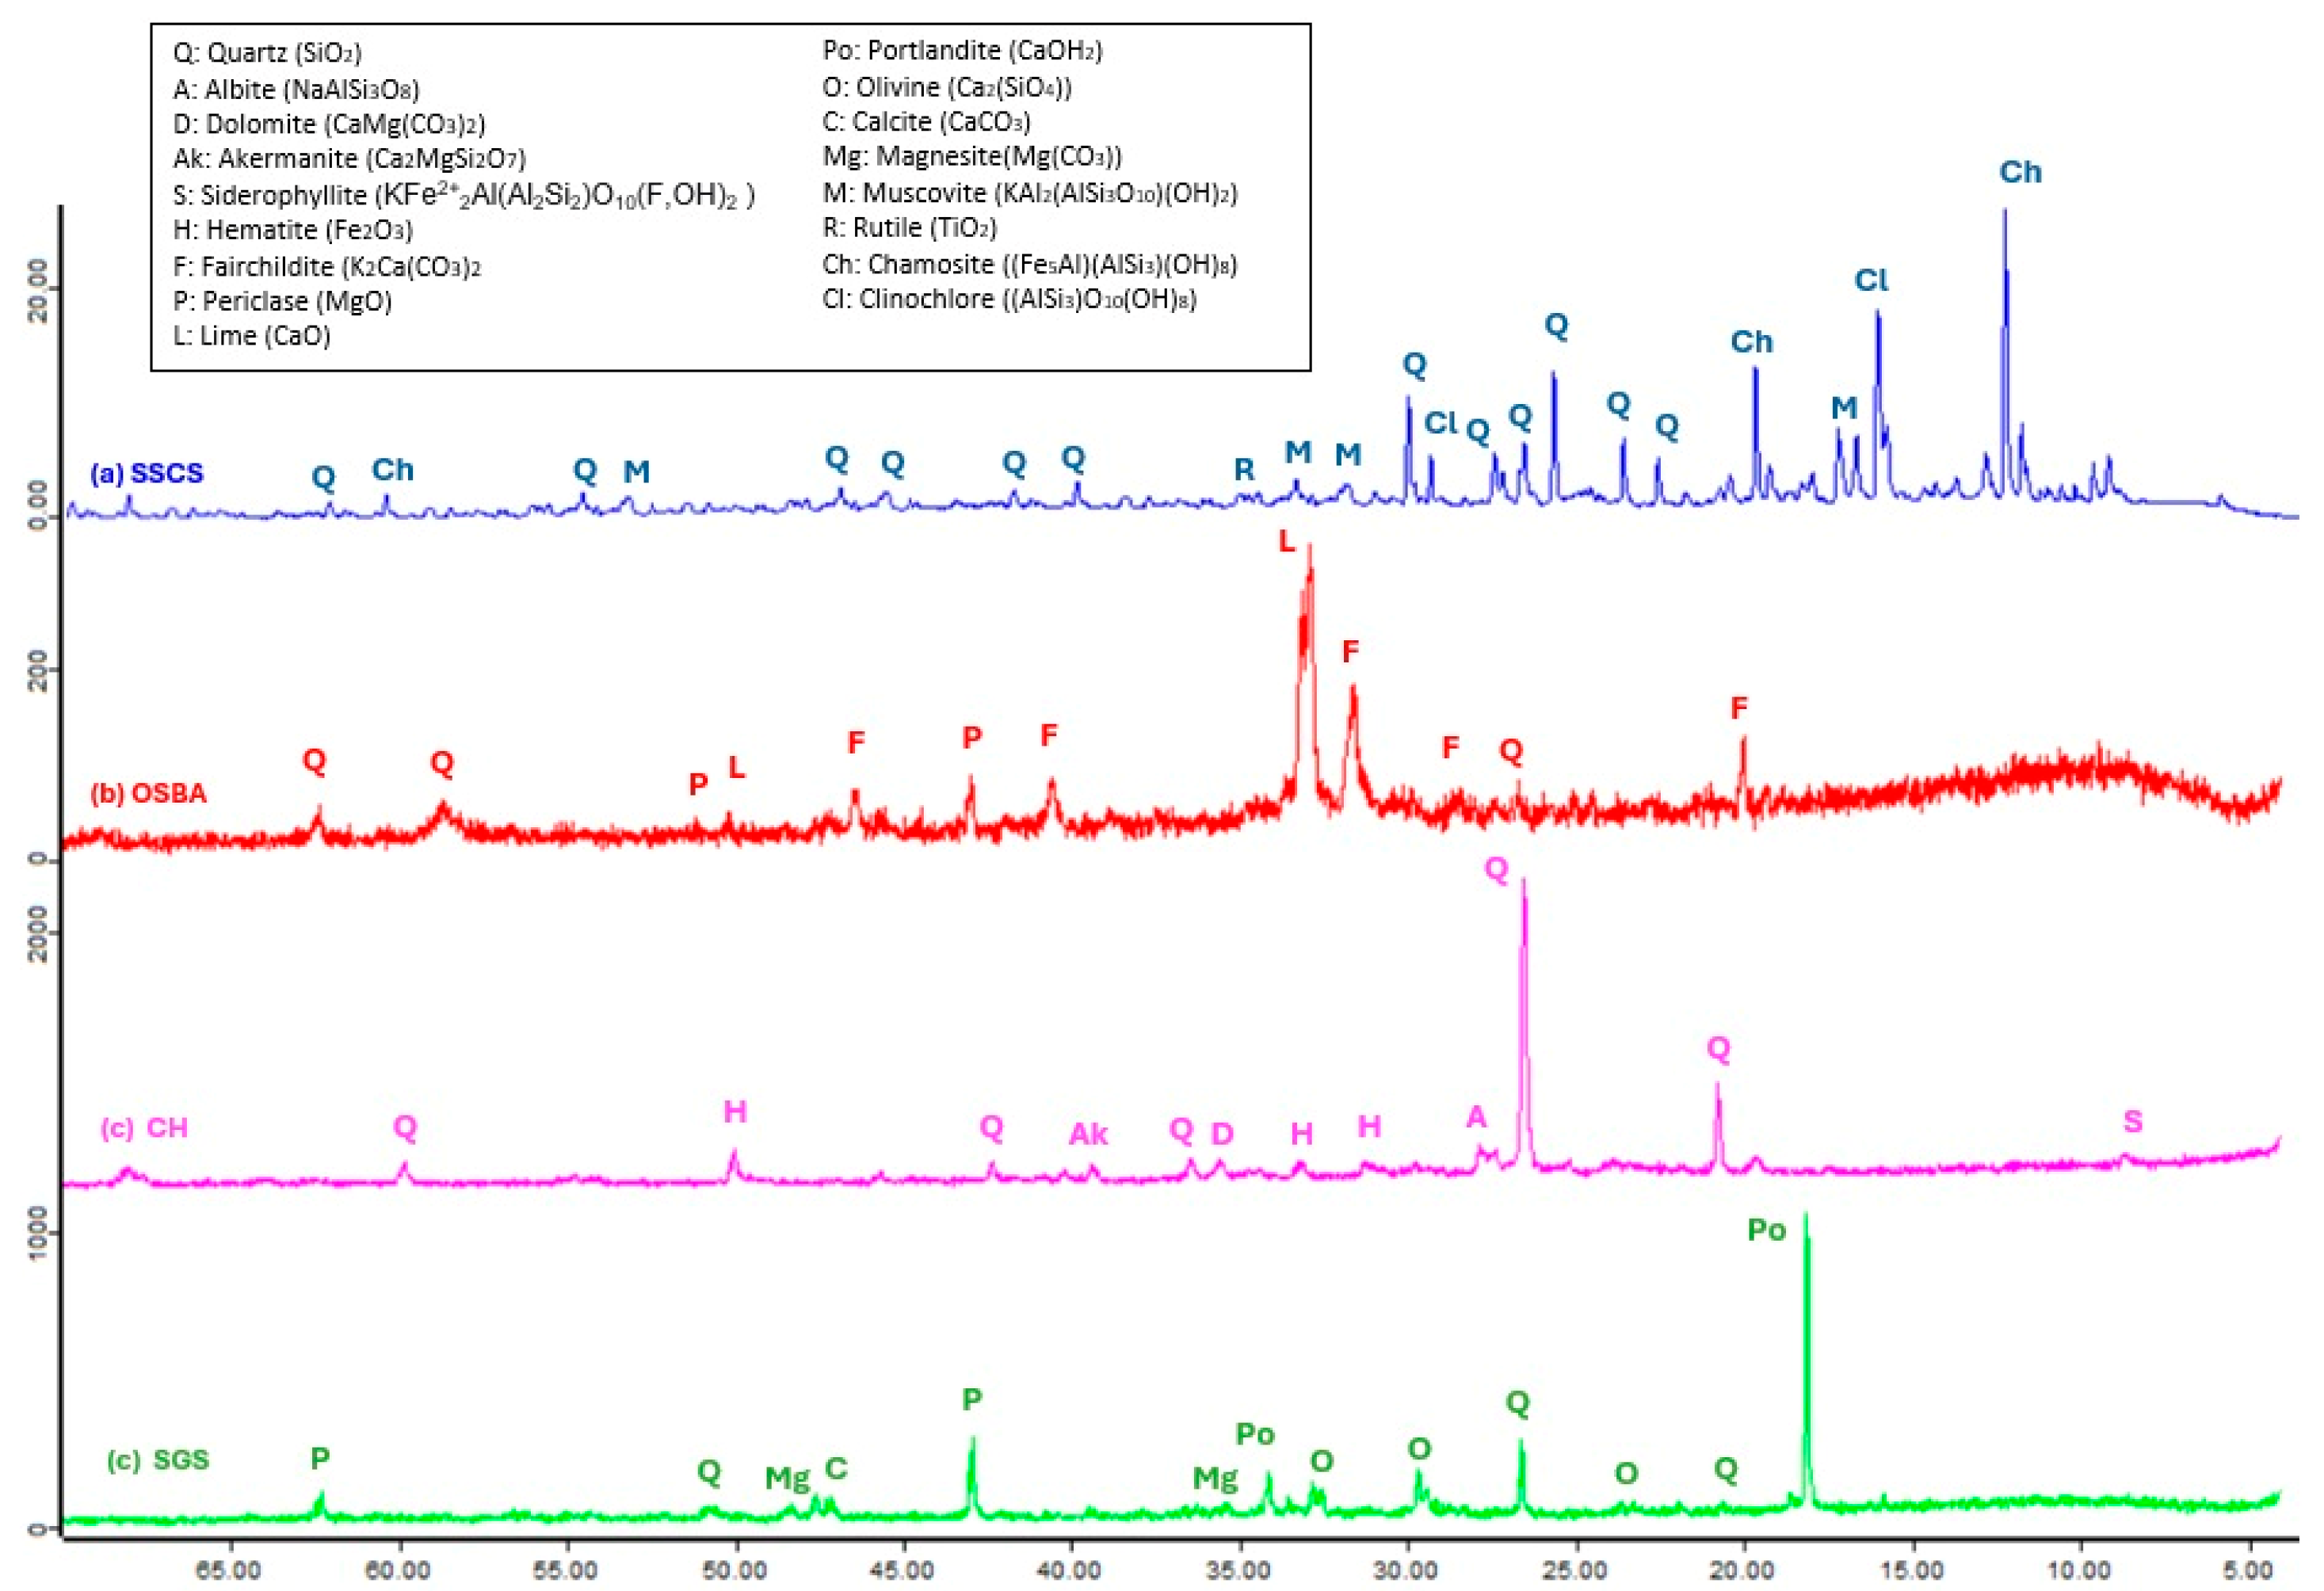
The chemical composition of the slate stone mining waste, SSCS, as determined by X-ray fluorescence, mainly contained silicon oxide (SiO
2) and aluminum oxide (Al
2O
3). These oxides appeared in form of quartz (Q) (SiO
2) and muscovite (M) (KAl
2(AlSi
3O
10) (OH)
2), which suggests that SSCS is a suitable source of aluminosilicates for the geopolymerization process. The presence of Fe
2O
3, MgO as clinochlore (Cl) ((AlSi
3)O
10(OH)
8), and chamosite (Ch) ((Fe
5Al)(AlSi
3)(OH)
8 was also observed in the XRF pattern. TiO
2 was represented as rutile (R), indicative of the metamorphic nature of the mining waste. The diffraction pattern of the ceramic waste, CH, presented a certain similarity to SSCS since it showed a crystalline phase, where silicon oxide (SiO
2) and aluminum oxide (Al
2O
3) also appeared in the form of quartz (Q) (SiO
2). Since the CH was subjected to a thermal process, Fe
2O
3 was represented as hematite (H) and CaO as dolomite (D) (CaMg(CO
3)
2) and akermanite (Ak) (Ca
2MgSiO
7). However, the mineralogical phases of the OSBA showed primary compounds of calcium oxide (CaO) and potassium oxide (K
2O) in the form of fairchildite (F) (K
2Ca(CO
3)
2) and siltstone (L) (CaO). The high-temperature combustion process of olive biomass creates compounds rich in carbonate such as fairchildite (F) (K
2Ca(CO
3)
2). Other characteristic compounds of ash were also detected in the XRF pattern, such as siltstone (L) (CaO), traces of quartz (Q) (SiO
2,) and periclase (P) (MgO). In the XRF pattern of the SGS, it can be seen that it is mainly composed of calcium hydroxide as portlandite (P
0) (Ca(OH)
2), this being a characteristic of slag related to its hydration process. This process has lower kinetics than in clinker because its dissolution is more complex due to its vitreous nature and the need for an alkaline activation source (presence of alkalis or portlandite). Other oxides such as silicon oxide, as quartz (Q)(SiO
2), and periclase (P) (MgO) were found. Another characteristic of slag is the presence of magnesite and olivine because of they are derived from the flux via dolomite.
Figure 4 shows the X-ray patterns of SSCS, OSBA, CH, and SGS. It was observed, through the identification of the crystalline phases, that the raw materials used as precursor sources and for the alkaline solution were suitable for geopolymerization, as well as exhibiting compatibility with the SGS.
The particle densities of the raw material samples were measured using the pycnometer method, as specified by the UNE-EN 1097-7:2009 standard [
65]. The particle density test for the raw materials used as precursors (SSCS and CH), alkali activator solution (OSBA and Na
2SiO
3), and aggregates (SGS) was also carried out using the pycnometer, following the UNE-EN 1097-7:2009 standard. The calculated densities of the SSCS, OSBA, CH, and Na
2SiO
3 samples (2.45, 2.76, 2.53, and 2.40 g/cm
3, respectively) were around 2.5 g/cm
3. The density of the SGS (2.91 g/cm
3) was slightly higher than that of the other raw materials used for the formation of the geopolymer concrete. With the calculated density values showing certain homogeneity, it can be concluded that no workability issues are foreseen during the material mixing process. For the control geopolymer, the commercial activator sodium hydroxide (NaOH) had a density of 1.39 g/cm
3.
The pH value of each different raw material that forms the geopolymer is a key parameter for ensuring the kinetic chemical reaction process during the alkali activation of aluminosilicate sources. Therefore, the mechanical characteristics of the final geopolymer are related to the proper geopolymerization process under the correct pH alkalinity environment. Since the goal of this experimental program was to combine raw materials—(i) SSCS and CH as sources of aluminosilicates, (ii) OSBA and Na
2SiO
3 as the alkali activation solution, and (iii) SGS as a recycled aggregate—the geopolymer formulation must achieve a pH value that creates the right alkaline conditions for the geopolymerization process [
57].
Table 6 shows the pH values of the different raw materials used in this study.
Attenuated total reflection Fourier transform infrared spectroscopy (ATR-FTIR) Jasco Analytica model 6800 FV (Jasco International Co., Ltd., Heckmondwike, UK) analysis was employed to identify the functional groups of SSCS, CH, OSBA, and SGS, as depicted in
Figure 5.
The FTIR spectrum of the SSCS shows that bands associated with the stretching vibrations of the O-H group [
33], which denote the presence of absorbed water, are located at 3381 and 3626 cm
−1, while for the OSBA, these appear at 3004 cm
−1. The SGS FTIR pattern shows that the stretching vibration of O-H appears at 3097 cm
−1. The stretching vibration of the C-O group, associated with the carbonate content [
19,
66,
67], was observed as peaks at 1419 cm
−1 for OSBA and 1413 for SGS. Neither SSCS nor CH showed peaks related to the C-O group stretching vibration.
The bands corresponding to the stretching vibrations of Si-O-T bonds, characteristic of silica-rich materials (SiO
2), were observed in the wavenumber range of 973 to 970 cm
−1 for both SSCS and CH, reflecting their high silica content, as previously noted in
Table 3. The bands observed around 800 cm
−1 for OSBA, SSCS, and SGS (at 880, 827, and 874 cm
−1, respectively) are linked to carbonate partitioning resulting from environmental exposure. The bands observed at 745, 772, and 749 cm
−1 correspond to symmetrical Si-O-Si stretching vibrations in OSBA, CH, and SSCS, respectively.
The bands observed between 679 and 513 cm
−1 are associated with bending vibrations resulting from the presence of quartz [
66,
67] in the SSCS, OSBA, and CH samples. The presence of quartz in the different raw materials was corroborated in the mineralogical composition analysis.
Finally, bands at lower wavenumbers, ranging from 527 to 420 cm
−1, were attributed to the bending vibration of Si-O [
66].
Table 7 shows the characteristic FTIR peaks for OSBA, CH, SSCS, and SGS.
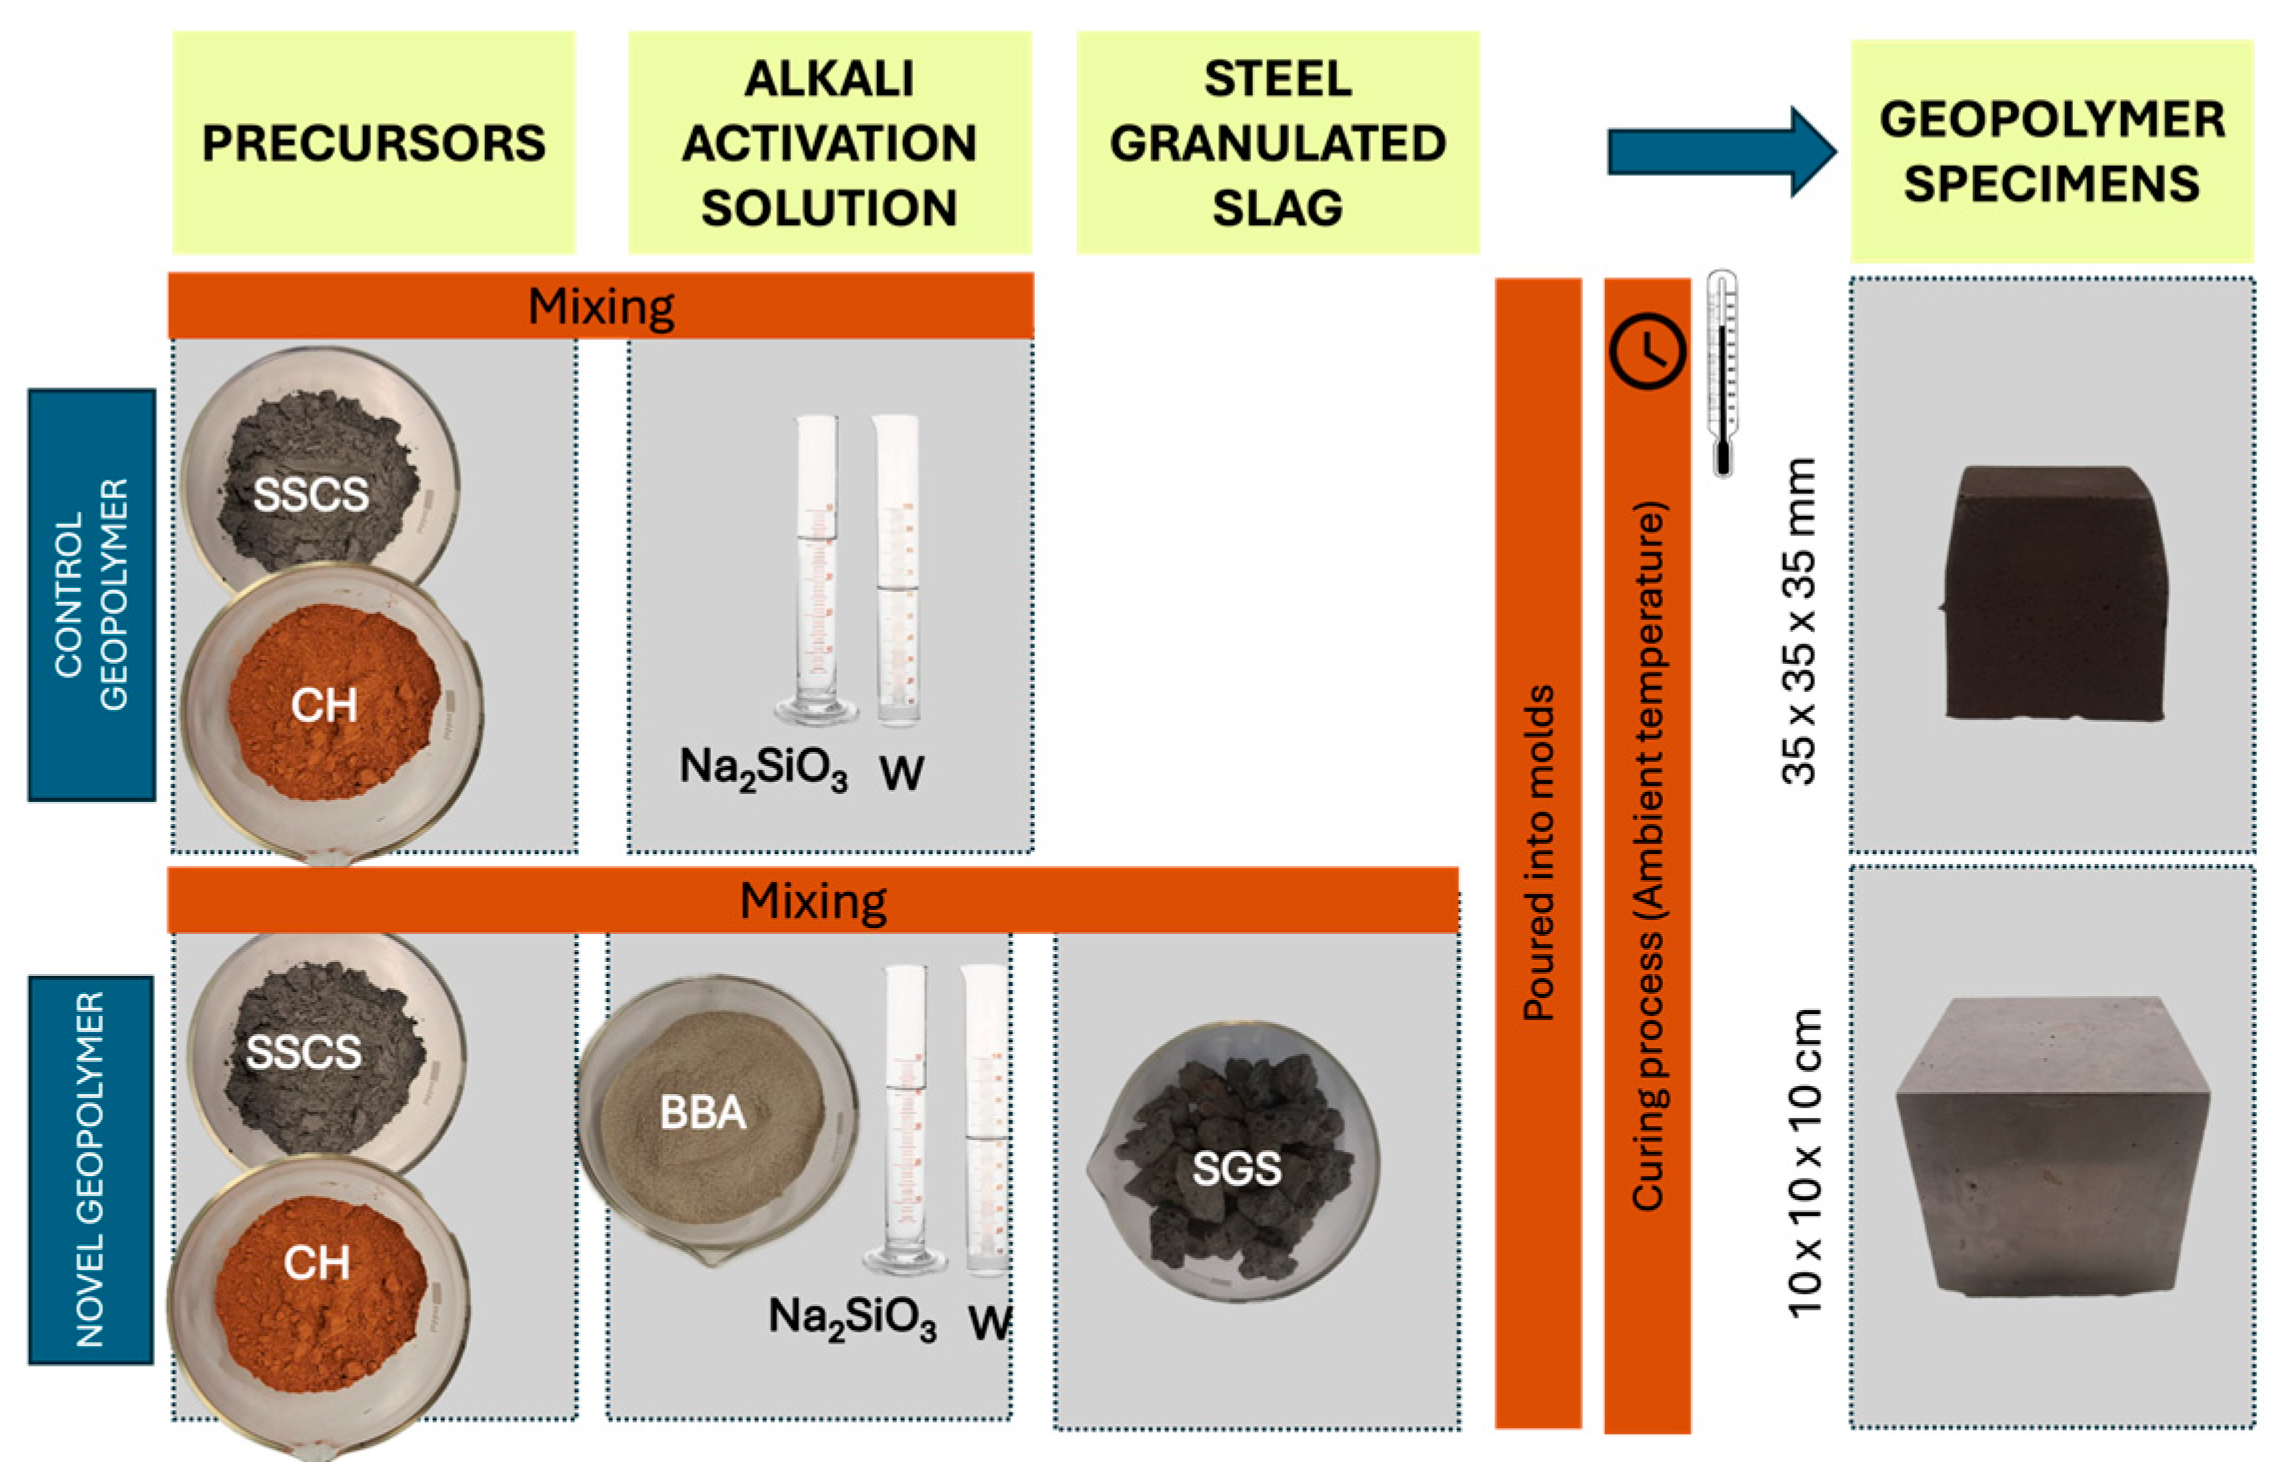
2.5. Preparation Methodology for Control Geopolymer and Novel Geopolymer Concrete
The purpose of the applied experimental methodology was to analyze the feasibility of a novel geopolymer formed with slate stone cutting sludge and chamotte; activated by an alkali solution elaborated with olive biomass bottom ash, sodium silicate, and distilled water; and using steel slag as an aggregate.
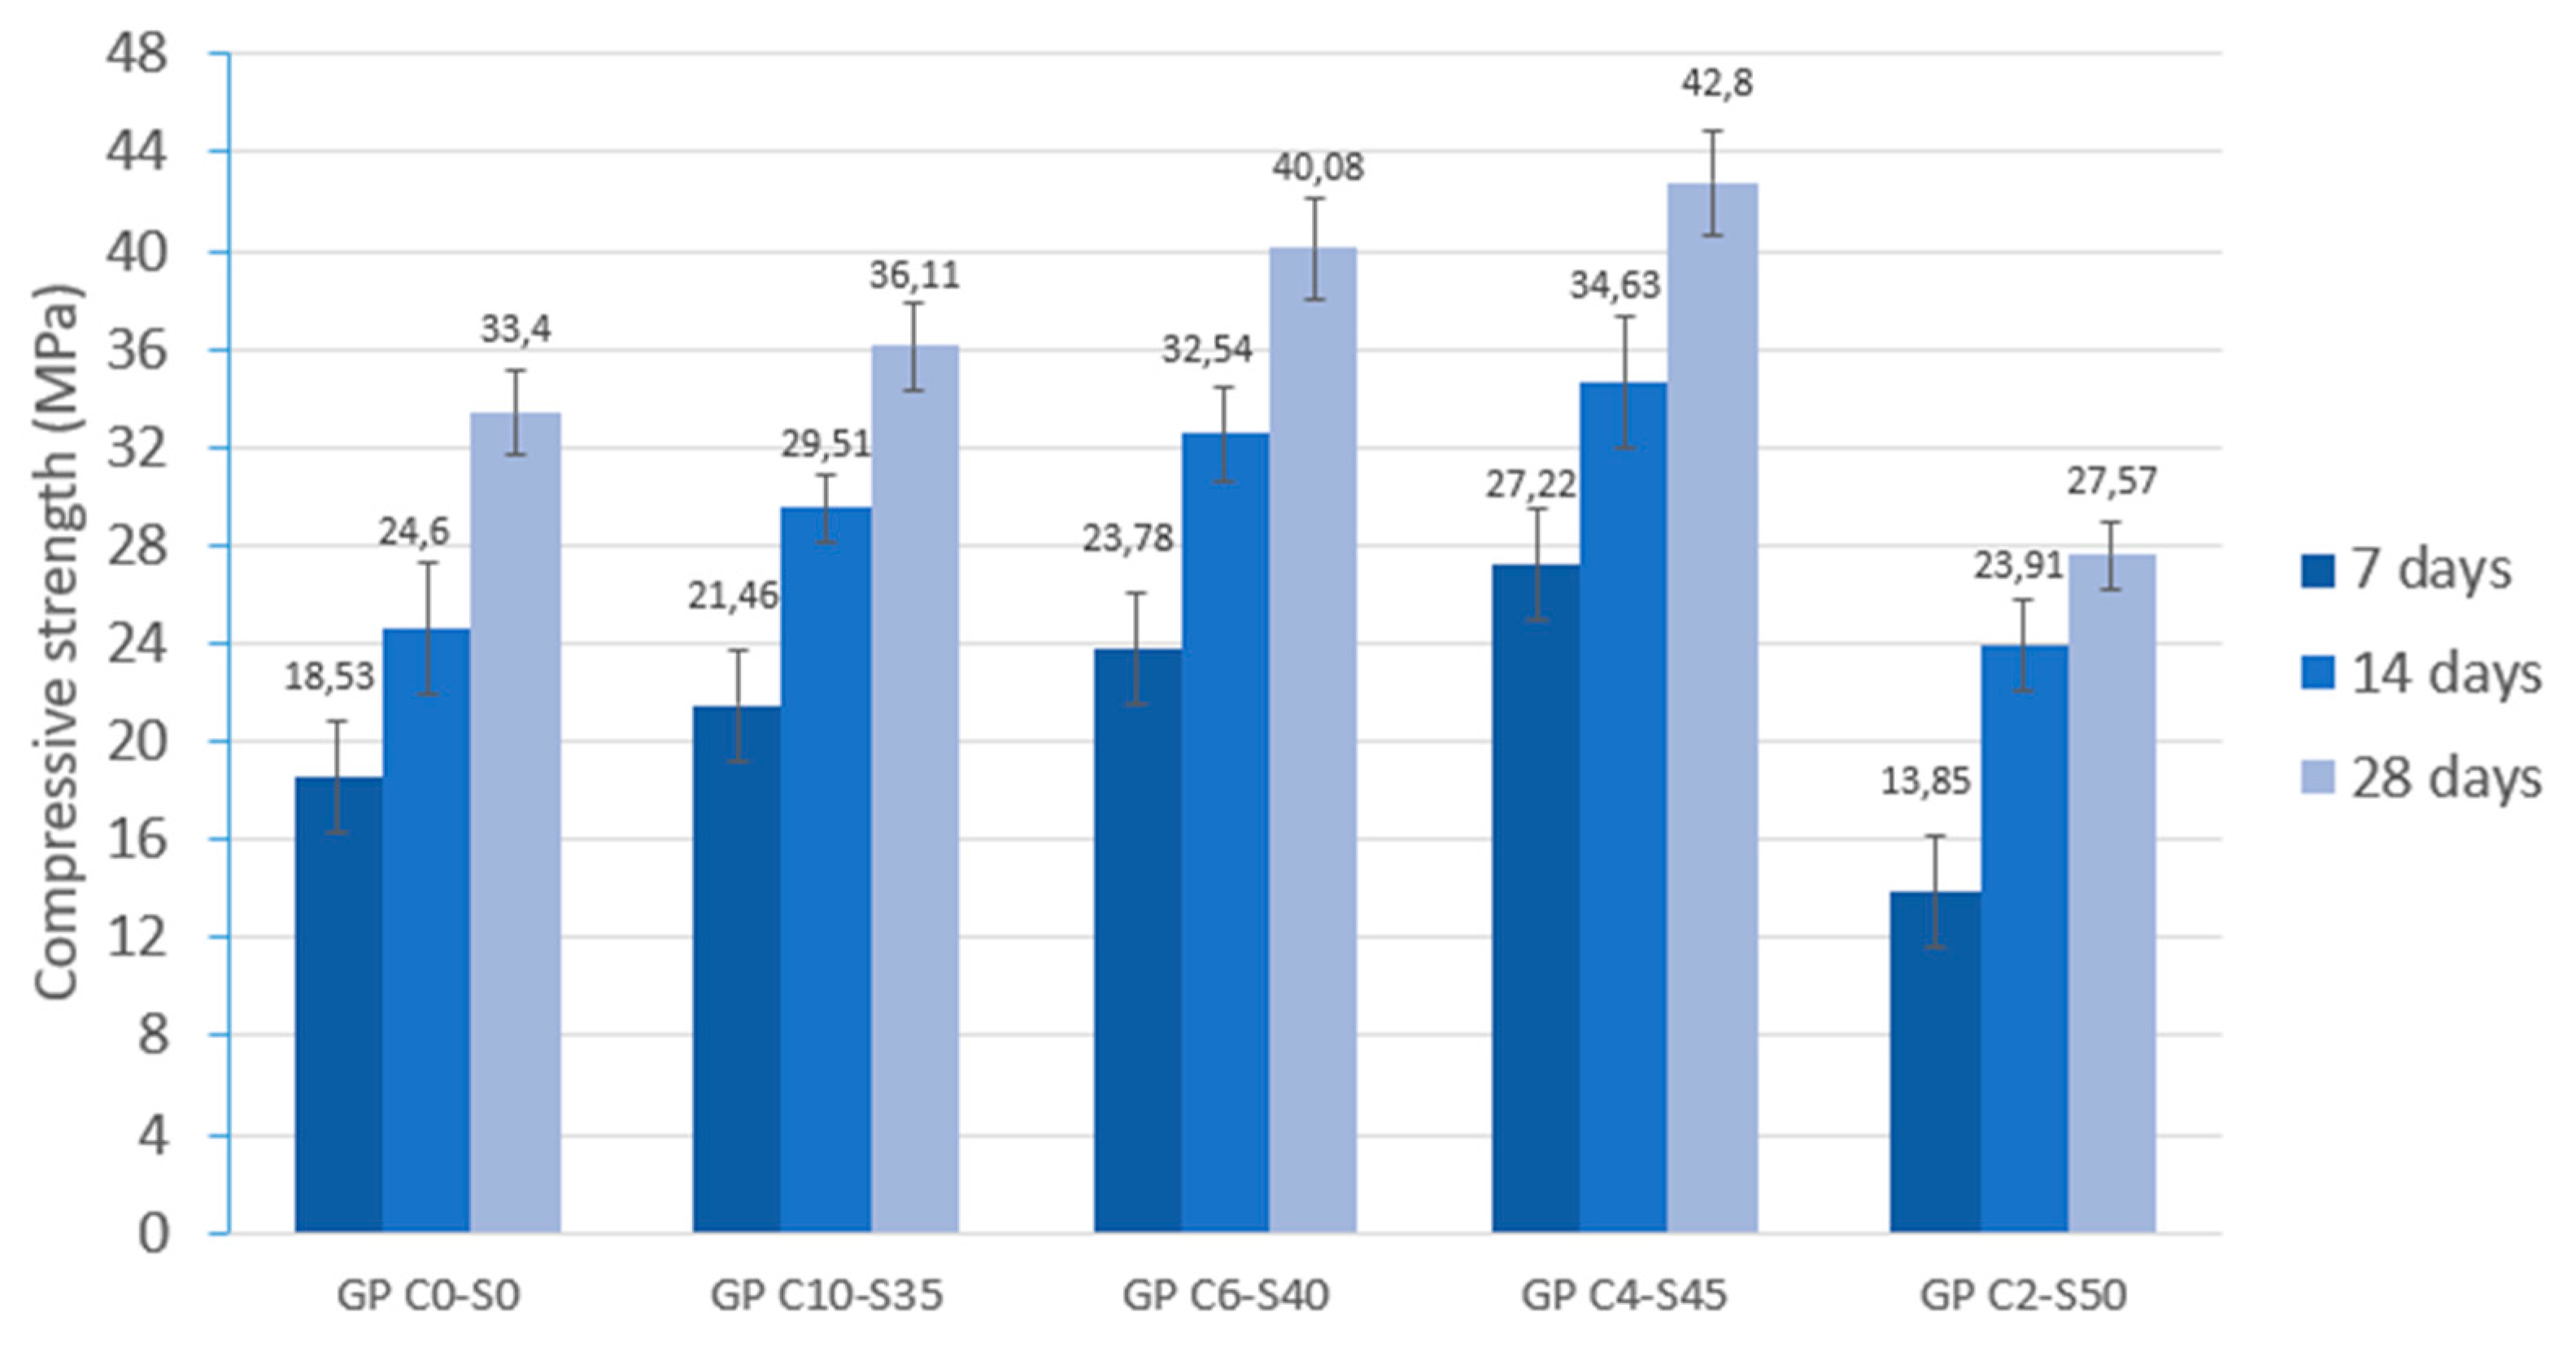
This second stage of the research involved the physical and mechanical testing of various geopolymer families prepared with two types of geopolymer formulations for comparing the mechanical characteristics:
(i) One family of seven specimens of geopolymers, use for control purposes, was elaborated with a combination of SSCS as source of aluminosilicates and activated with an alkali activator solution composed of sodium hydroxide and sodium silicate with a Na2SiO3/NaOH weight ratio of 0.5 considering a 12 M concentration.
(ii) Four families of novel geopolymer samples were developed, each consisting of seven specimens. These were made using fixed weight percentages of SSCS and OSBA, with variations in CH content. The featured samples contain constant SSCS and OSBA weight percentages, decreasing CH from 10 to 2 wt.%, increasing SGS from 35 to 50 wt.%, and varying Na2SiO3/OSBA ratios (0.35, 0.31, 0.19, and 0.08).
Table 8 represents the two types of formulations used in the experiment. Column 1 presents the coding used for the control geopolymer and geopolymer concrete samples. GP means geopolymer, the letter C and the digits indicate the percentage of chamotte, and the letter S followed by digits represents the percentage of steel sludge. The column labeled “NaOH Molar” indicates the molar percentage used in the control geopolymer; column 7 indicates the Na
2SiO
3/OSBA the weight ratio, and column 8 shows the liquid/solid weight ratio.
To compare both mixtures—the control geopolymer and novel geopolymer concrete—the different families of specimens were subjected to physical and chemical characterization. Since SSCS, CH, OSBA, and SGS were collected from outdoor landfills, prior the formation of the geopolymer, these by-products were subjected to a drying process. Samples were dried in an oven at 105 ± 2 °C for a period of 24 h to remove accumulated moisture. Once the possible moisture was removed, the next step consisted of guaranteeing the homogenization of raw materials through the selection of the finer particles. A lower particle size results in better reactivity, proper interaction between the precursor and alkali activation solution, and, therefore, higher compressive strength of the geopolymer. For the preparation of precursor raw materials, the CH was crushed and sieved to produce a powder with a particle size distribution appropriate for passing through a 0.25 mm sieve. On the contrary, the mining by-product from the slate stone cutting sludge ponds did not need grinding because of its powdery consistency from sieving. However, it was sieved to ensure a particle size of 0.25 mm.
For the preparation of the alkali activation solution, the calcined OSBA was also crushed to produce fine particles, improving its solubility in sodium silicate and distilled water. Then, the OSBA was combined with sodium silicate and distilled water according to the previously reported Na2SiO3/OSBA ratios. The slag was also kiln dried to avoid any accumulation of moisture and sieved and sorted into different particle sizes: (i) 22.4 to 20 mm, (ii) 20 to 16 mm, (iii) 16 to 10 mm, (iv) 10 to 8 mm, and 8 to 5 mm.
For the control geopolymer, the alkali solution, comprising sodium hydroxide and sodium silicate, was prepared in advance and allowed to cool for 24 h at room temperature to mitigate the exothermic reaction, prior to being combined with SSCS in the proportions specified in
Table 8.
Once the precursor materials were prepared and the two different alkali activators were elaborated, the subsequent step was to weigh the precursor materials, alkali solution, and steel granulated slag for the novel geopolymer. The control geopolymer pastes were poured into prismatic molds with internal dimensions of 35 × 35 × 35 mm, producing seven specimens for each formulation. The novel geopolymer concrete pastes were set in prismatic molds of 100 mm × 100 mm × 100 mm for the seven specimens. Samples of both formulations were vibrated on a vibration table for 30 s.
The curing process of the geopolymer samples followed a three-stage cycle over 28 days: (i) curing at ambient temperature (25 °C) for 24 h, (ii) then placing the samples in an oven at 85 ± 5 °C for 90 h, and (iii) finally curing them at ambient temperature until day 28 for the completion of the cycle.
Figure 6 provides a schematic overview of the process.
The two-stage curing process was designed to enhance the physical and mechanical properties of the geopolymers by influencing the polymerization reaction and microstructure development.
In the first stage, curing at room temperature promotes initial gelation, which is crucial for forming the geopolymer’s three-dimensional structure. During this stage, dissolved silicon and aluminum species begin reacting to form an amorphous aluminosilicate gel. This phase is vital for ensuring an even distribution of reaction products and preventing crack formation due to sudden contractions.
The second stage, conducted at 85 °C, accelerates the polymerization reaction and fosters the development of a more crystalline microstructure. The elevated temperature enhances ion mobility, leading to greater densification of the matrix. This heat treatment also improves the material’s mechanical strength and durability by eliminating non-structural water and consolidating the geopolymer’s internal structure.
Finally, controlled cooling stabilizes the microstructure formed during the thermal treatment, preventing internal stresses or cracks that might result from rapid temperature fluctuations.
After completing the second stage of the curing process (90 h at 85 ± 5 °C) in the three-stage procedure, all specimens were carefully demolded and stored under controlled laboratory conditions to ensure consistency throughout the testing period. The geopolymer concrete samples were then allowed to cool gradually to room temperature, after which they were stored in sealed, labeled plastic bags at approximately 23 ± 5 °C to complete the 28-day curing process. The use of sealed plastic bags helped minimize moisture loss and prevent carbonation.
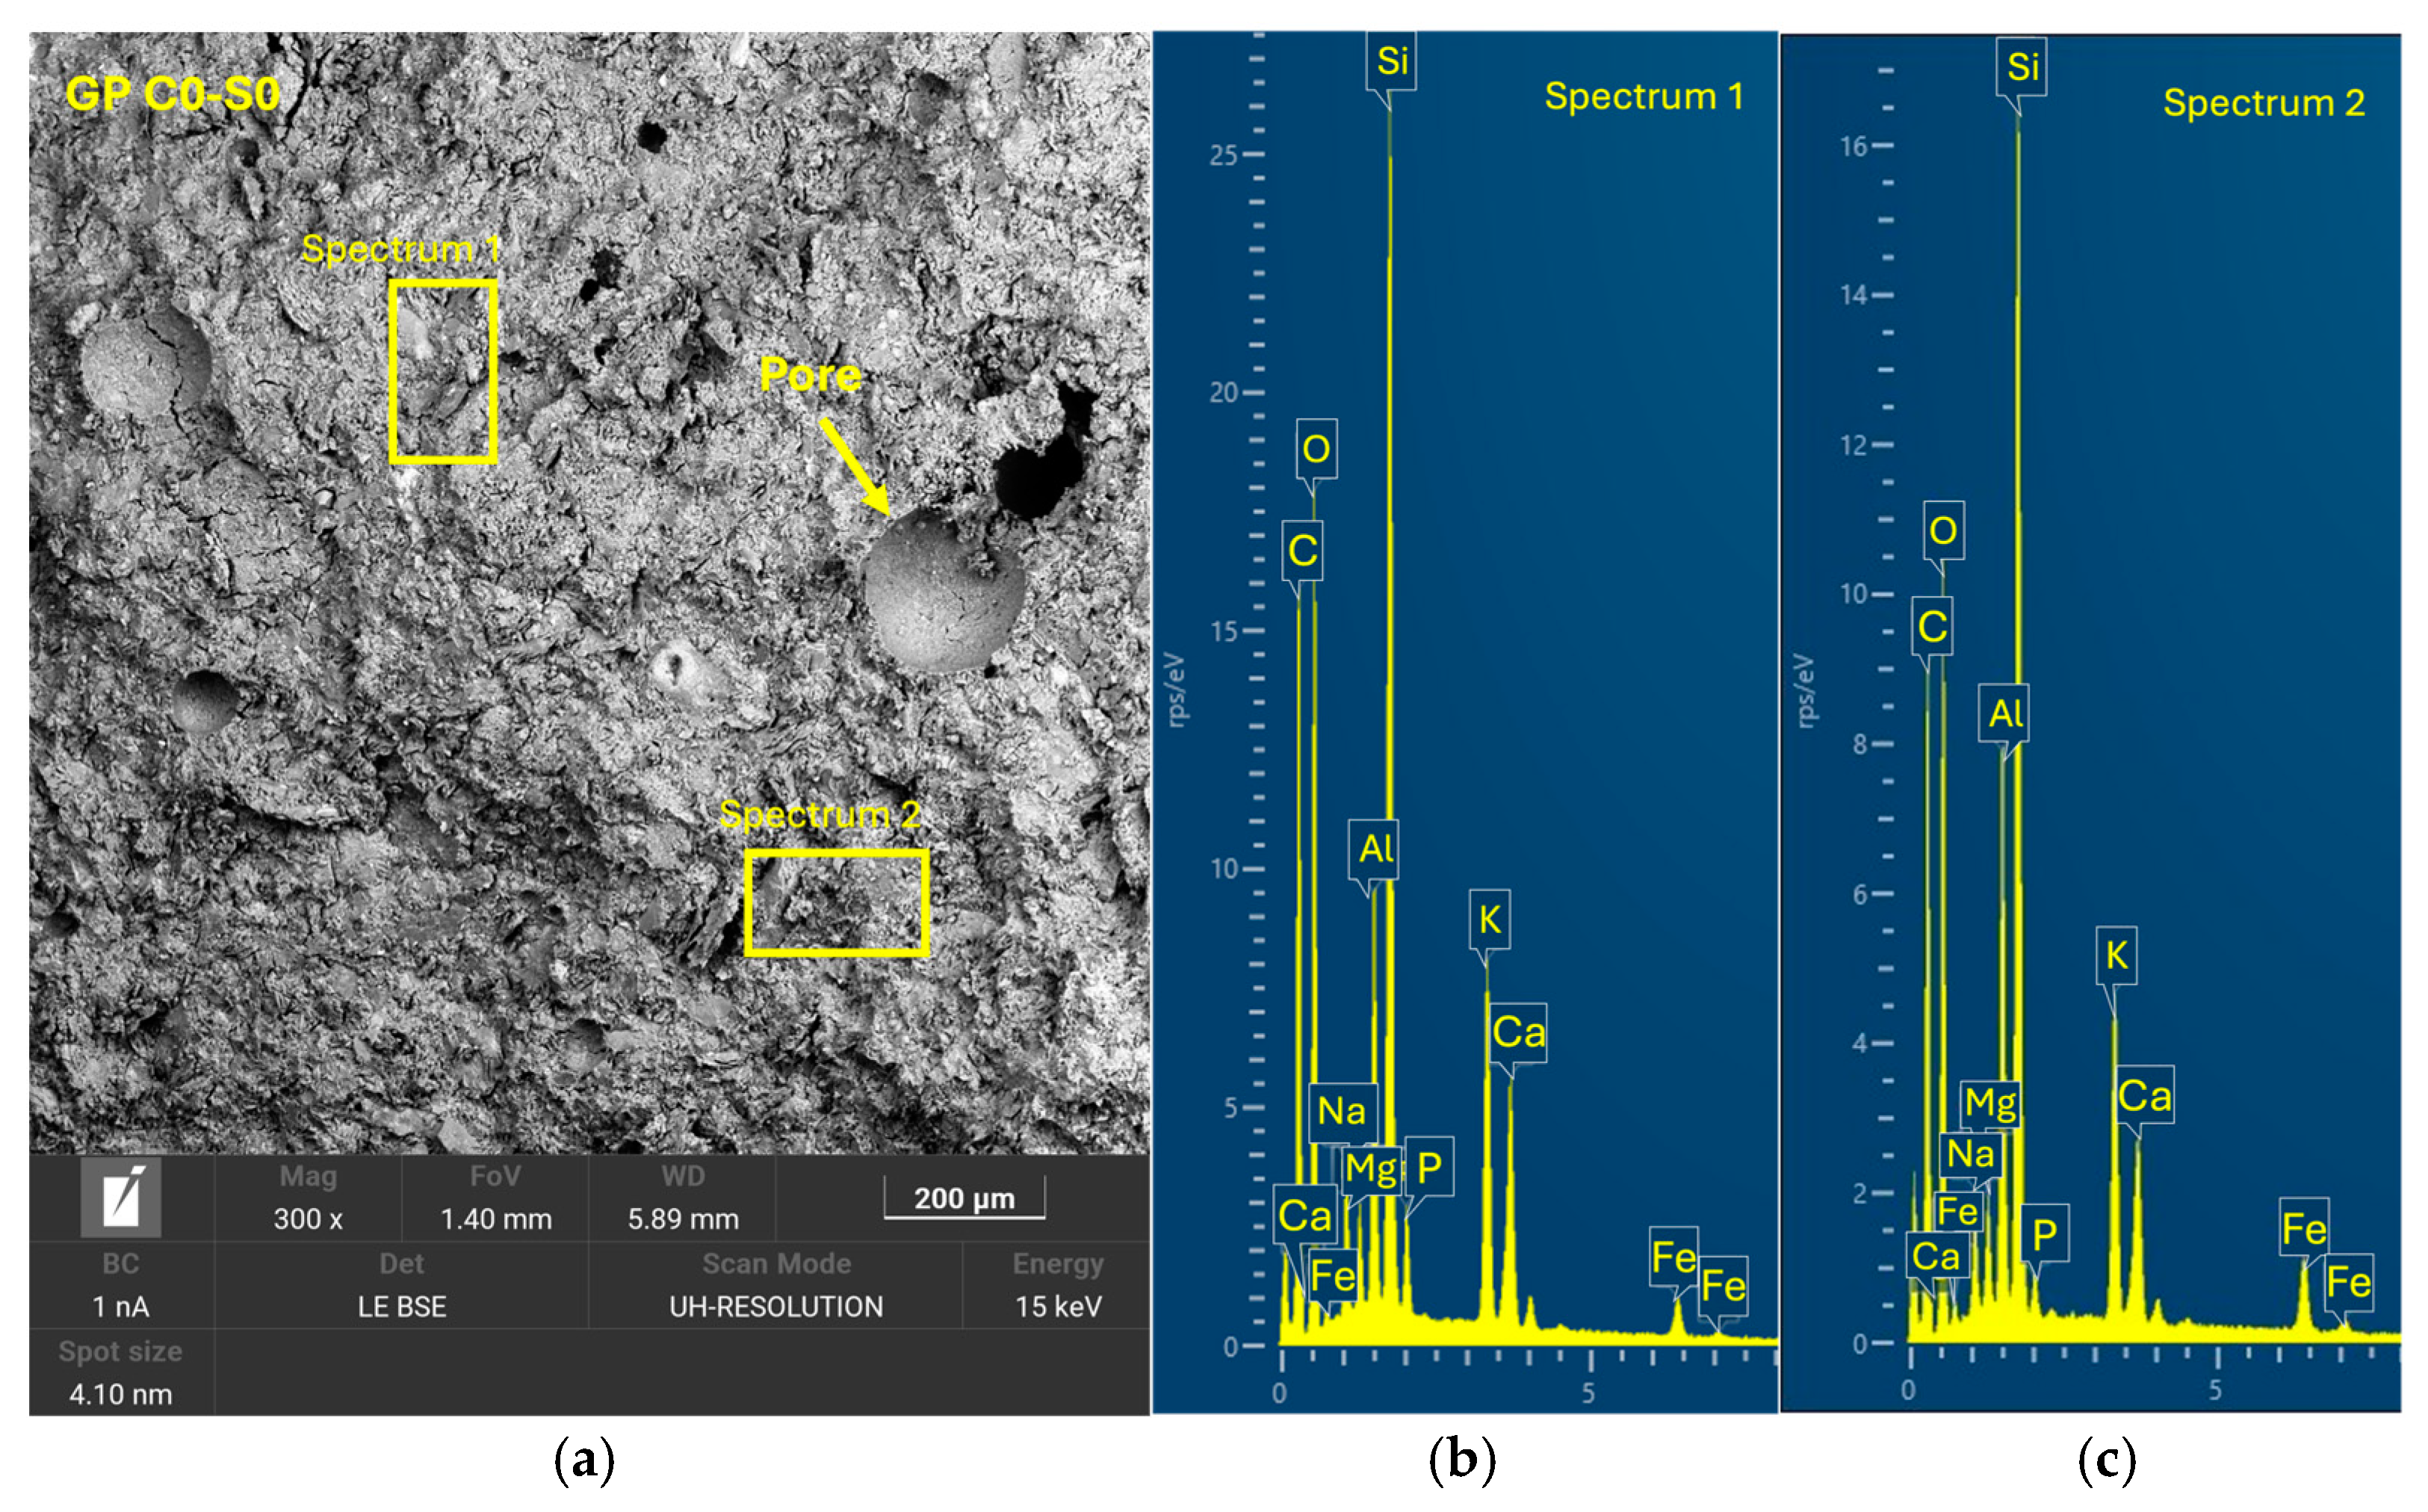
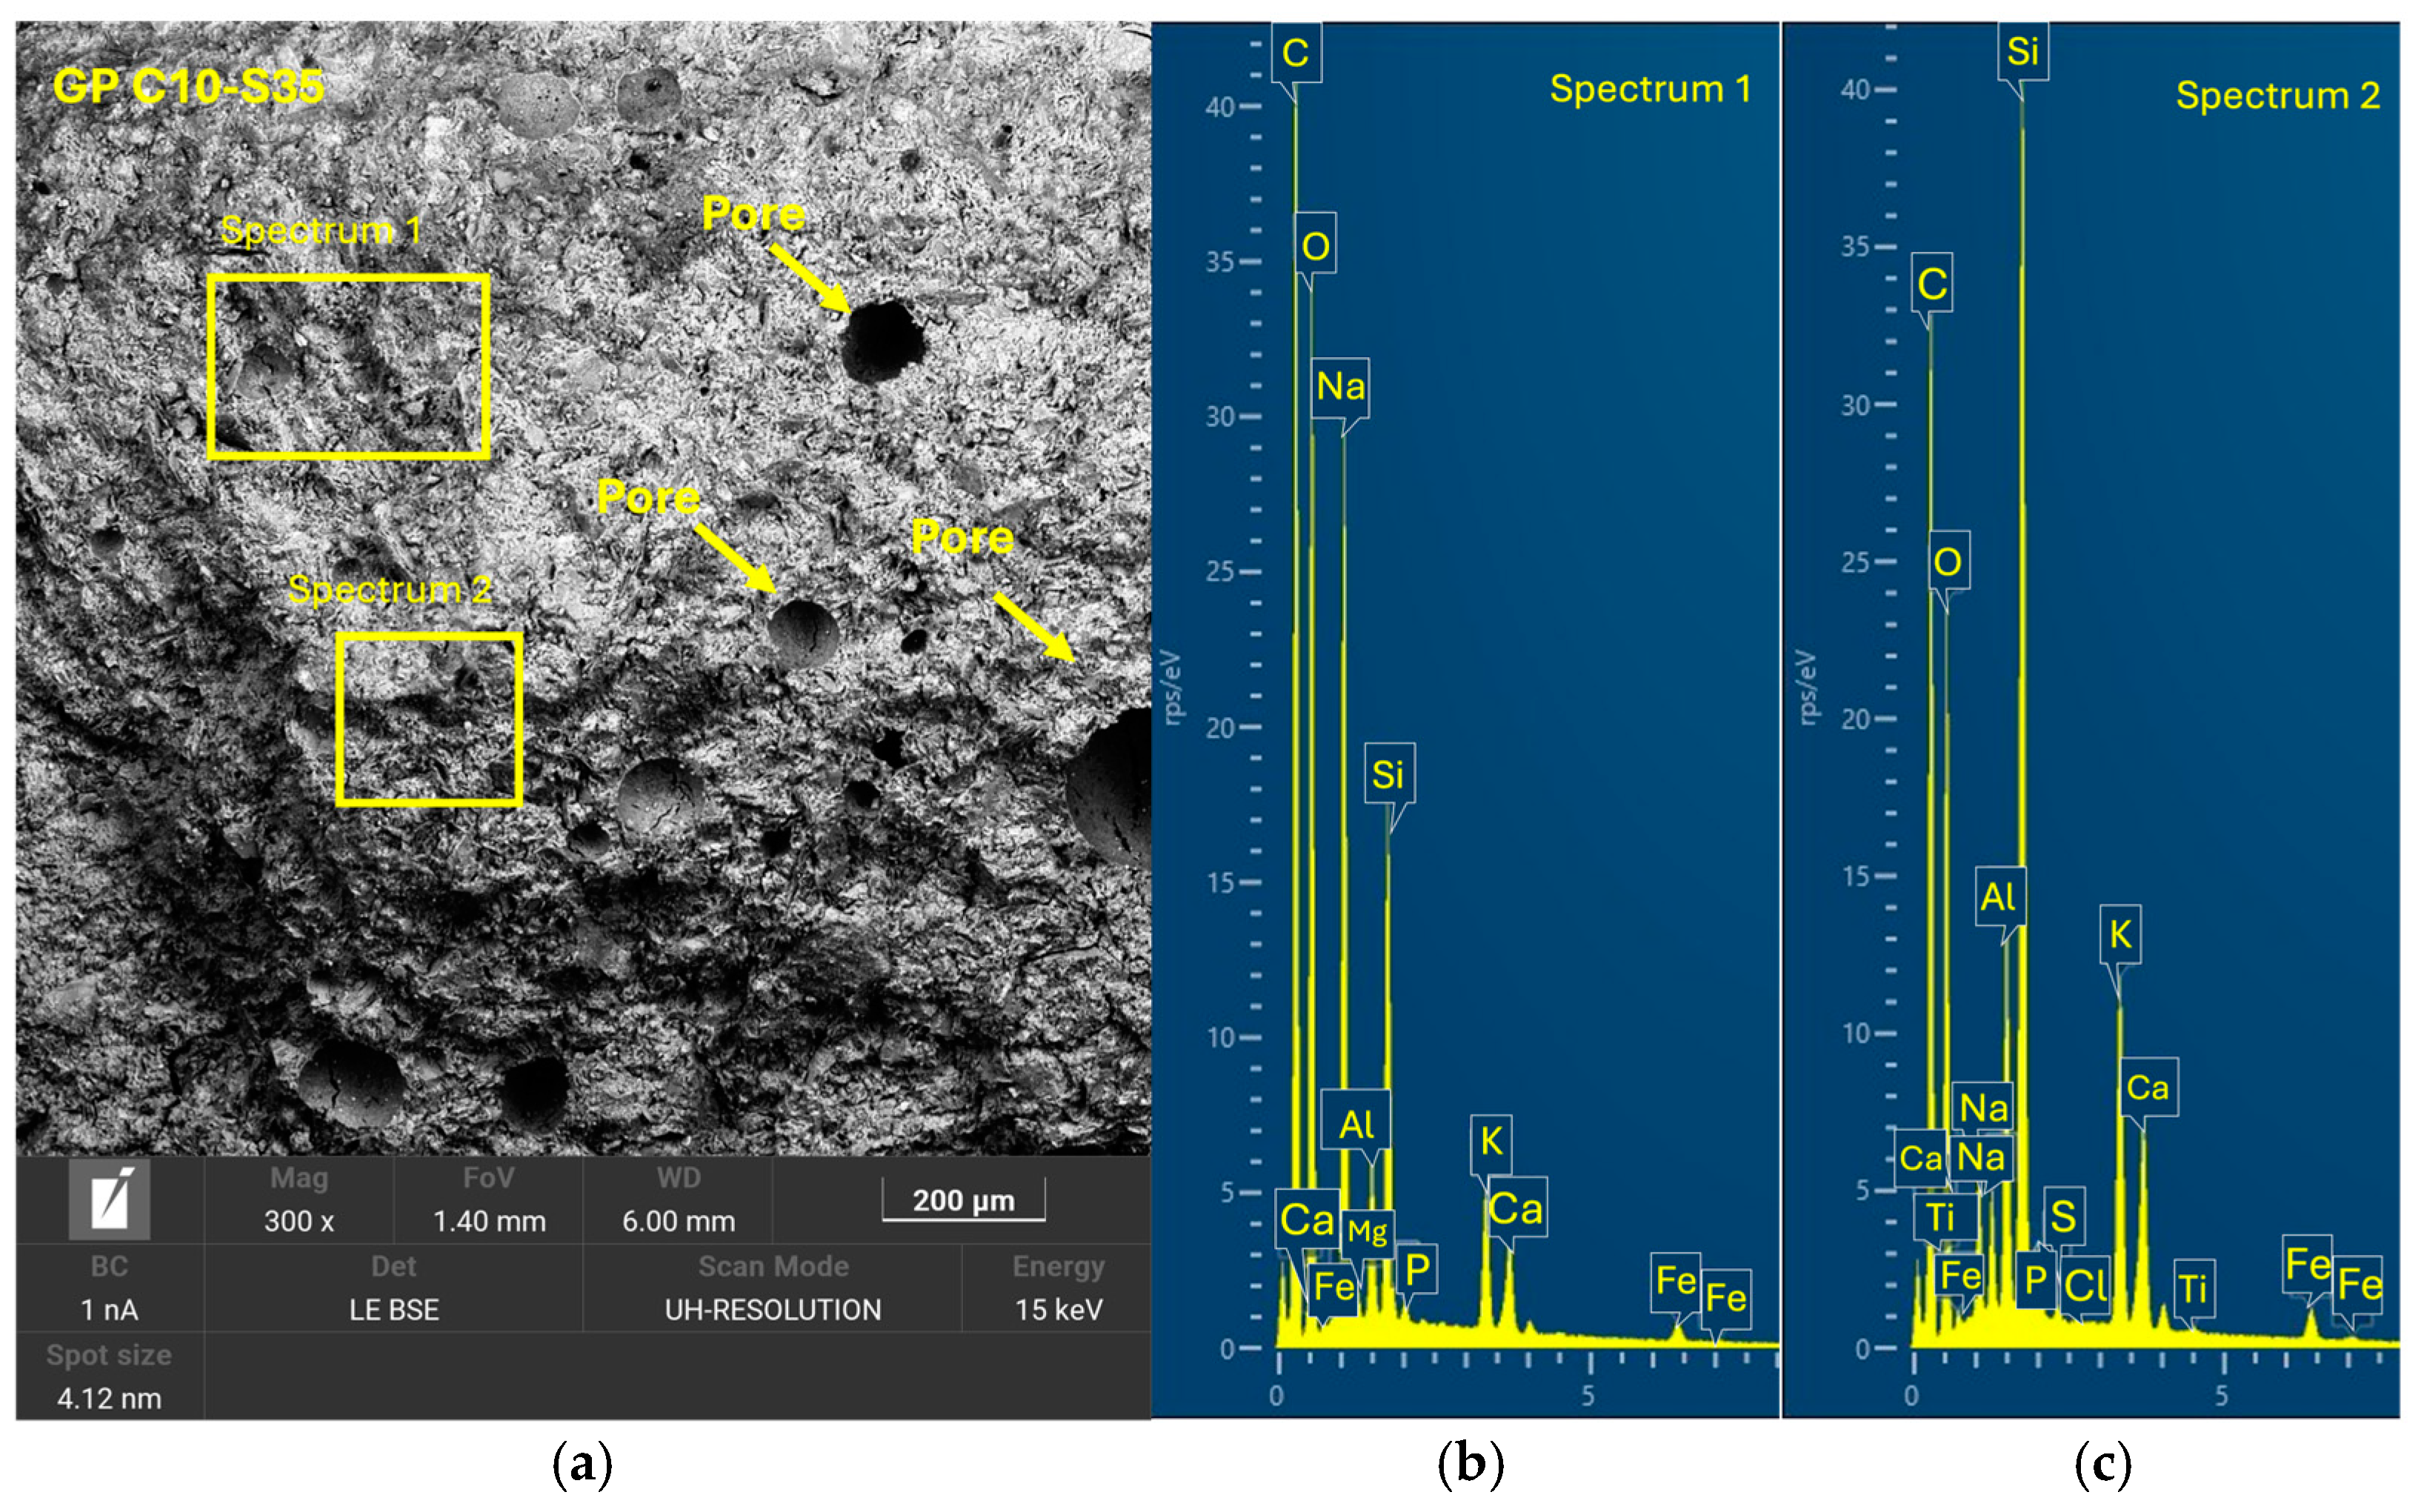
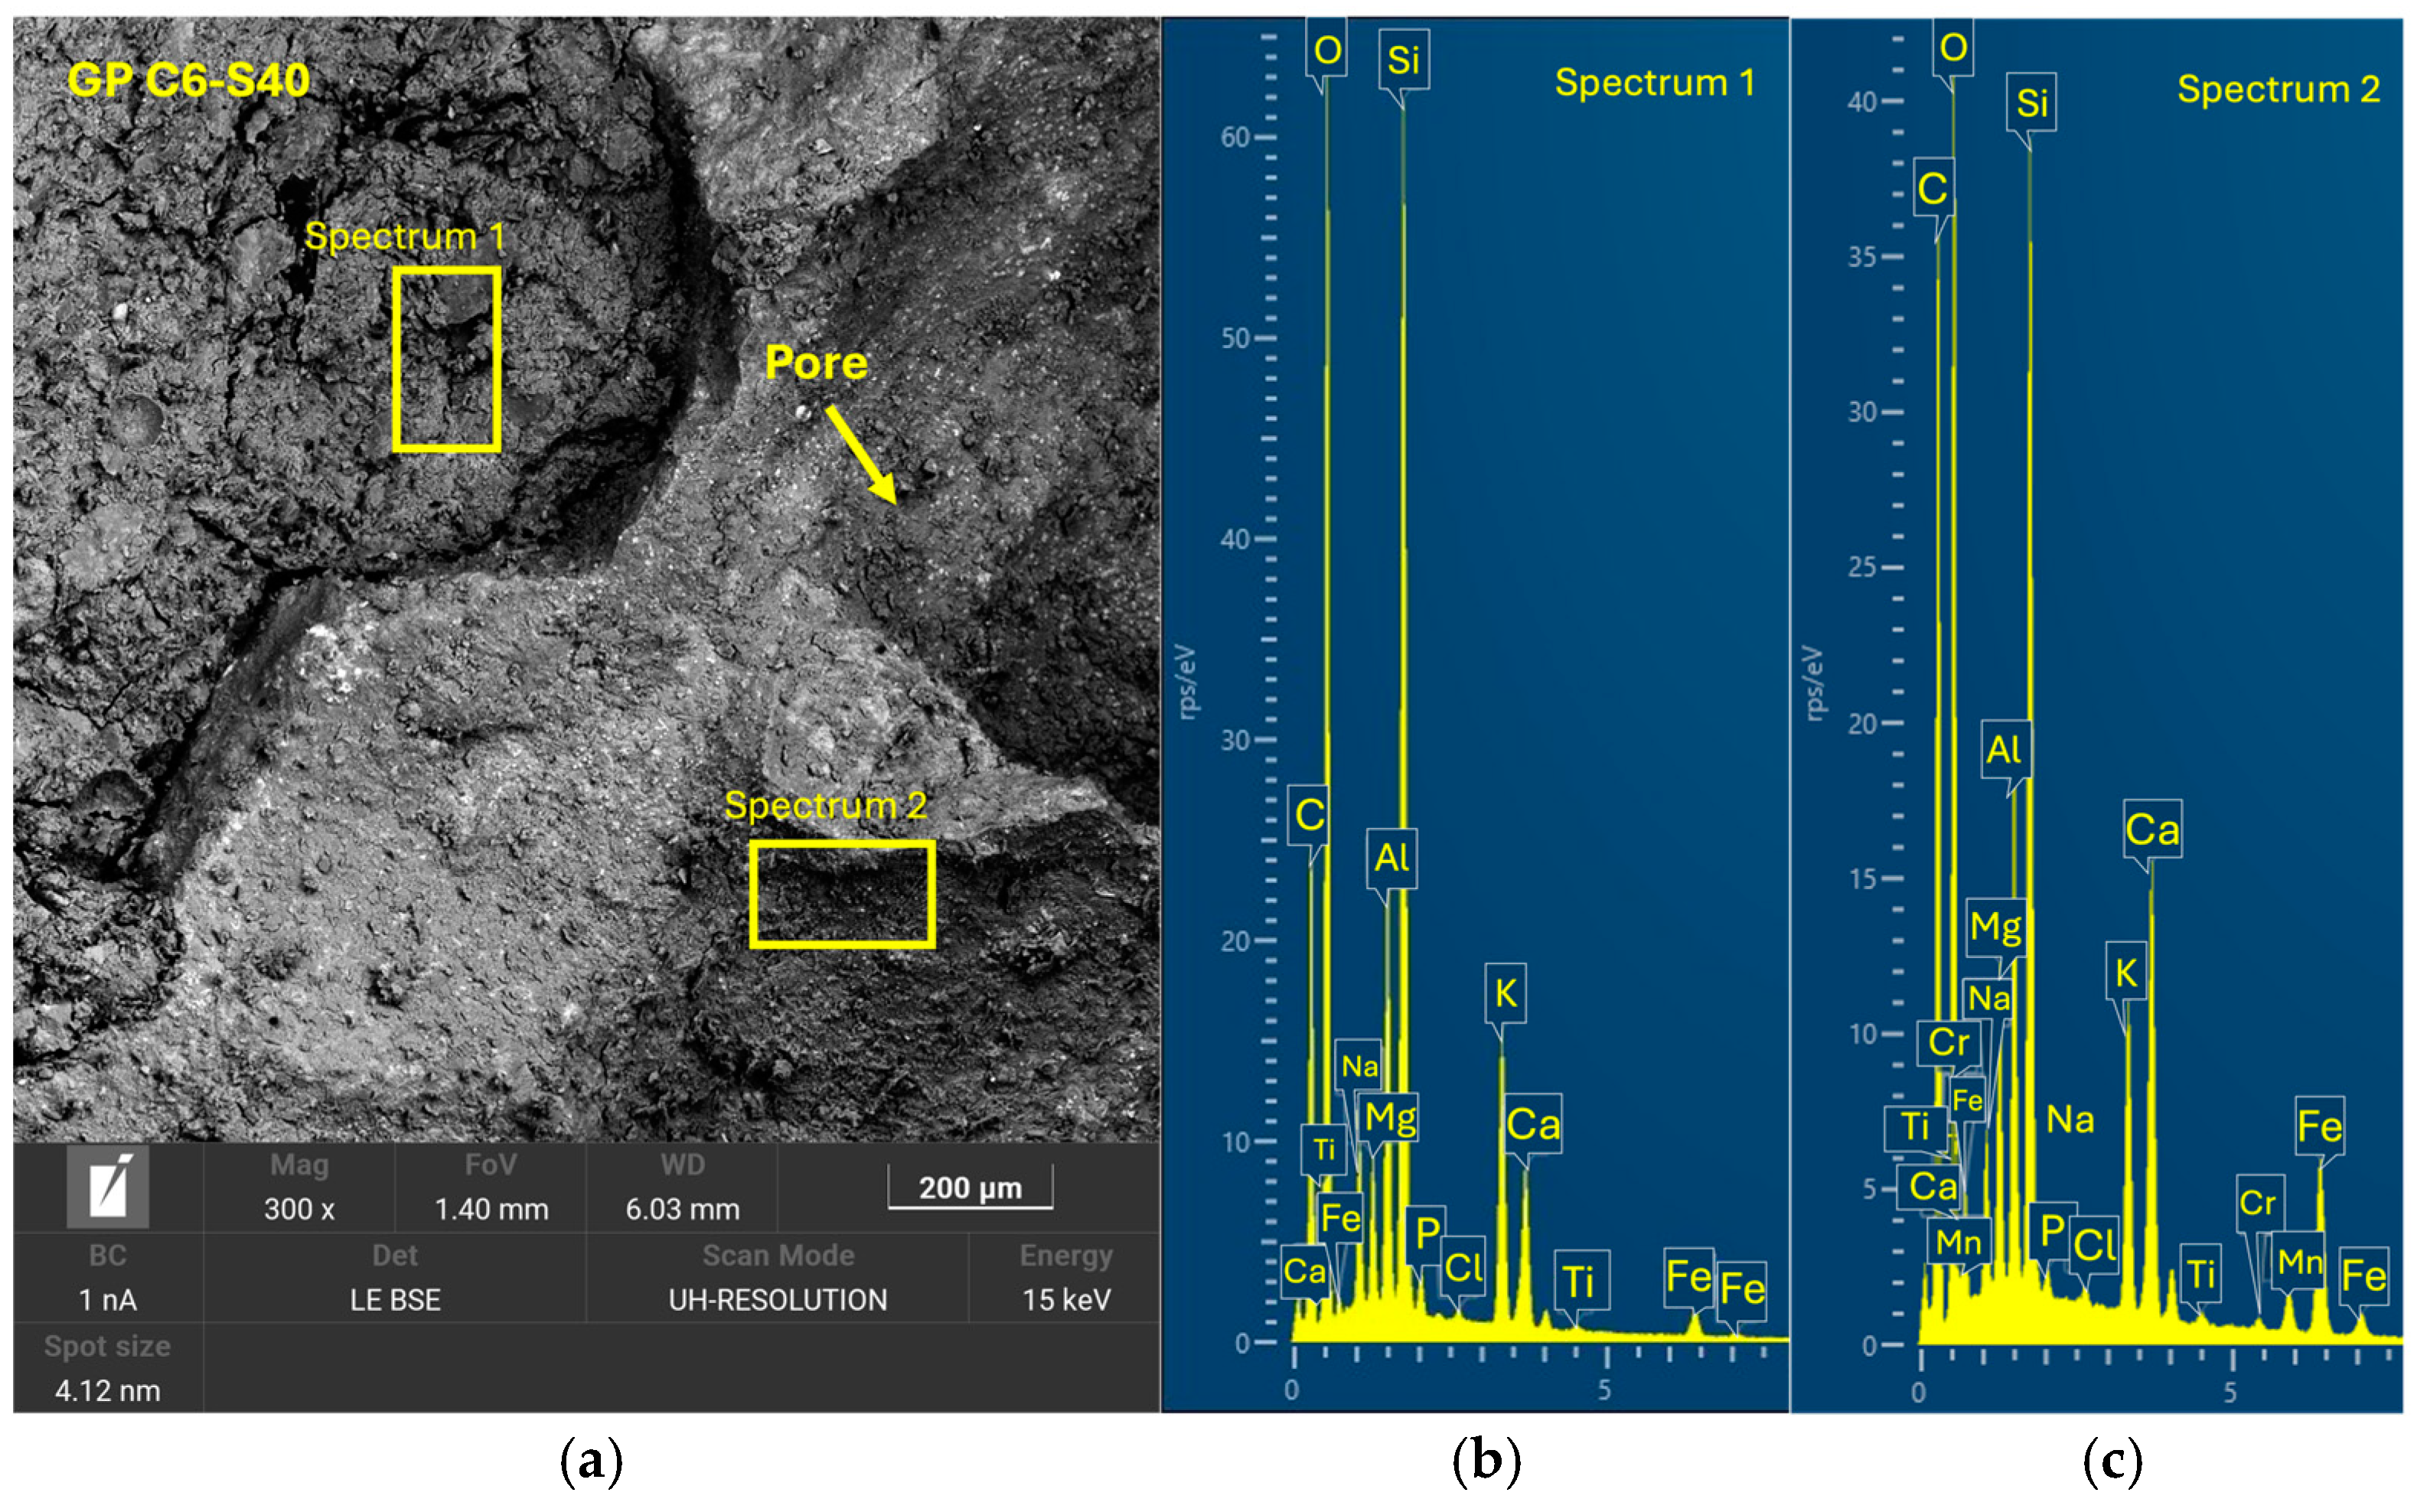
Tests were conducted at 24 h intervals, except for the compressive strength tests performed at 7, 14, and 28 days of curing. During the periods between tests, the geopolymer samples remained sealed in the labeled bags to maintain a stable internal environment and prevent external interference. Additionally, one sample from each geopolymer family was set aside and stored under the same conditions for subsequent analysis using scanning electron microscopy (SEM). (Microscope Carl Zeiss Merlin, Zeiss GmbH, Jena, Germany).
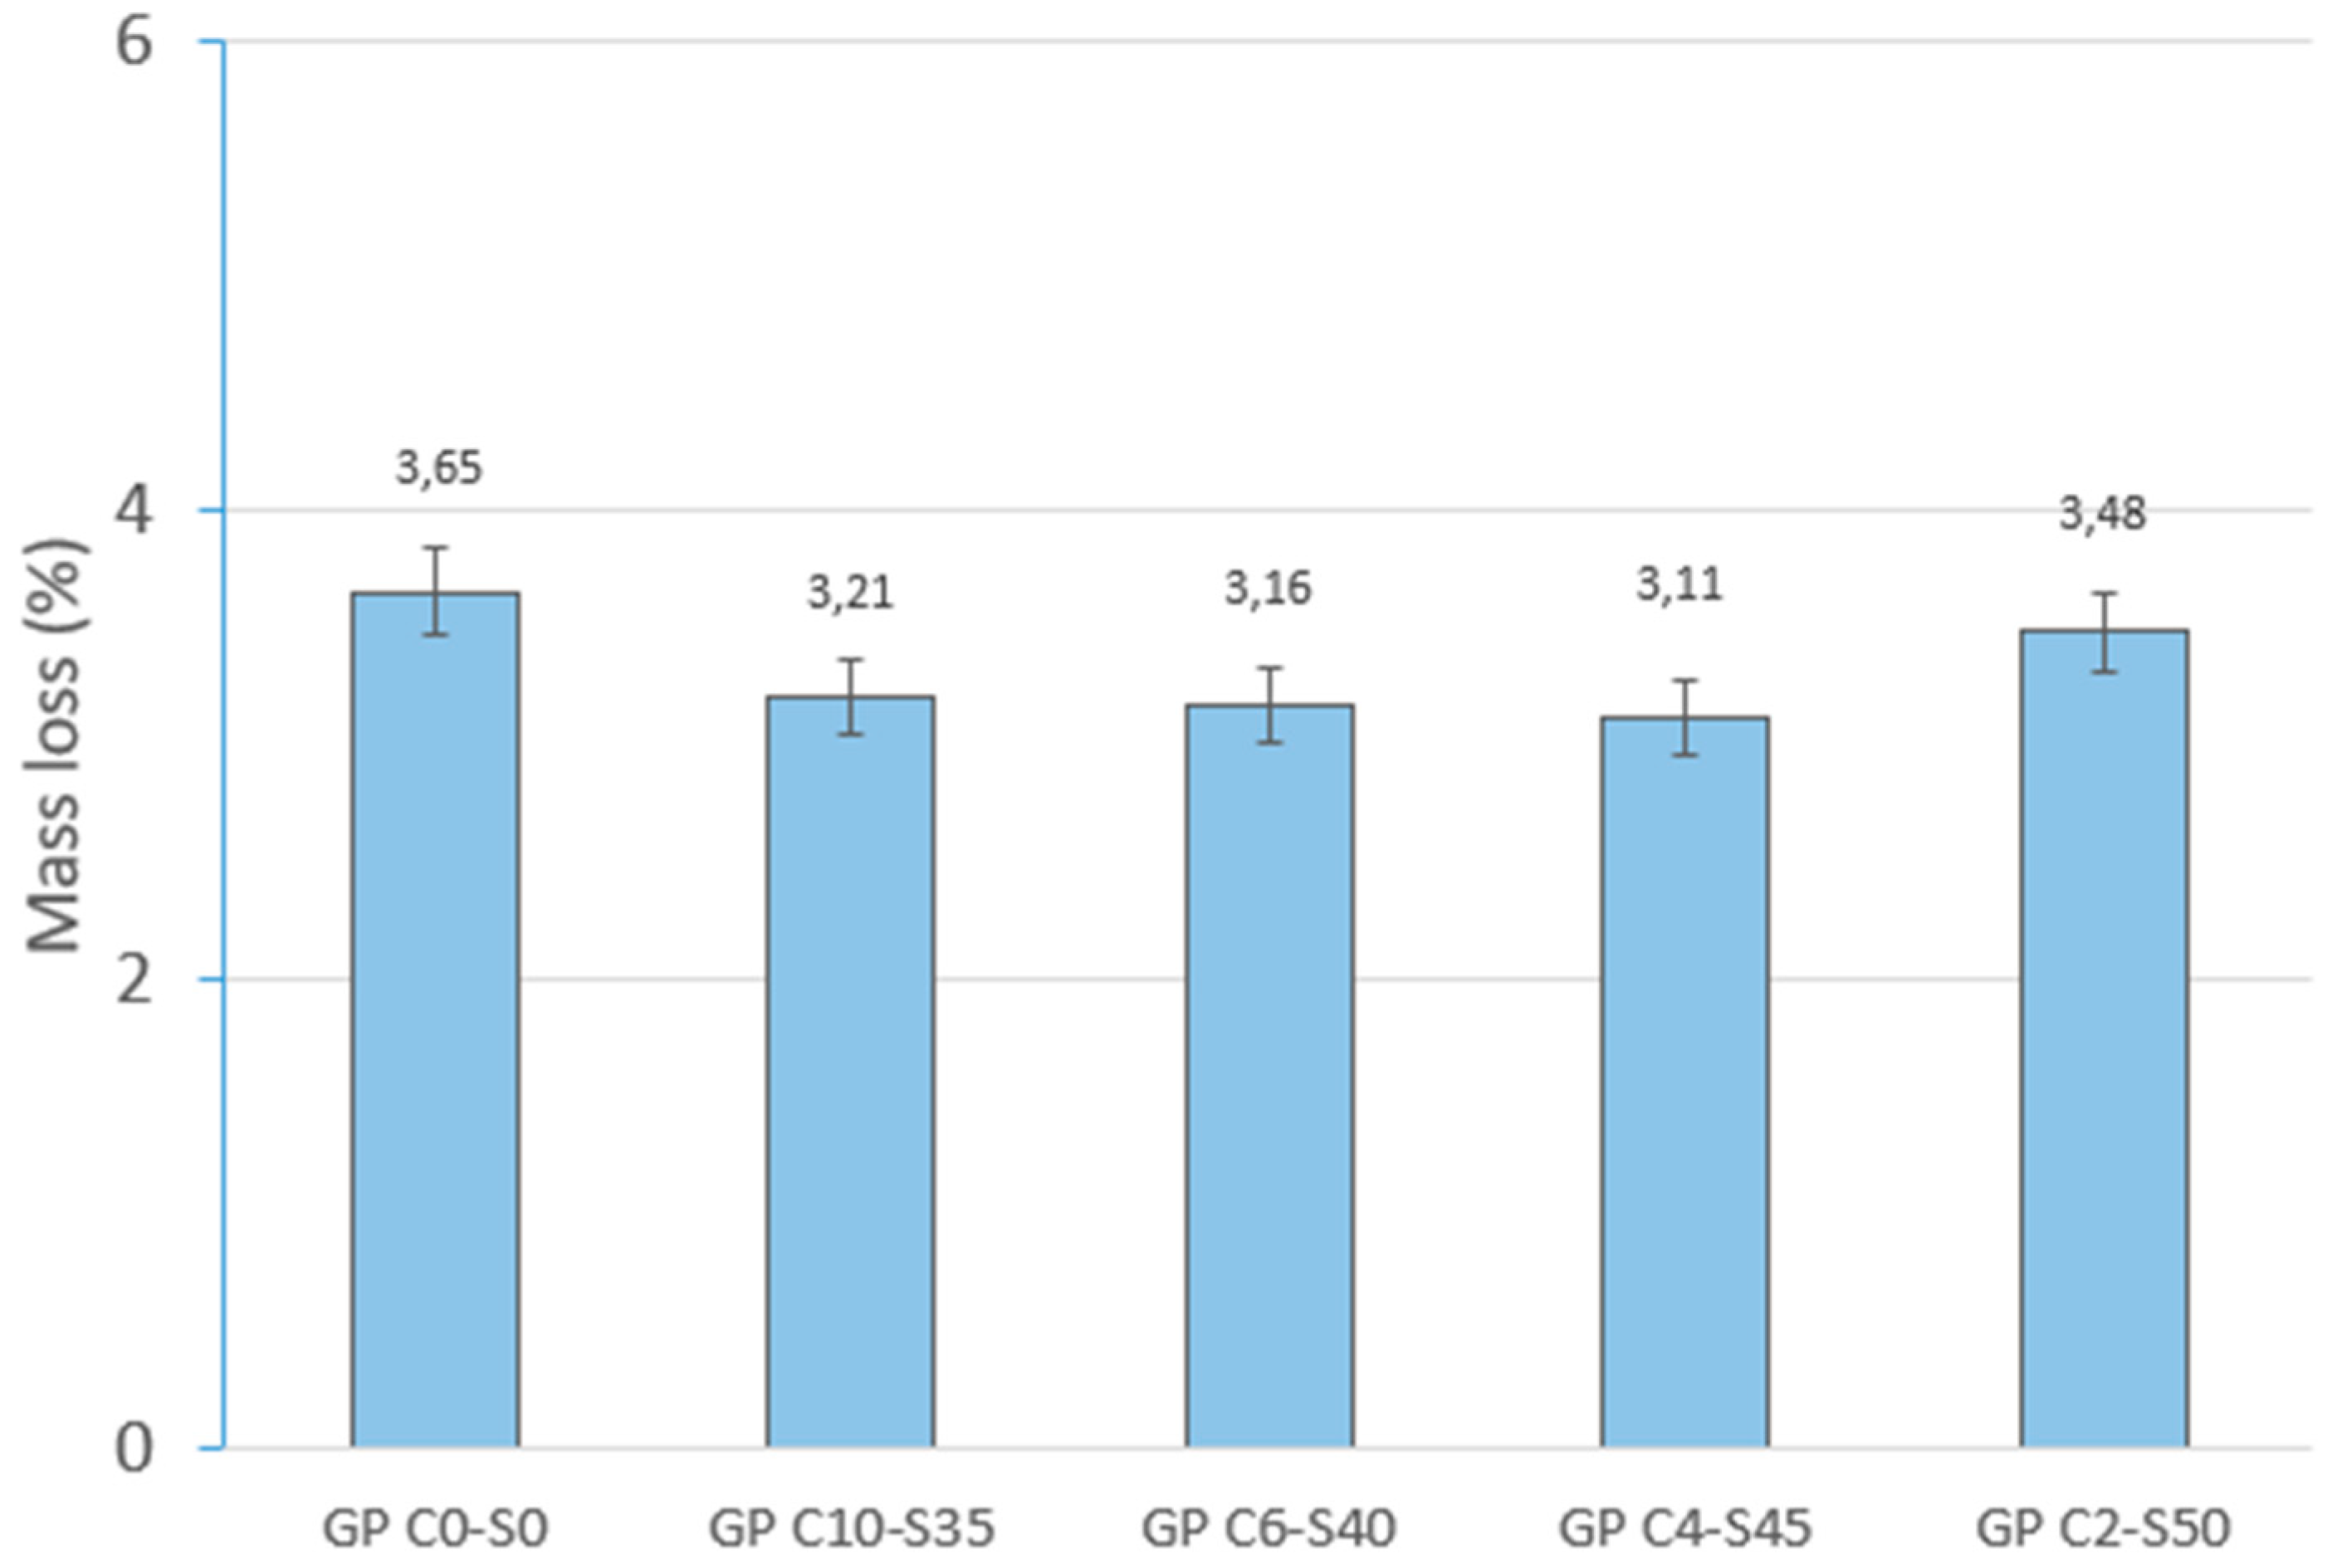
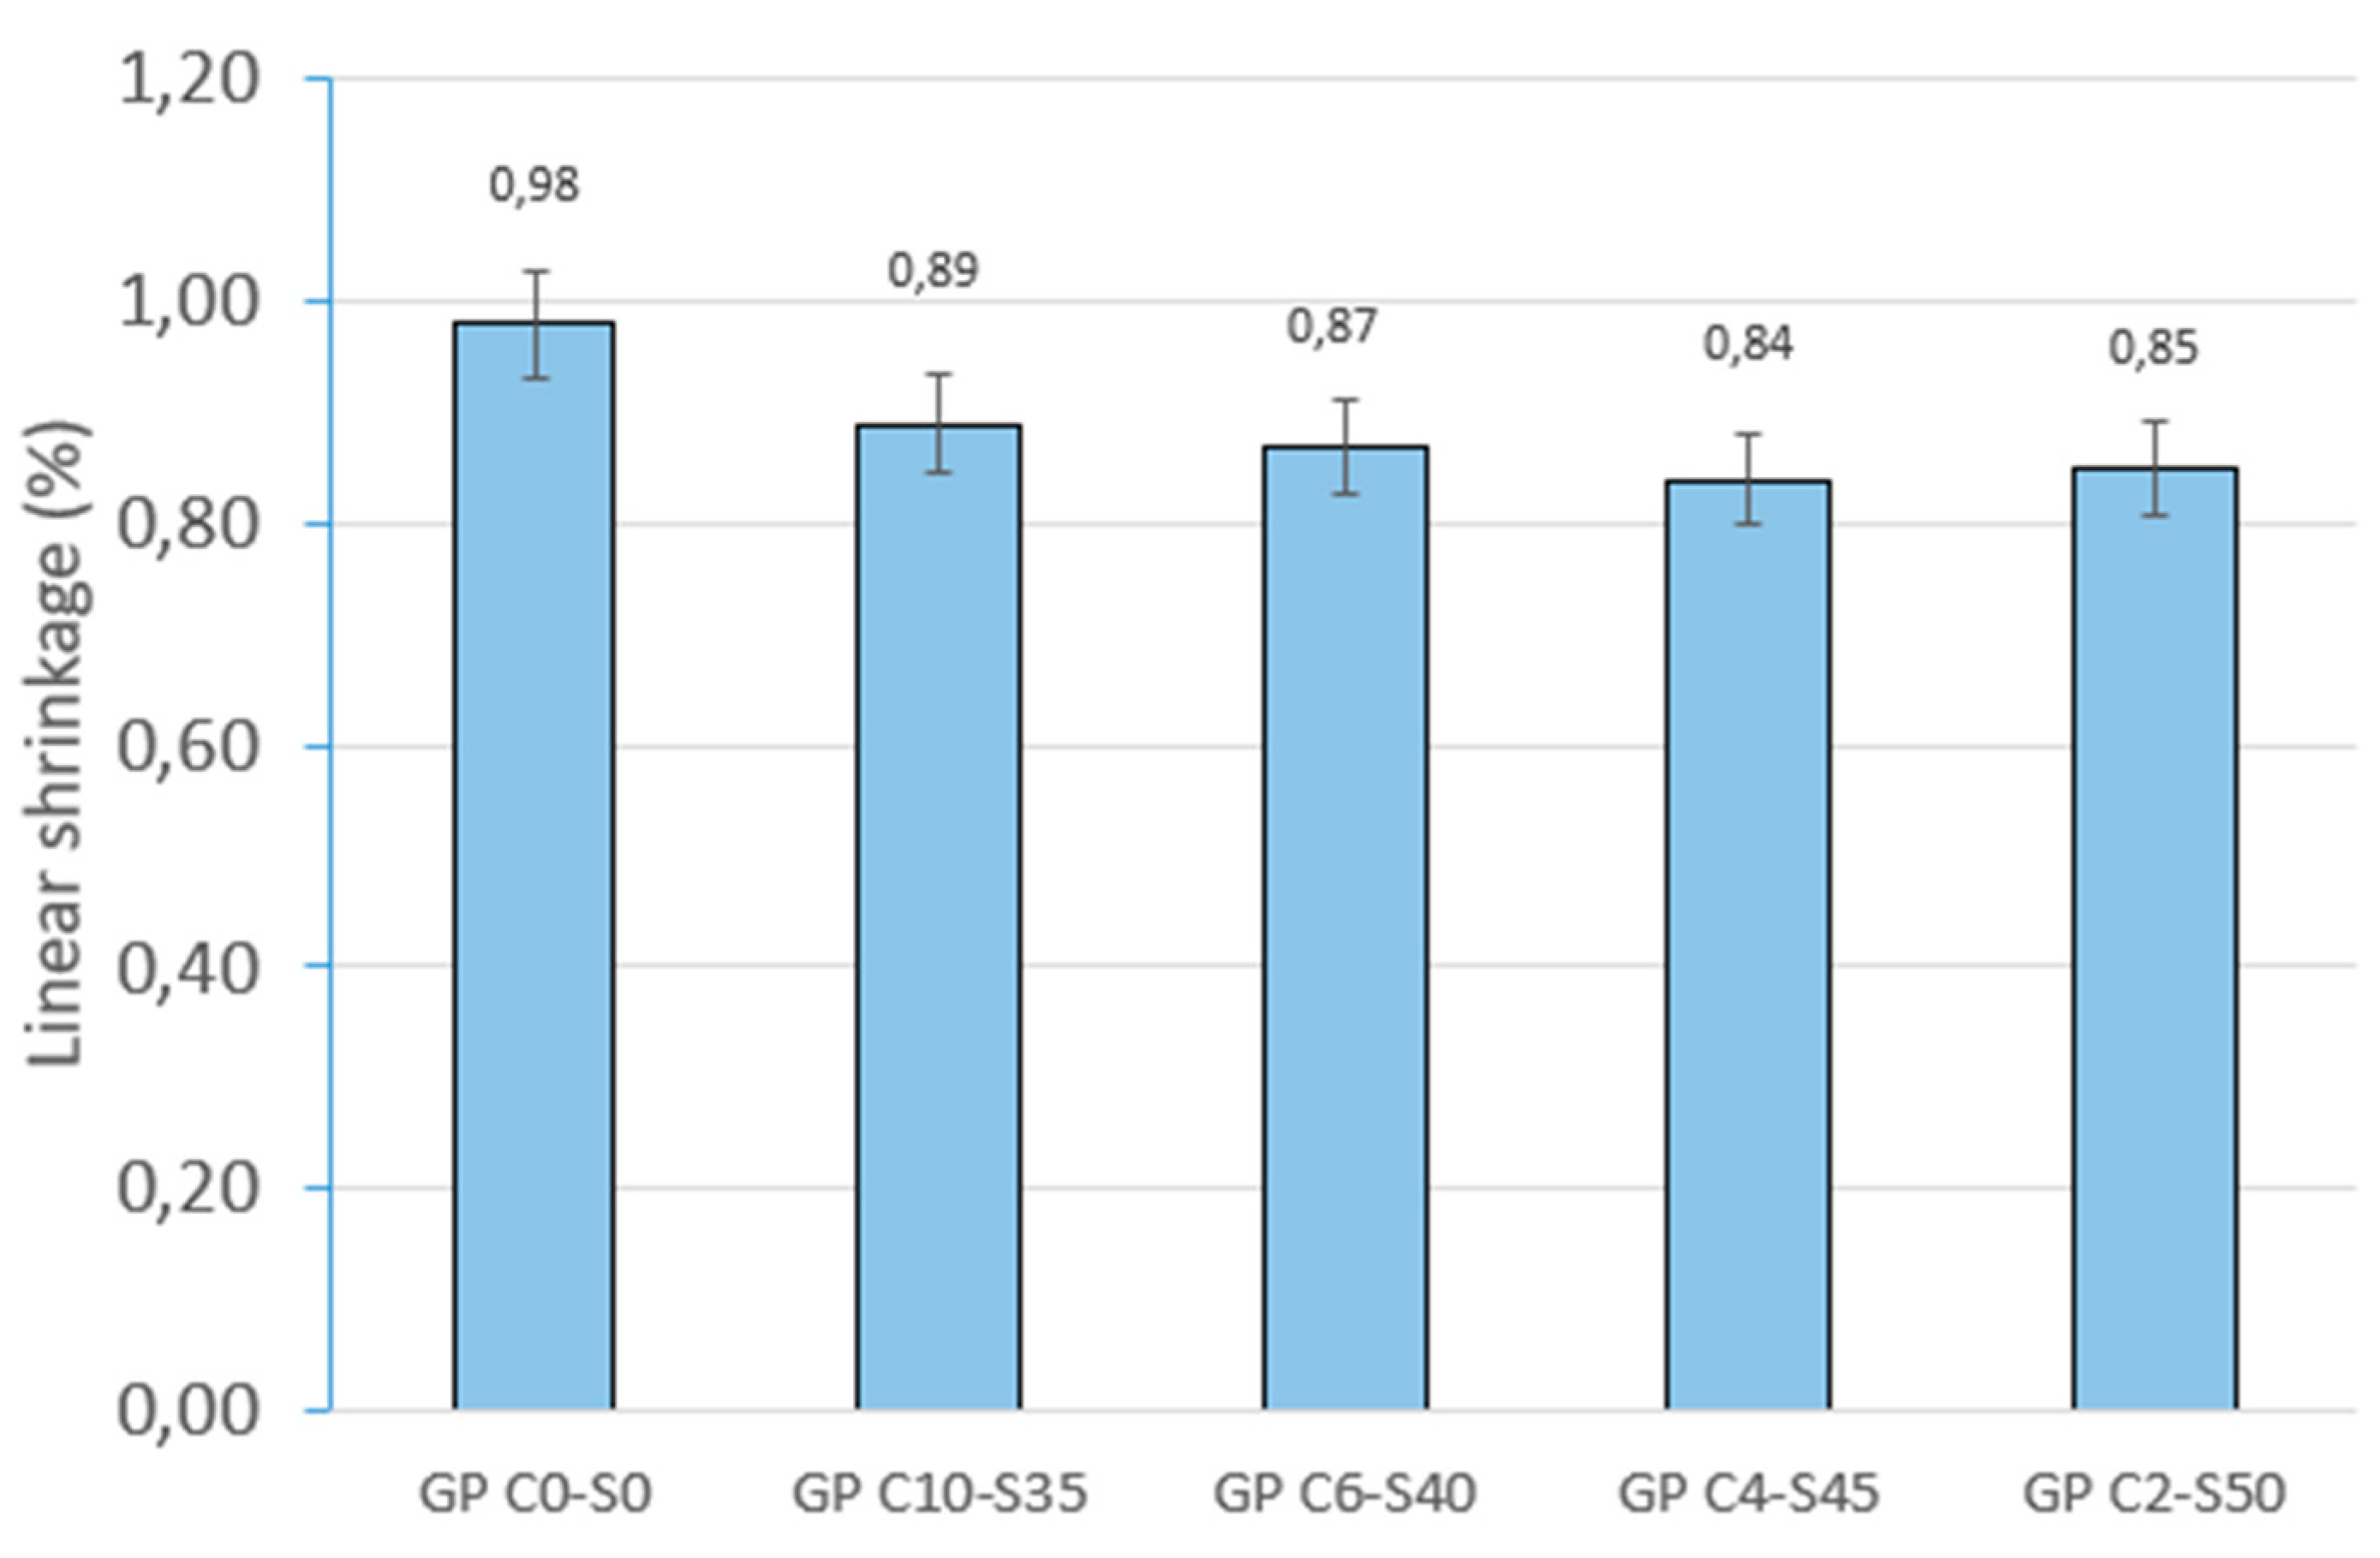
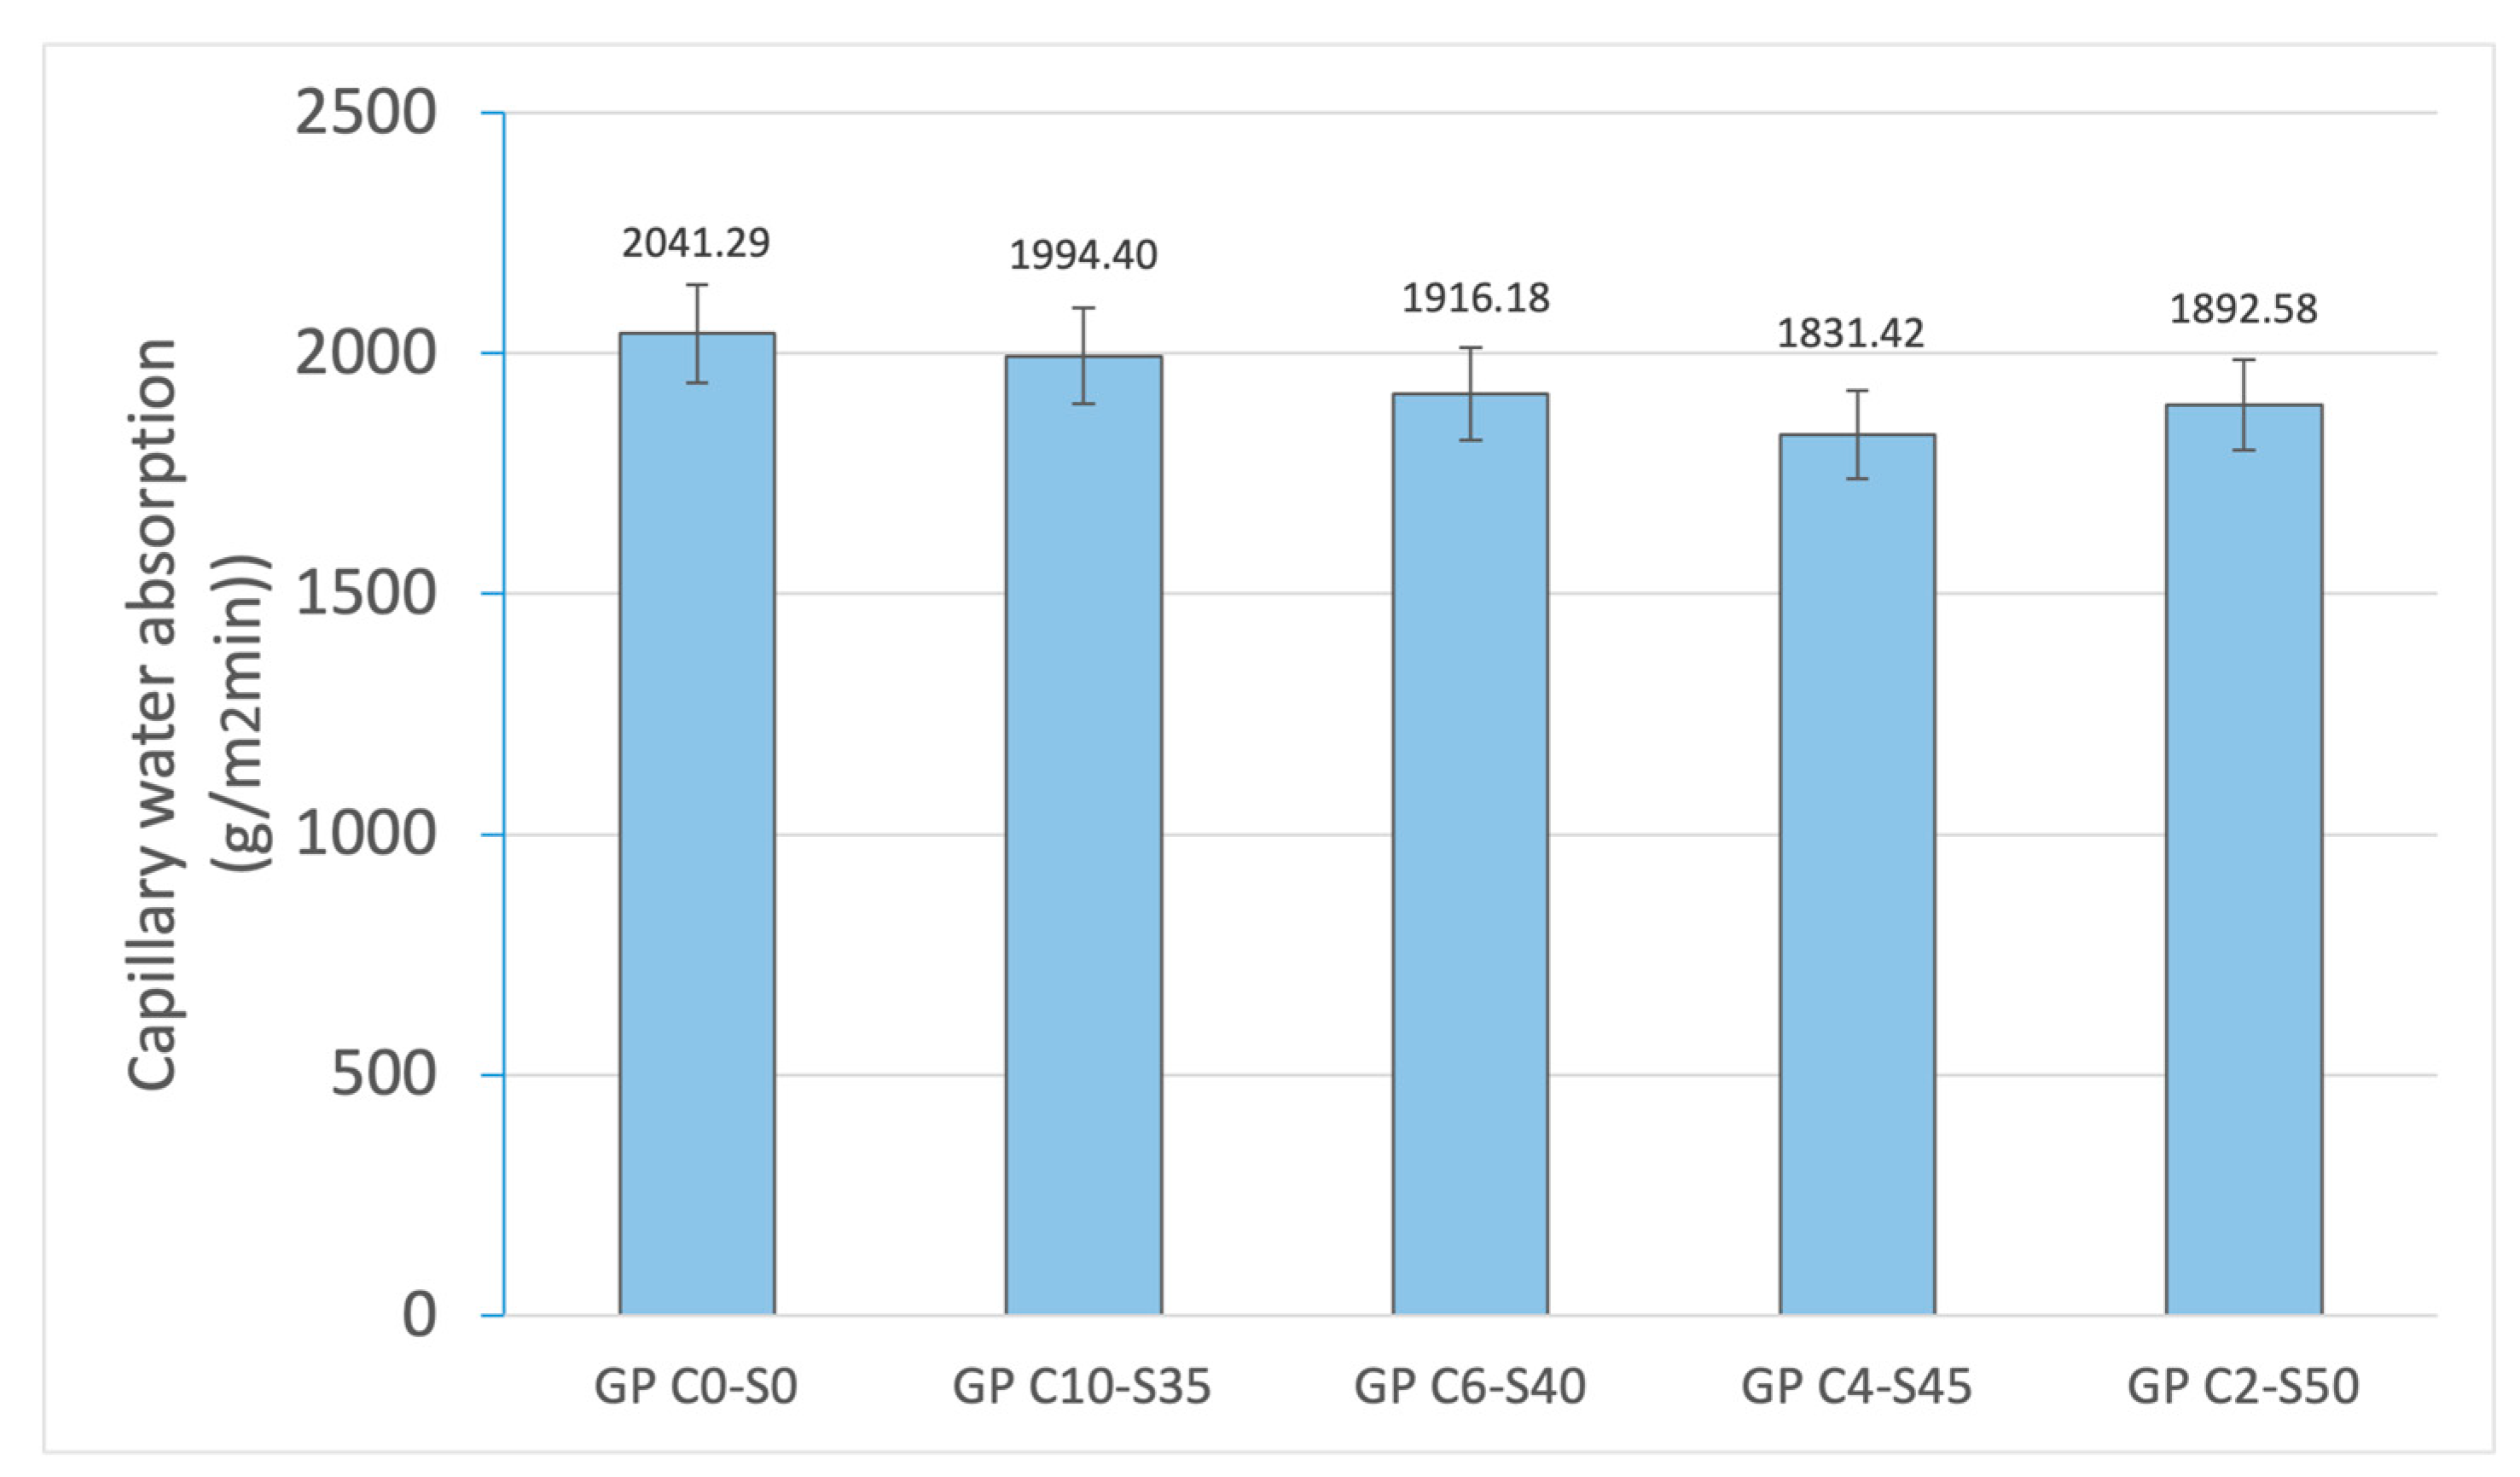
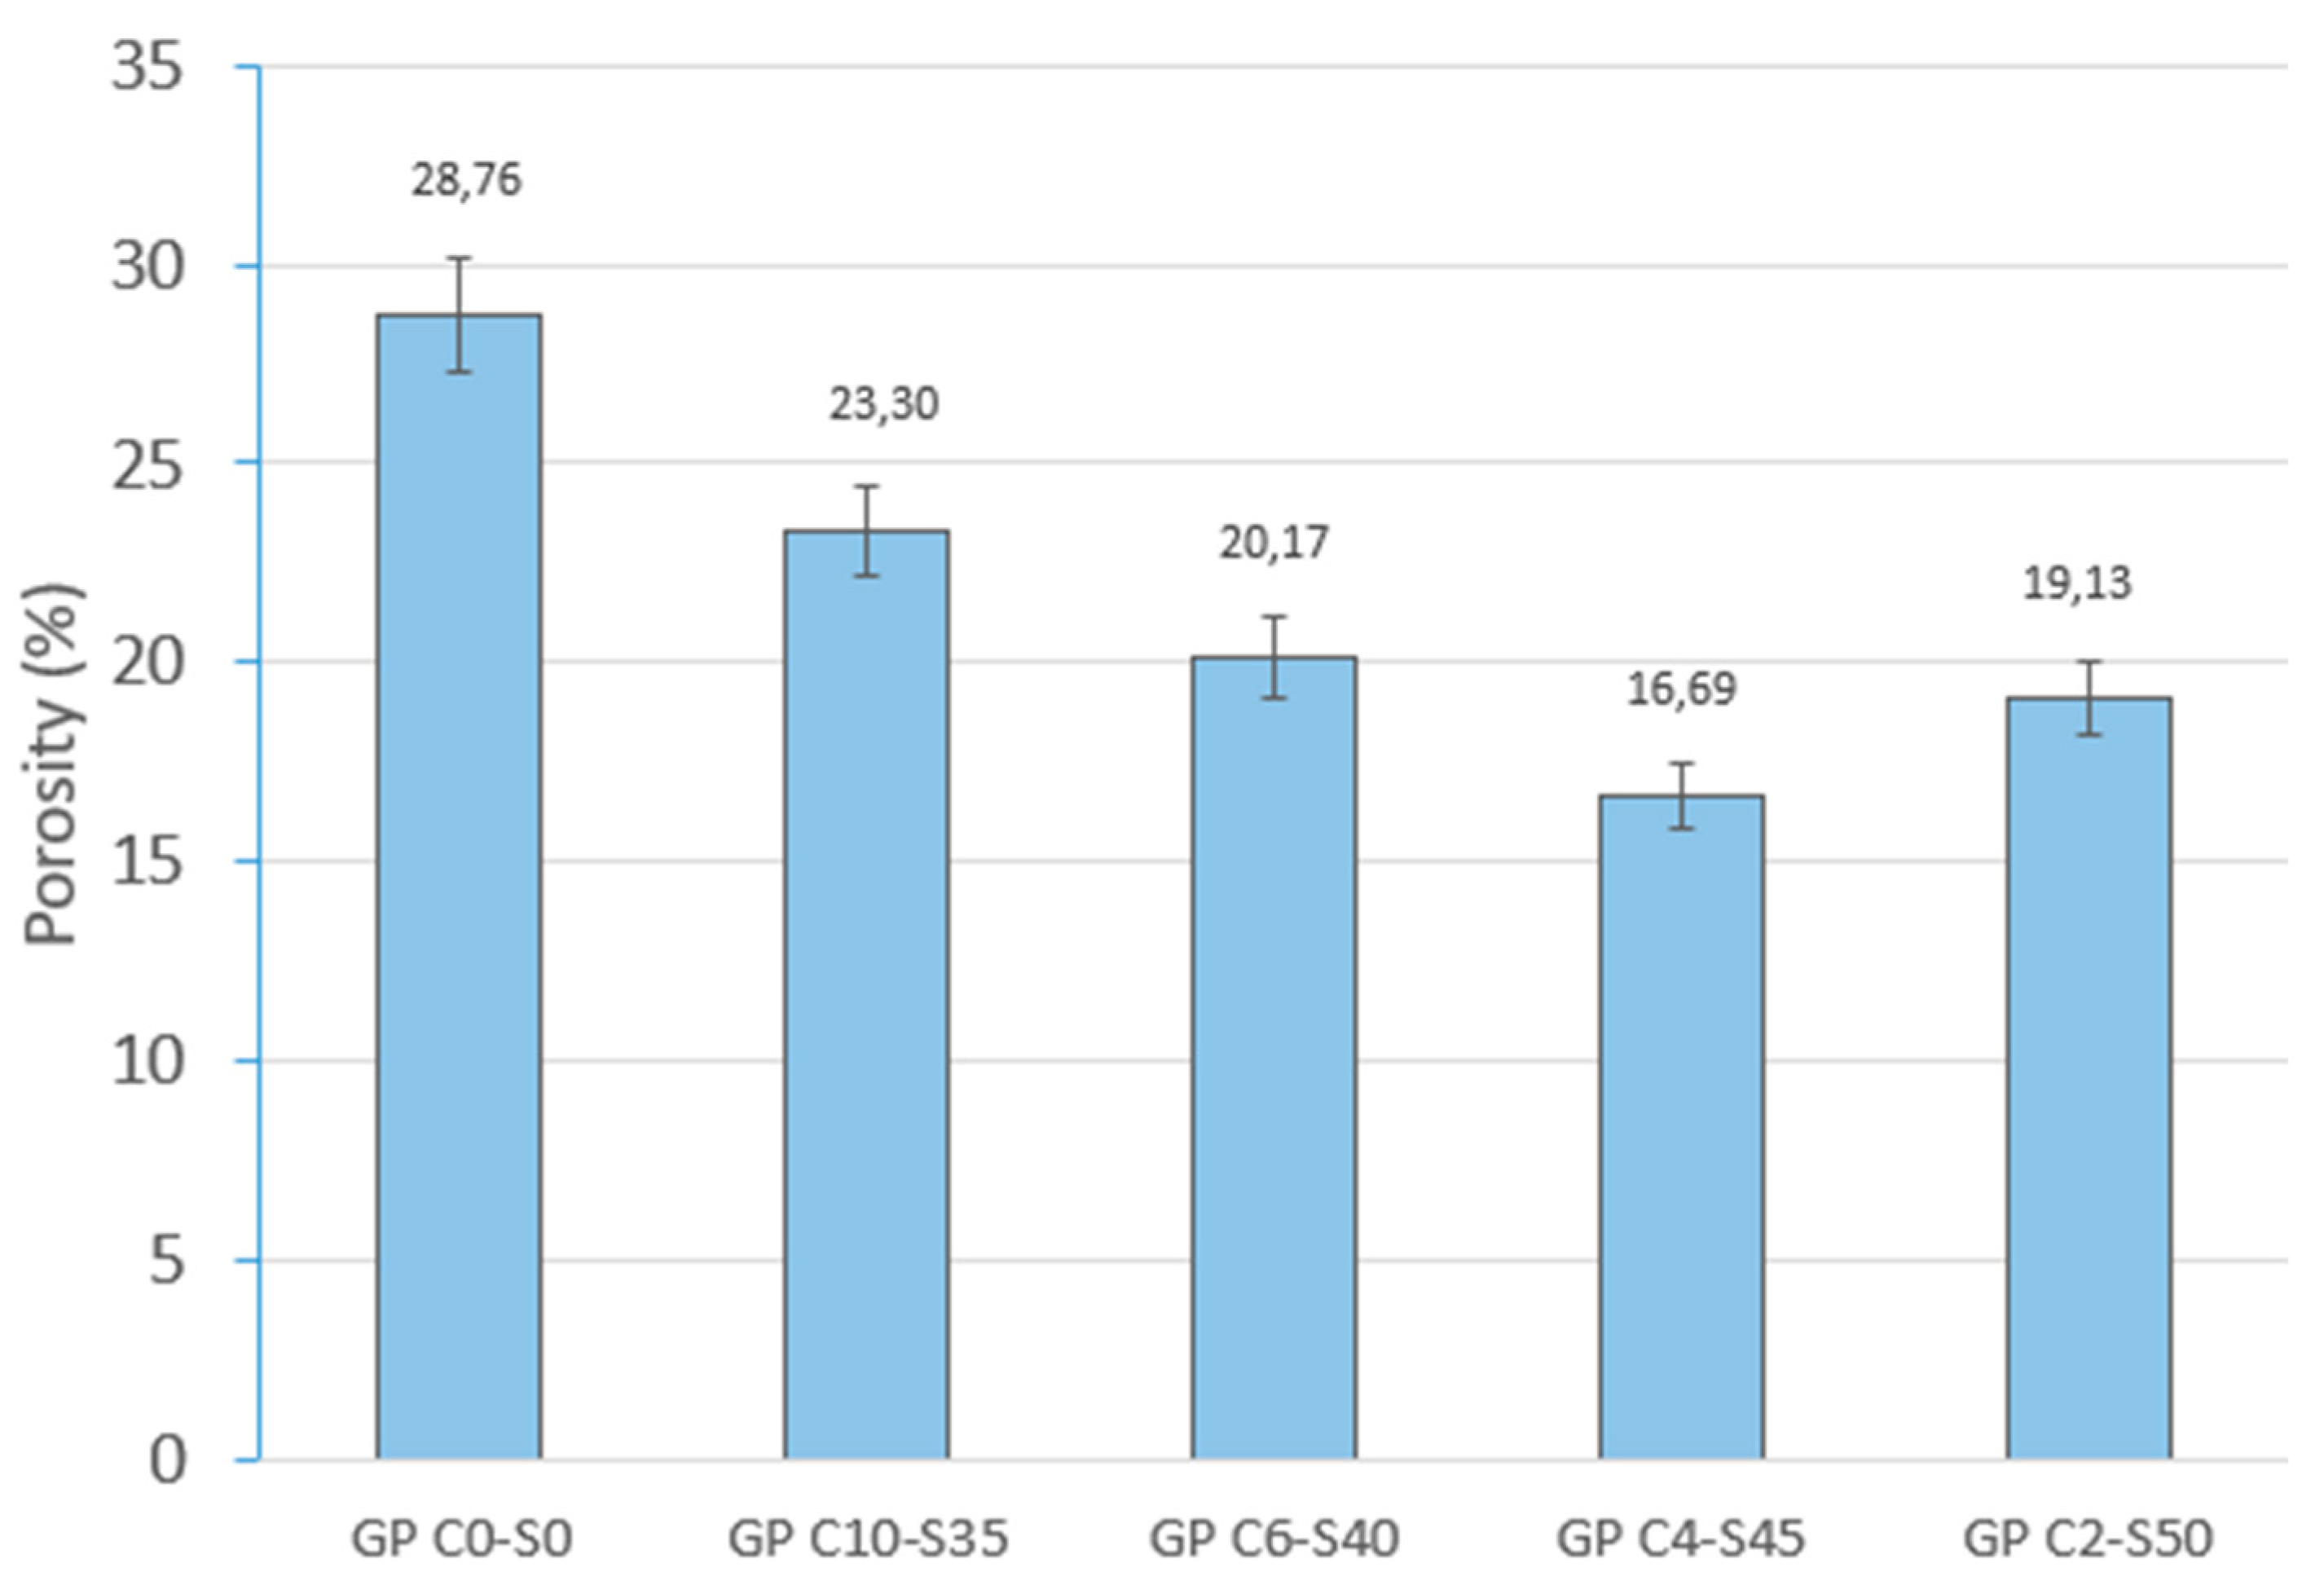
Physical and mechanical tests were carried out to identify phenomena such as linear shrinkage and weight loss, which can occur during the geopolymerization process. Changes in weight and dimensions after curing serve as critical indicators for construction materials and are important considerations in the sustainable reuse of various by-products. Additionally, the effect of water on the novel geopolymer samples was assessed through capillary water absorption and cold-water absorption tests. These standardized tests measured the samples’ ability to absorb water and, consequently, their mass variation. To evaluate the mechanical properties of the geopolymer samples, bulk density, open porosity, and compressive strength tests were conducted for comparison with other construction materials. The methodology applied in this experimental program adhered to the following standards: (i) mass loss (UNE-EN 13581:2003 Standard) [
68]; (ii) linear shrinkage (UNE-EN 13872:2004 Standard) [
69]; (iii) capillary water absorption (UNE-EN 1015-18:2003 Standard) [
70]; (iv) bulk density and open porosity (UNE-EN 1015-10:2000 Standard) [
71]; and (v) compressive strength (UNE-EN 1015-10:2020 Standard) [
72]. Finally, the geopolymer samples were subjected to Fourier transform infrared spectroscopy (FTIR) and scanning electron microscopy (SEM).


 ,
, 


