
Mining and Characterization of Amylosucrase from Calidithermus terrae for Synthesis of α-Arbutin Using Sucrose


Abstract
:1. Introduction
2. Results
2.1. ASase Mining
2.2. Phylogenetic Tree Construction and Sequence Comparison and Analysis
2.3. Construction of Recombinant ASase Plasmids
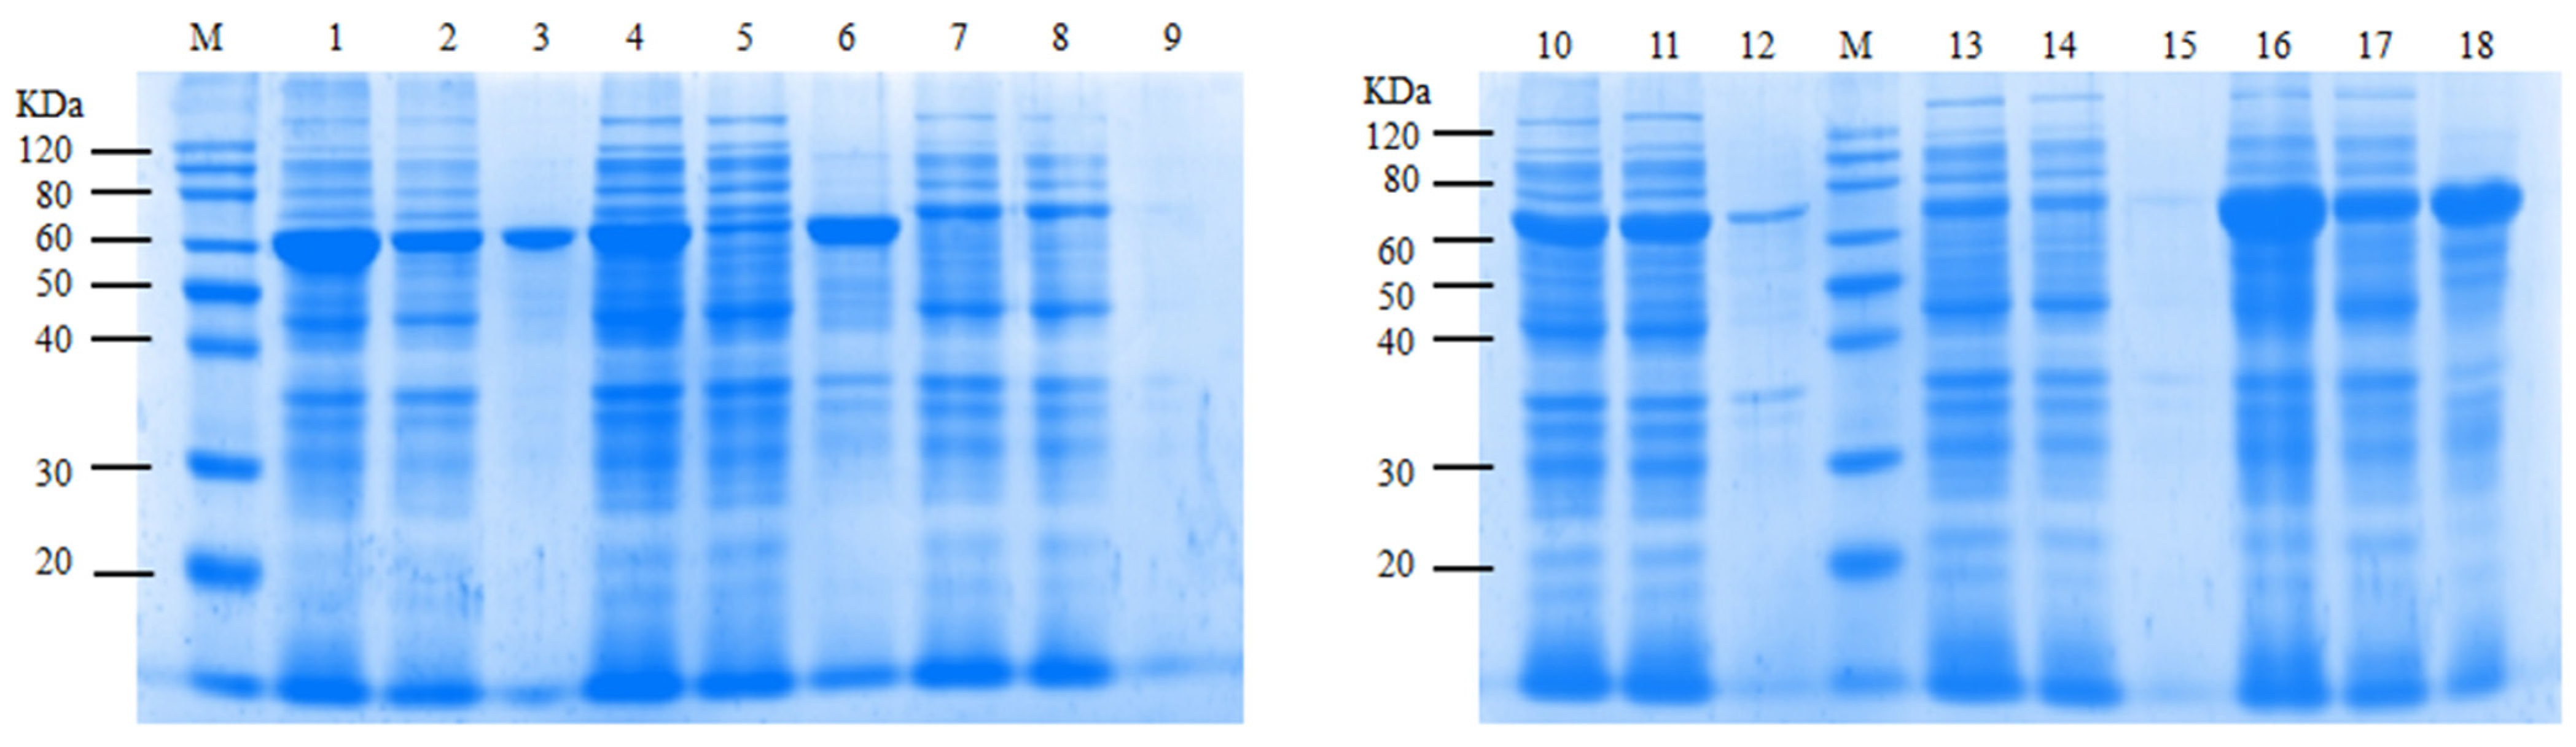
2.4. Induced Expression of ASases
2.5. Screening of ASases for α-Arbutin Enzymatic Synthesis
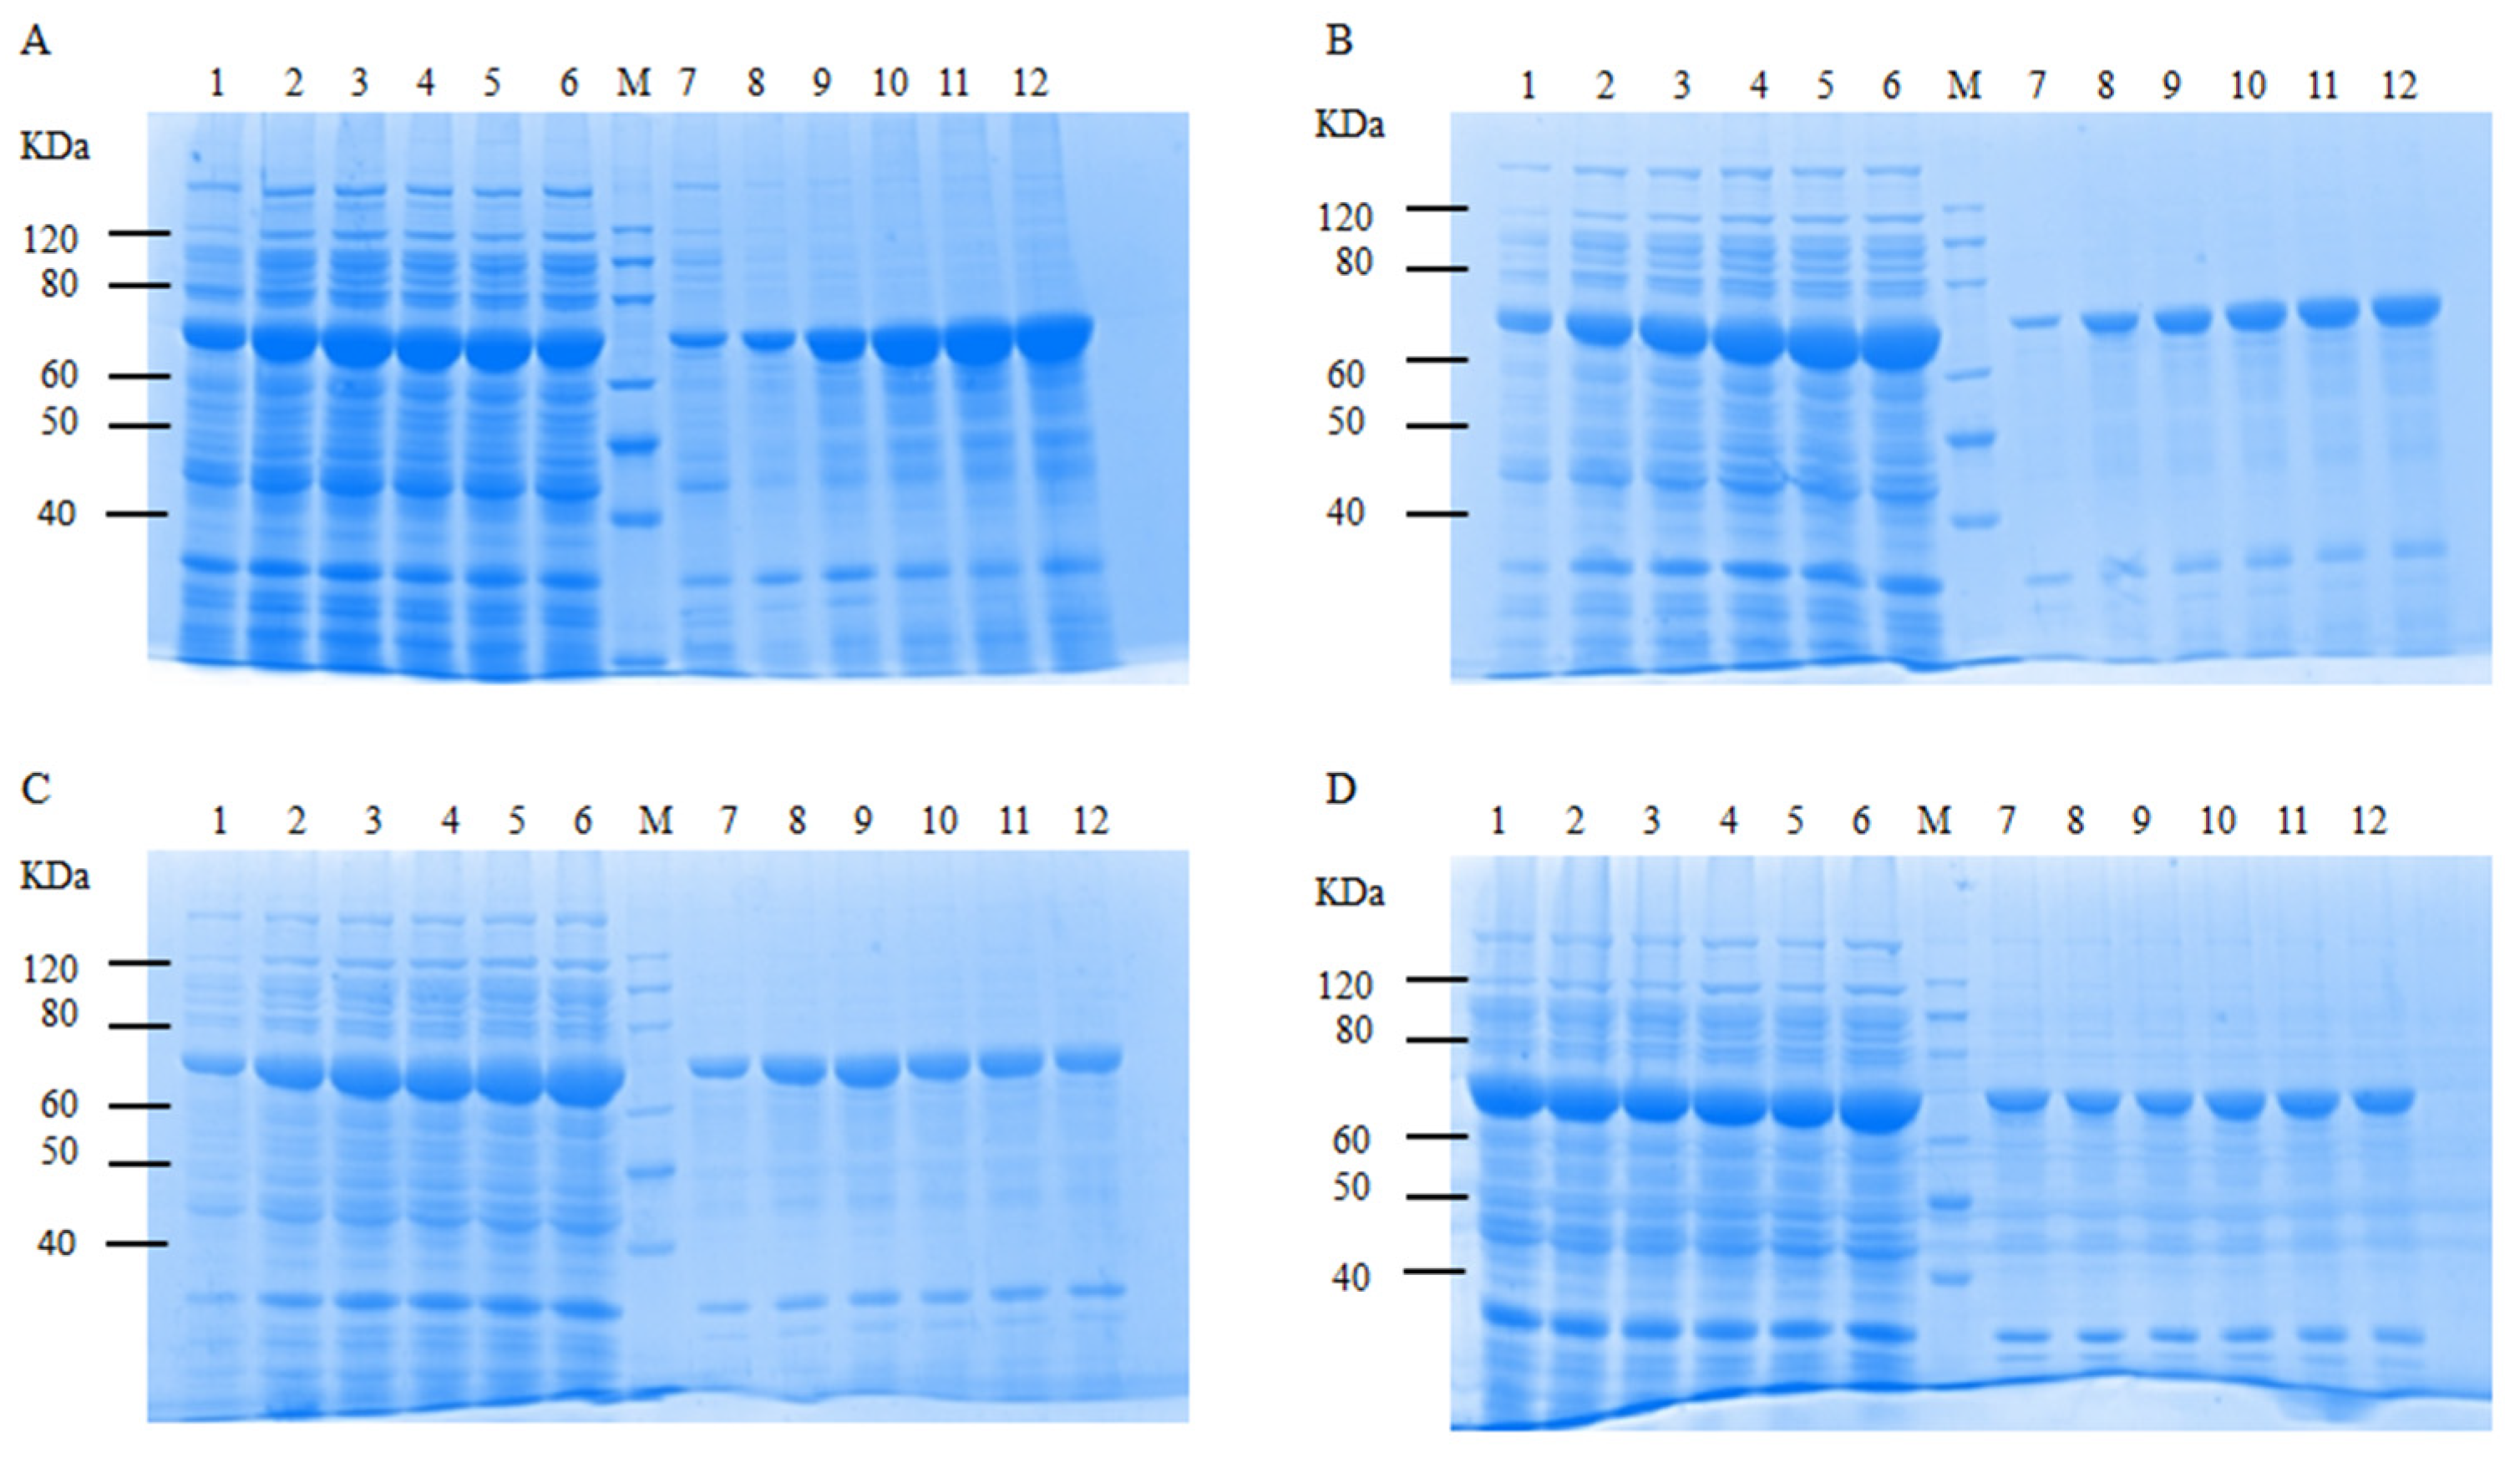
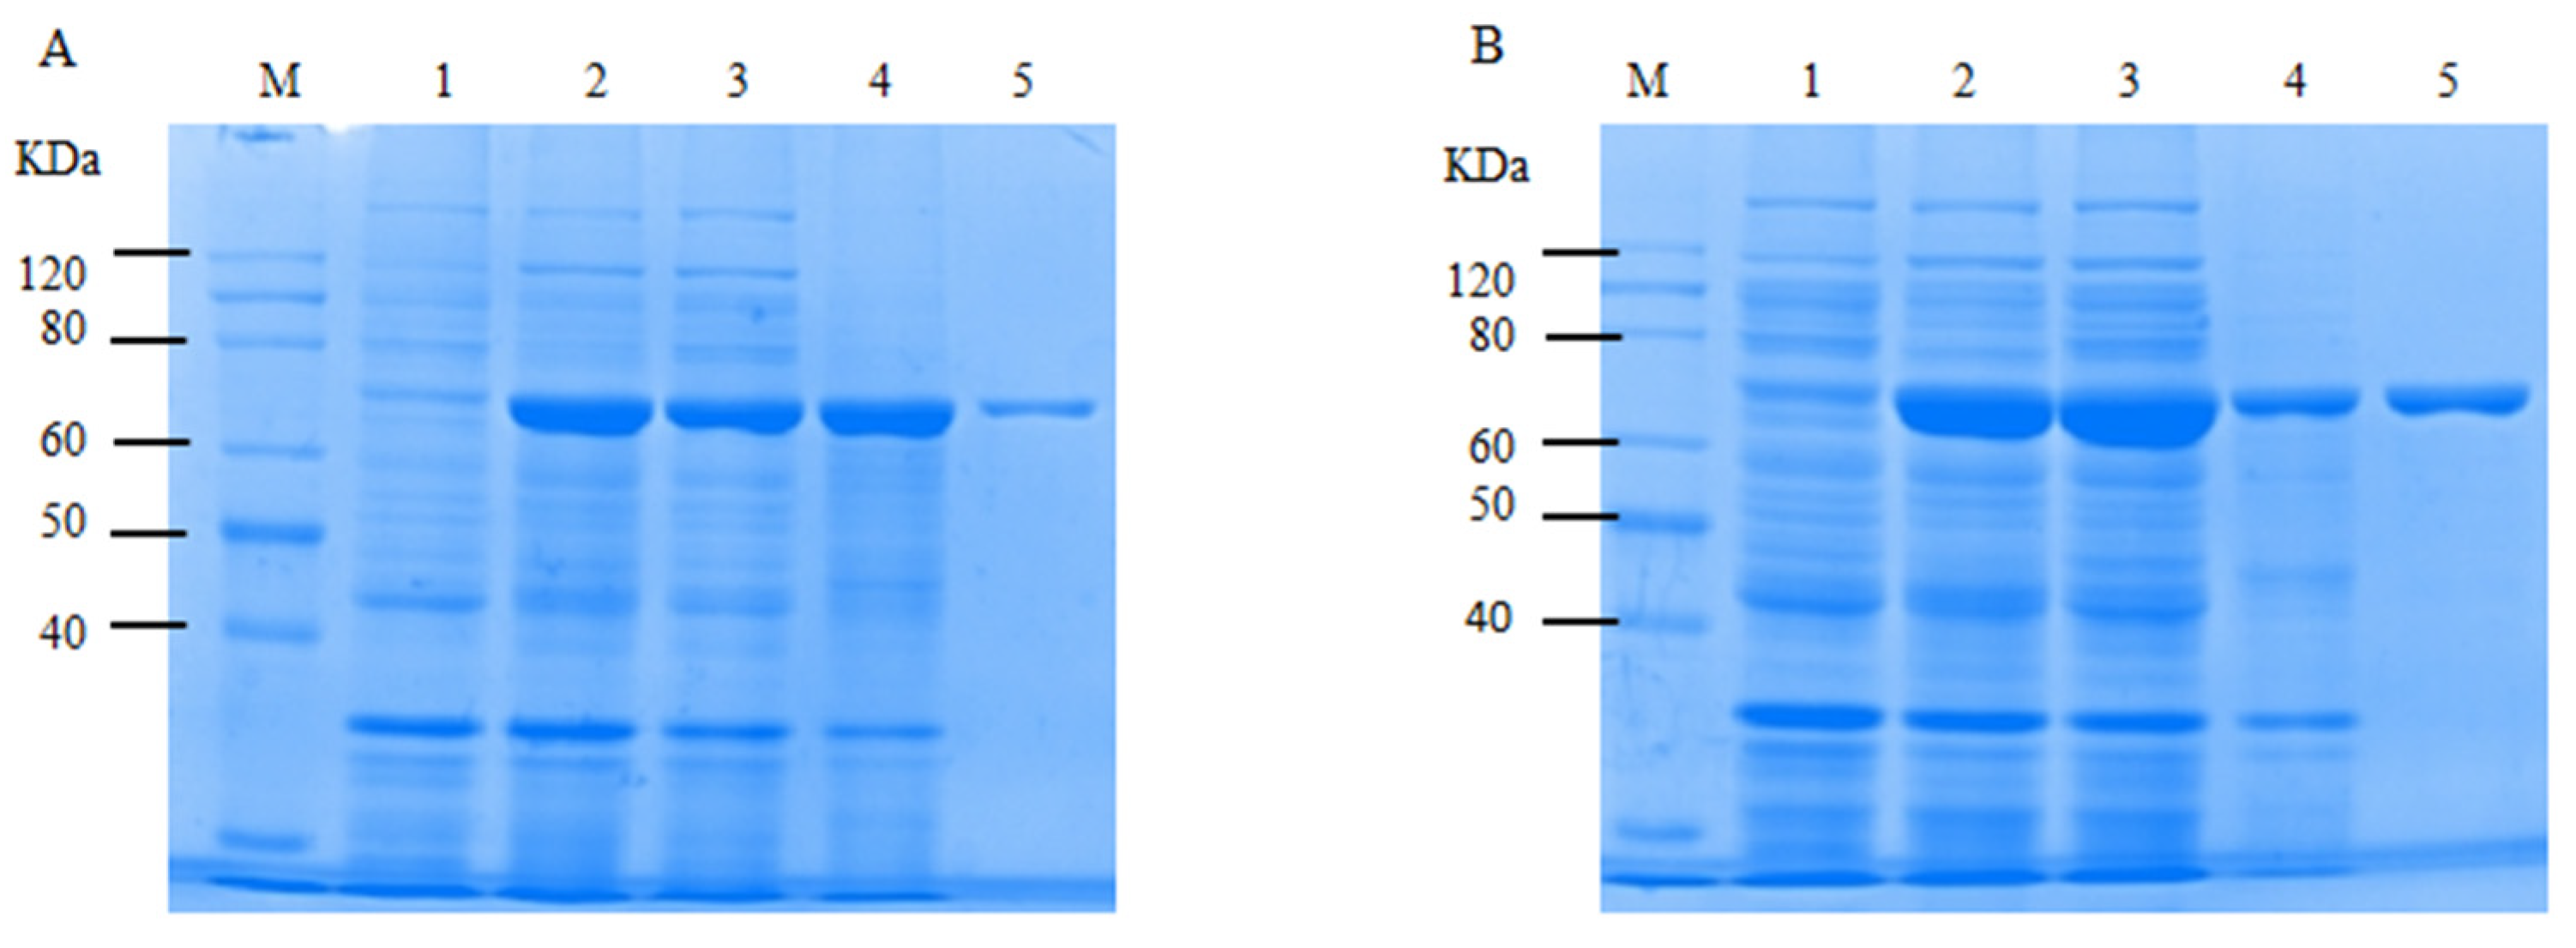
2.6. Optimization of Soluble Expression Conditions for CtAs
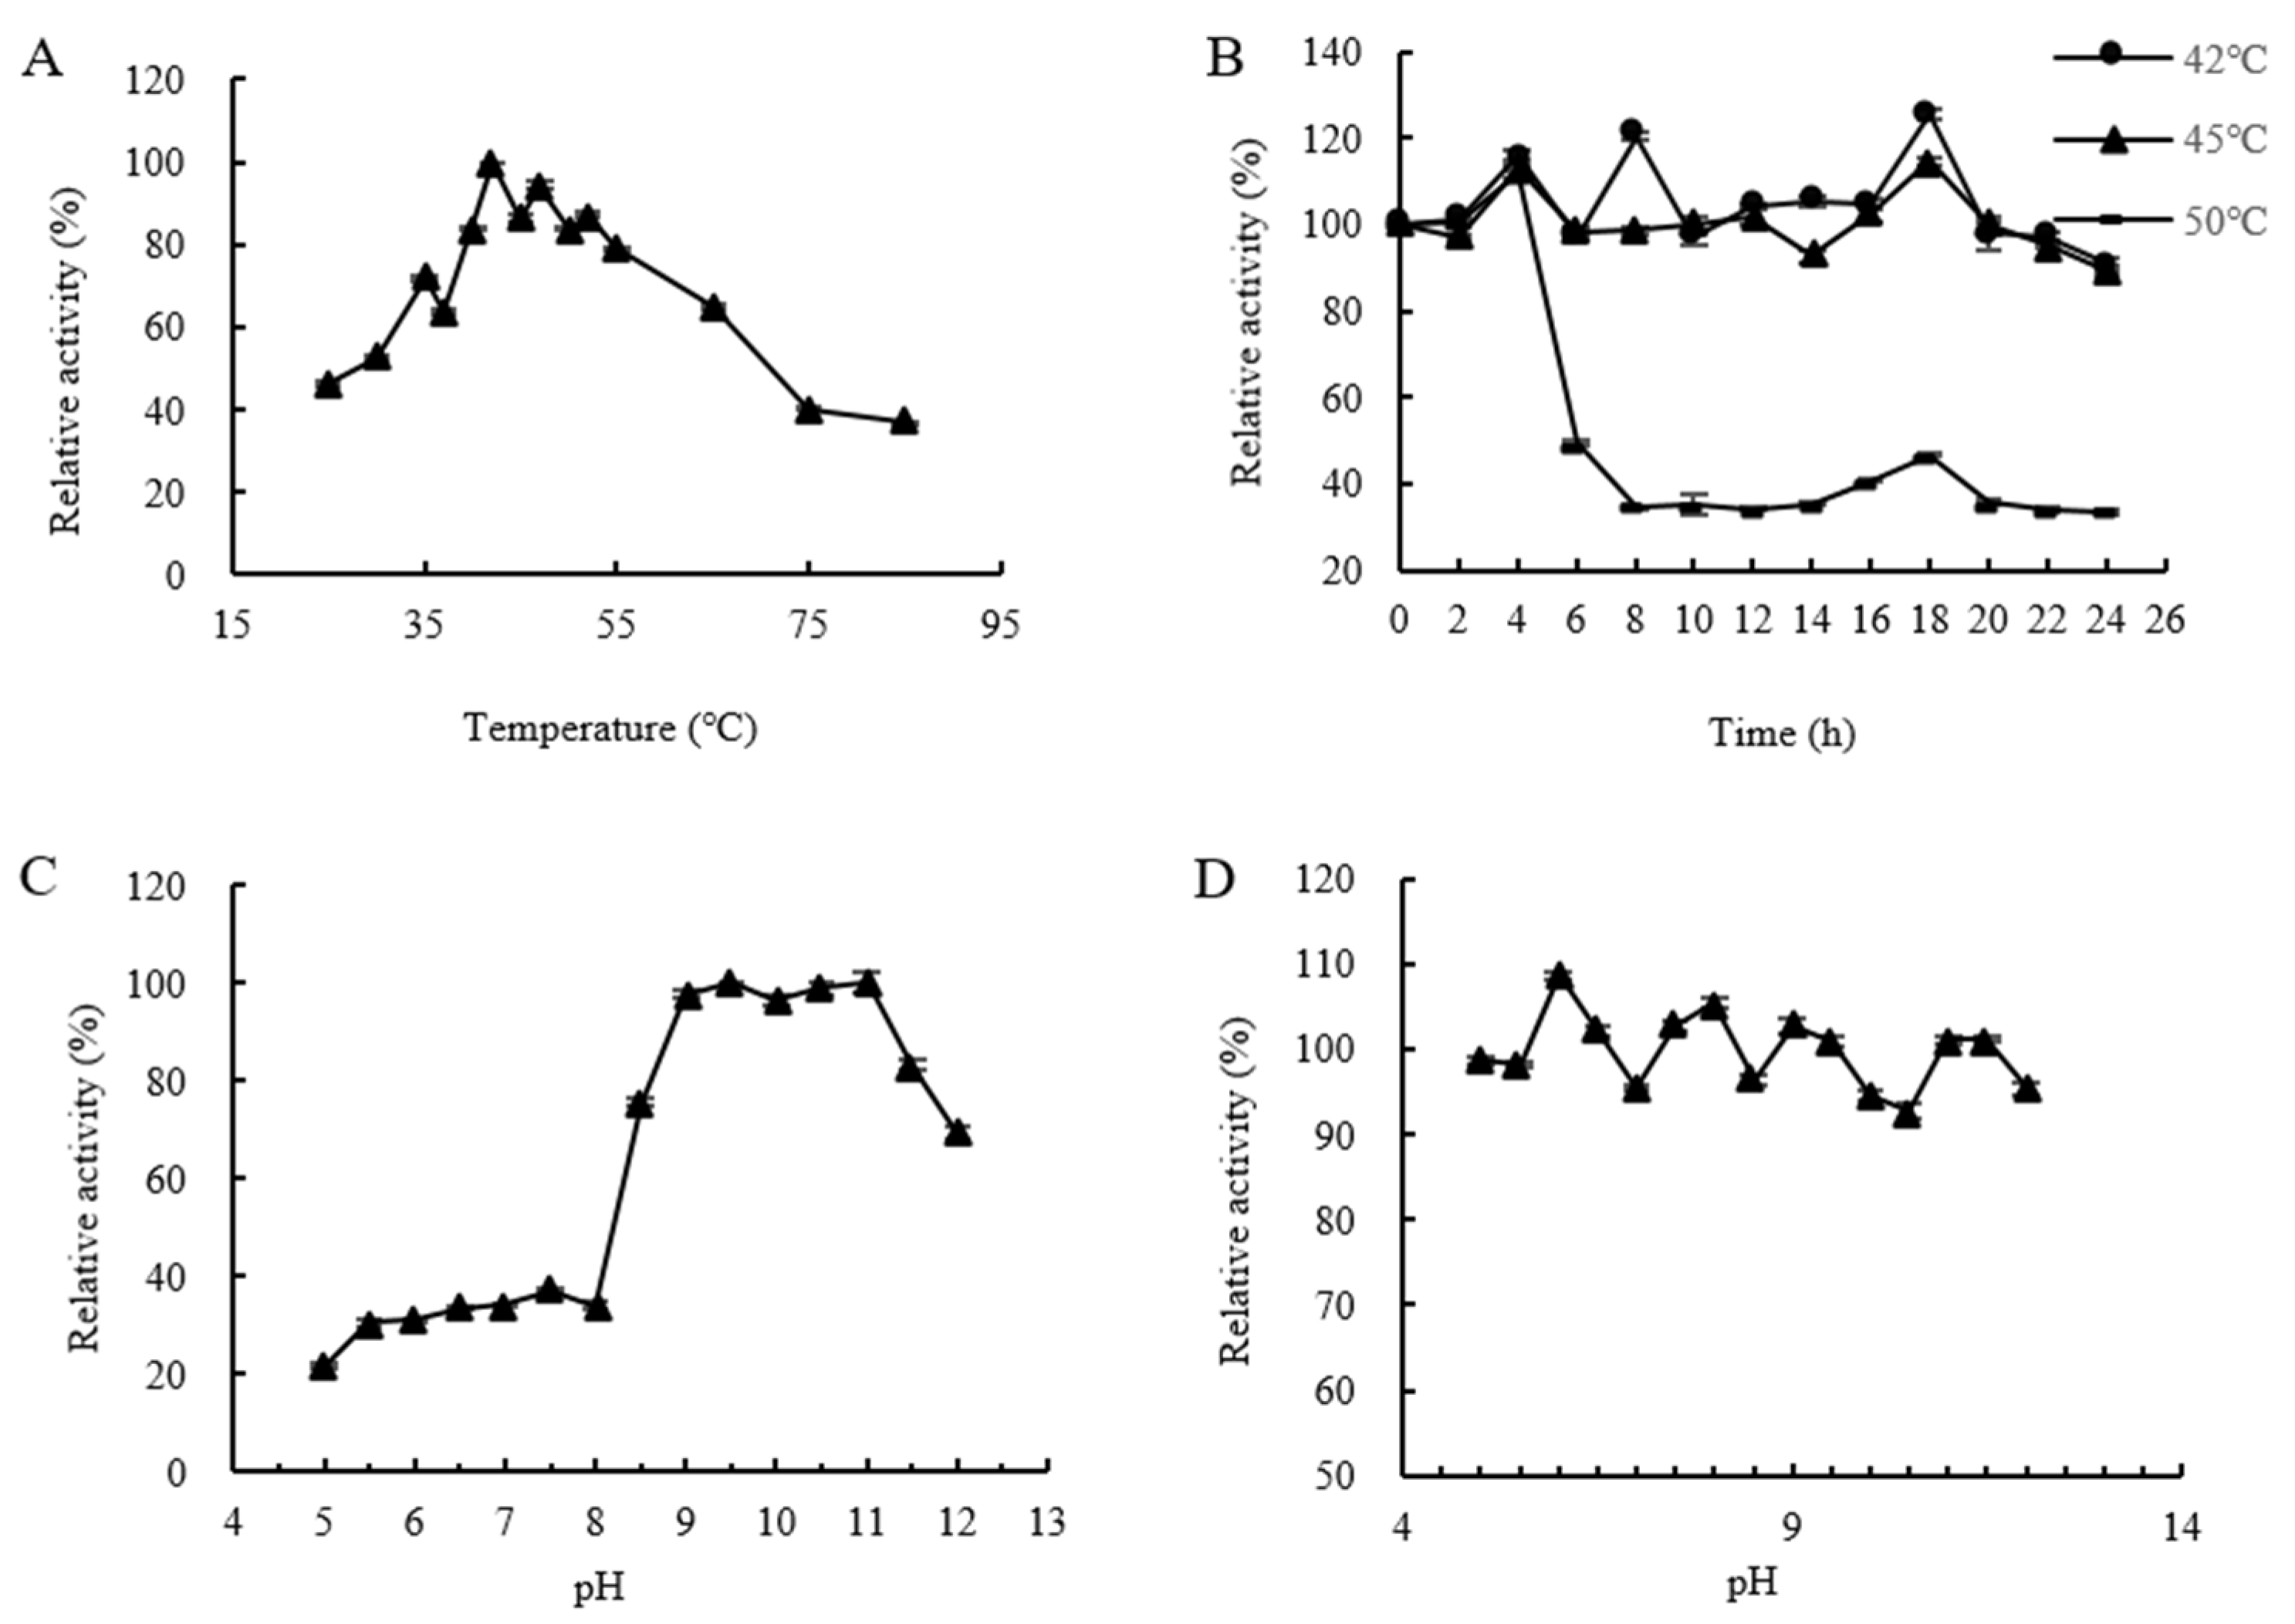
2.7. Analysis of the Enzymatic Properties of CtAs
2.8. Optimization of α-Arbutin Enzymatic Synthesis Conditions
3. Discussion
4. Materials and Methods
4.1. Materials
4.2. Methods
4.2.1. Exploration of ASases
4.2.2. Construction of the Phylogenetic Tree and Sequence Comparison and Analysis
4.2.3. Construction of Recombinant ASase Plasmids
4.2.4. Induced Expression of ASases
4.2.5. Screening of ASases for the Enzymatic Synthesis of α-Arbutin
4.2.6. Optimization of the Soluble Expression Conditions for CtAs
4.2.7. Analysis of Enzymatic Properties
- (1)
- Optimal temperature for CtAs: The reaction system was incubated at different temperatures (25–85 °C) for 10 min, and enzyme activity was measured. The highest enzyme activity was set as 100%, and the relative enzyme activity was calculated to determine the optimal reaction temperature for CtAs.
- (2)
- Thermal stability of CtAs: The enzyme solution was mixed with 100 mmol/L Tris-HCl (pH 7.0) and incubated at 40–50 °C for 0–24 h. Afterward, a 4% sucrose solution was added, and the reaction was carried out at the optimal temperature for 10 min. The remaining enzyme activity was measured, with the untreated enzyme activity set to 100%. The relative enzyme activity was calculated to determine the thermal stability of CtAs.
- (3)
- Optimal pH of CtAs: The reaction system was incubated with 100 mmol/L Tris-HCl buffer at different pH values (5.0–12.0) at the optimal temperature for 10 min, and enzyme activity was measured. The highest enzyme activity was set to 100%, and the relative enzyme activity was calculated to determine the optimal pH for CtAs.
- (4)
- pH stability of CtAs: The enzyme solution was mixed with 100 mmol/L Tris-HCl buffer at different pH values (5.0–12.0) and incubated at 25 °C for 1 h. The reaction was then carried out at the optimal temperature and pH for 10 min, and the remaining enzyme activity was measured. The untreated enzyme activity was set to 100%, and the relative enzyme activity was calculated to determine the pH stability of CtAs.
- (5)
- Metal ion and organic solvent stability of CtAs: The reaction system was supplemented with metal ions and reagents (Na+, K+, Mg2+, Ca2+, Zn2+, Ba2+, Mn2+, Ni2+, Cu2+, Fe2+, EDTA, and SDS) at final concentrations of 0.2, 1, 5, or 10 mmol/L, or organic solvents (methanol, ethanol, n-butanol, acetonitrile, and dimethyl sulfoxide) at final concentrations of 1%, 5%, 10%, or 20%. The reaction was carried out at the optimal temperature and pH for 10 min, and enzyme activity was measured. The enzyme activity in a system without metal ions or organic solvents was set to 100%, and the relative enzyme activity was calculated to determine the effects of metal ions and organic solvents on CtAs activity.
- (6)
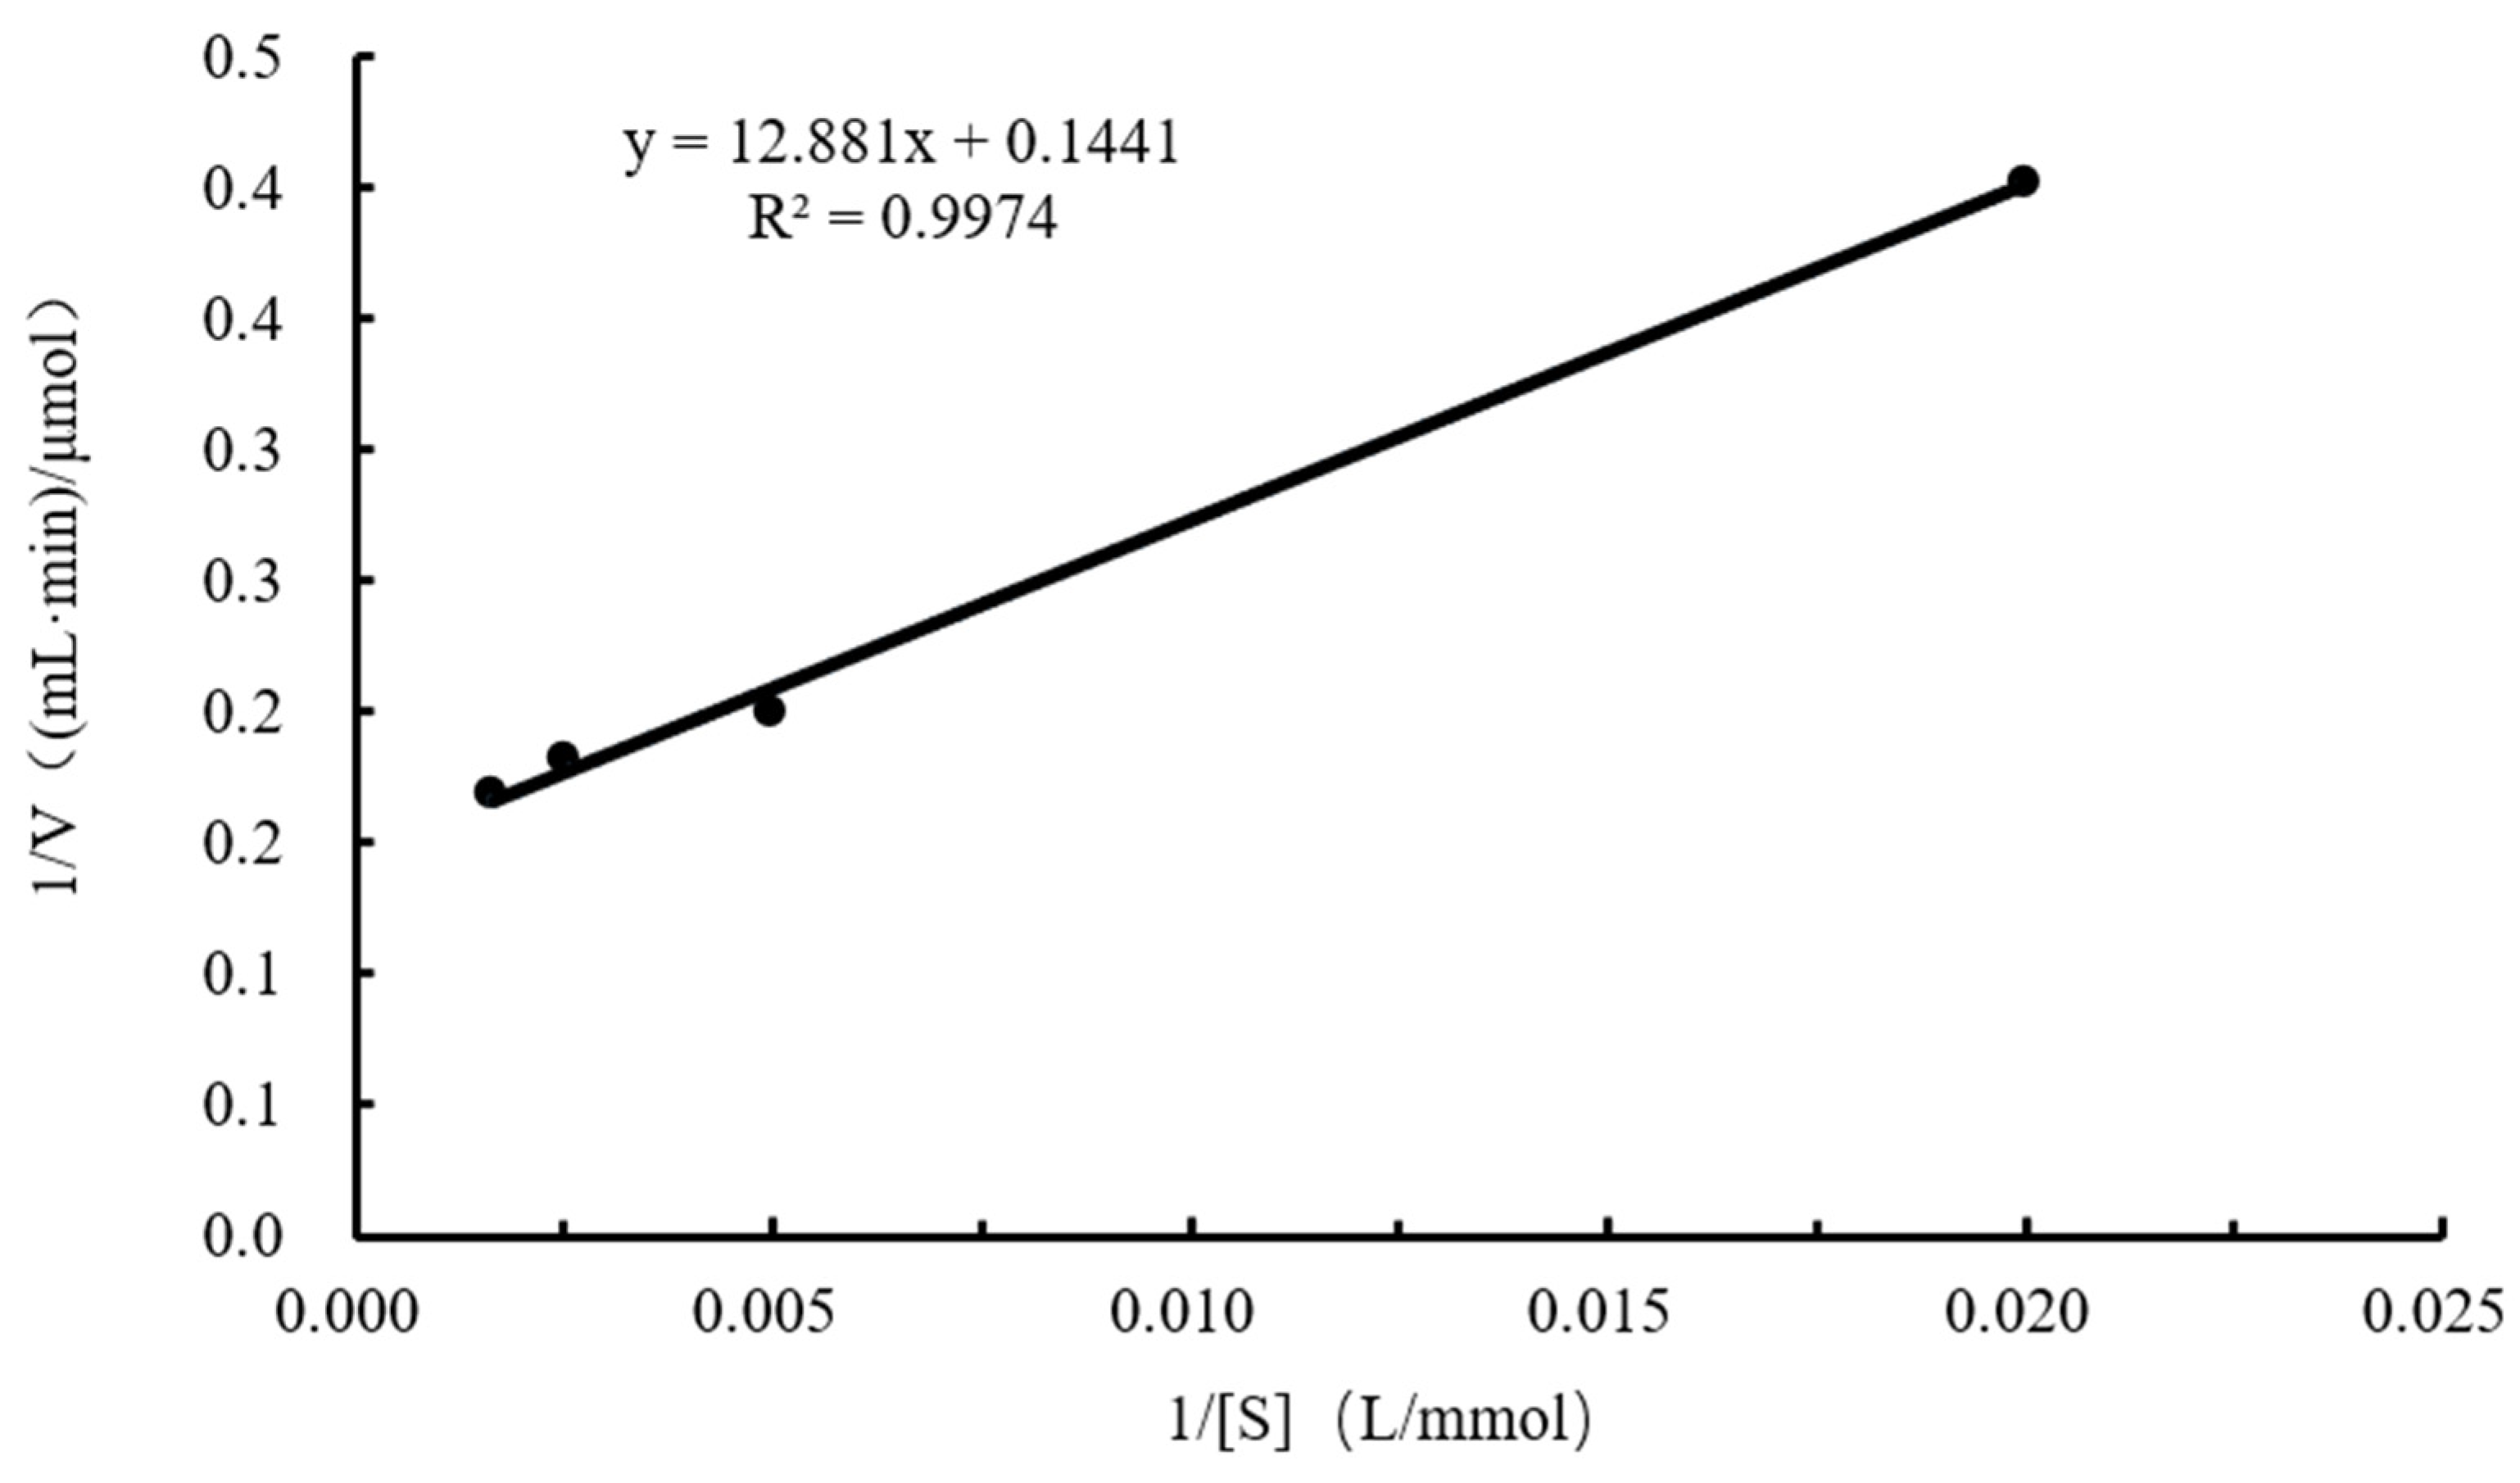
- Kinetic parameters: Different concentrations of the sucrose solution (0.05, 0.2, 0.4, and 0.6 mol/L) were prepared in 100 mmol/L Tris-HCl buffer (pH 7.0) and added to the reaction system. Enzyme activity was measured at the optimal temperature and pH for each substrate concentration. The Lineweaver–Burk plot was used to calculate the kinetic parameters Kcat, Km, and Kcat/Km. The reciprocal of the sucrose concentration was used as the abscissa, and the reciprocal of enzyme activity was plotted as the ordinate.The calculation formula is as follows:
- (7)
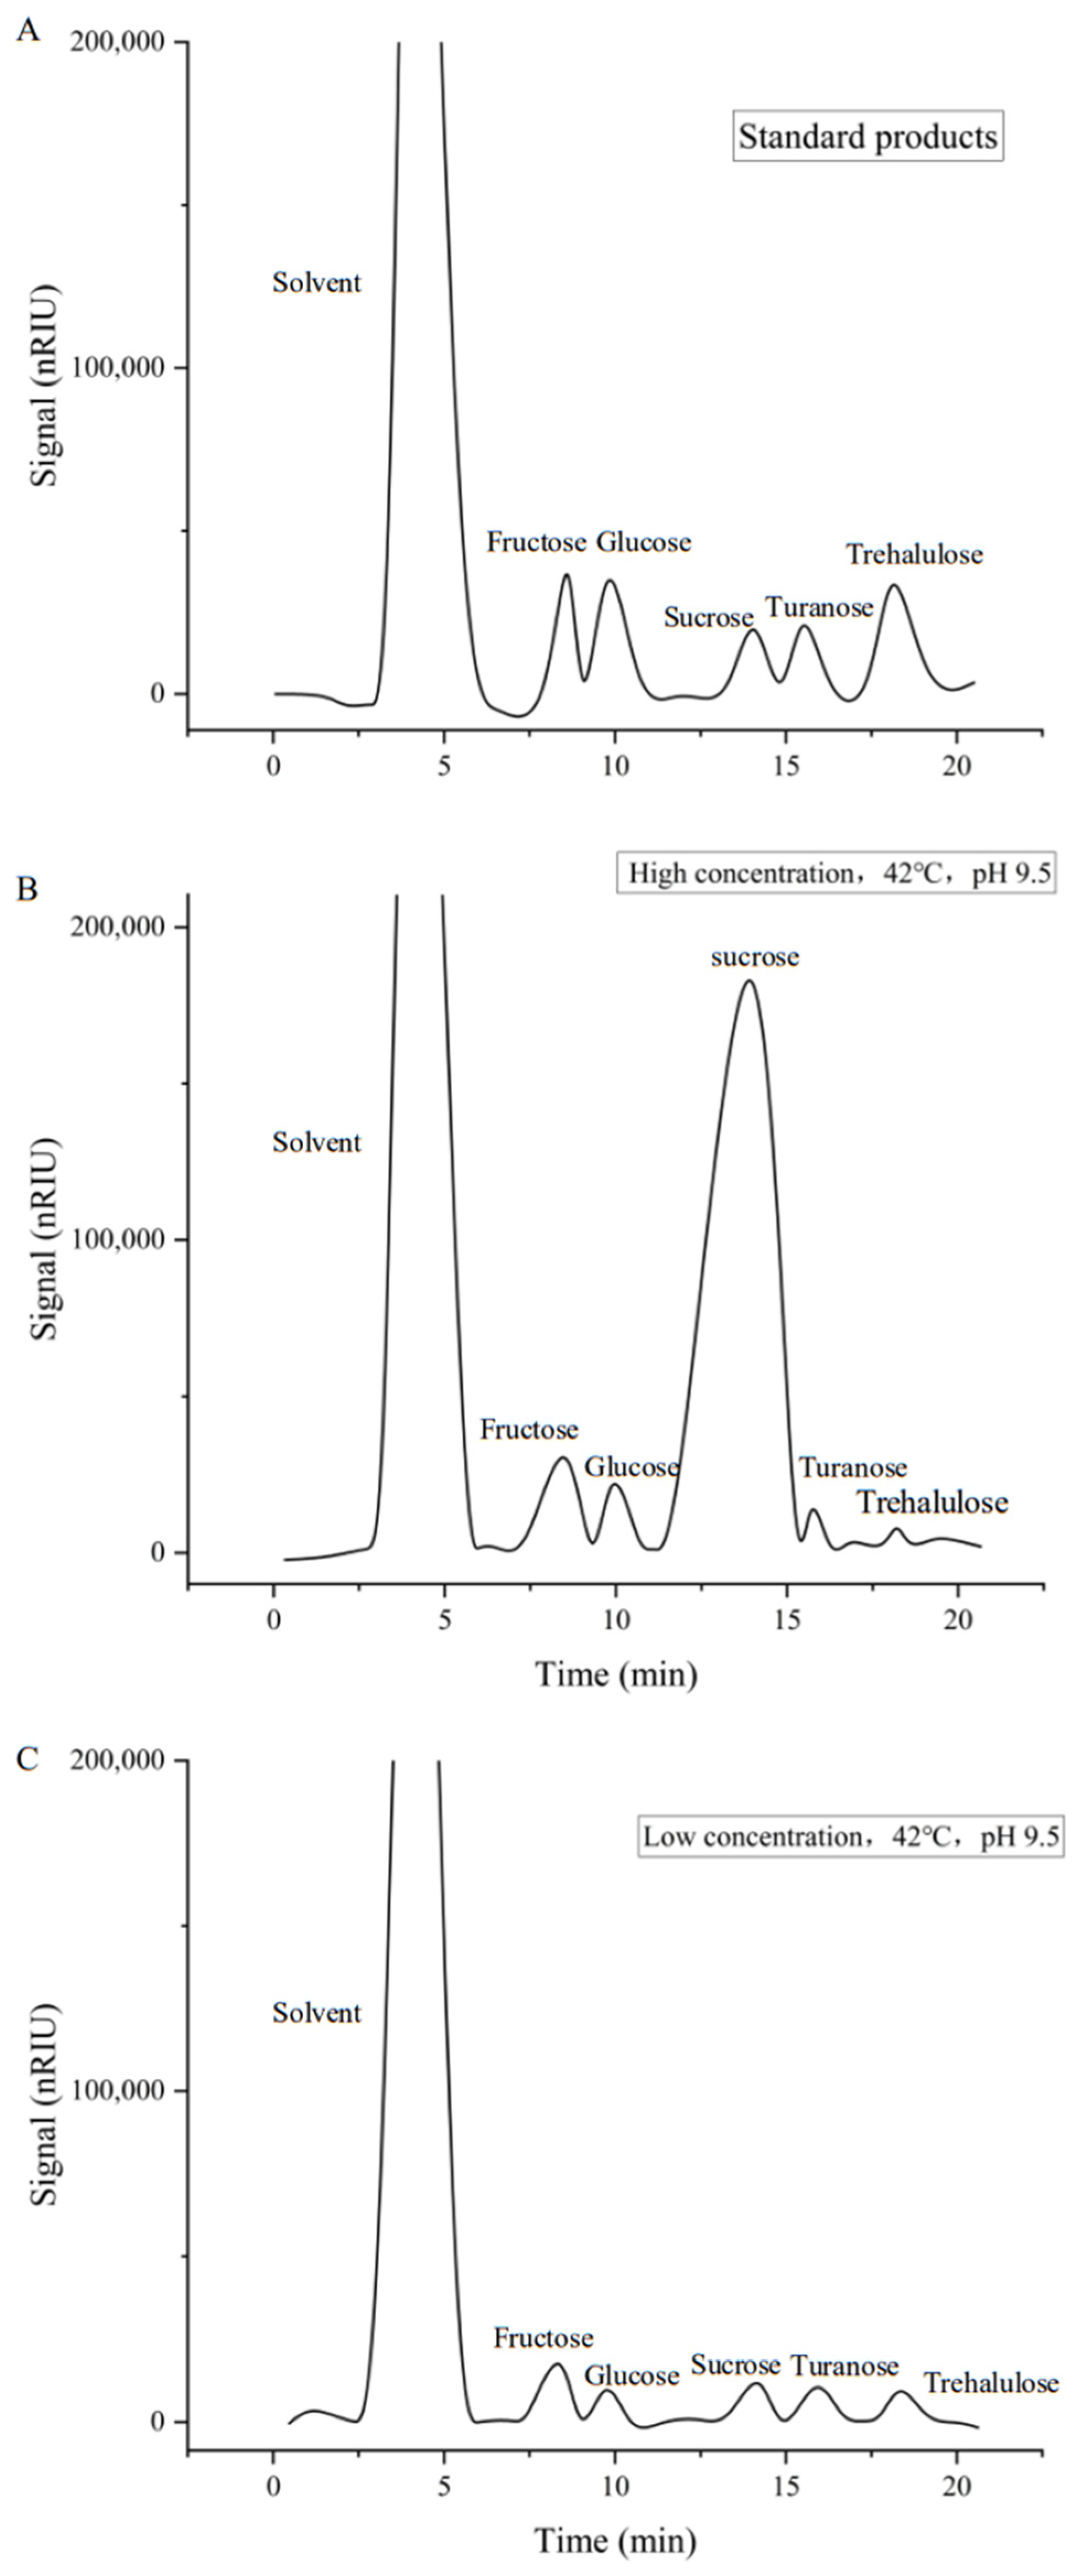
- Enzyme reaction proportion: The reaction system (low sucrose concentration of 89.39 mmol/L and high sucrose concentration of 893.90 mmol/L) was incubated at the optimal temperature and pH for 2 h. The reaction was terminated by boiling for 5 min, centrifuged at 12,000 r/min for 20 min at 4 °C, and filtered through a 0.22 μm microporous membrane. The products were analyzed using HPLC. Using the method of Huang Liangjiang et al. [45,46,47], the HPLC conditions were as follows: Agilent 1200 HPLC (Agilent Technologies, Waldbronn, Germany), ZORBAX NH2 column (5 μm, 4.60 mm × 250 mm), RID detector, mobile phase of 80% acetonitrile and 20% water, flow rate of 1 mL/min, column temperature of 35 °C, detector chamber of 40 °C, room temperature of 30 °C, and manual injection volume of 20 μL. Standard solutions of fructose, glucose, sucrose, maltose, and trehalose (10 mg/mL) were prepared. Based on the peak area results, the percentage of each reaction type was calculated relative to the total peak area, and the catalytic properties of ASases were analyzed.
4.2.8. Optimization of α-Arbutin Enzymatic Synthesis Conditions
- (1)
- Reaction temperature: The reaction was carried out with 5 mmol/L hydroquinone and 20 mmol/L sucrose as substrates (prepared in phosphate buffer, pH 7.0), with 100 μL of the purified enzyme solution and phosphate buffer to make up 1 mL. The reaction was performed in the dark at 25, 30, 35, 40, 42, and 45 °C for 2 h. Other procedures followed those described in Section 4.2.8.
- (2)
- Reaction pH: The reaction was carried out with 5 mmol/L hydroquinone and 20 mmol/L sucrose as substrates (prepared in phosphate buffer at pH 5.0, 6.0, 7.0, 8.0, 9.0, or 10.0), with 100 μL of the purified enzyme solution and phosphate buffer to make up 1 mL. The reaction was performed in the dark at 25 °C for 2 h. Other procedures followed those described in Section 4.2.8.
- (3)
- Final hydroquinone concentration: The reaction was carried out with final hydroquinone concentrations of 2, 4, 5, 6, 8, or 10 mmol/L and 20 mmol/L sucrose as the substrate (prepared in phosphate buffer, pH 5.0), with 100 μL of the purified enzyme solution and phosphate buffer to make up 1 mL. The reaction was performed in the dark at 25 °C for 2 h. Other procedures followed those described in Section 4.2.8. Since the hydroquinone concentration was the variable in this optimization, α-arbutin yield was used as the comparison metric instead of the molar yield or hydroquinone conversion rate.
- (4)
- Final sucrose concentration: The reaction was carried out with 6 mmol/L hydroquinone and sucrose at final concentrations of 6, 18, 30, 42, or 54 mmol/L (prepared in phosphate buffer, pH 5.0), with sucrose-to-hydroquinone ratios of 1:1, 3:1, 4:1, 5:1, 7:1, or 9:1. A total of 100 μL purified enzyme solution and phosphate buffer were added to make up 1 mL. The reaction was performed in the dark at 25 °C for 2 h. Other procedures followed those described in Section 4.2.8.
- (5)
- Reaction time: The reaction was carried out with 6 mmol/L hydroquinone and 42 mmol/L sucrose as substrates (prepared in phosphate buffer, pH 5.0), with 100 μL of the purified enzyme solution and phosphate buffer to make up 1 mL. The reaction was performed in the dark at 25 °C for 2, 4, 6, 8, 10, and 12 h. Other procedures followed those described in Section 4.2.8.
- (6)
- Enzyme dose: The reaction was carried out with 6 mmol/L hydroquinone and 42 mmol/L sucrose as substrates (prepared in phosphate buffer, pH 5.0), with the enzyme solution added at a volume of 50, 100, 150, or 200 μL. Phosphate buffer was added to make up 1 mL, and the reaction was performed in the dark at 25 °C for 6 h. Other procedures followed those described in Section 4.2.8.
- (7)
- Addition of Vc: The reaction was carried out with 6 mmol/L hydroquinone and 42 mmol/L sucrose as substrates (prepared in phosphate buffer, pH 5.0), with 200 μL of the purified enzyme solution and phosphate buffer to make up 1 mL. Ascorbic acid (Vc) was added at a final concentration of 0, 0.1, 0.2, 0.3, 0.4, or 0.5 mmol/L. The reaction was performed in the dark at 25 °C for 6 h. The rest of the procedure followed that described in Section 4.2.8.
5. Conclusions
Author Contributions
Funding
Institutional Review Board Statement
Informed Consent Statement
Data Availability Statement
Conflicts of Interest
References
- de Montalk, G.P.; Remaud-Simeon, M.; Willemot, R.-M.; Sarçabal, P.; Planchot, V.; Monsan, P. Amylosucrase from Neisseria polysaccharea: Novel catalytic properties. FEBS Lett. 2000, 471, 219–223. [Google Scholar] [CrossRef] [PubMed]
- Agarwal, N.; Narnoliya, L.K.; Singh, S.P. Characterization of a novel amylosucrase gene from the metagenome of a thermal aquatic habitat, and its use in turanose production from sucrose biomass. Enzym. Microb. Technol. 2019, 131, 109372. [Google Scholar] [CrossRef]
- Seo, D.H.; Jung, J.H.; Jung, D.H.; Park, S.; Yoo, S.-H.; Kim, Y.-R.; Park, C.-S. An unusual chimeric amylosucrase generated by domain-swapping mutagenesis. Enzym. Microb. Technol. 2016, 86, 7–16. [Google Scholar] [CrossRef]
- Skov, L.K.; Mirza, O.; Henriksen, A.; De Montalk, G.P.; Remaud-Simeon, M.; Sarçabal, P.; Willemot, R.M.; Monsan, P.; Gajhede, M. Amylosucrase, a glucan-synthesizing enzyme from the α-amylase family. J. Biol. Chem. 2001, 276, 25273–25278. [Google Scholar] [CrossRef]
- Hehre, E.J.; Hamilton, D.M. The conversion of sucrose to a polysaccharide of the starch-glycogen class by Neisseria from the pharynx. J. Bacteriol. 1948, 55, 197–208. [Google Scholar] [CrossRef] [PubMed]
- Tian, Y.; Xu, W.; Zhang, W.; Zhang, T.; Guang, C.; Mu, W. Amylosucrase as a transglucosylation tool: From molecular features to bioengineering applications. Biotechnol. Adv. 2018, 36, 1540–1552. [Google Scholar] [CrossRef] [PubMed]
- Liu, X.T.; Wang, X.X. Research progress on the pharmacological action and mechanism of arbutin. Food Ferment. Ind. 2022, 48, 309–316. [Google Scholar]
- Cho, J.Y.; Park, K.Y.; Lee, K.H.; Lee, H.J.; Lee, S.-H.; Cho, J.A.; Kim, W.-S.; Shin, S.-C.; Park, K.-H.; Moon, J.-H. Recovery of arbutin in high purity from fruit peels of pear (Pyrus pyrifolia Nakai). Food Sci. Biotechnol. 2011, 20, 801–807. [Google Scholar] [CrossRef]
- Lukas, B.; Schmiderer, C.; Mitteregger, U.; Novak, J. Arbutin in marjoram and oregano. Food Chem. 2010, 121, 185–190. [Google Scholar] [CrossRef]
- Carmen PO, P.; Vlase, L.; Tamas, M. Natural resources containing arbutin. Determination of arbutin in the leaves of Bergenia crassifolia (L.) Fritsch. acclimated in Romania. Not. Bot. Horti Agrobot. Cluj-Napoca 2009, 37, 129–132. [Google Scholar]
- Sugimoto, K.; Nishimura, T.; Nomura, K.; Sugimoto, K.; Kuriki, T. Syntheses of arbutin-alpha-glycosides and a comparison of their inhibitory effects with those of alpha-arbutin and arbutin on human tyrosinase. Chem. Pharm. Bull. 2003, 51, 798–801. [Google Scholar] [CrossRef] [PubMed]
- Zhou, F.; Lu, D.Q. Simultaneous determination of arbutin and hydroquinone in whitening cosmetics by reversed-phase high performance liquid chromatography. J. Nantong Vocat. Univ. 2008, 22, 97–99. [Google Scholar]
- Zhang, F.L.; Wu, J.; Wu, G.L.; Xing, S. Whitening effect of α-arbutin and deoxyarbutin and safety evaluation: A review of recent studies. J. Environ. Health 2018, 35, 370–375. [Google Scholar]
- Wang, Y.C. Identification and Application of the Amylosucrase from Cellulomonas carboniz T26. Master’s Thesis, Jiangnan University, Wuxi, China, 2018. [Google Scholar]
- Agarwal, N.; Rai, A.K.; Singh, S.P. Biotransformation of hydroquinone into α-arbutin by transglucosylation activity of a metagenomic amylosucrase. 3 Biotechnol. 2021, 11, 362. [Google Scholar] [CrossRef]
- Li, J.; Li, Z.; Gong, H.; Ma, M.; Li, S.; Yang, H.; Zhang, H.; Liu, J. Identification and characterization of a novel high-activity amylosucrase from Salinispirillum sp. LH10-3-1. Appl. Microbiol. Biotechnol. 2023, 107, 1725–1736. [Google Scholar] [CrossRef]
- McArthur, J.B.; Chen, X. Glycosyltransferase engineering for carbohydrate synthesis. Biochem. Soc. Trans. 2016, 44, 129–142. [Google Scholar] [CrossRef] [PubMed]
- Wei, Y. Study on Enhancement of α-Arbutin Production by Xanthomonas maltophilia BT-112. Master’s Thesis, Beijing University of Chemical Technology, Beijing, China, 2008. [Google Scholar]
- Wang, Y.; Xu, W.; Bai, Y.; Zhang, T.; Jiang, B.; Mu, W. Identification of an alpha-(1,4)-glucan-synthesizing amylosucrase from Cellulomonas carboniz T26. J. Agric. Food Chem. 2017, 65, 2110–2119. [Google Scholar] [CrossRef]
- Shen, Y. Study of Cloning and Expression of Sucrose Phosphorylase and Biotransformation of α-Arbutin. Master’s Thesis, Jiangnan University, Wuxi, China, 2020. [Google Scholar]
- Sarçabal, P.; Remaud-Simeon, M.; Willemot, R.-M.; Potocki de Montalk, G.; Svensson, B.; Monsan, P. Identification of key amino acid residues in Neisseria polysaccharea amylosucrase. FEBS Lett. 2000, 474, 33–37. [Google Scholar] [CrossRef]
- Rong, Y.; Jensen, S.I.; Lindorff-Larsen, K.; Nielsen, A.T. Folding of heterologous proteins in bacterial cell factories: Cellular mechanisms and engineering strategies. Biotechnol. Adv. 2023, 63, 108079. [Google Scholar] [CrossRef]
- Ravitchandirane, G.; Bandhu, S.; Chaudhuri, T.K. Multimodal approaches for the improvement of the cellular folding of a recombinant iron regulatory protein in E. coli. Microb. Cell Factories 2022, 21, 20. [Google Scholar] [CrossRef]
- Kiefhaber, T.; Rudolph, R.; Kohler, H.H.; Buchner, J. Protein aggregation in vitro and in vivo: A quantitative model of the kinetic competition between folding and aggregation. Bio Technol. 1991, 9, 825–829. [Google Scholar] [CrossRef] [PubMed]
- Chou, C.P. Engineering cell physiology to enhance recombinant protein production in Escherichia coli. Appl. Microbiol. Biotechnol. 2007, 76, 521–532. [Google Scholar] [CrossRef]
- Sahdev, S.; Khattar, S.K.; Saini, K.S. Production of active eukaryotic proteins through bacterial expression systems: A review of the existing biotechnology strategies. Mol. Cell. Biochem. 2008, 307, 249–264. [Google Scholar] [CrossRef] [PubMed]
- Miao, Z.Y.; Du, L.; Wang, J.Q.; Chen, Z.; Huang, J.; Chen, Q.; Zou, P.; Han, X.; Zhang, C. Soluble expression strategies for production of recombinant proteins in Escherichia coli. Chin. Biotechnol. 2023, 43, 33–45. [Google Scholar]
- Ha, S.J.; Seo, D.H.; Jung, J.H.; Cha, J.; Kim, T.-J.; Kim, Y.-W.; Park, C.-S. Molecular cloning and functional expression of a new amylosucrase from Alteromonas macleodii. Biosci. Biotechnol. Biochem. 2009, 73, 1505–1512. [Google Scholar] [CrossRef] [PubMed]
- Zhang, L. Site-Directed Mutagenesis and Characterization of Enzymatic Properties of Amylosucrase. Master’s Thesis, Jilin Agricultural University, Changchun, China, 2015. [Google Scholar]
- Guérin, F.; Barbe, S.; Pizzut-Serin, S.; Potocki-Véronèse, G.; Guieysse, D.; Guillet, V.; Monsan, P.; Mourey, L.; Remaud-Siméon, M.; André, I.; et al. Structural investigation of the thermostability and product specificity of amylosucrase from the bacterium Deinococcus geothermalis. J. Biol. Chem. 2012, 287, 6642–6654. [Google Scholar] [CrossRef]
- Emond, S.; Mondeil, S.; Jaziri, K.; André, I.; Monsan, P.; Remaud-Siméon, M.; Potocki-Véronèse, G. Cloning, purification and characterization of a thermostable amylosucrase from Deinococcus geothermalis. FEMS Microbiol. Lett. 2008, 285, 25–32. [Google Scholar] [CrossRef]
- Pizzut-Serin, S.; Potocki-Véronèse, G.; van der Veen, B.A.; Albenne, C.; Monsan, P.; Remaud-Simeon, M. Characterisation of a novel amylosucrase from Deinococcus radiodurans. FEBS Lett. 2005, 579, 1405–1410. [Google Scholar] [CrossRef] [PubMed]
- Skov, L.K.; Pizzut-Serin, S.; Remaud-Simeon, M.; Ernst, H.A.; Gajhede, M.; Mirza, O. The structure of amylosucrase from Deinococcus radiodurans has an unusual open active-site topology. Acta Crystallogr. Sect. F Struct. Biol. Cryst. Commun. 2013, 69, 973–978. [Google Scholar] [CrossRef] [PubMed]
- Kim, M.D.; Seo, D.H.; Jung, J.H.; Jung, D.-H.; Joe, M.-H.; Lim, S.; Lee, J.-H.; Park, C.-S. Molecular cloning and expression of amylosucrase from highly radiation-resistant Deinococcus radiopugnans. Food Sci. Biotechnol. 2014, 23, 2007–2012. [Google Scholar] [CrossRef]
- But, S.Y.; Khmelenina, V.N.; Reshetnikov, A.S.; Mustakhimov, I.I.; Kalyuzhnaya, M.G.; Trotsenko, Y.A. Sucrose metabolism in halotolerant methanotroph Methylomicrobium alcaliphilum 20Z. Arch. Microbiol. 2015, 197, 471–480. [Google Scholar] [CrossRef]
- Jeong, J.W.; Seo, D.H.; Jung, J.H.; Park, J.H.; Baek, N.I.; Kim, M.J.; Park, C.S. Biosynthesis of glucosyl glycerol, a compatible solute, using intermolecular transglycosylation activity of amylosucrase from Methylobacillus flagellatus KT. Appl. Biochem. Biotechnol. 2014, 173, 904–917. [Google Scholar] [CrossRef] [PubMed]
- Skov, L.K.; Mirza, O.; Henriksen, A.; De Montalk, G.P.; Remaud-Simeon, M.; Sarcabal, P.; Willemot, R.-M.; Monsan, P.; Gajhede, M. Crystallization and preliminary X-ray studies of recombinant amylosucrase from Neisseria polysaccharea. Acta Crystallogr. Sect. D Biol. Crystallogr. 2000, 56, 203–205. [Google Scholar] [CrossRef]
- De Montalk, G.P.; Remaud-Simeon, M.; Willemot, R.M.; Planchot, V.; Monsan, P. Sequence analysis of the gene encoding amylosucrase from Neisseria polysaccharea and characterization of the recombinant enzyme. J. Bacteriol. 1999, 181, 375–381. [Google Scholar] [CrossRef]
- Park, M.O.; Chandrasekaran, M.; Yoo, S.H. Expression, purification, and characterization of a novel amylosucrase from Neisseria subflava. Int. J. Biol. Macromol. 2018, 109, 160–166. [Google Scholar] [CrossRef]
- Perez-Cenci, M.; Salerno, G.L. Functional characterization of Synechococcus amylosucrase and fructokinase encoding genes discovers two novel actors on the stage of cyanobacterial sucrose metabolism. Plant Sci. 2014, 224, 95–102. [Google Scholar] [CrossRef] [PubMed]
- Seo, D.H.; Jung, J.H.; Ha, S.J.; Cho, H.K.; Jung, D.H.; Kim, T.J.; Baek, N.I.; Yoo, S.H.; Park, C.S. High-yield enzymatic bioconversion of hydroquinone to α-arbutin, a powerful skin lightening agent, by amylosucrase. Appl. Microbiol. Biotechnol. 2012, 94, 1189–1197. [Google Scholar] [CrossRef]
- Yu, S.; Wang, Y.; Tian, Y.; Xu, W.; Bai, Y.; Zhang, T.; Mu, W. Highly efficient biosynthesis of α-arbutin from hydroquinone by an amylosucrase from Cellulomonas carboniz. Process Biochem. 2018, 68, 93–99. [Google Scholar] [CrossRef]
- Zhu, L.; Xu, M.; Lu, C.; Chen, L.; Xu, A.; Fang, J.; Chen, H.; Lu, Y.; Fan, Y.; Chen, X. Optimization of whole-cell biotransformation for scale-up production of α-arbutin from hydroquinone by the use of recombinant Escherichia coli. AMB Express 2019, 9, 1–9. [Google Scholar] [CrossRef] [PubMed]
- Bradford, M. A rapid and sensitive method for the quantitation of microgram quantities of protein utilizing the principle of protein-dye binding. Anal. Biochem. 1976, 72, 248–254. [Google Scholar] [CrossRef] [PubMed]
- Huang, L.J. Simultaneous determination of three reducing sugar components in honey by HPLC. Shandong Chem. Ind. 2023, 52, 143–147. [Google Scholar]
- Zhao, F. Determination of fructose, glucose, sucrose, maltose and lactose in honey by HPLC-RID. China Food Saf. Mag. 2021, 33, 92–94. [Google Scholar]
- Liang, Z.A.; Wang, C.L.; Long, F. Determination of total sugar and reducing sugar in wine by liquid chromatography refractive index detection method. J. Food Saf. Qual. 2018, 9, 2188–2194. [Google Scholar]


| ASase | GenBank | Source Strain | Homology of Amino Acid Sequences (%) | Protein Concentration (mg/mL) | Enzyme Activity (U/mL) | Specific Enzyme Activity (U/mL) | Molar Yield of α-Arbutin (%) | Molar Conversion Rate of Hydroquinone (%) |
|---|---|---|---|---|---|---|---|---|
| XoAs | QBG87180 | Xanthomonas oryzae | 78.74 | 7.75 | 21.20 | 2.73 | 11.12 | 51.26 |
| SaAs | PZQ29656 | Stenotrophomonas acidaminiphila | 65.61 | 1.07 | 4.78 | 4.47 | 6.01 | 50.04 |
| DrAs | SEJ28255 | Deinococcus reticulitermitis | 44.59 | 2.56 | 2.57 | 1.00 | - | - |
| CtAs | RIH84646 | Calidithermus terrae | 42.22 | 19.22 | 18.29 | 0.95 | 33.79 | 88.12 |
| CaAs | GEO32564 | Cellulomonas aerilata | 41.80 | 1.04 | 1.32 | 1.27 | - | - |
| OaAs | KPL73089 | Ornatilinea apprima | 36.39 | 1.80 | 1.32 | 0.73 | - | - |
| Metal Ions and Reagents | Relative Enzyme Activity (%) | |||
|---|---|---|---|---|
| 0.2 mmol/L | 1 mmol/L | 5 mmol/L | 10 mmol/L | |
| Control | 100.00 | 100.00 | 100.00 | 100.00 |
| Na+ | 143.66 ± 2.55 | 130.99 ± 2.30 | 132.70 ± 2.56 | 128.81 ± 2.69 |
| K+ | 132.36 ± 3.12 | 145.64 ± 1.87 | 148.98 ± 0.26 | 142.44 ± 2.64 |
| Mg2+ | 138.49 ± 1.44 | 138.69 ± 1.78 | 123.37 ± 3.21 | 118.26 ± 1.32 |
| Ca2+ | 95.57 ± 1.36 | 66.01 ± 1.12 | 59.54 ± 0.54 | 49.32 ± 1.13 |
| Zn2+ | 62.74 ± 0.82 | 58.92 ± 1.49 | 47.96 ± 0.78 | 46.66 ± 0.56 |
| Ba2+ | 78.75 ± 2.61 | 65.80 ± 1.19 | 55.45 ± 1.01 | 60.35 ± 1.78 |
| Mn2+ | 122.28 ± 2.48 | 131.34 ± 4.10 | 57.29 ± 1.60 | 65.46 ± 1.60 |
| Ni2+ | 64.44 ± 1.28 | 56.61 ± 1.13 | 54.70 ± 0.51 | 56.47 ± 1.46 |
| Cu2+ | 130.99 ± 0.31 | 159.60 ± 4.86 | 56.06 ± 1.79 | 69.89 ± 2.10 |
| Fe2+ | 147.28 ± 1.91 | 147.48 ± 2.97 | 104.36 ± 1.28 | 35.76 ± 1.30 |
| EDTA | 150.26 ± 0.34 | 133.88 ± 0.76 | 119.86 ± 0.22 | 107.01 ± 0.62 |
| SDS | 135.52 ± 1.01 | 154.65 ± 0.56 | 48.62 ± 0.95 | 98.36 ± 4.94 |
| Organic Solvents | Relative Enzyme Activity (%) | |||
|---|---|---|---|---|
| 1% | 5% | 10% | 20% | |
| Control | 100.00 | 100.00 | 100.00 | 100.00 |
| Methanol | 129.42 ± 0.98 | 108.98 ± 1.33 | 119.79 ± 0.84 | 107.34 ± 0.41 |
| Ethanol | 121.30 ± 0.75 | 114.42 ± 0.93 | 113.50 ± 0.67 | 90.50 ± 1.06 |
| n-Butanol | 129.69 ± 0.43 | 111.01 ± 1.11 | 63.43 ± 1.27 | 66.06 ± 0.43 |
| Acetonitrile | 111.07 ± 1.75 | 97.05 ± 1.09 | 90.43 ± 0.28 | 52.88 ± 1.02 |
| Dimethyl sulfoxide | 101.44 ± 0.41 | 103.54 ± 0.60 | 101.18 ± 0.34 | 91.35 ± 0.88 |
| Source Strain | Optimal Temperature (°C) | Optimal pH | Percentage (%) | References | ||
|---|---|---|---|---|---|---|
| Polymerization Reaction | Isomerization Reaction | Hydrolysis Reaction | ||||
| Calidithermus terrae | 42 | 9.5 | 32.3 | 44.9 | 22.8 | This study |
| Neisseria polysaccharea | 35 | 7.0 | NR | NR | NR | [29] |
| Arthrobacter chlorophenolicus | NR | 8.0 | 78.4 | 19.7 | 1.9 | [3] |
| Alteromonas macleodii | 45.0 | 8.0 | NR | NR | NR | [3] |
| Cellulomonas carboniz T26 | 40.0 | 7.0 | 84.0 | 10.2 | 5.8 | [20] |
| Deinococcus geothermalis | 45.0 | 8.0 | 71.0 | 22.0 | 7.0 | [30,31] |
| Deinococcus radiodurans | 50.0 | 8.0 | 56.9 | 33.5 | 9.6 | [32,33] |
| Deinococcus radiopugnans | 40–45 | 8.0 | 82.7 | 11.5 | 5.8 | [34] |
| Methylotuvimicrobium alcaliphilum | 30.0 | 8.0 | NR | NR | NR | [35] |
| Methylobacillus flagellatus | 45.0 | 8.5 | 75.5 | 15.0 | 9.5 | [36] |
| Neisseria polysaccharea | 37.0 | 8.0 | 80.1 | 14.5 | 5.4 | [37,38] |
| Neisseria subflava | 45.0 | 8.0 | NR | NR | NR | [39] |
| Synechococcus sp. | 30.0 | 6.5–7.0 | NR | NR | NR | [40] |
| Primer | Sequence |
|---|---|
| XoAS-F | 5′ CGCCA TATGAGCACCTCCCCGATCGAT 3′ |
| XoAS-R | 5′ CCGC TCGAGGGCACCGCGCTGCAACCA 3′ |
| SaAS-F | 5′ CGCCA TATGAATCCTGCGATCGAGACG 3′ |
| SaAS-R | 5′ CCGC TCGAGCTGAGCGGACTTGCCCCG 3′ |
| DrAS-F | 5′ CGCCA TATGCTGTGGCCTGTGTTG 3′ |
| DrAS-R | 5′ CCGG AATTCTTAATGGTGATGGTGATGATG GTCATCCCGGCTCACCAGCC 3′ |
| CtAS-F | 5′ CGCCA TATGTTCTCCACCCCGCTC 3′ |
| CtAS-R | 5′ CCGG AATTCTTAATGGTGATGGTGATGATG CACCTCATCCGTGATCCACA 3′ |
| CaAS-F | 5′ CGCCA TATGAGCGGCGCCTTCCCC 3′ |
| CaAS-R | 5′ CCGG AATTCTTAATGGTGATGGTGATGATG TCCGGGCTCCGGCGTGACCC 3′ |
| OaAS-F | 5′ CGCCA TATGGAAAAAGCCATCCATTAC 3′ |
| OaAS-R | 5′ CCGC TCGAGGGCGCGAAGAATCAGGAA 3′ |
Disclaimer/Publisher’s Note: The statements, opinions and data contained in all publications are solely those of the individual author(s) and contributor(s) and not of MDPI and/or the editor(s). MDPI and/or the editor(s) disclaim responsibility for any injury to people or property resulting from any ideas, methods, instructions or products referred to in the content. |
© 2024 by the authors. Licensee MDPI, Basel, Switzerland. This article is an open access article distributed under the terms and conditions of the Creative Commons Attribution (CC BY) license (https://creativecommons.org/licenses/by/4.0/).
Share and Cite
Li, A.; He, Y.; Chen, W.; Tao, H.; Wu, H.; Li, S. Mining and Characterization of Amylosucrase from Calidithermus terrae for Synthesis of α-Arbutin Using Sucrose. Int. J. Mol. Sci. 2024, 25, 13359. https://doi.org/10.3390/ijms252413359
Li A, He Y, Chen W, Tao H, Wu H, Li S. Mining and Characterization of Amylosucrase from Calidithermus terrae for Synthesis of α-Arbutin Using Sucrose. International Journal of Molecular Sciences. 2024; 25(24):13359. https://doi.org/10.3390/ijms252413359
Chicago/Turabian StyleLi, Anqi, Yamei He, Wenxuan Chen, Huimei Tao, Huawei Wu, and Shaobin Li. 2024. "Mining and Characterization of Amylosucrase from Calidithermus terrae for Synthesis of α-Arbutin Using Sucrose" International Journal of Molecular Sciences 25, no. 24: 13359. https://doi.org/10.3390/ijms252413359
APA StyleLi, A., He, Y., Chen, W., Tao, H., Wu, H., & Li, S. (2024). Mining and Characterization of Amylosucrase from Calidithermus terrae for Synthesis of α-Arbutin Using Sucrose. International Journal of Molecular Sciences, 25(24), 13359. https://doi.org/10.3390/ijms252413359